 Damiano Buratto
 Abhishek Saxena
 Qun Ji
 Guang Yang1
 Sergio Pantano
 Francesco Zonta
- 1Shanghai Institute for Advanced Immunochemical Studies, ShanghaiTech University, Shanghai, China
- 2Institut Pasteur de Montevideo, Montevideo, Uruguay
SARS-CoV-2 infects humans and causes Coronavirus disease 2019 (COVID-19). The S1 domain of the spike glycoprotein of SARS-CoV-2 binds to human angiotensin-converting enzyme 2 (hACE2) via its receptor-binding domain, while the S2 domain facilitates fusion between the virus and the host cell membrane for entry. The spike glycoprotein of circulating SARS-CoV-2 genomes is a mutation hotspot. Some mutations may affect the binding affinity for hACE2, while others may modulate S-glycoprotein expression, or they could result in a virus that can escape from antibodies generated by infection with the original variant or by vaccination. Since a large number of variants are emerging, it is of vital importance to be able to rapidly assess their characteristics: while changes of binding affinity alone do not always cause direct advantages for the virus, they still can provide important insights on where the evolutionary pressure is directed. Here, we propose a simple and cost-effective computational protocol based on Molecular Dynamics simulations to rapidly screen the ability of mutated spike protein to bind to the hACE2 receptor and selected neutralizing biomolecules. Our results show that it is possible to achieve rapid and reliable predictions of binding affinities. A similar approach can be used to perform preliminary screenings of the potential effects of S-RBD mutations, helping to prioritize the more time-consuming and expensive experimental work.
Introduction
Severe acute respiratory syndrome coronavirus-2 (SARS-CoV-2) causes pneumonia/severe respiratory infection in humans called Coronavirus disease 2019 (COVID-19). The first cases of COVID-19 were reported in December 2019 from Wuhan, China (1). At the moment of writing this manuscript, SARS-CoV-2 infection is reported in ~180 million people resulting in ~5 million deaths (2). SARS-CoV-2 is an enveloped virus belonging to a diverse subgenus sarbecovirus within the Betacoronaviruses, a lineage of viruses that use bats as reservoirs and can be transmitted into other mammals (3–8). SARS-CoV-2 is genetically distinct from severe acute respiratory syndrome coronavirus (SARS-CoV) and Middle East respiratory syndrome coronavirus (MERS-CoV). Its closest known relative is Bat CoV RaTG13 (4–6), with 96.3% of gene identity. The single-stranded RNA genome of SARS-CoV-2 encodes Spike (S), Envelope (E), Membrane (M), and Nucleocapsid (N) structural proteins (5). The Spike (S) glycoprotein comprising S1 and S2 subdomains interacts with human angiotensin-converting enzyme 2 (hACE2) present primarily on pneumocytes/lung immune cells for attachment (via S1 c-terminal receptor-binding domain S-RBD), fusion, and virus entry into the host cell (via S2) (9–12). S-RBD also has a role in cross-species transmission and evolution of SARS-CoV-2 (8, 12–15). It is also the major immune determinant of a human neutralizing immune response upon natural infection and vaccination (16–19). Although S-RBD plays a critical role in viral infectivity and transmission, it is highly variable among sarbecoviruses and possibly a hotspot of complex selective pressure which shapes SARS-CoV-2 evolution (8, 20–22). Recombination events in the genome contribute to CoVs evolution, and recombination breakpoints are evident in the SARS-CoV-2 genome at the beginning and end of the S-RBD (6, 9, 23). Mutations within the S-RBD can increase affinity for ACE2, transmissibility, and mediate immune escape (8, 24–28).
Computer simulations have been widely used to provide important insight into the role of mutations within the S-RBD. Molecular dynamics (MD) simulations-based analyses show some of the earliest known S-RBD mutations (F342L, N352D/D364Y, V367F, W436R, and V483A) can increase binding affinities and favor hACE2 interaction (29–31). Another study on the B.1.135 (K417N/E484K/N501Y) variant suggests that while N501Y alone could improve the binding affinity, the other two mutations reduced it, possibly causing a non-net change in binding properties (26). In agreement with this hypothesis, experimental mutational scanning suggest that N501Y/N501T slightly increase hACE2 binding while K417N/K417T enhance S-RBD expression, and E484K did not cause any significant phenotypic change (8).
In this paper, we report a computational protocol to rapidly assess the binding affinity of the S-RBD to the hACE2 receptor. We applied our method on some early reported mutations (G476S, V483A, H519Q, and H520), the triple mutant B.1.135 K417N/E484K/N501Y, first isolated in South Africa – beta variant, and triple mutant P.1 K417T/E484K/N501Y, first isolated in Brazil – gamma variant, investigating their effect at the molecular level. Our results suggest that none of the mutations causes an essential increase of the KD/IC50 properties of the Spike protein. Still, we observe a significant, albeit small, decrease of binding affinity for the two triple mutants. However, we observe a more marked reduction of the binding of spike protein to an artificial neutralizing nanobody caused by E484K, a mutation found in several variants of concern and which has been reported to produce a virus able to escape neutralizing antibodies (32–35).
Material and Methods
Molecular Modeling and Dynamics
The model of the reference type (RT) variant Covid-19 RBD in complex with hACE2 receptor was derived by the X-RAY crystal structure PDBID 6LZG (36). All the mutants of the Covid-19 S-RBD were created starting from this model using CHIMERA (37). Each model was solvated with TIP3P water, containing Cl- and K+ ions at a concentration of ∼0.15 M to mimic the physiological ionic strength. After solvation, the total number of atoms for each system was around 1.7 × 10⁵.
MD simulations were carried on using the Gromacs 2018 package (38) and the Amber14SB force field (39), following simulation protocols similar to those we used in our previous works (40–43). Specifically, after energy minimization, we performed 200 ps of Simulated Annealing to allow side chains to equilibrate after each mutation is introduced. We then performed two short simulations lasting 100 ps, first in the NVT and then in the NPT ensembles, both with positional restraints (being the position restraint constant ) on the heavy atoms of the protein. Finally, we performed equilibrium MD simulation under periodic boundary conditions at constant pressure for 50 ns. Analyses were performed only on the last 25 ns after equilibration, as explained in the Results section. Temperature T and pressure P were kept constant during the equilibrium MD simulation, at 300 K and 1 atm, respectively, using the Berendsen thermostat and barostat (44). Fast smooth Particle–Mesh Ewald summation (45) was used for long-range electrostatic interactions, with a cut-off of 1.0 nm for the direct interactions. Each simulation was performed in five identical replicas: while classical MD simulations are in principle deterministic, parallel computing algorithms currently implemented in MD software can produce different trajectories. Nevertheless, experimental structures represent a thermodynamic average. Hence, replicating the simulations allows to check the results consistency and reduce the risk of being trapped by entropic barriers, thus improving the sampling of the configuration space available.
Binding Free Energy Computations
To produce fast and reliable predictions of the binding free energy, we use the PRODIGY web server (46, 47), which has been designed for this purpose. The results are then compared with those obtained with MM-PBSA (an acronym for Molecular Mechanics – Poisson Boltzmann and Surface Area continuum solvation approximation method), a more standard methodology, widely used in the field (48, 49). Binding free energies are calculated as ensemble averages over the configuration space explored by the five different replicas. To speed up the calculation, while maintaining a meaningful set of configurations for the energy calculations, we clustered the configuration space sampled by the various MD trajectories after equilibration (i.e., the last 25 ns each of the five replicas) according to their root mean square deviation (RMSD), and calculate the binding energy using one representative for 60 bigger clusters, being the clustering distance 1.2 Å. The final result is then obtained as the average of the free energy computed for each of these configurations. The results obtained by the two methods show correlation (R=0.82, Supplementary Figure 1). However, the PRODIGY webserver is considerably faster than the MM-PBSA calculations (~50 times faster than our local MD-dedicated GPU cluster - this figure can be much higher if parallel computational resources are not available). Furthermore, it requires a much easier set-up so that the calculation can be performed by less experienced investigators.
From the binding free energy difference, it is possible to estimate the change in binding affinity using thermodynamics theory, according to the expression (50): . The results computed with the PRODIGY webserver show correlation with experimental data (Supplementary Figure 2).
Recombinant Production of SARS-CoV-2 S-RBD Mutants and hACE2
Reference SARS-CoV-2 S-RBD (nt 22,517 – 23,185; MN908947) and hACE2-ECD (aa19 – aa617; Uniprot Q9BYF1) coding gene fragments were obtained by chemical synthesis. S-RBD reference gene with C-terminus hexahistidine tag was cloned in 5’NotI/3’BamHI restriction sites of pSCSTa plasmid under the control of CMV promoter and used to generate mutant constructs (G476S, V483A, H519Q, and A520S) by oligonucleotide-mediated PCR mutagenesis. All S-RBD proteins were transiently produced in FreeStyle 293f cells (Invitrogen). Culture supernatant containing protein was bound to Ni-NTA resin (Yeason Biotech), eluted with 500 mM imidazole in 20 mM HEPES/500 mM NaCl, buffer exchanged to 1x PBS and further cleaned by size exclusion chromatography using Superdex 200 10/300 column (GE Healthcare) on AKTA Avant150 FPLC system. The Human ACE2 gene was cloned into unique SfiI restriction sites in pFUSE-mIgG2A-Fc2 plasmid (Invivogen) under the control of a hEF1-HTLV-1 promoter and produced like S-RBD proteins. Culture supernatant containing hACE2-ECD-mFc was bound to Mabselect resin (GE Healthcare), eluted by Pierce IgG elution buffer (Thermo Scientific), and buffer exchanged to 1x PBS. All recombinant proteins were resolved on 4 – 12% gradient SDS-PAGE to ascertain purity and correct size.
Experimental Determination of the Binding Affinities Between S-RBD Variants and ACE2 Receptor
Maxisorp ELISA wells were coated with 200 nM S-RBD reference/mutant protein overnight at 4°C, blocked with 2% (w/v) skimmed milk at room temperature for 1 hour (h). To determine EC50 values, hACE2-ECD dilutions (two-fold; 250 nM – 0.015 nM) were added to the designated wells and incubated at room temperature for 1 h. To determine IC50 values, hACE2-ECD at predetermined EC50 concentration (for respective S-RBD reference/mutant) was mixed with the cognate S-RBD protein (two-fold dilution; 1000 – 0.487 nM) and incubated at room temperature for 1 h before being added to the designated S-RBD reference/mutant coated and blocked wells. The binding was detected with 1:1000 diluted anti-mouse IgG (Fc specific) PO labeled secondary antibody (Cell Signalling Technologies).
The kinetics of S-RBD – hACE2-ECD interaction was analyzed by biolayer interferometry (BLI) using the Octet Red96 system (PALL ForteBio). HIS1K dip and read optical sensors (PALL ForteBio) were used to detect non-specific binding with the highest concentration of hACE2-ECD used in the assay, and passed sensors were subsequently loaded with 1000 nM S-RBD reference/mutant protein to reach a loading threshold of ~0.5 nm. Human ACE2-ECD dilutions (two-fold; 2500 – 312.5 nM) were used as an analyte to measure KD. Reference sensors with no load and reference well with only 1x kinetics buffer were used as controls.
Statistical Analysis
Statistical analysis of ELISA data was done using Prism software version 8.00 (GraphPad). EC50 and IC50 values were determined by nonlinear regression analysis, by fitting log (agonist concentration) vs. response and log (inhibitor concentration) vs. normalized response, respectively.
The IC50binding curves (column means) were analyzed by two-way ANOVA with Dunnett’s multiple comparison tests. The biolayer interferometry (BLI) binding curves were generated and KD were determined by fitting the curves globally and analyzed by the 1:1 model using Pall Forte Bio Octet Data Analysis Software version 10.0. The KD values of three replicates so obtained were compared by two-way ANOVA with Tukey’s multiple comparison tests using Prism software version 8.00 (GraphPad).
Binding free energies were computed from the representative configuration of the 60 more populated cluster. Values on Tables 1, 2 are presented as averages and standard errors of the mean. The errors for the variation of binding affinity were computed with the error propagation formula, p-values were obtained using the Student t-test. Box plots were draw using Python and the Seaborn package.
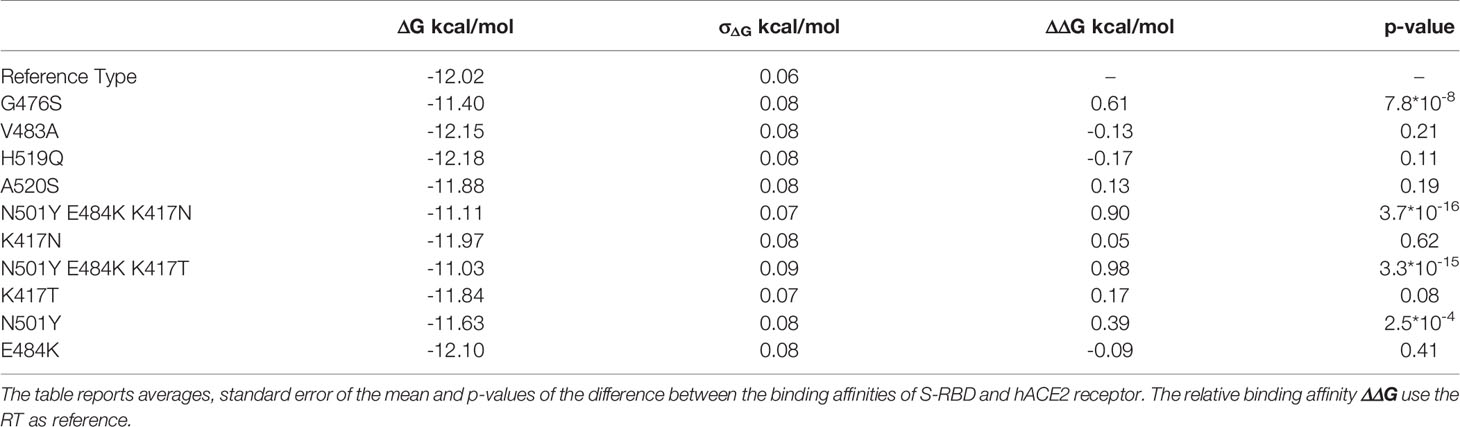
Table 1 Table of computed ΔG and ΔΔG (ΔGvariant – ΔGRT).
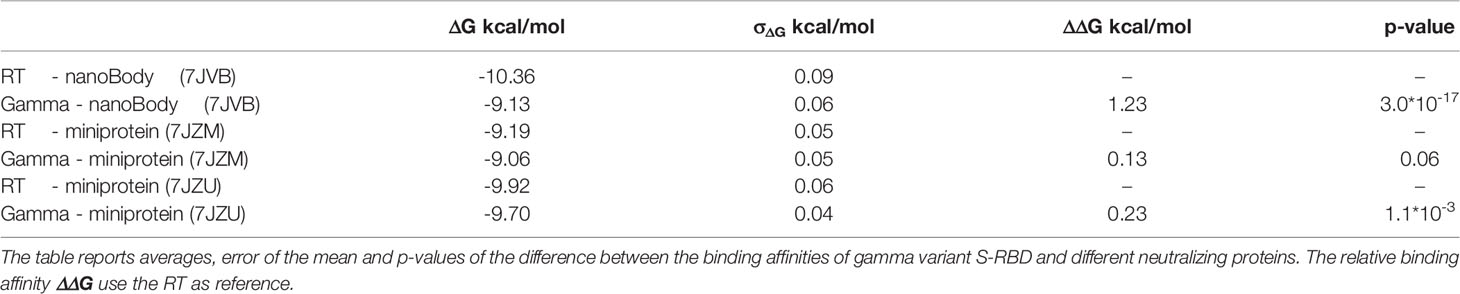
Table 2 Table of computed ΔG and ΔΔG (ΔGgamma variant – ΔGRT) to neutralizing proteins.
Results
Sampling of the Interaction Between the S-RBD and the hACE2 Receptor
A reliable computation of the binding free energy between two proteins should take into account the possibility of their dynamical rearrangement and extensive sampling (50). X-ray structures can be considered as faithful representations of the energy minima, but cannot take into account a very important contribution to their binding affinity, i.e., the temperature effects on the two interacting proteins. Furthermore, when introducing a mutation in a structural model, it is likely that the local structure will not be well equilibrated. For both these reasons, we performed MD simulations of each possible pairs of spike-hACE2 receptor proteins. Each simulation was repeated in five different replicas to further improve the configurational sampling and reducing the probability of being trapped in local minima (see Methods section).
Analysis of the root mean square deviation (RMSD - Supplementary Figure 3) of the various trajectories shows that the S-RBD finds its equilibrium position on average after 25 ns. For this reason, we decided to carry on the following analysis on the second half of each trajectory.
From the dynamic point of view, all the different variants behave similarly. Analysis of the contact maps between the two proteins reveals that in the RT variant, the interaction is mainly mediated by residues Lys417, Tyr449, Leu455, Phe456, Ala475, Phe 486, Asn487, Tyr489, Gln493, Gly496, Gln498, Thr500, Asn501, Gly502 and Tyr505 (interaction probability higher than 90% along the trajectory, see Figure 1, Supplementary Figures 4, 5). No significant difference is observed between the RT and the single point mutations G476S, V483A, H519Q, A520S. It is worth noticing that only the first two mutants are in proximity of the binding region, while the other two are far from it, and we do not expect to see any effect on the binding to the hACE2 receptor caused by them.
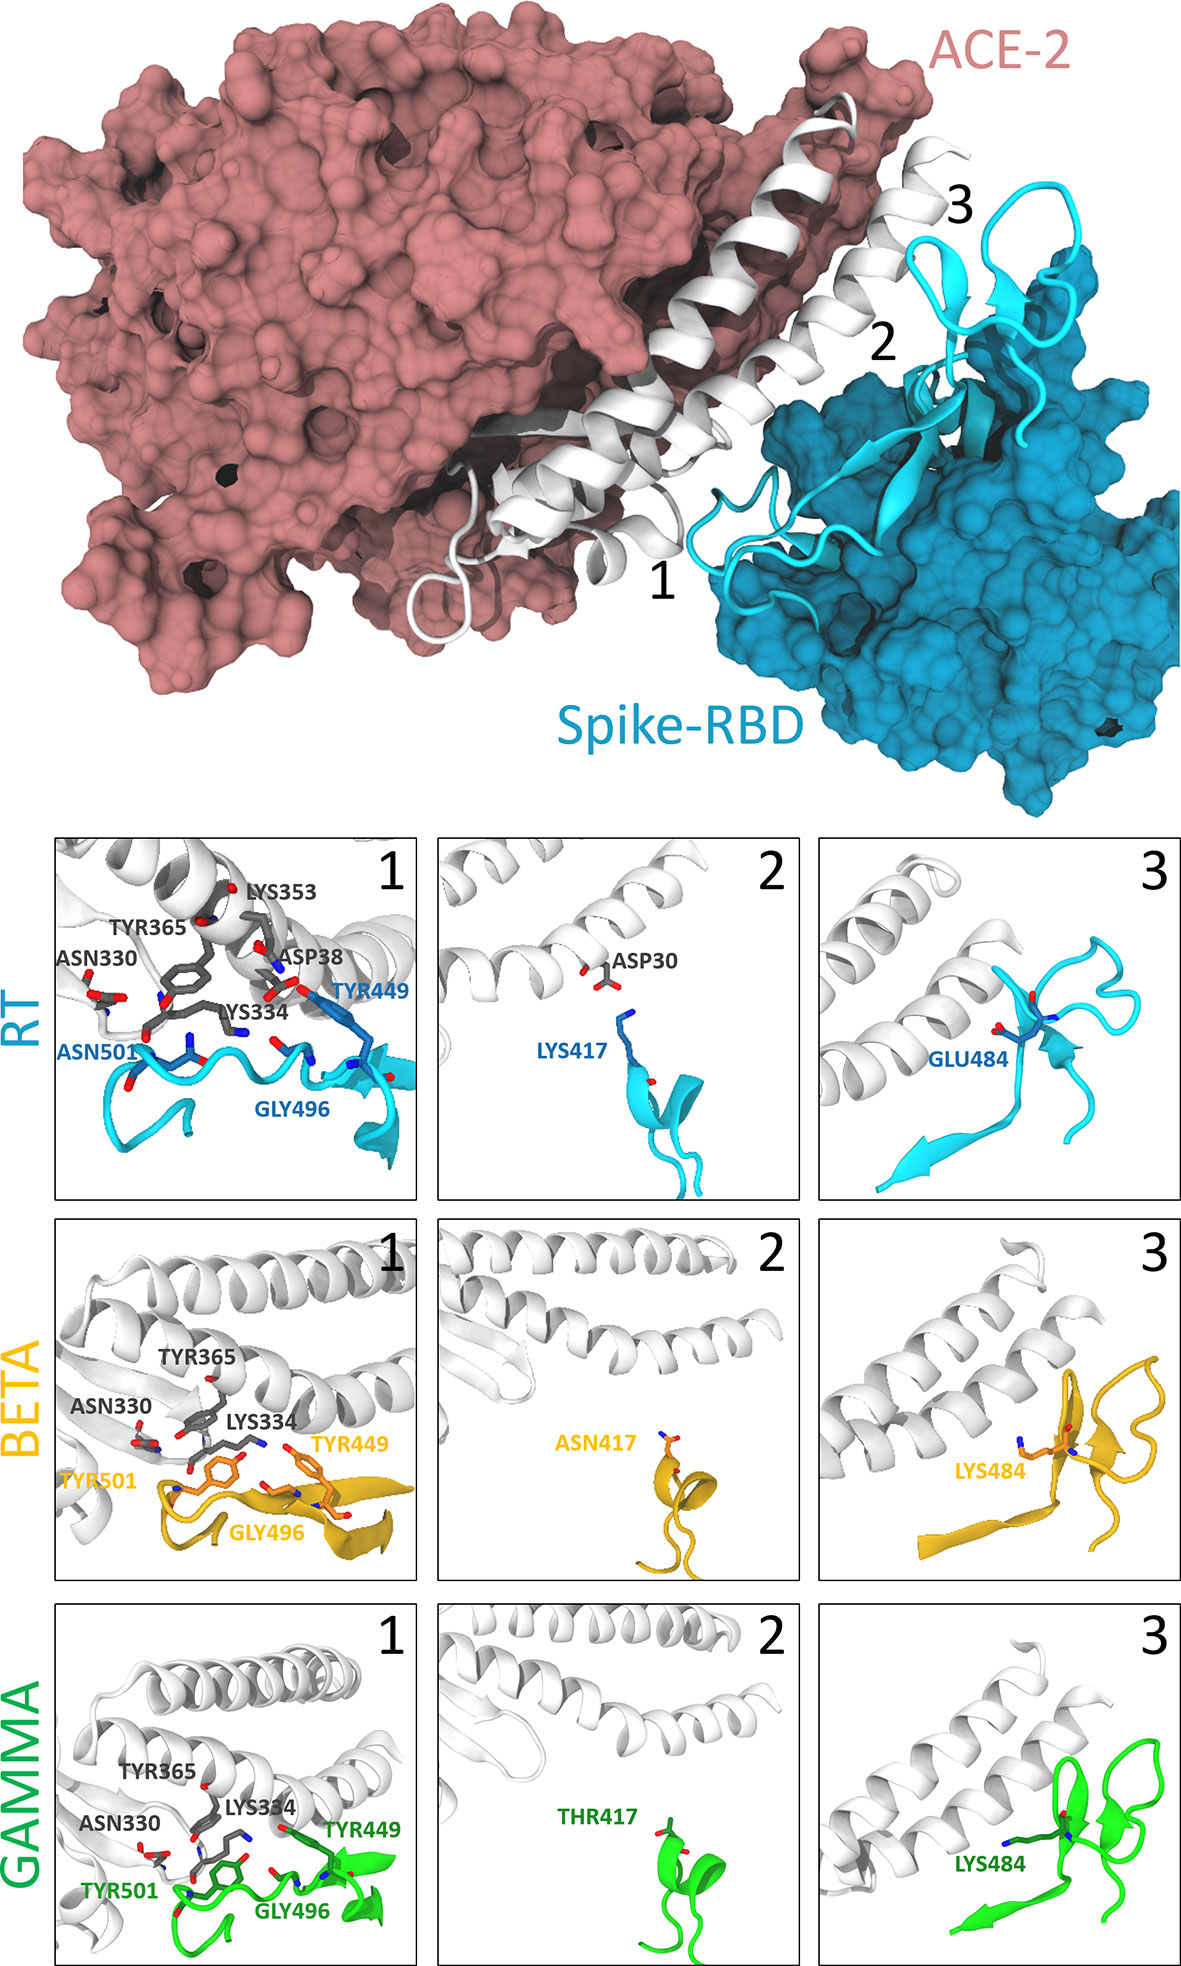
Figure 1 Interactions between the spike protein and the hACE2 receptor. The top panel shows the binding between the S-RBD region of the RT and the hACE2 receptor. The interaction interface is shown in cartoon representation (white for hACE2 and cyan for S-RBD), while the rest of the protein is represented according to its surface (pink for hACE2 and light blue for S-RBD). The bottom panels show the differences between RT (cyan), beta (orange), and gamma (green) variants in correspondence with the position of the three S-RBD mutations (labeled with numbers 1-3 in the top panel). Relevant residues are shown with their side-chain representation in these panels. One can notice how residue Asn501 is at the center of a rich pattern of interactions, which is altered after its mutation to Tyr. On the other hand, Lys417 of the S-RBD interacts only with the Asp30 of the hACE2, and this interaction is broken after its modification to a non-basic amino acid. Finally, Glu484 does not show any critical interactions, and this does not change with the mutants.
When looking at the two triple mutants, we can observe that mutations of Lys417 and Asp501 are slightly more impactful in affecting the interaction between the spike protein and the hACE2 receptor. Lys417 forms a salt bridge with Asp30 of hACE2, which is abolished upon lysine mutation to asparagine or threonine. The change from asparagine to tyrosine in position 501 forces a different arrangement of the spike protein residues Tyr499 and Gly496, affecting their interactions with Asp38, Gln32, and Lys353 of the hACE2 (Figure 1 and Supplementary Figure 5). Since Glu48 does not interact with the hACE2 receptor in the RT, its mutation to lysine does not produce critical differences in the contact map.
In agreement with these observations, root mean square fluctuations (RMSF) show no evident changes in the dynamical behavior of the complex, especially in the contact region (Figure 2).
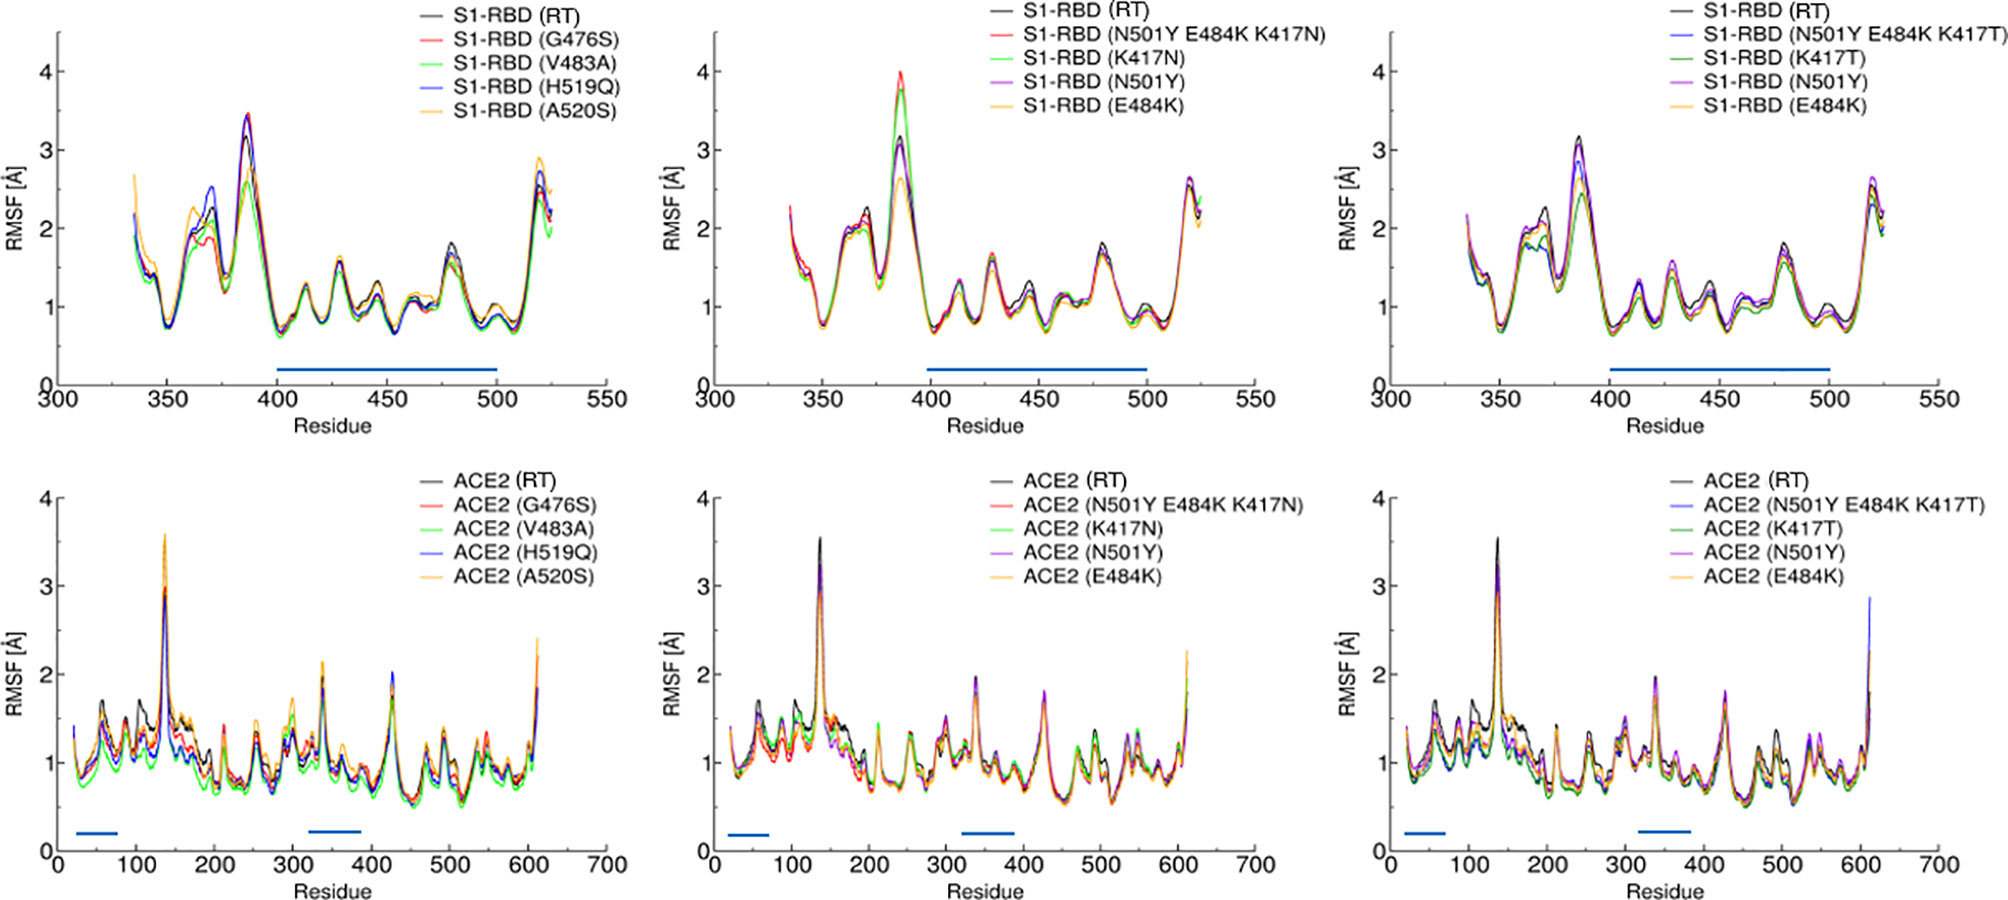
Figure 2 Root Mean Square Fluctuation of the S-RBD variants (top panels) and hACE2 receptor (bottom panels) vs. residue index. The graphs are divided into three different panels for better readability. Amino acids belonging to the contact region are indicated by a blue line parallel to the x-axis. A direct comparison between the various trajectories reveals that the dynamic behavior of the complex S-RBD/hACE2 is not significantly affected by these mutations.
Rapid Evaluation of Binding Free Energy Between the S-RBD and the hACE2 Receptor
In principle, binding free energy estimates can be computed from each of the configurations obtained from MD simulations. However, the computational cost for repeating the calculation on all of them would be extremely high, especially if we use standard methodology like MM-PBSA. Moreover, MD trajectories may be highly correlated on the short time scale. Hence, to ensure we are considering a wide variety of configurations, we clustered them using a 0.12 nm RMSD cutoff, and we computed the binding free energy only for one representative in each of the 60 bigger clusters. The final estimate is obtained as the average of the 60 representative configuration.
To further reduce the time of computation of the binding free energy, we decided to use the PRODIGY web server (46), which produces results comparable with MM-PBSA calculations, being at the same time much less computationally expensive.
Results are reported in Figure 3 and Table 1 (free energy differences with the RT).
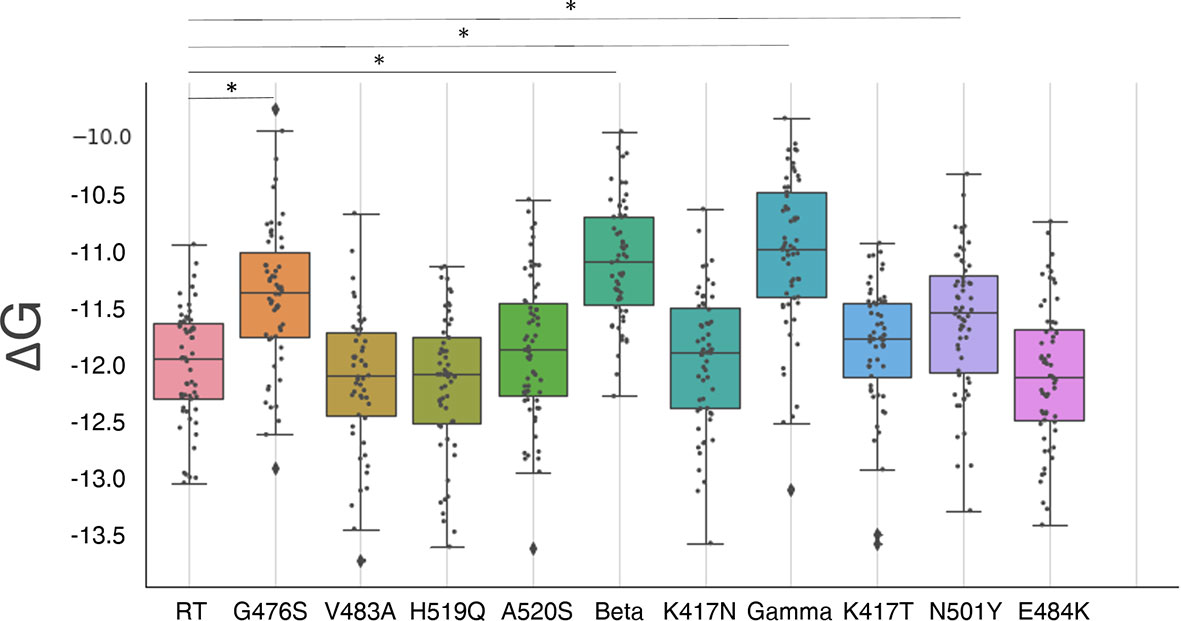
Figure 3 Box plots of the distribution of S-RBD and hACE2 receptor binding free energy. A boxplot is constructed of two parts, a box and a set of whiskers. The box is drawn from the first quartile (Q1, the median of the lower half of the dataset) to the third quartile (Q3, the median of the upper half of the dataset) with a horizontal line drawn in the middle to denote the median. The whiskers are drawn from the upper/lower quartile to the largest/lowest data point excluding any outliers. The outliers are shown with black diamonds. Statistically different distributions are indicated with a (*) symbol. G476 mutant, alpha (N501Y), beta, and gamma variants show a worse binding affinity. However, the differences in absolute value are small.
None of the mutants show a significantly improved binding affinity, while mutants G476S, N501Y (alpha variant), and the two triple mutants (beta and gamma variants) show a significantly decreased binding affinity (P<<0.05) with a binding energy difference of 0.6 ± 0.8 kcal/mol, 0.4 ± 0.8 kcal/mol, 0.9 ± 0.7 kcal/mol, and 1.0 ± 0.8 kcal/mol respectively. These results are compatible with similar studies on the triple mutants (26, 51). All the other mutants show no significant differences (P>0.08). However, in all the cases the changes are small (less than 1kcal/mol), and the binding affinity changes are predicted to be within a 5-fold range.
Mutation E484K Reduces the Binding Affinity of the S Protein to a Potent Neutralizing Nanobody
To test whether spike mutations can result in a virus that is able to escape immune response, we explored the effect of the mutation present in the gamma variant on the binding affinity of the highly specific nanobody Nb20 (PDB ID 7JVB) reported by Xiang et al. (52). We also tested different kinds of neutralizing molecules, i.e., the highly specific miniproteins LCB1/LCB3 (PDB ID 7JZU and 7JZM respectively) designed by Cao et al. (53), using the same method described in the previous section. Our calculations revealed that the affinity of the nanobody to the gamma variant is significantly decreased when compared to the RT, with a difference in the binding energy of 1.2 ± 0.1 kcal/mol, which translates into approximately a 7.5-fold decrease of binding affinity. This may be in agreement with the significant reduction in binding affinity reported for this nanobody against the E484K mutation (54). The interaction of the miniproteins LCB1 and LCB3 with the gamma variant shows a small increase of 0.13 ± 0.06 kcal/mol (P=0.06) and 0.23 ± 0.07 kcal/mol (P<<0.05) in the binding affinity (Figure 4 and Table 2).
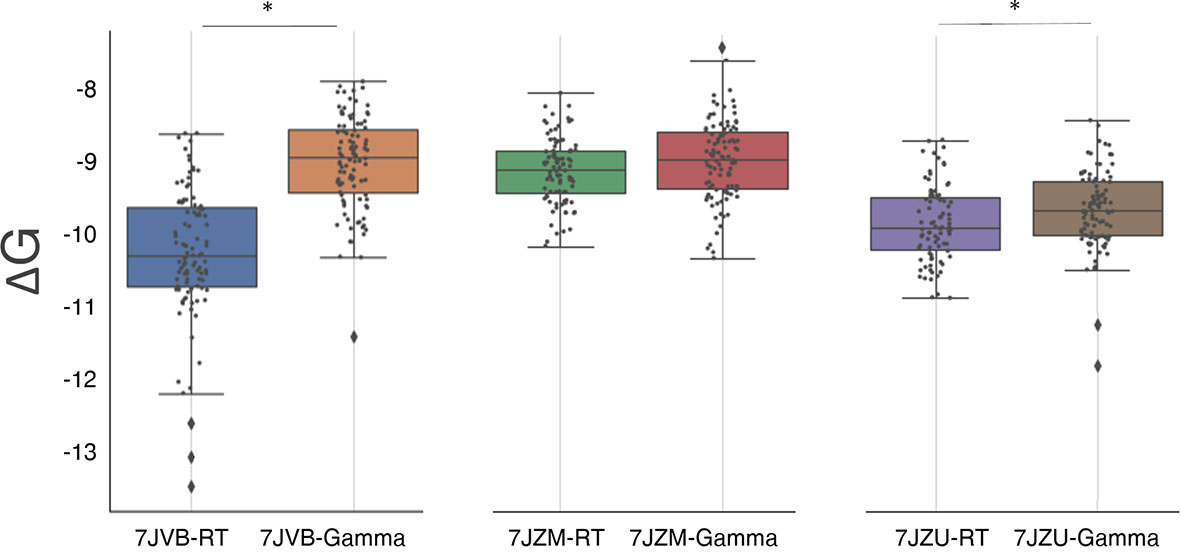
Figure 4 Box plots of the distribution of S-RBD and neutralizing molecules binding free energy (see Figure 3 for the box plot description). The three plots compare the binding free energy of the RT and the gamma variant to three neutralizing molecules (described in the text). Statistically different distributions are indicated with a (*) symbol.
A detailed analysis of the nanobody-S-RBD complex trajectory shows that the change in binding energy is primarily due to mutation E484K. Residue GLU484, indeed, is located inside a positively charged pocket and stably interacts with the side chain of two arginines and a tyrosine (Arg97, Arg31, and Tyr104 – Figure 5). These interactions are clearly disrupted by the mutation E484K that inverts the residue charge, forcing it out of the pocket. On the other hand, there are no notable differences in the interaction of the two miniproteins between the RT and gamma variants.
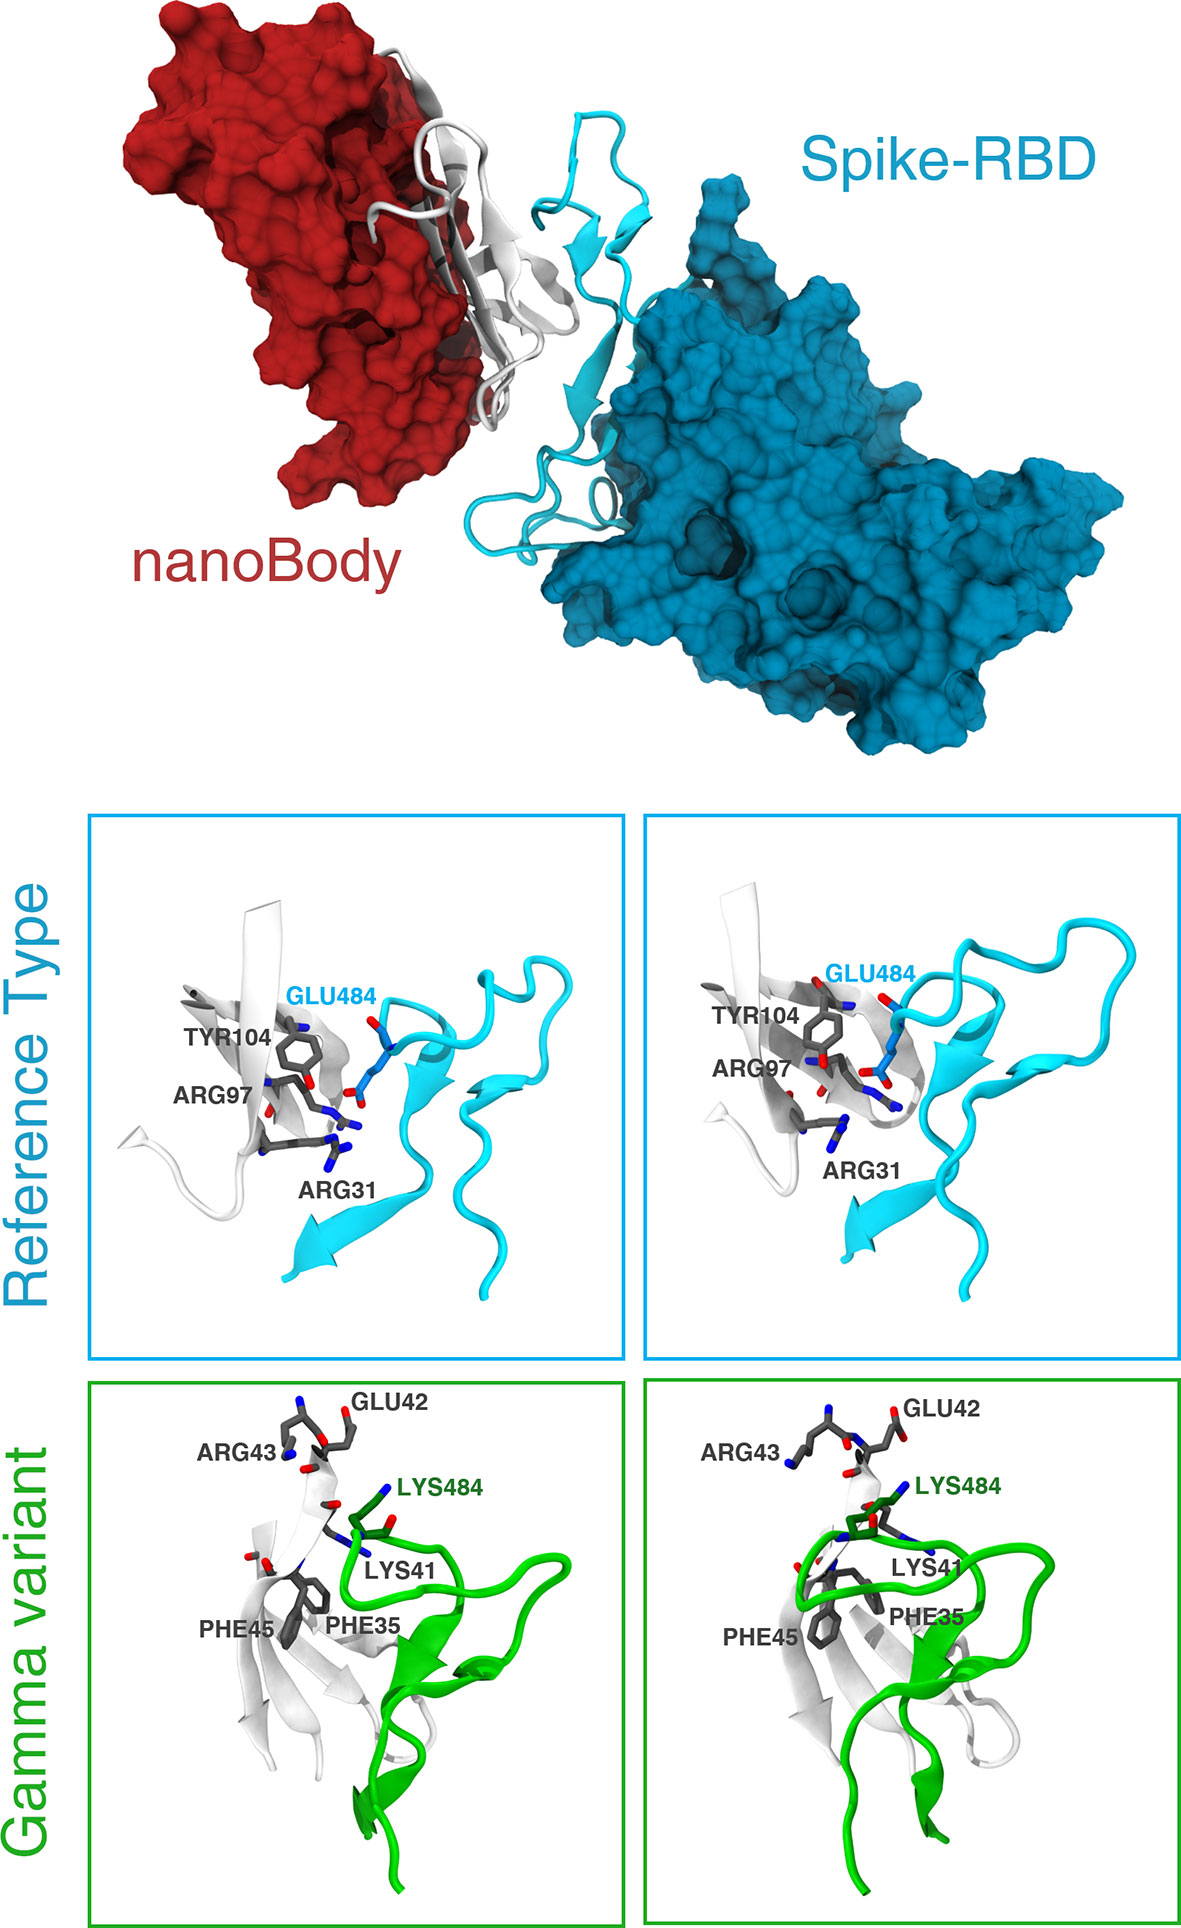
Figure 5 Details of the interaction between the nanobody and the gamma variant. The top panel shows the binding between the S-RBD region of the RT and the neutralizing nanobody Nb20. The interface of interaction is shown in cartoon representation (white for the Nb20 and cyan for S-RBD), while the rest of the protein is represented according to its surface (red for Nb20 and blue for S-RBD). The bottom panels show the differences between RT (cyan) and gamma variant (green) in stereographic representation. The positively charged Arg31 recognizes the negatively charged Glu484 in S-RBD in Nb20. This bond is clearly broken after the E484K mutation.
Experimental Validation of Computational Results on Single Point Variants
To validate the computational predictions, we performed an experimental comparative binding analysis using direct-binding and competitive ELISA experiments to determine EC50/IC50 values for S-RBD – hACE2-ECD interaction. This analysis is limited to single-point variants. To determine EC50 values of hACE-ECD binding to S-RBD reference/mutants, respective titration curves were generated using hACE-ECD dilutions on immobilized S-RBD protein (Figure 6A). Human ACE-ECD had a higher EC50 against S-RBD reference (23.75 nM) in comparison to the mutants (11.48 – 19.86 nM); however, this difference was only 1.19 to 2.06-fold. To determine IC50 of S-RBD – hACE2-ECD interaction, competitive binding reactions were set up by mixing hACE-ECD at a predetermined EC50 with dilutions of respective S-RBD protein. Human ACE-ECD bound to S-RBD mutants with a slightly higher IC50 (slightly lower apparent affinity) than S-RBD reference. We observed a statistically significant difference in the binding affinity of G476S (p=0.002) and A520S (p=0.007) S-RBD mutants compared to the reference (Figure 6B). However, consistent with the trend observed in EC50 values, the fold difference in IC50 for S-RBD reference/mutants was low (1.09 to 1.31). See Table 3 for a summary of the results.
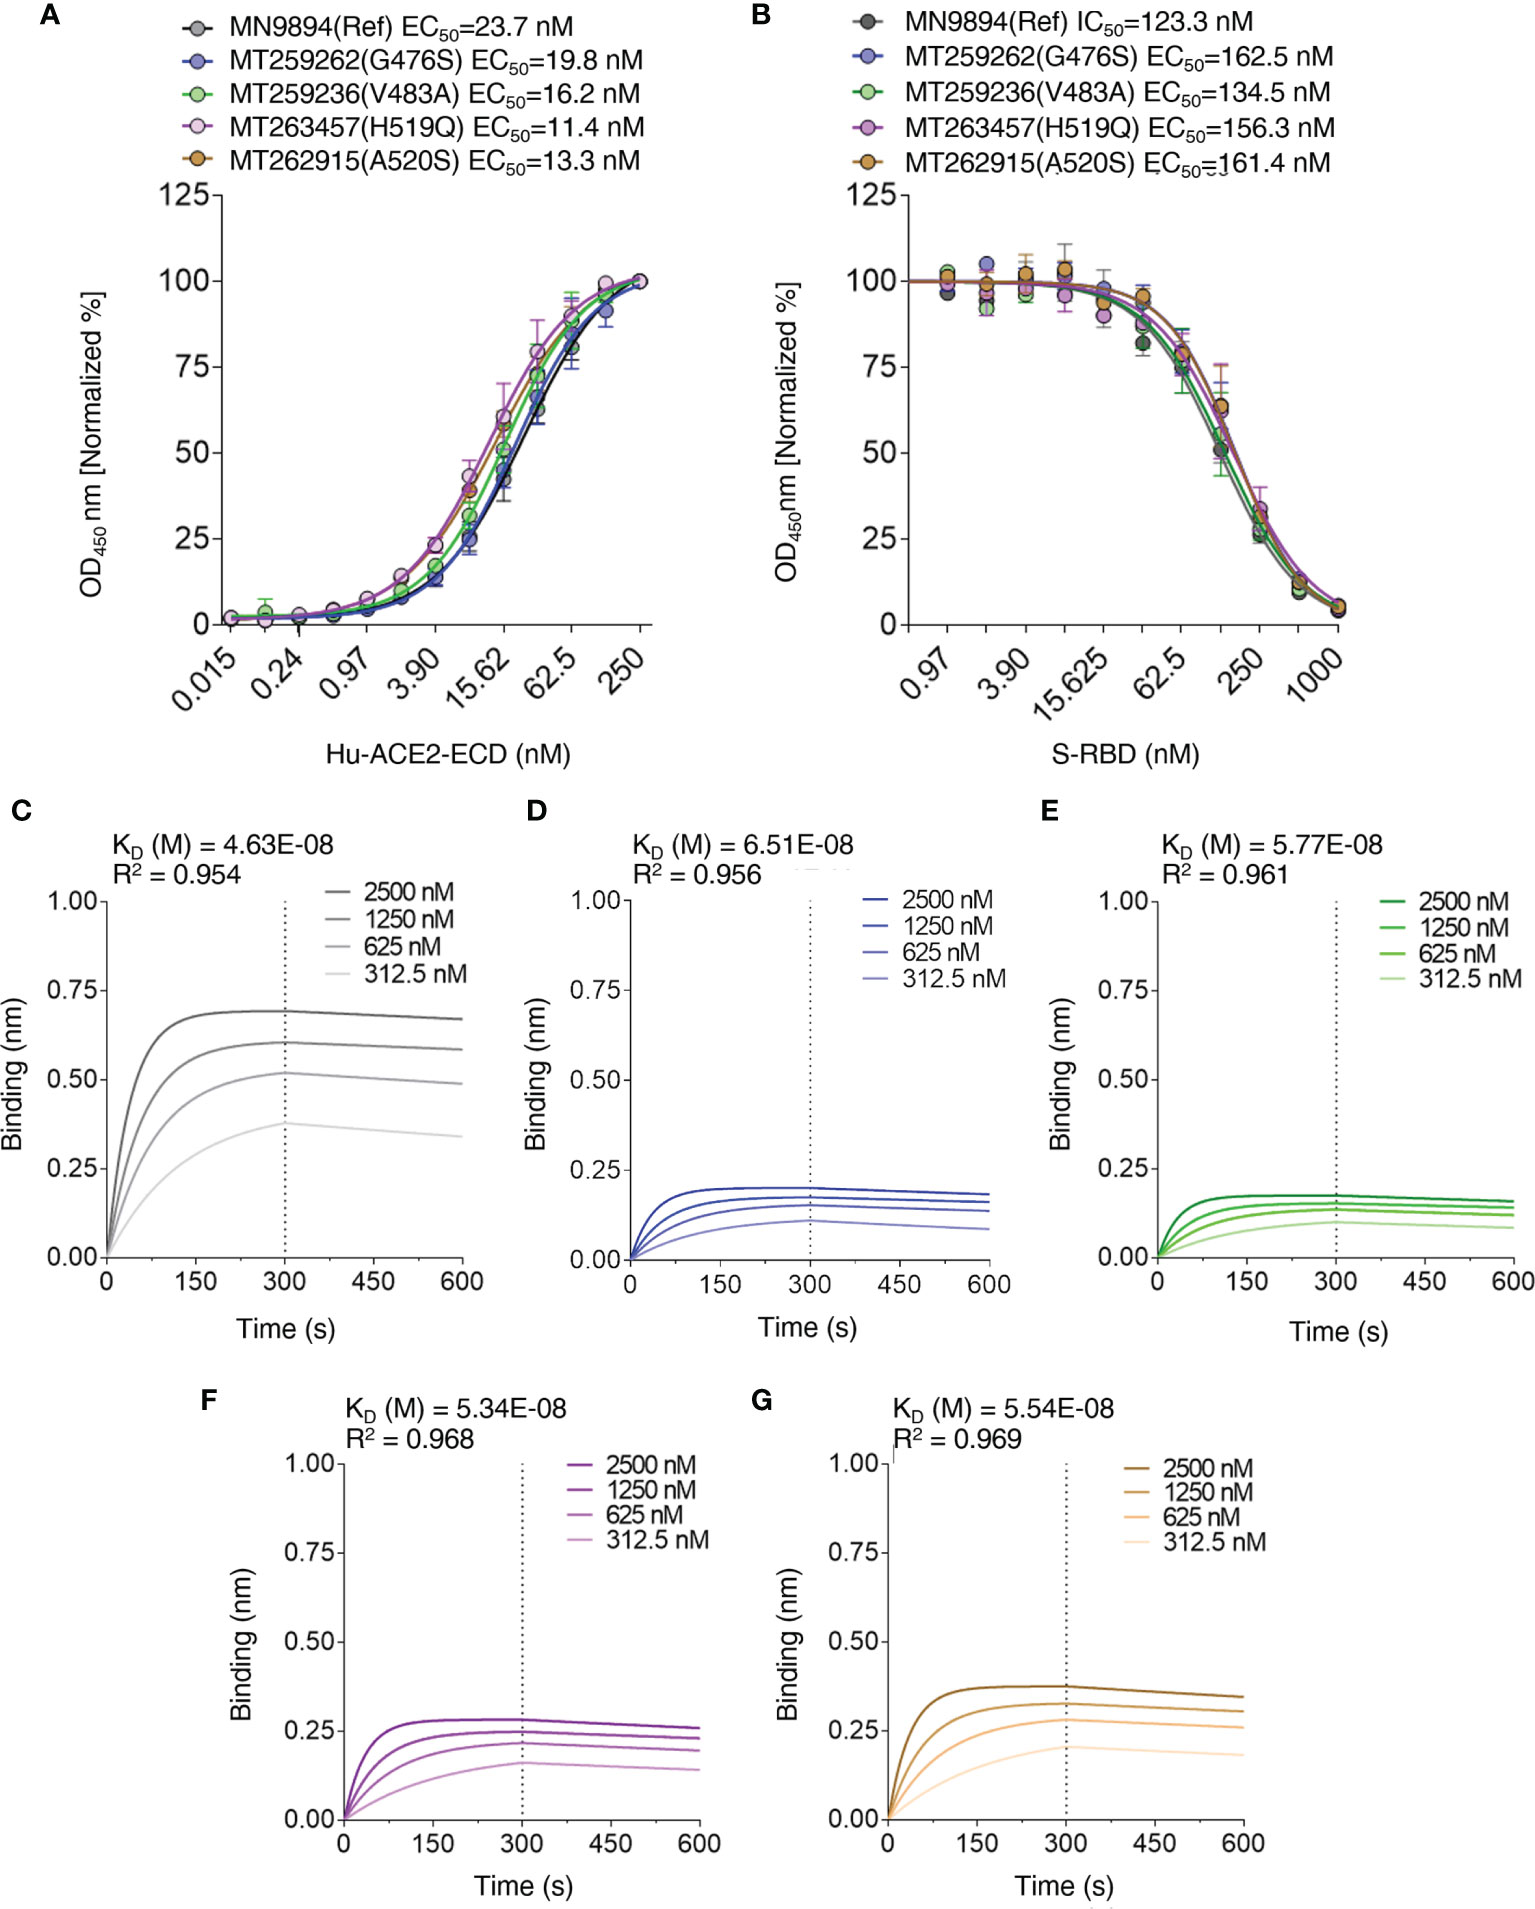
Figure 6 Interaction profiles of S-RBD reference/mutants and hACE2-ECD. (A) EC50 values of S-RBD – hACE2-ECD interaction were determined by direct binding ELISA using titration curves with hACE2-ECD dilutions, and (B) IC50 values of S-RBD – hACE2-ECD interaction were determined by competitive ELISA using titration curves with S-RBD dilutions and hACE2-ECD at a predetermined EC50. Biolayer interferometry was used to generate association and dissociation curves of S-RBD – hACE2-ECD interaction for S-RBD reference (C), G476S (D), V483A (E), H519Q (F), and A520S (G); legends represent the nanomolar (nM) concentration of hACE2-ECD and KD values are depicted.
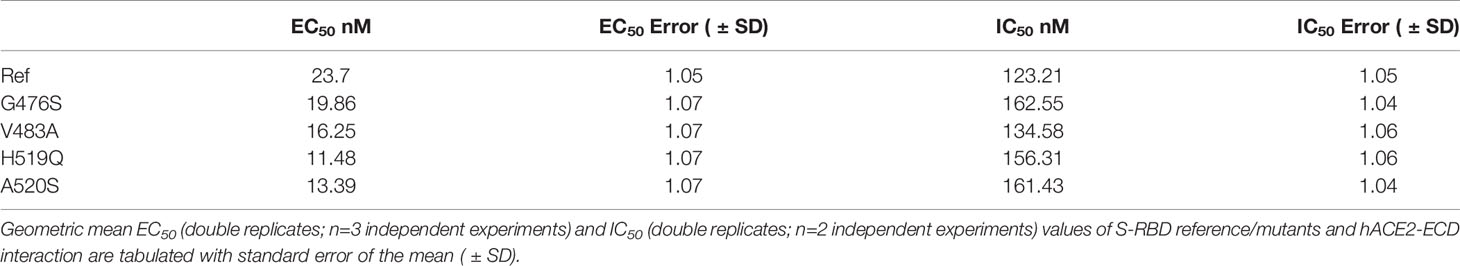
Table 3 ELISA binding profiles of S-RBD reference/mutants and hACE2-ECD.
To further validate the binding trend obtained by ELISA IC50 values, biolayer interferometry (BLI) kinetics experiments were performed by loading HIS1K sensors with S-RBD reference/mutants at a concentration of 1000 nM, and hACE-ECD (two-fold dilutions; 2500 – 312.5 nM) was used as analyte. Consistent with ELISA IC50 trend, the calculated equilibrium dissociation constants (KD) range for S-RBD – hACE-ECD interaction was narrow (Ref – 46.3 ± 1.28 nM, G476S – 65.1 ± 1.17 nM, V483A 57.7 ± 0.96 nM, H519Q 53.4 ± 0.94 nM, and A520S 55.4 ± 1.05 nM) (Figures 6C–G). A statistically significant difference was observed in the KD values of G476S and V483A, compared to reference S-RBD. Furthermore, like EC50 and IC50, the KD values differed on an average from 1.11 to 1.39-fold from the S-RBD reference. Further, the on (KON = 9.86 x 10³ to 1.11 x 10⁴ 1/Ms) and off-rates (KDIS = 4.57 x 10⁻⁴ to 6.68 x 10⁻⁴ 1/s) were largely similar for all S-RBD samples. The binding behavior of selected S-RBD mutants seems less likely to modulate S-RBD – hACE-ECD interaction. The experiments were performed in three replicas and results are summarized in Table 4.
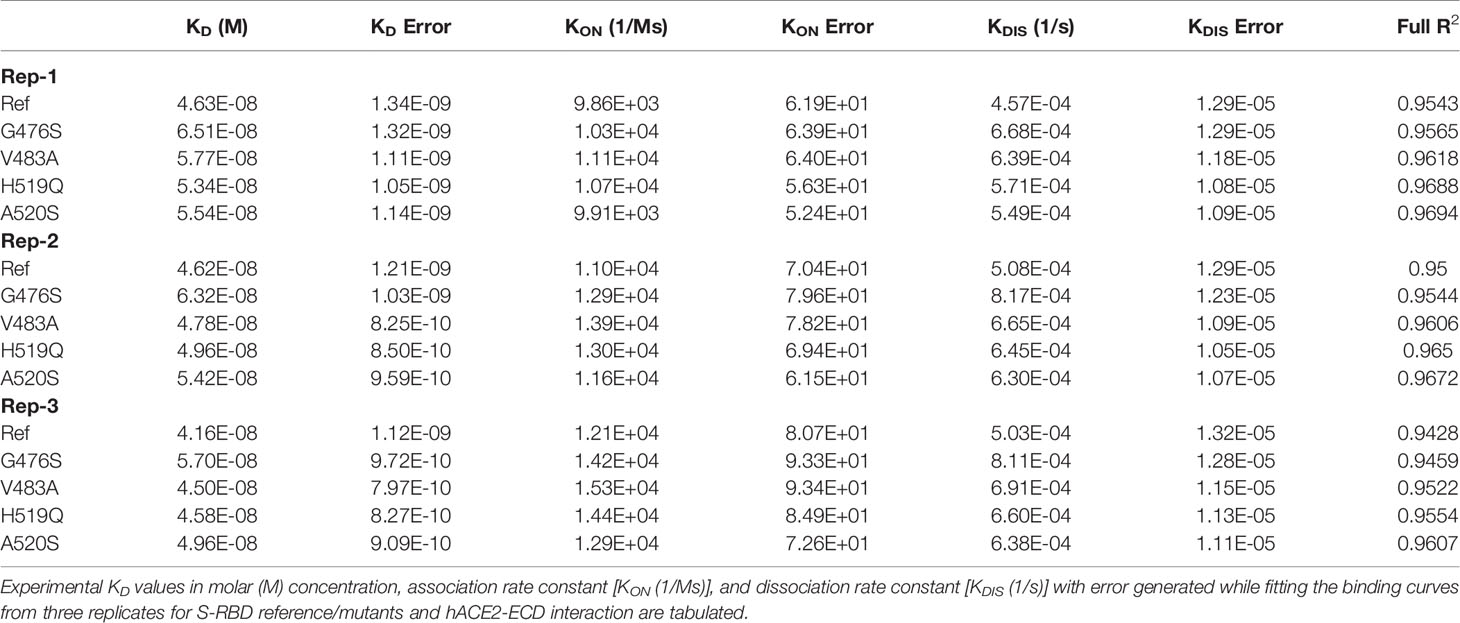
Table 4 Kinetics profiles of S-RBD reference/mutants and hACE2-ECD.
Comparison with computational estimates can be done using the formula (see method Section) where KD is the average obtained from the 3 replicas. The correlation between the two set of data is R=0.996 (Supplementary Figure 2) showing that our method is able to achieve a qualitative correct prediction of the effect of the mutations on the binding affinity.
Discussion
In this paper, we performed an in silico screening of a selected number of SARS-COV2 variants and calculated the binding affinity between S-RBD and the hACE2 receptor. Results of the simulations, in agreement with experimental observations, do not show remarkable differences in the expected KD for any of the variants. In some cases, variants show even a worsened affinity.
However, variations in KD not necessarily translate into a higher infectivity of the virus. Many different effects might be in play, and even mutations far from the binding site can improve the virus’s fitness. The D614G mutation constitutes a clear example. This variant introduced a mutation far away from the ACE2 interaction domain and displaced the original variant isolated in Wuhan worldwide in a couple of months. Similar effects have been recently reported for other mutations away from the recognition domain (55).
Notwithstanding, the KD remains a key factor to be analyzed. This is the reason why we think our contribution can be helpful to other researchers working in the design and identification of miniproteins and nanobodies against SARS-CoV-2 (52, 54, 56, 57). Having a preliminary screening of the effect of mutations on the binding affinity can help save time and other resources, especially during emergency situations, like the one we are experiencing in the current pandemic.
The great diffusion of newer virus variants (58) suggests an evolutionary advantage due to the mutations, even though their affinity is not significantly changed. Several recent studies indicate that these mutations could lead to immune escape (32–35).
To have an idea on how immune escape could happen at molecular level, we analyzed MD trajectories and computed the binding free energy of the gamma variant bound to a highly specific nanobody. We found that the affinity is indeed reduced by 1.2 kcal/mol and that this change is due mainly to the E484K mutation. This mutation can be found in several emerging SARS-COV-2 variants, and was shown to affect the binding of antibodies significantly. In other words, the virus can trade its ability to tightly bind to the hACE2 receptor in exchange for becoming more elusive to specific antibodies.
While this mechanism cannot be generalized for the whole antibody population, we can see that position 484 is a good mutation spot for the virus, from an evolutionary point of view, since this residue only interacts with neutralizing antibodies and not with the hACE2 receptor. Indeed, other mutations have also been found in this position, such as the E484Q in the kappa variant. Spreading of similar variants could escape the antibody recognition and could require a periodical update of vaccines and monoclonal antibodies used in clinical applications to avoid a potential loss of efficacy (34).
On the other hand, synthetic miniproteins that have been designed to mimic the structure of the hACE2 receptor, the natural binder for the S protein, are less affected by the mutation, and they still can work as bait.
It is worth to notice that the absolute values of the binding energies calculated may depend on some of the computational details chosen (namely, force field, water models, specific methods to calculate binding energies, etc.). However, our method is able to achieve a qualitatively correct prediction of the effect of mutations at the protein-protein interface. Indeed, we obtained a high correlation with analogous values calculated using the MM-PBSA and with experimental results (Supplementary Figure 1).
In summary, our work demonstrated that molecular simulations can be used to rapidly screen the effect of SARS-COVID-2 mutations, in particular concerning their ability to bind the hACE2 receptor or neutralizing molecules. This kind of analysis could be of primary importance as a preliminary screening and to produce working hypotheses that can help to prioritize the experimental study on the virus mutations.
Data Availability Statement
The raw data supporting the conclusions of this article will be made available by the authors upon request, without undue reservation.
Author Contributions
DB built structural models and performed molecular dynamics simulations. QJ produced S-RBD and hACE2-ECD proteins and performed binding experiments by ELISA and BLI. DB, QJ, AS, GY, SP, and FZ analyzed data. DB, AS, and FZ wrote the first draft of the manuscript. FZ and SP wrote the final version of the manuscript. AS and GY supervised wet-lab experiments. FZ and SP supervised computational studies. All authors contributed to editing and approved the final draft.
Funding
This work was supported by the National Science Foundation of China (Grant No. 31770776 to FZ) and by FOCEM (MERCOSUR Structural Convergence Fund, COF 03/11 to SP).
Conflict of Interest
The authors declare that the research was conducted in the absence of any commercial or financial relationships that could be construed as a potential conflict of interest.
Publisher’s Note
All claims expressed in this article are solely those of the authors and do not necessarily represent those of their affiliated organizations, or those of the publisher, the editors and the reviewers. Any product that may be evaluated in this article, or claim that may be made by its manufacturer, is not guaranteed or endorsed by the publisher.
Supplementary Material
The Supplementary Material for this article can be found online at: https://www.frontiersin.org/articles/10.3389/fimmu.2021.730099/full#supplementary-material
Supplementary Figure 1 | Correlation between binding free energy computed by MM-PBSA and the PRODIGY webserver.
Supplementary Figure 2 | Comparison of binding affinity computed using the PRODIGY webserver and available experimental data. Binding affinities ratios are obtained from the dissociation constant using the formula: RTΔ ln(KD) = ΔΔGExp. (top) Table containing KD, and ΔΔG, ΔΔGExp and standard error of the mean computed using the RT as reference. (bottom) Correlation between binding affinity computed using PRODIGY and ΔΔGExp.
Supplementary Figure 3 | Root mean square deviations (RMSD) of the complex S-RBD hACE2 receptor simulation. We report here only one (randomly chosen) of the five trajectory replicas produced for data analysis. All other simulations produce similar results.
Supplementary Figure 4 | Details of the interaction of the RT S-RBD and hACE2 receptor. For clarity, the figure is split into two different regions, which are spatially separated (A, B). Lys417 interacts only with Asp30. Tyr449 and Gln498 share an interaction with Asn38 and Gln42 side chains. Leu455 and Phe456 are inside a pocket of charged amino acids and interact with the main chain of Asp30, Lys31, and Thr27. Phe486 is inside a hydrophobic pocket formed by Phe28, Leu79, and Phe83. Asn487 interacts with the polar side chain of Gln24. Gln493 is within a charged pocket and interacts with the side chains of Lys31, Glu35, and His34. Thr500 shares an interaction with the polar side chain of Tyr41 and the charged side chains of Asp355 and Arg357. Asn501 is inside a charged pocket but interacts to some extent with Tyr41 and Lys353. Tyr505 establishes an interaction with Glu35 and Arg393.
Supplementary Figure 5 | Maps of the contact between different variants of S-RBD and hACE2 receptor. The x-axis of the matrix represents S-RBD residues, while the y axis represents hACE2 receptor residues. The color represents the probability of interaction along the whole set of trajectories and goes from white (0%) to blue (100%).
References
1. Fan W, Zhao S, Yu B, Chen Y-M, Wang W, Song Z-G, et al. A New Coronavirus Associated With Human Respiratory Disease in China. Nature (2020) 579(7798):265–9. doi: 10.1038/s41586-020-2008-3
2. WHO. Coronavirus (COVID-19) Dashboard. Available at: https://covid19.who.int/.
3. Jie C, Fang L, Zheng-Li S. Origin and Evolution of Pathogenic Coronaviruses. Nat Rev Microbiol (2019) 17:181–92. doi: 10.1038/s41579-018-0118-9
4. Peng Z, Yang X-L, Wang X-G, Hu B, Zhang L, Zhang W, et al. A Pneumonia Outbreak Associated With a New Coronavirus of Probable Bat Origin. Nature (2020) 579:270–3. doi: 10.1038/s41586-020-2012-7
5. Roujian L, Zhao X, Li J, Niu P, Yang B, Wu H, et al. Genomic Characterisation and Epidemiology of 2019 Novel Coronavirus: Implications for Virus Origins and Receptor Binding. Lancet (2020) 395:565–74. doi: 10.1016/S0140-6736(20)30251-8
6. Xiaojun L, Giorgi EE, Marichannegowda MH, Foley B, Xiao C, Kong X-P, et al. Emergence of SARS-CoV-2 Through Recombination and Strong Purifying Selection. Sci Adv (2020) 6(27):eabb9153. doi: 10.1126/sciadv.abb9153
7. Meagan B, Eric D, Ralph B. SARS-CoV and Emergent Coronaviruses: Viral Determinants of Interspecies Transmission. Curr Opin Virol (2011) 1:624–34. doi: 10.1016/j.coviro.2011.10.012
8. Starr TN, Greaney AJ, Hilton SK, Ellis D, Crawford KHD, Dingens AS, et al. Deep Mutational Scanning of SARS-CoV-2 Receptor Binding Domain Reveals Constraints on Folding and ACE2 Binding. Cell (2020) 182:1295–310. doi: 10.1016/j.cell.2020.08.012
9. Alexandra CW, Park Y-J, Tortorici MA, Wall A, McGuire AT, Veesler D. Structure, Function, and Antigenicity of the SARS-CoV-2 Spike Glycoprotein. Cell (2020) 181:281–92. doi: 10.1016/j.cell.2020.02.058
10. Wrapp D, Wang N, Corbett KS, Goldsmith JA, Hsieh C-L, Abiona O, et al. Cryo-EM Structure of the 2019-Ncov Spike in the Prefusion Conformation. Science (2020) 367:1260–3. doi: 10.1126/science.abb2507
11. Hoffmann M, Kleine-Weber H, Schroeder S, Krüger N, Herrler T, Erichsen S, et al. SARS-CoV-2 Cell Entry Depends on ACE2 and TMPRSS2 and Is Blocked by a Clinically Proven Protease Inhibitor. Cell (2020) 181:271–80. doi: 10.1016/j.cell.2020.02.052
12. Letko M, Marzi A, Munster V. Functional Assessment of Cell Entry and Receptor Usage for SARS-CoV-2 and Other Lineage B Betacoronaviruses. Nat Microbiol (2020) 5:562–9. doi: 10.1038/s41564-020-0688-y
13. Wu K, Peng G, Wilken M, Geraghty RJ, Li F. Mechanisms of Host Receptor Adaptation by Severe Acute Respiratory Syndrome Coronavirus. J Biol Chem (2012) 287:8904–11. doi: 10.1074/jbc.M111.325803
14. Frieman M, Yount B, Agnihothram S, Page C, Donaldson E, Roberts A, et al. Molecular Determinants of Severe Acute Respiratory Syndrome Coronavirus Pathogenesis and Virulence in Young and Aged Mouse Models of Human Disease. J Virol (2012) 86:884–97. doi: 10.1128/JVI.05957-11
15. Ren W, Qu X, Li W, Han Z, Yu M, Zhou P, et al. Difference in Receptor Usage Between Severe Acute Respiratory Syndrome (SARS) Coronavirus and SARS-Like Coronavirus of Bat Origin. J Virol (2008) 82:1899–907. doi: 10.1128/JVI.01085-07
16. Chandrashekar A, Liu J, Martinot AJ, McMahan K, Mercado NB, Peter L, et al. SARS-CoV-2 Infection Protects Against Rechallenge in Rhesus Macaques. Science (2020) 369:812–7. doi: 10.1126/science.abc4776
17. Salazar E, Kuchipudi SV, Christensen PA, Eagar T, Yi X, Zhao P, et al. Convalescent Plasma Anti-SARS-CoV-2 Spike Protein Ectodomain and Receptor-Binding Domain IgG Correlate With Virus Neutralization. J Clin Invest (2020) 130:6728–38. doi: 10.1172/JCI141206
18. Qiang M, Ma P, Li Y, Liu H, Harding A, Min C, et al. Potent SARS-CoV-2 Neutralizing Antibodies Selected From a Human Antibody Library Constructed Decades Ago. BioRxiv (2020). doi: 10.1101/2020.11.06.370676
19. Kyriakidis NC, López-Cortés A, Vásconez González E, Barreto Grimaldos A, Ortiz Prado E. SARS-CoV-2 Vaccines Strategies: A Comprehensive Review of Phase 3 Candidates. NPJ Vaccines (2021) 6:28.2021. doi: 10.1038/s41541-021-00292-w
20. Demogines A, Farzan M, Sawyer SL. Evidence for ACE2-Utilizing Coronaviruses (CoVs) Related to Severe Acute Respiratory Syndrome CoV in Bats. J Virol (2012) 86:6350–3. doi: 10.1128/JVI.00311-12
21. Frank HK, Enard D, Boyd SD. Exceptional Diversity and Selection Pressure on SARS-CoV and SARS-CoV-2 Host Receptor in Bats Compared to Other Mammals. bioRxiv (2020) 2020.04.20.051656. doi: 10.1101/2020.04.20.051656
22. MacLean OA, Lytras S, Singer JB, Weaver S, Kosakovsky Pond SL, Robertson DL. Evidence of Significant Natural Selection in the Evolution of SARS-CoV-2 in Bats, Not Humans. bioRxiv (2020) 2020.05.28.122366. doi: 10.1101/2020.05.28.122366
23. Li F. Structure, Function, and Evolution of Coronavirus Spike Proteins. Annu Rev Virol (2016) 3:237–61. doi: 10.1146/annurev-virology-110615-042301
24. Rees-Spear C, Muir L, Griffith SA, Heaney J, Aldon Y, Snitselaar JL, et al. The Effect of Spike Mutations on SARS-CoV-2 Neutralization. Cell Rep (2021) 34:108890. doi: 10.1016/j.celrep.2021.108890
25. Fratev F. The N501Y and K417N Mutations in the Spike Protein of SARS-CoV-2 Alter the Interactions With Both Hace2 and Human Derived Antibody: A Free Energy of Perturbation Study. bioRxiv (2021) 20201223424283. doi: 10.1101/2020.12.23.424283
26. Cheng H, Krieger JM, Kaynak B, Arditi M, Bahar I. Impact of South African 501.V2 Variant on SARS-CoV-2 Spike Infectivity and Neutralization: A Structure-Based Computational Assessment. bioRxiv (2021) 2020.01.10.426143. doi: 10.1101/2021.01.10.426143
27. Li Q, Wu J, Nie J, Zhang L, Hao H, Liu S, et al. The Impact of Mutations in SARS-CoV-2 Spike on Viral Infectivity and Antigenicity. Cell (2020) 182:1284–94. doi: 10.1016/j.cell.2020.07.012
28. Garcia-Beltran WF, Lam EC, St Denis K, Nitido AD, Garcia ZH, Hauser BM, et al. Multiple SARS-CoV-2 Variants Escape Neutralization by Vaccine-Induced Humoral Immunity. Cell (2021) S0092-8674(21):2372–83. doi: 10.1016/j.cell.2021.03.013
29. Zou J, Yin J, Fang L, Yang M, Wang T, Wu W, et al. Computational Prediction of Mutational Effects on SARS-CoV-2 Binding by Relative Free Energy Calculations. J Chem Inf Model (2020) 60:5794–802. doi: 10.1021/acs.jcim.0c00679
30. Ou J, Zhou Z, Dai R, Zhang J, Lan W, Zhao S, et al. Emergence of RBD Mutations in Circulating SARS-CoV-2 Strains Enhancing the Structural Stability and Human ACE2 Receptor Affinity of the Spike Protein. bioRxiv (2020) 2020.03.15.991844. doi: 10.1101/2020.03.15.991844
31. Saha P, Majumder R, Srivastava AK, Mandal M, Sarkar S. Mutations in Spike Protein of SARS-CoV-2 Modulate Receptor Binding, Membrane Fusion and Immunogenicity: An Insight Into Viral Tropism and Pathogenesis of COVID-19. chemrxiv (2020) 12320567. doi: 10.26434/chemrxiv.12320567
32. Altmann DM, Reynolds CJ, Boyton RJ. SARS-CoV-2 Variants: Subversion of Antibody Response and Predicted Impact on T Cell Recognition. Cell Rep Med (2021) 2:100286. doi: 10.1016/j.xcrm.2021.100286
33. Wang P, Nair MS, Liu L, Iketani S, Lou Y, Guo Y, et al. Antibody Resistance of SARS-CoV-2 Variants B.1.351 and B.1.1.7. Nature (2021) 593:130–5. doi: 10.1038/s41586-021-03398-2
34. Wang Z, Schmidt F, Weisblum Y, Muecksch F, Barnes CO, Finkin S, et al. mRNA Vaccine-Elicited Antibodies to SARS-CoV-2 and Circulating Variants. Nature (2021) 592:616–22. doi: 10.1038/s41586-021-03324-6
35. Collier DA, De Marco A, Ferreira IATM, Meng B, Datir RP, Walls AC, et al. Sensitivity of SARS-CoV-2 B.1.1.7 to mRNA Vaccine-Elicited Antibodies. Nature (2021) 593:136–41. doi: 10.1038/s41586-021-03412-7
36. Wang Q, Zhang Y, Wu L, Niu S, Song C, Zhang Z, et al. Structural and Functional Basis of SARS-CoV-2 Entry by Using Human Ace2. Cell (2020) 181:894–904.e899. doi: 10.1016/j.cell.2020.03.045
37. Pettersen EF, Goddard TD, Huang CC, Couch GS, Greenblatt DM, Meng EC, et al. UCSF Chimera–a Visualization System for Exploratory Research and Analysis. J Comput Chem (2004) 25:1605–12. doi: 10.1002/jcc.20084
38. Pronk S, Páll S, Schulz R, Larsson P, Bjelkmar P, Apostolov R, et al. GROMACS 4.5: A High-Throughput and Highly Parallel Open Source Molecular Simulation Toolkit. Bioinformatics (2013) 29:845–54. doi: 10.1093/bioinformatics/btt055
39. Maier JA, Martinez C, Kasavajhala K, Wickstrom L, Hauser KE. Ff14sb: Improving the Accuracy of Protein Side Chain and Backbone Parameters From Ff99sb. J Chem Theory Comput (2015) 11:3696–713. doi: 10.1021/acs.jctc.5b00255
40. Ziraldo G, Buratto D, Kuang Y, Xu L, Carrer A, Nardin C, et al. A Human-Derived Monoclonal Antibody Targeting Extracellular Connexin Domain Selectively Modulates Hemichannel Function. Front Physiol (2019) 10:392. doi: 10.3389/fphys.2019.00392
41. Zonta F, Buratto D, Crispino G, Carrer A, Bruno F, Yang G, et al. Cues to Opening Mechanisms From in Silico Electric Field Excitation of Cx26 Hemichannel and In Vitro Mutagenesis Studies in HeLa Transfectans. Front Mol Neurosci (2018) 11:170. doi: 10.3389/fnmol.2018.00170
42. Zonta F, Girotto G, Buratto D, Crispino G, Morgan A, Abdulhadi K, et al. The P.Cys169Tyr Variant of Connexin 26 is Not a Polymorphism. Hum Mol Genet (2015) 24:2641–8. doi: 10.1093/hmg/ddv026
43. Zonta F, Mammano F, Torsello M, Fortunati N, Orian L, Polimeno A. Role of Gamma Carboxylated Glu47 in Connexin 26 Hemichannel Regulation by Extracellular Ca(2)(+): Insight From a Local Quantum Chemistry Study. Biochem Biophys Res Commun (2014) 445:10–5. doi: 10.1016/j.bbrc.2014.01.063
44. Berendsen HJC, Postma JPM, van Gunsteren WF, Dinola A, Haak JR. Molecular Dynamics With Coupling to an External Bath. J Chem Phys (1984) 81:3684–90. doi: 10.1063/1.448118
45. Darden T, York D, Pedersen L. Particle Mesh Ewald: An N · Log(N) Method for Ewald Sums in Large Systems. J Chem Phys (1993) 98:10089–93. doi: 10.1063/1.464397
46. Xue LC, Rodrigues JP, Kastritis PL, Bonvin AM, Vangone A. PRODIGY: A Web Server for Predicting the Binding Affinity of Protein-Protein Complexes. Bioinformatics (2016) 32:3676–8. doi: 10.1093/bioinformatics/btw514
47. Vangone A, Bonvin AM. Contacts-Based Prediction of Binding Affinity in Protein-Protein Complexes. Elife (2015) 4:e07454. doi: 10.7554/eLife.07454
48. Kollman PA, Massova I, Reyes C, Kuhn B, Huo S, Chong L, et al. Calculating Structures and Free Energies of Complex Molecules: Combining Molecular Mechanics and Continuum Models. Acc Chem Res (2000) 33:889–97. doi: 10.1021/ar000033j
49. Wang E, Sun H, Wang J, Wang Z, Liu H, Zhang JZH, et al. End-Point Binding Free Energy Calculation With MM/PBSA and MM/GBSA: Strategies and Applications in Drug Design. Chem Rev (2019) 119:9478–508. doi: 10.1021/acs.chemrev.9b00055
50. Cournia Z, Allen B, Sherman W. Relative Binding Free Energy Calculations in Drug Discovery: Recent Advances and Practical Considerations. J Chem Inf Model (2017) 57:2911–37. doi: 10.1021/acs.jcim.7b00564
51. Villoutreix BO, Calvez V, Marcelin AG, Khatib AM. In Silico Investigation of the New UK (B.1.1.7) and South African (501y.V2) SARS-CoV-2 Variants With a Focus at the ACE2-Spike RBD Interface. Int J Mol Sci (2021) 22:695. doi: 10.3390/ijms22041695
52. Xiang Y, Nambulli S, Xiao Z, Liu H, Sang Z, Duprex WP, et al. Versatile and Multivalent Nanobodies Efficiently Neutralize SARS-CoV-2. Science (2020) 370:1479–84. doi: 10.1126/science.abe4747
53. Cao L, Goreshnik I, Coventry B, Case JB, Miller L, Kozodoy L, et al. De Novo Design of Picomolar SARS-CoV-2 Miniprotein Inhibitors. Science (2020) 370:426–31. doi: 10.1126/science.abd9909
54. Sun D, Sang Z, Kim J, Xiang Y, Cohen T, Belford AK, et al. Potent Neutralizing Nanobodies Resist Convergent Circulating Variants of SARS-CoV-2 by Targeting Diverse and Conserved Epitopes. Nat Commun (2021) 12:4676. doi: 10.1038/s41467-021-24963-3
55. Gonzalez-Puelma J, Aldridge J, Montes de Oca M, Pinto M, Uribe-Paredes R, Fernández-Goycoolea J, et al. Mutation in a SARS-CoV-2 Haplotype From Sub-Antarctic Chile Reveals New Insights Into the Spike's Dynamics. Viruses (2021) 13(5):883. doi: 10.3390/v13050883
56. Valenzuela Nieto G, Jara R, Watterson D, Modhiran N, Amarilla AA, Himelreichs J, et al. Potent Neutralization of Clinical Isolates of SARS-CoV-2 D614 and G614 Variants by a Monomeric, Sub-Nanomolar Affinity Nanobody. Sci Rep (2021) 11:3318. doi: 10.1038/s41598-021-82833-w
57. Guttler T, Aksu M, Dickmanns A, Stegmann KM, Gregor K, Rees R, et al. Neutralization of SARS-CoV-2 by Highly Potent, Hyperthermostable, and Mutation-Tolerant Nanobodies. EMBO J (2021) 40:e107985. doi: 10.15252/embj.2021107985
Keywords: COVID-19, SARS-CoV-2, Spike-RBD, human ACE2, binding affinity, neutralizing antibodies, protein-protein interaction, molecular dynamics
Citation: Buratto D, Saxena A, Ji Q, Yang G, Pantano S and Zonta F (2021) Rapid Assessment of Binding Affinity of SARS-COV-2 Spike Protein to the Human Angiotensin-Converting Enzyme 2 Receptor and to Neutralizing Biomolecules Based on Computer Simulations. Front. Immunol. 12:730099. doi: 10.3389/fimmu.2021.730099
Received: 24 June 2021; Accepted: 25 October 2021;
Published: 11 November 2021.
Edited by:
Peter Chen, Cedars-Sinai Medical Center, United StatesReviewed by:
Srinivasa Reddy Bonam, Institut National de la Santé et de la Recherche Médicale (INSERM), FranceJean-Luc Pellequer, UMR5075 Institut de Biologie Structurale (IBS), France
Copyright © 2021 Buratto, Saxena, Ji, Yang, Pantano and Zonta. This is an open-access article distributed under the terms of the Creative Commons Attribution License (CC BY). The use, distribution or reproduction in other forums is permitted, provided the original author(s) and the copyright owner(s) are credited and that the original publication in this journal is cited, in accordance with accepted academic practice. No use, distribution or reproduction is permitted which does not comply with these terms.
*Correspondence: Francesco Zonta, fzonta@shanghaitech.edu.cn