Pandemic Induced Changes in Economic Activity around African Protected Areas Captured through Night-Time Light Data


1
Independent Evaluation Office, Global Environment Facility, Washington, DC 20006, USA
2
Office of Innovation, UNICEF, New York, NY 10017, USA
*
Author to whom correspondence should be addressed.
Remote Sens. 2021, 13(2), 314; https://doi.org/10.3390/rs13020314
Submission received: 1 December 2020
/
Revised: 6 January 2021
/
Accepted: 11 January 2021
/
Published: 18 January 2021
(This article belongs to the Special Issue Remote Sensing of Night-Time Light)
Abstract
:The importance of tourism for development is widely recognized. Travel restrictions imposed to contain the spread of COVID-19 have brought tourism to a halt. Tourism is one of the key sectors driving change in Africa and is based exclusively on natural assets, with wildlife being the main attraction. Economic activities, therefore, are clustered around conservation and protected areas. We used night-time light data as a proxy measure for economic activity to assess change due to the pandemic. Our analysis shows that overall, 75 percent of the 8427 protected areas saw a decrease in light intensity in varying degrees in all countries and across IUCN protected area categories, including in popular protected area destinations, indicating a reduction in tourism-related economic activities. As countries discuss COVID-19 recovery, the methods using spatially explicit data illustrated in this paper can assess the extent of change, inform decision-making, and prioritize recovery efforts.

1. Introduction
Travel and tourism are vital economic sectors closely tied with socio-economic progress and recognized for their potential to contribute to poverty reduction and development. This sector accounts for 10.3 percent of global GDP, making it larger than agriculture. In 2019 alone, it created one in four new jobs. In Africa, the tourism sector employs around 24.6 million people and contributes $169 billion to the continent’s economy combined, representing 7.1% of Africa’s GDP [1]. Over 30 African countries have identified tourism as a national priority within the Enhanced Integrated Framework (EIF), a multilateral partnership dedicated to providing trade-related assistance to less developed countries [2]. Tourism in the majority of African countries is centered around their protected area (PA) systems. Africa’s 8400 protected areas (PAs) produce approximately US$48 billion in revenue [3]. Tourism revenue is also the primary source of funding for PA agencies on the continent. The impact of COVID-19 on conserved and protected areas have been estimated to range from economic, social, and ecological to management and enforcement [4,5,6].
Protected areas, initially envisioned to protect iconic landscapes, seascapes, and wildlife, now cover 15% of the earth’s land surface [7]. Besides the traditional functions of habitat and biodiversity protection, PAs today are directly linked to supporting human livelihoods and well-being, providing ecosystem services, and contributing to climate change mitigation and adaptation [8]. Protected areas are hotspots of biodiversity conservation and often overlap with areas of poverty and underdevelopment. Tourism revenues provide the vital means to address both conservation and socio-economic development objectives of communities living in and around PAs and beyond. A recent study found how households around PAs with tourism also had higher wealth levels (by 17%) and a lower likelihood of poverty (by 16%) compared to similar households living far from protected areas [9]. Empirical evidence also suggests that nature-based tourism can be positive for people and wildlife [10,11,12].
COVID-19, which started around December of 2019, drew significant impacts on the travel industry with travel restrictions that began in January 2020. The World Health Organization (WHO) declared it a pandemic on 11 March 2020. Immediately countries across the world introduced movement restrictions and confinement policies ranging from voluntary compliance to complete ban on non-essential travel for effective control of the pandemic. The tourism sector (non-essential travel) is the most directly impacted by lockdown measures but also offers the opportunity to examine the effectiveness of confinement measures including controlling the spread of COVID-19 and its broader impacts.
By the end of April 2020, all tourist destinations worldwide have imposed travel restrictions, out of which 72% have completely closed their borders for international tourism [13]. The World Tourism Organization (WTO) has stated that international tourism could decline by 60–80% in 2020. This decline could mean a total collapse of the tourism sector in Africa, jeopardizing the progress made in recent years and threatening the survival of millions.
The impact of infectious diseases on the travel and tourism industry has been recognized during the 2014 Ebola outbreak in West Africa. The effect of that outbreak extended beyond the Ebola zone and was felt across the continent [14]. Travel and tourism in Africa took a massive hit, with broader macroeconomic and social impacts, as per studies conducted a few years later after the outbreak ended [15].
At the date of this paper, we cannot estimate the socio-economic impacts of the COVID-19 pandemic due to the scarcity of socio-economic data, travel restrictions, and persisting uncertainty about the pandemic duration and about how recovery will take place. In this scenario, remote sensing approaches can be a useful first step to assess the extent of change induced by this pandemic. Few studies recently have used remote sensing data to demonstrate the impact of the pandemic on economic activities and the environment [16,17,18].
Night-time light data have been successfully used as a proxy measure for economic activity and combined with other data to assess economic growth and development in various contexts and scales [19,20,21]. Using night-time light data as a proxy indicator, studies have estimated economic activities on global, national, and subnational levels in developing economies [22,23,24], the spatial distribution of GDP [20,25], and mapped urbanization dynamics [24,26,27]. Recent studies in China [17,28], Germany [29] and India [18] have shown how nighttime lights can be used as a proxy to monitor change and recovery in economic activity levels due to lockdown imposed by the pandemic. Studies have shown that night-time lights do provide a reliable indicator to capture economic activity. However, the relationship seems to be statistically more robust for developing economies than developed ones [19]. Developed economies are less dependent on physical infrastructure, and the services sector contributes more to the overall economic output.
In this paper, we use the night-time lights as a proxy indicator to compare the changes in economic activities before and during the pandemic around PAs in Africa to assess change patterns.
This study has two main objectives:
- Demonstrate the application of NTL to capture the changes in economic activities around PAs before and during the COVID-19 pandemic.
- Assess the changes and patterns and how are they related to other contextual conditions.
The study looks at the economic activities around a five-kilometer buffer of protected areas in Africa because most economic and tourist activities occur within that zone. This study includes 8427 PAs, of which 7763 were terrestrial protected areas, whereas 443 were coastal and marine, and 221 only marine PAs. These protected areas have different protection levels and include international designations such as UNESCO World Heritage sites, Ramsar sites, and UNESCO-MAB reserves.
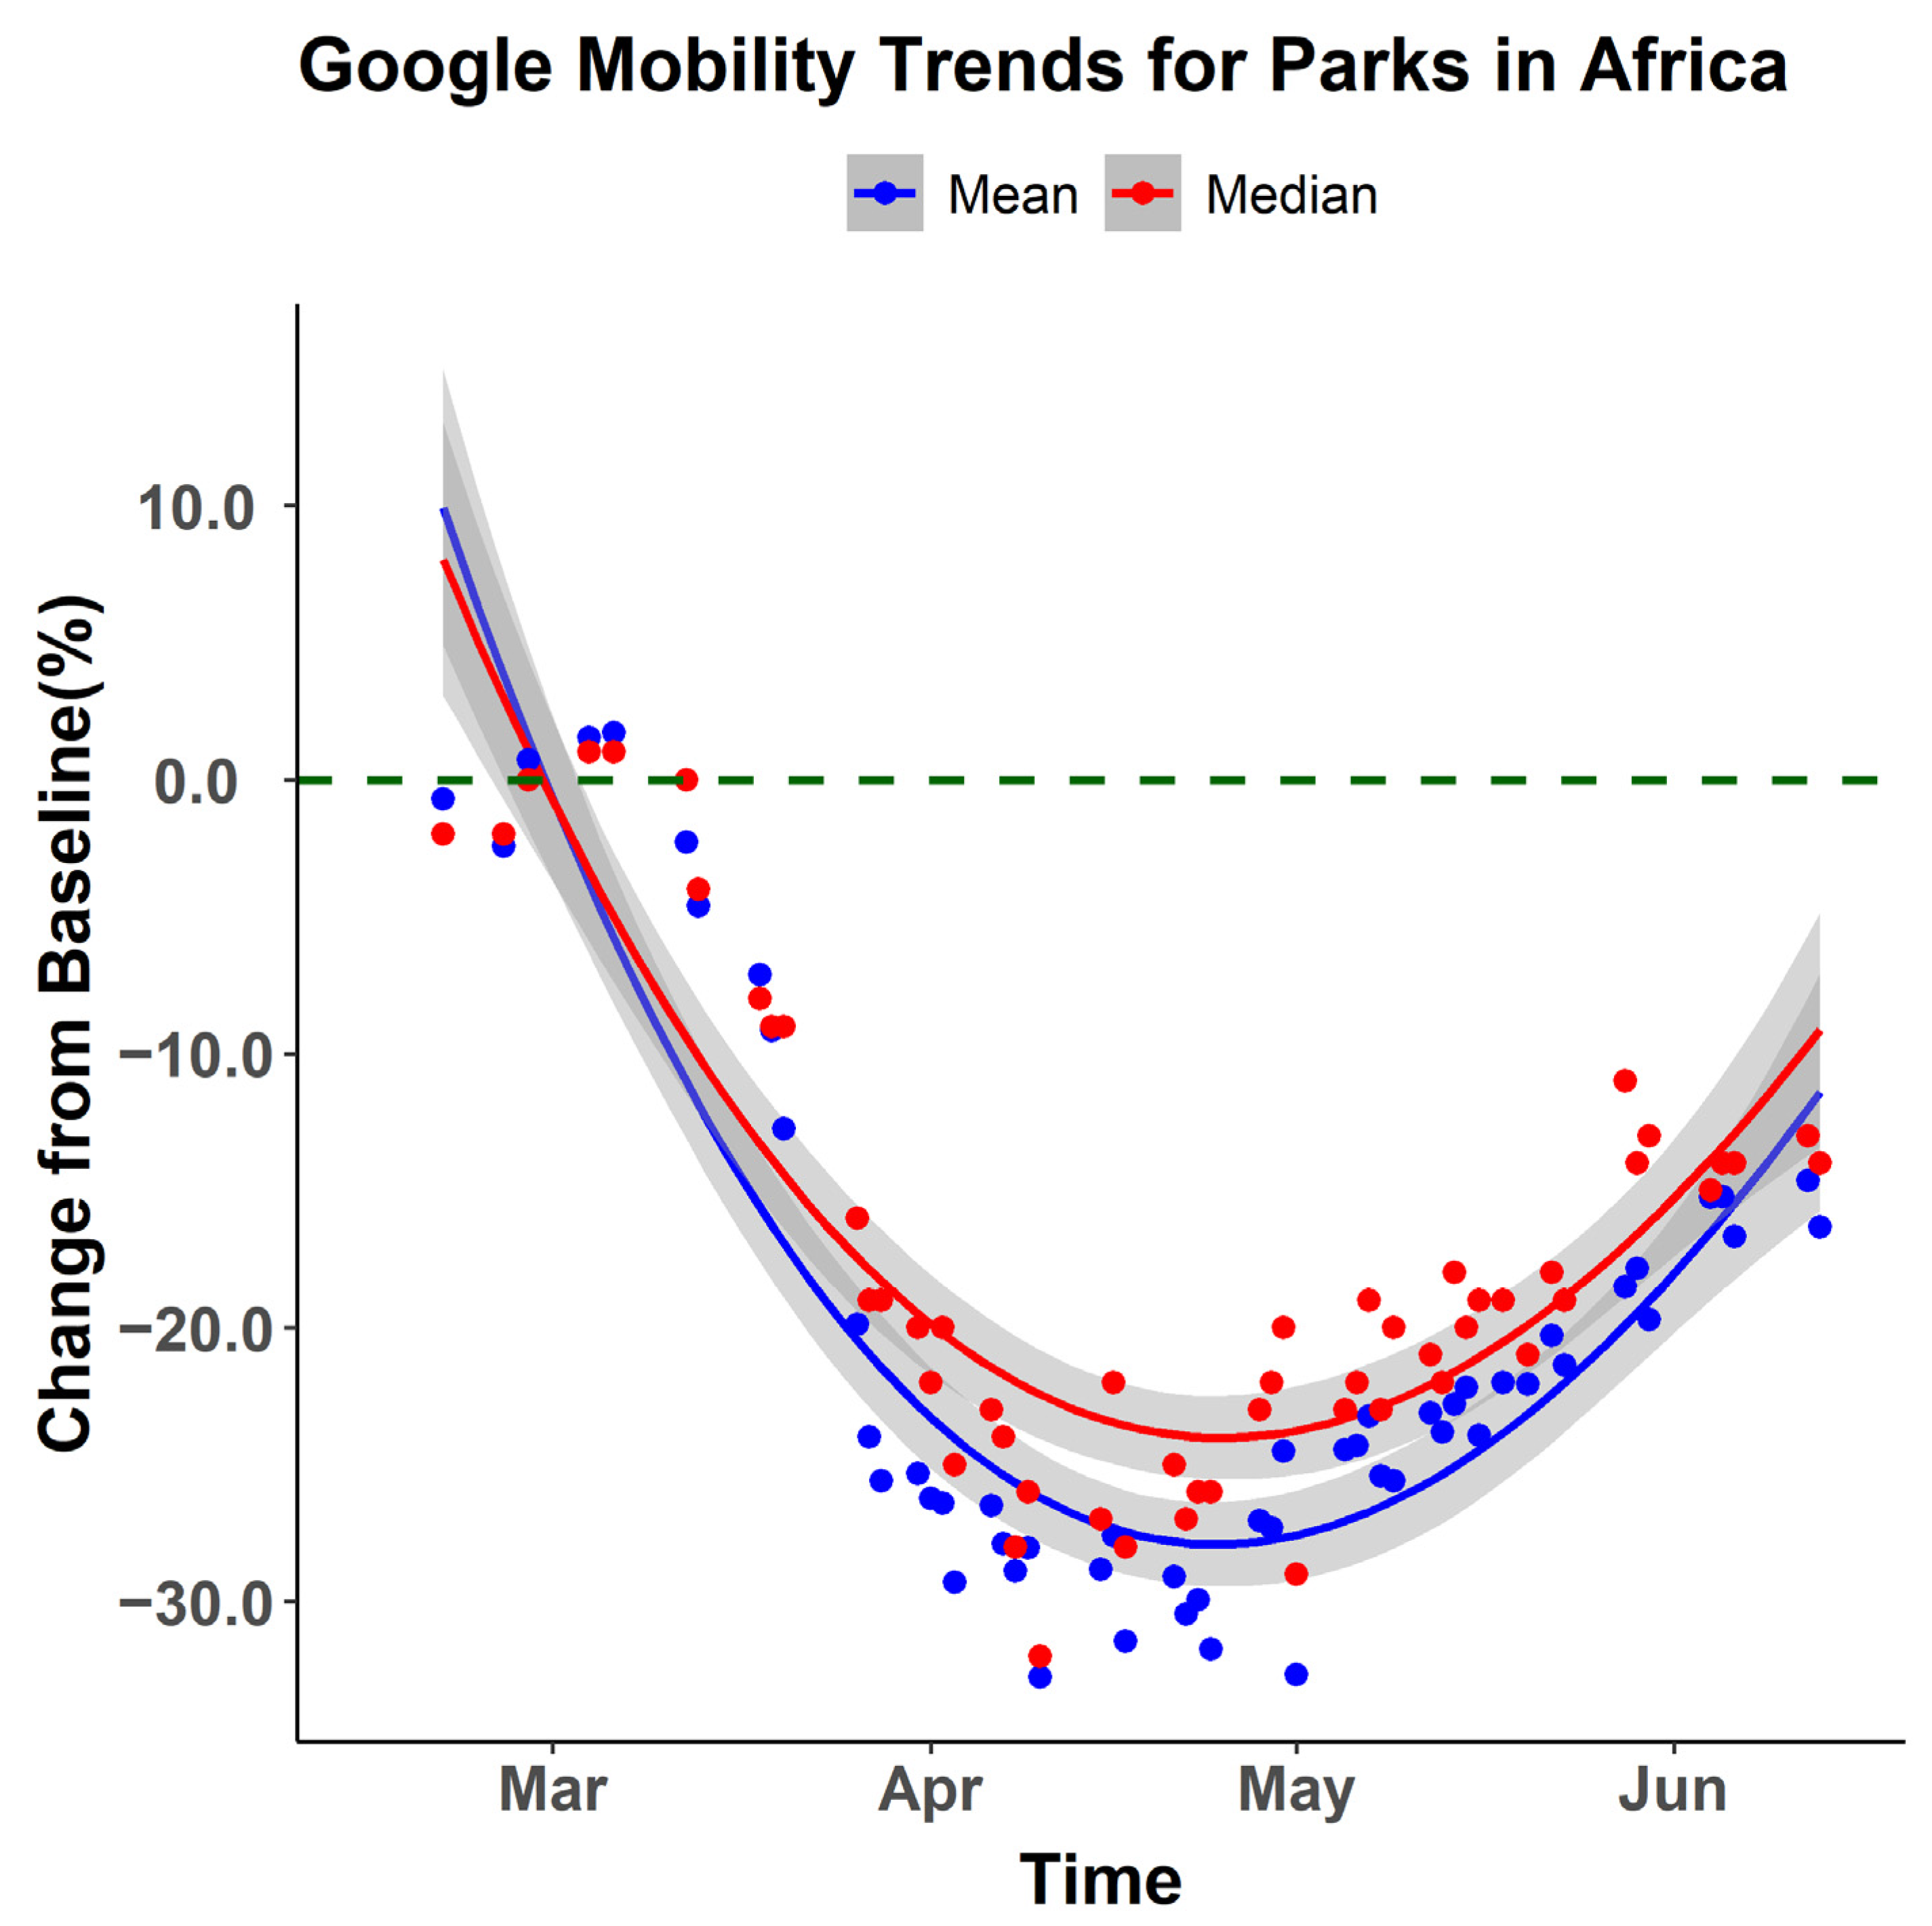
We compared the night-time lights data for April 2020 with the data from April 2019. We choose April 2020 to observe the change in economic activities due to COVID-19 because all tourist destinations worldwide have imposed travel restrictions by then [13], and mobility around national parks in Africa was also at its lowest (Figure 1).
The results are presented to highlight COVID-19 pandemic-induced travel restrictions on economic activities around PAs in Africa. Future research could include large socio-economic datasets and site-specific data gathered through surveys and interviews with selected PA and tourism stakeholders.
2. Materials and Methods
We used two globally available data sets for this study, the World Database on Protected Areas (WDPA) downloaded from the protected planet website [30], and daily VIIRS VNP46A1 product, the source of night-time light data.
World Database on Protected Areas: We used the April 2020 version of the WDPA, which provides boundaries, designation, and other information. The WDPA is the most comprehensive database on protected areas and provides unified standards and unique opportunities for large-scale conservation studies [31].
The WDPA contains both the boundary and point locations for the sites that do not have precise boundaries. We did not include Libya and Somalia data as they do not have boundary information in the WDPA. We also did not include any regional or country-level PA database because the WDPA is the only authoritative dataset following globally consistent standards and is regularly validated and updated to maintain the highest data qualities.
Following the WDPA best practice guidelines [32], we used the higher and stricter IUCN designation for overlapping areas.
The WDPA also classifies PAs by IUCN management categories and governance types, as reported by the data provider. Sixty-six percent of protected areas in the WDPA had an IUCN Management Category, and 88 percent had a governance type as of May 2019 [33].
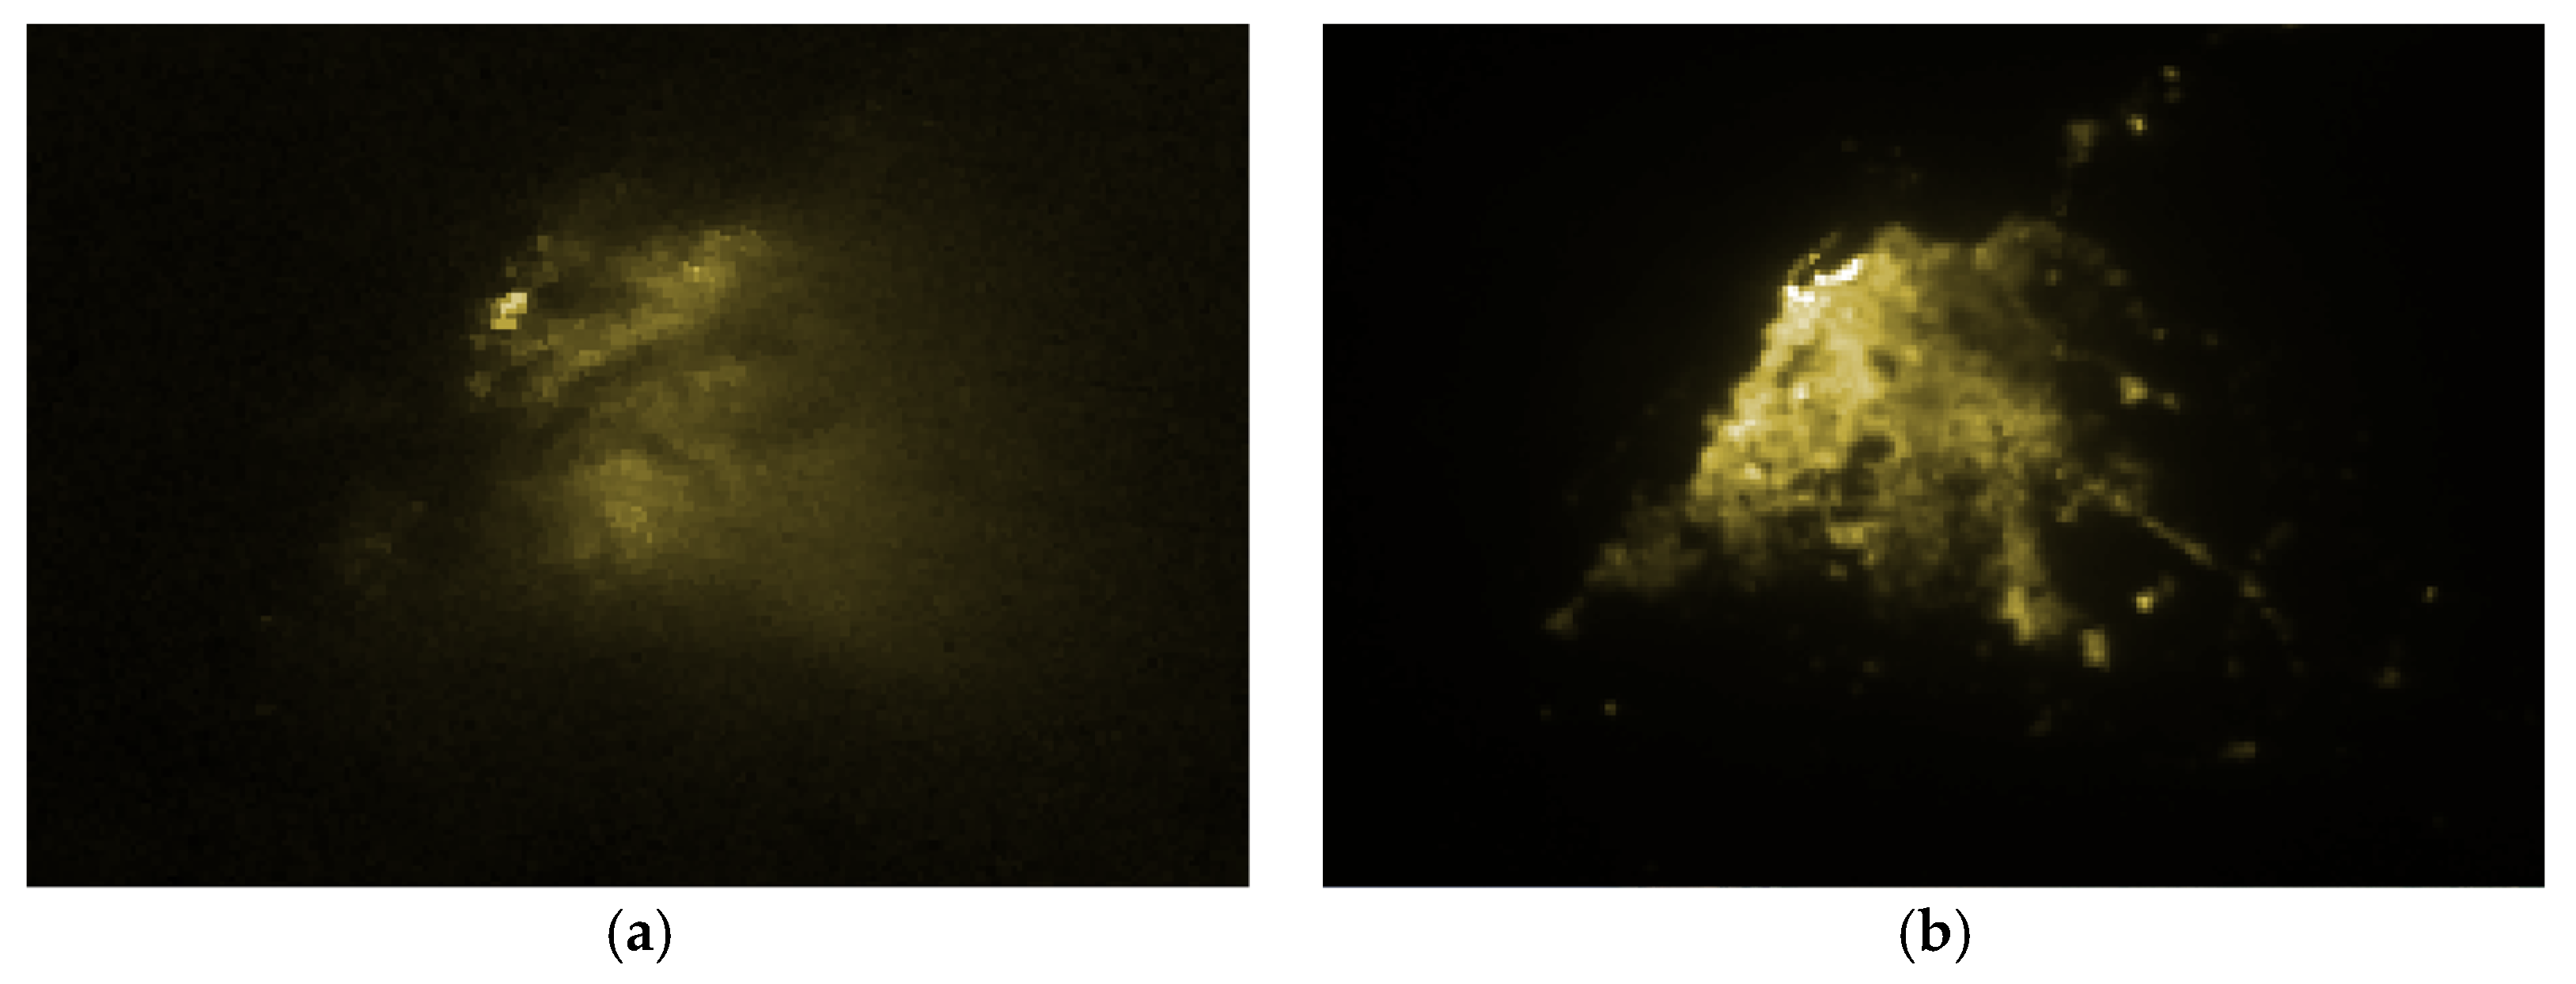
Night-time lights data: The Day/Night Band (DNB) sensor of the Visible Infrared Imaging Radiometer Suite (VIIRS) provides global daily measurements of nocturnal visible and near-infrared (NIR) light that is sensitive in lowlight conditions. It also allows for the generation of new science-quality night-time products. We used the daily VIIRS VNP46A1 product as the source for night-time light change observation [34]. DNB radiance band (DNB_At_Sensor_Radian ce_500 m) was used to create average night-time observation composition for April 2019 and April 2020. We used quality flag bands QF_Clound, QF_Cirrus, and QF_DNB to filter low-quality pixels. Moon illumination fractions were also adjusted using moon illumination information from the Moon_Illumination_Fraction band. We used the Moon_Illumination_Fraction layer included in the level-3 VNP46A1 data and subtracted moon illuminated fraction from radiance values to reduce the lunar effect. See Figure 2a,b below for a visual comparison between processed vs. unprocessed VIIRS night-time data.
Limitations with Night-Time Light: We only have 30 days of observations for each year—so ephemeral lights are not corrected.
We used level-3 VNP46A1 data available at LAADS DAAC [35]. Products such as black marble are not available; that is why level 3 data were used to demonstrate its utility despite some limitations. Future studies may consider using more advanced data products as they become available.
Median or mean: In theory, mean should be used to capture light values by sporadic activities in camps. However, mean values can be significantly affected by ephemeral lights. Median, however, can remove the effects of outliers and remove the signals from temporal activities. In light of these limitations, we report both the statistics.
Night-time light trend comparison: Changes in the NTL trend for the PAs and their surrounding areas were identified and then validated using high-resolution satellite imagery to identify the tourist camps, parking lots, and lodges. These are the most common locations where tourism-related activities take place captured through night-time lights data. We also performed the paired Wilcox test between the pair of median night-time light values between April 2019 and April 2020 at the African continent’s protected areas to confirm the changes in the night-time lights that we observed as statistically significant.
Research [36,37] shows that transition to LEDs may produce a reduction of the radiance on VIIRS, and therefore reduction in NTL intensity may not be solely due to the lockdown. However, studies [37] also suggest that transition to LED is least in Africa and that kerosine to dry-cell battery LED usage is more prevalent [38]. The Global Energy Review 2020 [39] has also indicated an overall reduction in electricity demand due to the pandemic. Therefore, it is unlikely that the observed changes in nighttime light within a span of one year (April 2019–April 2020) in and around the protected areas were due to LED transition. However future studies could explore the role of LED transition and observed NTL changes during the pandemic around protected areas in Africa.
3. Results
3.1. Change in Light Intensity in African PAs
The results show an overall decrease in the mean and median light intensity between the two years. The mean intensity for April 2019 was 0.37, whereas it decreased to 0.34 in April 2020, about an 8 percent decrease. Similarly, the median values also reduced from 0.32 to 0.28, a decline of about 12.5 percent. The paired Wilcox test reveals that the test’s p-value is < 2.2 × 10⁻¹⁶, which is less than the significance level alpha = 0.05. We can conclude that the median light intensity for 2020 is significantly less compared to 2019 (Figure 3).
Overall, 75 percent of the 8427 protected areas saw a decrease in light intensity in varying degrees. There is considerable heterogeneity in the changes captured in percentage values for the overall PAs, and the PAs showing the highest reduction in light intensity. The difference could be due to various factors, including differences in funding allocations for PAs, the enforcement of curfews, types of businesses around PAs, access to electricity, and the kind of mass tourism or proximity to urban areas.
Results indicate that fifty percent of PAs have about a 12 percent decrease in the mean light intensity, and 25 percent have seen a reduction of 23 percent or more in the studied period. The median decline in all the PAs was 13 percent overall, 13 percent in terrestrial, 4 percent in coastal and marine, and 8 percent decrease in the marine-only PAs.
An analysis of the proportion of PAs with decreased light intensity for each country reveals that almost all the PAs in all the countries saw a decrease in the light intensity by varying degrees (Figure 4). The map in Figure 4 below, based on an equal interval, reveals that 80–100 percent of PAs saw a reduction in night-time light intensity in most African countries. These include PAs in Botswana, Kenya, Namibia, and South Africa, heavily dependent on tourism revenues.
Less than 20% of PAs in Sierra Leone, Rwanda, and Burundi show a reduction in light intensity. It should be noted that rural access to electricity (% of rural population) in Burundi and Sierra Leone is less than 8% [40], which may explain why those countries see low change rates in light intensity.
Except for a few places, the light intensity has decreased overall for the same countries; for example, in Kenya and South Africa (Figure A1a,b in Appendix C). Minor increase in light intensity was observed in and around some of the coastal and marine protected areas in South Africa likely due to businesses catering to domestic customers to stay afloat.
3.2. Protected Areas with Maximum Decrease in Light Intensity
For the analysis, we have two subgroups—terrestrial and the other two, which included coastal and marine, and marine only PAs. The top 20 PAs within each of these two categories (Figure A2a,b). Seven of the top 20 terrestrial PAs that have seen the highest decrease in light intensity are from South Africa, followed by PAs in Nigeria and Kenya (Figure A2a). Similarly, eleven of the top 20 coastal and marine PAs that have seen the highest decrease in light intensity are also in South Africa (Figure A2b).
The Merja Zerga Biological Reserve in Morocco (Figure 5a), which has experienced the maximum drop in the light intensity, is also a Ramsar Site. It is a permanent hunting reserve known for intensive tourism activities, bird watching, fishing, grazing, and rush harvesting. High-resolution images of the area show decreased movement and economic activity, as demonstrated through the number of boats in the harbor and vehicles in the area (Figure 5a,b).
3.3. Change in Night-Time Light Intensity by IUCN PA Management Categories
We looked at the light intensity changes in the protected areas for the different IUCN PA Management Categories (Table A1 in Appendix B). The IUCN categories help the countries classify protected areas based on their primary management objectives [33,41].
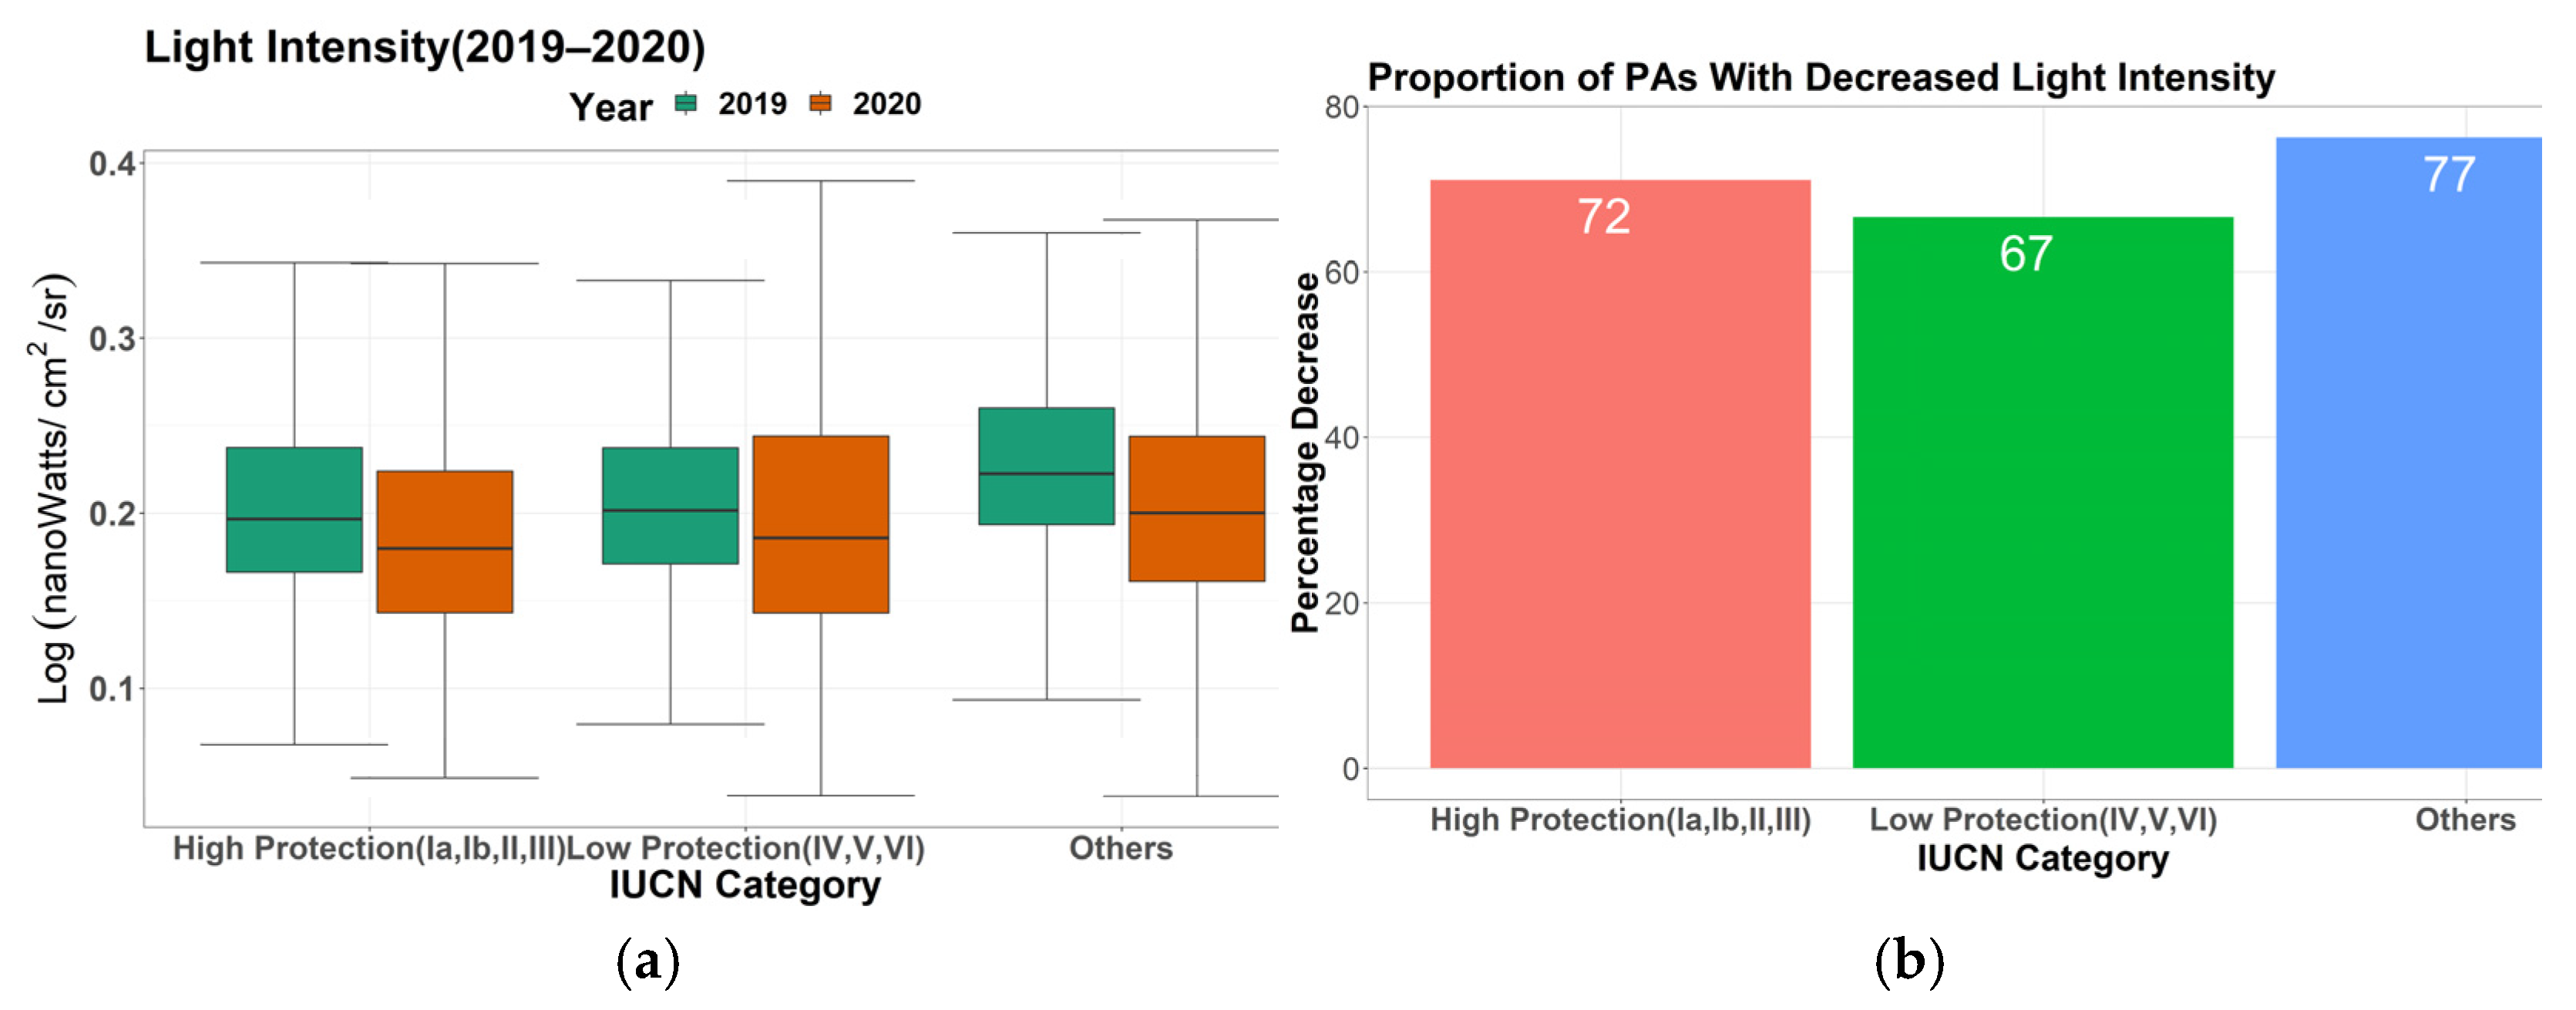
All the protected areas across the IUCN management categories show a decrease in the median value of light intensity in April 2020 (Figure A3a).
In terms of the proportion of total PAs showing a decrease irrespective of the intensity, more than 65 percent PAs across all management categories showed a decline in light intensity where 72 percent PAs under high protection saw a reduction in light intensity (Figure A3b).
The WDPA database also consists of protected areas that are Ramsar sites or World Heritage Sites (WHS). In total, there were 337 sites with international designations, which included 245 Ramsar Sites and Wetland of International Importance, 39 UNESCO-MAB Biosphere Reserves, and 53 World Heritage Sites (natural or mixed). All the WHS sites saw a decrease in the median and mean values (Table A2 in Appendix D). A similar trend was also seen in the Ramsar Sites.
In Kenya, Lake Nakuru saw the highest decrease by 56 percent, followed by Mejen Djebel in Tunisia by 50 percent. Among the MABs, the Zembra Zembretta IIes biosphere reserve in Tunisia saw the most decline in light intensity, by 49 percent. Among WHS, the Kenyan rift valley and the Okavango Delta in Botswana saw the maximum decrease by 45 and 38 percent, respectively.
In terms of the total proportion, 87 percent of Ramsar sites saw a decrease in light intensity, followed by 77 percent of the UNESCO MABs and 67 percent of the WHS (Figure 6).
3.4. Change in Night-Time Light Intensity by Governance Type
Protected areas exist under the authority of diverse actors, including governments, indigenous peoples and local communities, private actors, and combinations of these. The IUCN governance categories help classify PAs according to who holds authority, responsibility, and accountability for them [33,42]. Besides assessing change in light intensity in PAs by the IUCN management categories, we also looked at the changes in the light intensity in PAs by IUCN governance types.
All PAs across all governance categories show decreased light intensity (median value) in 2020 (Figure 7a). In terms of the proportion of total PAs showing a reduction in light intensity, more than 70 percent of PAs across all governance categories showed a decrease (Figure 7b). PAs managed by non-profits showed a smaller decline in light intensity.
The difference across these categories could be due to differences in funding sources, availability of emergency resources to maintain essential services, sustaining minimum operational requirements, and closing the protected areas.
3.5. Status in Popular PA Destinations
We chose three popular, biodiverse, and often-visited PA destinations in Africa—Serengeti, Masai Mara, and Hell’s Gate National Park to examine the decrease in light intensity. Overall, night-time light intensity decreased around all three national parks—Serengeti (−11 percent), Masai Mara (−23 percent), and HGNP (−23 percent), indicating a decrease in economic activity sparked by the pandemic induced lockdown and travel restrictions (Figure 8a–c).
Appendix A provides contextual information about these three parks and travel restrictions in the countries where they are located. In the absence of ground verification, the additional information helps explain the changes observed through the analysis of NTL data.
4. Discussion
The study demonstrates one of the many applications of NTL used as a proxy indicator for economic activities and highlights how the level of economic activity in its entirety has gone down around protected areas during the pandemic. This study also illustrates the utility of NTL as a low cost and efficient way of assessing impact when the traditional approaches could be challenging, posed by movement restrictions and time constraints. The findings reinforce what we are beginning to understand as the impact of lockdown and stay-at-home order on many economic sectors. The findings also indicate lockdown measures have been largely effective even in remote areas while highlighting the trade-off between controlling the pandemic and economic losses. Our study is the first to apply NTL to assess the change in economic activities around PAs in the context of COVID-19. The main challenge in using NTL for such rapid assessment is the lack of real-time analysis-ready data. We overcame this challenge by creating a monthly composite based on daily data, which was time-consuming. Future studies that focus on creating such a dataset could concentrate on providing analysis-ready datasets with lunar illumination correction. Such datasets would pave the way for rapid multitemporal analysis to trace change and the impact of economic recovery over time. As socio-economic data on the impacts of the lockdown become available, future studies can use these data sources for validation of the findings.
5. Conclusions
Protected areas can positively impact poverty reduction in developing countries, and nature-based tourism has been the critical strategy of conservation and development interventions to create a win–win situation for both nature and people. Long-term conservation and poverty reduction efforts around the protected and conserved areas depend on the tourism sector. Electrification in Africa has grown over the decades and has been used to assess economic activities. The method presented here shows how earth observation can be used to understand the extent of change in economic activities and provided a quick way to assess the reduction in economic impact and its spatial distribution. Future studies could also use NTL and traditional statistics to understand the pandemic’s impact in specific areas and PAs.
As governments and agencies discuss post COVID-19 recovery and focus on rebuilding their economies, spatially explicit data illustrated in this paper can be used to target alternative livelihoods, enterprise development, and conservation. The method can be further applied to identify the areas most affected in terms of economic loss, conservation value, and loss of livelihoods. Furthermore, remote sensing methods with selections of relevant indicators, as travel and mobility data become available at various scales, can be used to assess the efficacy of compliance measures, including restrictions on non-essential travel to control the pandemic.
Resuming tourism activities will be gradual, and reopening parks and facilities will be challenging. Most settlements around PAs are small and lack the necessary health care infrastructure, and could be overwhelmed by an influx of cases after reopening. Spatially explicit data can be used to monitor and plan in these areas, including around tourism facilities, and targeted for further research, and collection of microdata and perception data as part of the medium to long-term recovery efforts.
Author Contributions
Conceptualization, A.A. and D.-H.K.; methodology, A.A. and D.-H.K.; writing—original draft preparation, A.A. and D.-H.K.; writing—review and editing, A.A. and D.-H.K. All authors have read and agreed to the published version of the manuscript.
Funding
This research received no external funding.
Institutional Review Board Statement
Not Applicable.
Informed Consent Statement
Not Applicable.
Data Availability Statement
Publicly available datasets were analyzed in this study. This data can be found here: https://ladsweb.modaps.eosdis.nasa.gov/archive/allData/5000/VNP46A1/.
Acknowledgments
We thank the five anonymous reviewers for their feedback and comments that helped improve this paper’s quality.
Conflicts of Interest
The authors declare no conflict of interest. The views expressed in the manuscript are those of the authors and do not necessarily reflect the opinion or position of their employers.
Appendix A. Additional Information on Three National Parks and Travel Restrictions
Appendix A.1. Serengeti National Park, Tanzania
In Tanzania, tourism is one of the fastest-growing sectors and has contributed 17.5% of the GDP and 30% of the foreign exchange earnings in 2014/15. It is the second-highest employer after agriculture. Tanzania’s Serengeti National Park is well-known for its wildlife migration tourism and as its oldest protected area. It is both a World Heritage Site and a Biosphere Reserve. The Serengeti contributes substantially to the country’s revenue. It is a significant employment source centered on nature-based tourism activities, such as game viewing, safaris, bush meals, and visits to cultural and historical sites. The park accepts visitors throughout the year. However, the best season is between mid-May and mid-October. Available visitor records show that domestic and foreign tourists’ arrival has steadily increased with the highest number of visitors (1,196,284) in 2018/2019 in the past ten years. Tourist Facilities park includes nine public campsites, 140 seasonal campsites operated by private tour operators, two rest houses, six lodges, one youth hostel, bandas (thatched-roof huts), and tented lodges. COVID-19 containment measures in Tanzania have been markedly less strict than many neighboring states, with the government expressing the need to protect the economy rather locking the country down.
Appendix A.2. Maasai Mara Nature Reserve, Kenya
The Maasai Mara Nature Reserve, established as a world heritage site in 1989, is north of the Serengeti National Park. It is one of the world’s most famous tourist attractions and contributes significantly to Kenya’s economy. The Maasai Mara ecosystem is home to approximately 25% of Kenya’s wildlife. It is estimated that there are 200,000 visitors per year to the Maasai Mara [43]. Since the establishment of the first tourist lodge, Kekorok, in 1963, the Maasai Mara has seen more than 60 lodges open. Kenya is enforcing strict lockdown measures. Reports from Mara conservancies indicate no tourists in March–April 2020—the likelihood is that there will be next to no tourists in the ensuing year [44].
Appendix A.3. Hell’s Gate National Park, Kenya
Established in 1984, Hell’s Gate National Park is small and covers 68.25 square km. It is located in the northwestern part of Kenya around Lake Naivasha, approximately 100 km from Nairobi, 56 km from Nakuru, and 10 km from Naivasha town [45]. It is a popular destination for weekend getaways and retreats because of its proximity to urban areas. Explorers Fisher and Thomson in 1883 named it after a narrow opening in the cliffs, once a tributary of a prehistoric lake that fed early humans in the Rift Valley. The park also has a geothermal spa nearby, which is the only one of its kind in East and Central Africa [46]. It is home to a variety of savanna mammals and birds, including zebras and gazelles. The diverse topography and geological setting with towers and cliffs, trails, hot springs, and gorges offer a range of outdoor activities inside the Park. There are three campsites in the National Park—Endachata Campsite, Naiburta Campsite, and Oldubai Campsite. Park visitation dropped by 99 percent in national parks in Kenya at the height of the Covid-19 pandemic [47].
Appendix B

Table A1.
Protected area management categories’ definitions from IUCN 1.
| IUCN Category | Description | |
|---|---|---|
| Ia | Strict Nature Reserve | Strictly protected: human visitation, use, and impacts are strictly controlled and limited to ensure the protection of the conservation values Protect biodiversity and geological/geomorphic features Can serve as reference areas for scientific research and monitoring |
| Ib | Wilderness Area | Unmodified or slightly modified areas without permanent or significant human habitation Protected and managed to preserve their natural condition |
| II | National Park | Large natural or near natural areas Protect large-scale ecological processes, along with the complement of species and ecosystems characteristic of the area Provide a foundation for environmentally and culturally compatible, spiritual, scientific, educational, recreational, and visitor opportunities |
| III | Natural Monument or Feature | Protect a specific natural monument, which can be a landform, sea mount, submarine cavern, geological features such as a cave, or even a living feature such as an ancient grove Generally, quite small, protected areas and often have high visitor value |
| IV | Habitat Species Management Area | Protect particular species or habitats and management reflects this priority Can need regular, active interventions to address the requirements of specific species or to maintain habitats |
| V | Protected Landscape/Seascape | Interaction of people and nature over time has produced an area of distinct character with significant, ecological, biological, cultural, and scenic value Safeguarding the integrity of this interaction is vital to protecting and sustaining the area and its associated nature conservation and other values |
| VI | Protected area with sustainable use of natural resources | Conserve ecosystems and habitats together with associated cultural values and traditional natural resource management systems Most of the area in a natural condition, where a proportion is under sustainable natural resource management and where low-level non-industrial use of natural resources compatible with nature conservation |
1 Source: https://www.iucn.org.
Appendix C
Figure A1.
(a) Change in night light intensity in South Africa; (b) change in night light intensity in Kenya.
Figure A1.
(a) Change in night light intensity in South Africa; (b) change in night light intensity in Kenya.

Figure A2.
(a) Percentage decrease in light intensity in Terrestrial PAs with the highest decrease in the light intensity; (b) percentage decrease in light intensity in coastal and marine PAs with the highest decrease in the light intensity.
Figure A2.
(a) Percentage decrease in light intensity in Terrestrial PAs with the highest decrease in the light intensity; (b) percentage decrease in light intensity in coastal and marine PAs with the highest decrease in the light intensity.

Figure A3.
(a) Comparison of light intensity across IUCN categories; (b) proportion of PAs with decreased light intensity across IUCN categories.
Figure A3.
(a) Comparison of light intensity across IUCN categories; (b) proportion of PAs with decreased light intensity across IUCN categories.

Appendix D
Table A2.
The decrease in mean and median (light intensity) for PAs with international designations.
Table A2.
The decrease in mean and median (light intensity) for PAs with international designations.
| Sites | Mean Percentage Decrease | Median Percentage Decrease |
|---|---|---|
| Ramsar | −17.925 | −15.236 |
| UNESCO-MAB | −10.694 | −10.207 |
| World Heritage | −14.93 | −12.12 |
References
- WTTC. Urgent Appeal to International Community to Support African Travel and Tourism Sector. Available online: https://wttc.org/News-Article/Urgent-Appeal-to-International-Community-to-Support-African-Travel-and-Tourism-Sector (accessed on 14 June 2020).
- Towards Measuring the Economic Value of Wildlife Watching Tourism in Africa—Briefing Paper; World Tourism Organization (UNWTO) (Ed.) World Tourism Organization (UNWTO): Madrid, Spain, 2015; ISBN 978-92-844-1675-2. [Google Scholar]
- United Nations Environment Programme. Emerging Zoonotic Diseases and Links to Ecosystem Health—UNEP Frontiers 2016 Chapter. Available online: http://www.unenvironment.org/resources/emerging-zoonotic-diseases-and-links-ecosystem-health-unep-frontiers-2016-chapter (accessed on 27 April 2020).
- PROTECTED AREA EXECUTIVE DIRECTORS CONFERENCE The Impact of COVID-19 on Protected Areas Operations and Programmes Proceedings of the First Conference of Africa’s Heads of Protected Areas. 2020. Available online: https://www.iucn.org/sites/dev/files/content/documents/2020/report_on_the_impact_of_covid_19_doc_july_10.pdf (accessed on 15 July 2020).
- Hockings, M.; Dudley, N.; Ellio, W.; Napolitano, M.; MacKinnon, K.; Pasha, M.; Phillips, A.; Woodley, S.; Appleton, M.; Chassot, O.; et al. Editorial Essay: Covid-19 and Protected and Conserved Areas. Parks 2020, 26. Available online: https://parksjournal.com/wp-content/uploads/2020/06/Hockings-et-al-10.2305-IUCN.CH_.2020.PARKS-26-1MH.en_-1.pdf (accessed on 3 July 2020). [CrossRef]
- Lindsey, P.; Allan, J.; Brehony, P.; Dickman, A.; Robson, A.; Begg, C.; Bhammar, H.; Blanken, L.; Breuer, T.; Fitzgerald, K.; et al. Conserving Africa’s Wildlife and Wildlands through the COVID-19 Crisis and Beyond. Nat. Ecol. Evol. 2020, 1–11. [Google Scholar] [CrossRef]
- UNEP-WCMC; IUCN; NGS. Protected Planet Live Report 2021; UNEP-WCMC; IUCN; NGS: Cambridge UK; Gland, Switzerland; Washington, DC, USA, 2021; Available online: https://livereport.protectedplanet.net/chapter-2 (accessed on 16 January 2021).
- Watson, J.E.M.; Dudley, N.; Segan, D.B.; Hockings, M. The Performance and Potential of Protected Areas. Nature 2014, 515, 67–73. [Google Scholar] [CrossRef]
- Naidoo, R.; Gerkey, D.; Hole, D.; Pfaff, A.; Ellis, A.M.; Golden, C.D.; Herrera, D.; Johnson, K.; Mulligan, M.; Ricketts, T.H.; et al. Evaluating the Impacts of Protected Areas on Human Well-Being across the Developing World. Sci. Adv. 2019, 5, eaav3006. [Google Scholar] [CrossRef] [Green Version]
- Ferraro, P.J.; Hanauer, M.M. Quantifying Causal Mechanisms to Determine How Protected Areas Affect Poverty through Changes in Ecosystem Services and Infrastructure|PNAS. Available online: https://www.pnas.org/content/111/11/4332 (accessed on 16 June 2020).
- Balmford, A.; Green, J.M.H.; Anderson, M.; Beresford, J.; Huang, C.; Naidoo, R.; Walpole, M.; Manica, A. Walk on the Wild Side: Estimating the Global Magnitude of Visits to Protected Areas. PLOS Biol. 2015, 13, e1002074. [Google Scholar] [CrossRef] [Green Version]
- den Braber, B.; Evans, K.L.; Oldekop, J.A. Impact of Protected Areas on Poverty, Extreme Poverty, and Inequality in Nepal. Conserv. Lett. 2018, 11, e12576. [Google Scholar] [CrossRef]
- UNWTO. Covid-19 Related Travel Restrictions—A Global Review for Tourism; UNWTO: Madrid, Spain, 2020. [Google Scholar]
- Poletto, C.; Gomes, M.F.; Pastore y Piontti, A.; Rossi, L.; Bioglio, L.; Chao, D.L.; Longini, I.M., Jr.; Halloran, M.E.; Colizza, V.; Vespignani, A. Assessing the Impact of Travel Restrictions on International Spread of the 2014 West African Ebola Epidemic. Eurosurveillance 2014, 19. [Google Scholar] [CrossRef] [Green Version]
- Huber, C.; Finelli, L.; Stevens, W. The Economic and Social Burden of the 2014 Ebola Outbreak in West Africa. J. Infect. Dis. 2018, 218, S698–S704. [Google Scholar] [CrossRef]
- Sannino, A.; D’Emilio, M.; Castellano, P.; Amoruso, S.; Boselli, A. Analysis of Air Quality during the COVID-19 Pandemic Lockdown in Naples (Italy). Aerosol Air Qual. Res. 2021, 21, 200381. [Google Scholar] [CrossRef]
- Liu, Q.; Sha, D.; Liu, W.; Houser, P.; Zhang, L.; Hou, R.; Lan, H.; Flynn, C.; Lu, M.; Hu, T.; et al. Spatiotemporal Patterns of COVID-19 Impact on Human Activities and Environment in Mainland China Using Nighttime Light and Air Quality Data. Remote Sens. 2020, 12, 1576. [Google Scholar] [CrossRef]
- Ghosh, T.; Elvidge, C.D.; Hsu, F.-C.; Zhizhin, M.; Bazilian, M. The Dimming of Lights in India during the COVID-19 Pandemic. Remote Sens. 2020, 12, 3289. [Google Scholar] [CrossRef]
- Mellander, C.; Lobo, J.; Stolarick, K.; Matheson, Z. Night-Time Light Data: A Good Proxy Measure for Economic Activity? PLoS ONE 2015, 10, e0139779. [Google Scholar] [CrossRef] [Green Version]
- Aubrecht, C.; Jaiteh, M.; De Sherbinin, A. Global Assesment of Light Pollution Impact on Protected Areas; CIESIN: Palisades, NY, USA, 2010; Available online: http://www.ciesin.org/documents/light-pollution-Jan2010.pdf (accessed on 9 May 2020).
- Xiang, W.; Tan, M. Changes in Light Pollution and the Causing Factors in China’s Protected Areas, 1992–2012. Remote Sens. 2017, 9, 1026. [Google Scholar] [CrossRef] [Green Version]
- Henderson, J.V.; Storeygard, A.; Weil, D.N. Measuring Economic Growth from Outer Space. Am. Econ. Rev. 2012, 102, 994–1028. [Google Scholar] [CrossRef] [PubMed] [Green Version]
- Keola, S.; Andersson, M.; Hall, O. Monitoring Economic Development from Space: Using Nighttime Light and Land Cover Data to Measure Economic Growth. World Dev. 2015, 66, 322–334. [Google Scholar] [CrossRef]
- Ma, T.; Zhou, C.; Pei, T.; Haynie, S.; Fan, J. Quantitative Estimation of Urbanization Dynamics Using Time Series of DMSP/OLS Nighttime Light Data: A Comparative Case Study from China’s Cities. Remote Sens. Environ. 2012, 124, 99–107. [Google Scholar] [CrossRef]
- Shi, K.; Yu, B.; Huang, Y.; Hu, Y.; Yin, B.; Chen, Z.; Chen, L.; Wu, J. Evaluating the Ability of NPP-VIIRS Nighttime Light Data to Estimate the Gross Domestic Product and the Electric Power Consumption of China at Multiple Scales: A Comparison with DMSP-OLS Data. Remote Sens. 2014, 6, 1705–1724. [Google Scholar] [CrossRef] [Green Version]
- Zhang, Q.; Seto, K.C. Mapping Urbanization Dynamics at Regional and Global Scales Using Multi-Temporal DMSP/OLS Nighttime Light Data. Remote Sens. Environ. 2011, 115, 2320–2329. [Google Scholar] [CrossRef]
- Liu, Z.; He, C.; Zhang, Q.; Huang, Q.; Yang, Y. Extracting the Dynamics of Urban Expansion in China Using DMSP-OLS Nighttime Light Data from 1992 to 2008. Landsc. Urban Plan. 2012, 106, 62–72. [Google Scholar] [CrossRef]
- Elvidge, C.D.; Ghosh, T.; Hsu, F.-C.; Zhizhin, M.; Bazilian, M. The Dimming of Lights in China during the COVID-19 Pandemic. Remote Sens. 2020, 12, 2851. [Google Scholar] [CrossRef]
- Jechow, A.; Hölker, F. Evidence That Reduced Air and Road Traffic Decreased Artificial Night-Time Skyglow during COVID-19 Lockdown in Berlin, Germany. Remote Sens. 2020, 12, 3412. [Google Scholar] [CrossRef]
- UNEP-WCMC and IUCN Protected Planet: The World Database on Protected Areas (WDPA). Available online: https://www.protectedplanet.net/ (accessed on 14 June 2020).
- Liu, X.; Blackburn, T.M.; Song, T.; Wang, X.; Huang, C.; Li, Y. Animal Invaders Threaten Protected Areas Worldwide. Nat. Commun. 2020, 11, 2892. [Google Scholar] [CrossRef] [PubMed]
- UNEP-WCMC and IUCN Protected Planet—Technical Resources: Calculating Protected Area Coverage. Available online: https://www.protectedplanet.net/c/calculating-protected-area-coverage (accessed on 14 June 2020).
- UNEP-WCMC. User Manual for the World Database on Protected Areas and World Database on Other Effective Area-based Conservation Measures: 1.6; UNEP-WCMC: Cambridge, UK, 2019; Available online: http://wcmc.io/WDPA_Manual (accessed on 9 May 2020).
- Román, M.O.; Wang, Z.; Sun, Q.; Kalb, V.; Miller, S.D.; Molthan, A.; Schultz, L.; Bell, J.; Stokes, E.C.; Pandey, B.; et al. NASA’s Black Marble Nighttime Lights Product Suite. Remote Sens. Environ. 2018, 210, 113–143. [Google Scholar] [CrossRef]
- Data Processing Levels|Earthdata. Available online: https://earthdata.nasa.gov/collaborate/open-data-services-and-software/data-information-policy/data-levels/ (accessed on 29 December 2020).
- Coesfeld, J.; Anderson, S.J.; Baugh, K.; Elvidge, C.D.; Schernthanner, H.; Kyba, C.C.M. Variation of Individual Location Radiance in VIIRS DNB Monthly Composite Images. Remote Sens. 2018, 10, 1964. [Google Scholar] [CrossRef] [Green Version]
- Kyba, C.C.M.; Kuester, T.; de Miguel, A.S.; Baugh, K.; Jechow, A.; Hölker, F.; Bennie, J.; Elvidge, C.D.; Gaston, K.J.; Guanter, L. Artificially Lit Surface of Earth at Night Increasing in Radiance and Extent. Sci. Adv. 2017, 3, e1701528. [Google Scholar] [CrossRef] [Green Version]
- Bensch, G.; Peters, J.; Sievert, M. The Lighting Transition in Rural Africa—From Kerosene to Battery-Powered LED and the Emerging Disposal Problem. Energy Sustain. Dev. 2017, 39, 13–20. [Google Scholar] [CrossRef]
- Global Energy Review 2020—Analysis. Available online: https://www.iea.org/reports/global-energy-review-2020 (accessed on 29 December 2020).
- World Bank Access to Electricity, Rural (% of Rural Population)—Sub-Saharan Africa|Data. Available online: https://data.worldbank.org/indicator/EG.ELC.ACCS.RU.ZS?locations=ZG (accessed on 14 June 2020).
- Dudley, N. Guidelines for Applying Protected Area Management Categories; IUCN: Gland, Switzerland, 2008; ISBN 978-2-8317-1086-0. [Google Scholar]
- Borrini-Feyerabend, G.; Dudley, N.; Jaeger, T.; Lassen, B.; Pathak Broome, N.; Phillips, A.; Sandwith, T. Governance of Protected Areas: From understanding to action. Best Practice Protected Area Guidelines Series No. 20; IUCN: Gland, Switzerland, 2013; ISBN 978-2-8317-1608-4. [Google Scholar]
- Onchwati, J.; Sommerville, H.; Brockway, N. Sustainable tourism development in the Masai Mara National Reserve, Kenya, East Africa. WIT Trans. Ecol. Environ. 2010, 139, 319–330. [Google Scholar]
- Mara Conservancy April 2020. Available online: https://www.maratriangle.org/november-2016-1/april-2020 (accessed on 17 June 2020).
- KWS 2020 Hells Gate National Park|Kenya Wildlife Service. Available online: http://www.kws.go.ke/content/hells-gate-national-park (accessed on 5 January 2021).
- Kariuki, P.G.; Onyiengo, D.Z.; Odhiambo, S.P.O. Influence of Critical Success Factors on Competitive Position of Hell’s Gate National Park as a Tourist Destination. IOSR-JBM 2016, 18, 4. [Google Scholar]
- The Standard. Available online: https://www.standardmedia.co.ke/adblock?u=https%3A%2F%2Fwww.standardmedia.co.ke%2Frift-valley%2Farticle%2F2001388437%2Fhells-gate-national-park-welcomes-more-visitors (accessed on 5 January 2021).
Figure 1.
Google mobility trends for parks in Africa. As per the Google mobility data, parks typically refer to official national parks and not the general outdoors found in rural areas.
Figure 1.
Google mobility trends for parks in Africa. As per the Google mobility data, parks typically refer to official national parks and not the general outdoors found in rural areas.

Figure 2.
(a) Luanda city area in Angola is seen in unprocessed VIIRS night-time data acquired on 16 April 2020; (b) the image shows the same location in the processed VIIRS night-time data corrected for moon illumination and bad pixels using quality flags and then compositing for the entirety of April 2020.

Figure 3.
Comparison of night-time lights intensity between 2019 and 2020.

Figure 4.
Map showing the proportion of protected areas (PAs) with decreased light intensity.

Figure 5.
Decrease in tourism activity can be seen in the decreased numbers of vehicles in the parking area at Merja Zerga, a Ramsar Site. (a) Before the pandemic in April 2019; (b) during the pandemic in April 2020. (Image© 2021 Digital Globe, NextView License).
Figure 5.
Decrease in tourism activity can be seen in the decreased numbers of vehicles in the parking area at Merja Zerga, a Ramsar Site. (a) Before the pandemic in April 2019; (b) during the pandemic in April 2020. (Image© 2021 Digital Globe, NextView License).

Figure 6.
The proportion of PAs with decreased light intensity across international designations.

Figure 7.
(a) Comparing light intensity across governance types; (b) proportions of PAs with decreased light intensity across governance types.
Figure 7.
(a) Comparing light intensity across governance types; (b) proportions of PAs with decreased light intensity across governance types.

Figure 8.
On the left part of each panel, satellite images show the popular tourist lodges, camp settlements, and markets around the three parks. The NTL data for these same sites, showing before (in the middle part of each panel) and after (right part of each panel), indicate that the locations have undergone a decrease in the light intensity. (a) Serengeti National Park; (b) Masai Mara; (c) Hell’s Gate National Park.

Publisher’s Note: MDPI stays neutral with regard to jurisdictional claims in published maps and institutional affiliations. |
© 2021 by the authors. Licensee MDPI, Basel, Switzerland. This article is an open access article distributed under the terms and conditions of the Creative Commons Attribution (CC BY) license (http://creativecommons.org/licenses/by/4.0/).
Share and Cite
MDPI and ACS Style
Anand, A.; Kim, D.-H. Pandemic Induced Changes in Economic Activity around African Protected Areas Captured through Night-Time Light Data. Remote Sens. 2021, 13, 314. https://doi.org/10.3390/rs13020314
AMA Style
Anand A, Kim D-H. Pandemic Induced Changes in Economic Activity around African Protected Areas Captured through Night-Time Light Data. Remote Sensing. 2021; 13(2):314. https://doi.org/10.3390/rs13020314
Chicago/Turabian StyleAnand, Anupam, and Do-Hyung Kim. 2021. "Pandemic Induced Changes in Economic Activity around African Protected Areas Captured through Night-Time Light Data" Remote Sensing 13, no. 2: 314. https://doi.org/10.3390/rs13020314
Note that from the first issue of 2016, this journal uses article numbers instead of page numbers. See further details here.