Deep Learning System for COVID-19 Diagnosis Aid Using X-ray Pulmonary Images


Architecture and Computer Technology Department (Universidad de Sevilla), E.T.S Ingeniería Informática, Reina Mercedes Avenue, 41012 Seville, Spain
*
Author to whom correspondence should be addressed.
Appl. Sci. 2020, 10(13), 4640; https://doi.org/10.3390/app10134640
Submission received: 2 June 2020
/
Revised: 22 June 2020
/
Accepted: 2 July 2020
/
Published: 5 July 2020
(This article belongs to the Special Issue Fighting COVID-19: Emerging Techniques and Aid Systems for Prevention, Forecasting and Diagnosis)
Abstract
:Featured Application
This work has direct applications to COVID-19 diagnosis.
Abstract
The spread of the SARS-CoV-2 virus has made the COVID-19 disease a worldwide epidemic. The most common tests to identify COVID-19 are invasive, time consuming and limited in resources. Imaging is a non-invasive technique to identify if individuals have symptoms of disease in their lungs. However, the diagnosis by this method needs to be made by a specialist doctor, which limits the mass diagnosis of the population. Image processing tools to support diagnosis reduce the load by ruling out negative cases. Advanced artificial intelligence techniques such as Deep Learning have shown high effectiveness in identifying patterns such as those that can be found in diseased tissue. This study analyzes the effectiveness of a VGG16-based Deep Learning model for the identification of pneumonia and COVID-19 using torso radiographs. Results show a high sensitivity in the identification of COVID-19, around 100%, and with a high degree of specificity, which indicates that it can be used as a screening test. AUCs on ROC curves are greater than 0.9 for all classes considered.
1. Introduction
Coronaviruses are enveloped, unsegmented, and positive-sense single-stranded RNA viruses. Six species of coronavirus are known to cause disease in humans, most of them generally cause mild respiratory disease; however, fatal coronaviruses have periodically emerged in recent decades, such as the 2002 Severe Acute Respiratory Syndrome Coronavirus (SARS-CoV) and the Middle East Respiratory Syndrome Coronavirus in 2012. In December 2019, the Office of the World Health Organization in China was informed of cases of pneumonia of unknown etiology detected in Wuhan, and a new coronavirus, called SARS-CoV-2, was extracted from samples of the lower respiratory tract of several patients [1].
Since then, until June 1st of 2020, more than 6.18 million cases have been confirmed worldwide, and the infection has spread to many countries around the world. USA has the highest rate in America with more than 1.79 million cases and more than 104,000 deaths. In Europe, Spain has one of the highest rates with more than 239,000 confirmed infections and more that 27,000 deaths [2]. On March 11th of 2020, the World Health Organization (WHO) declared the infection as a pandemic and, since then, several countries have applied restriction measures to their population in order to reduce the spread of the disease [3].
The most common symptoms of the disease related to SARS-CoV-2, called Coronavirus Disease 2019 or COVID-19 by WHO on Feb 11th of 2020, are fever, weakness, cough, and diarrhea. More than half of patients report shortness of breath and few develop acute respiratory distress syndrome. After septic shock, refractory metabolic acidosis and coagulation dysfunction can lead to death, with a fatality rate about 6% worldwide [4]. Some countries has a higher death rate, like United Kingdom and Italy with a value around 14%, and Spain with a 11.3%.
Person-to-person transmission occurs primarily through direct contact or air drops. The highest risk of transmission is within about 1 meter of the infected person; however, the maximum distance is still undetermined [5].
Most countries are using a huge amount of clinical and epidemiologic information to determine who should be tested. According to empirical studies like Reference [6] or Reference [7], most patients with confirmed COVID-19 develop fever and/or symptoms of acute respiratory illness (like cough or difficulty breathing). If a person is under investigation, it is recommended that practitioners immediately put in place infection control and prevention measures.
The first recommendation is testing for all other sources of respiratory infection (to exclude COVID-19). Moreover, in order to assist in the decision making process and to determine who to test, some epidemiologic factors are recommended to be used. These factors include anyone who has had close contact with a patient with laboratory-confirmed COVID-19 within 14 days of symptom onset or a history of travel from affected geographic areas [8].
Once, these factors determine that testing should be done, the WHO recommends collecting specimens from both the upper respiratory tract (naso and oropharyngeal samples) and lower respiratory tract such as expectorated sputum, endotracheal aspirate, or Bronchoalveolar Lavage (BAL) [9]; but the collection of BAL samples should only be performed in mechanically ventilated patients as lower respiratory tract samples seem to remain positive for a more extended period. All the samples require storage at four degrees celsius.
In the laboratory, the amplification of the genetic material extracted from the saliva and/or mucus samples are carried out through a Reverse Transcription Polymerase Chain Reaction (RT-PCR), which involves the synthesis of a double-stranded DNA molecule from an RNA mold [10]. Once the genetic material is enough, the search is done for those portions of the genetic code of the COVID-19 that are conserved. This comparison is performed using the initial gene sequence released by the Shanghai Public Health Clinical Center & School of Public Health (Fudan University, Shanghai, China), and subsequent confirmatory evaluation by additional labs. If the test result is positive, it is recommended that the test is repeated for verification. In patients with confirmed COVID-19 diagnosis, the laboratory evaluation should be repeated to evaluate for viral clearance prior to being released from observation.
As detailed above, actual procedures to diagnose COVID-19 patients require several hours to obtain a result. Moreover, those exams may be negative if the patient was infected recently.
In other viral diseases that affects breathing, such as influenza or SARS, the damage produced to the lungs can be observed using pulmonary X-ray images. The works presented in Reference [11,12] detailed these effects in influenza, while other works like Reference [13,14] explain the effects in SARS patients.
So, it is logical to think that this relationship is maintained with COVID-19 patients, since this disease mainly attacks the lungs. However, classic pneumonia patients experience some symptoms similar to those COVID-19 patients in the early stages of the contagion, although with lower virulence. Even so, this fact must be taken into account to correctly diagnose this disease.
However, the study of medical images has experienced a great progress with the inclusion of Machine Learning systems capable of automatically extract the necessary characteristics to make a correct diagnosis [15].
Moreover, in the last years these technology has evolved to a concrete branch known as Deep learning. While in Machine Learning the user gives the system a huge amount of rules to solve the problem, in Deep Learning the user gives the system a network model and only a few instructions to modify the model when errors occur. So, using Deep Learning, it is easier and faster to train the classification system.
All of them require a dataset made up of several images corresponding to ill patients and healthy patients (all of them previously labeled by a professional). Using this knowledge, neural network-based systems are able to automatically analyze those images and extract the characteristics necessary to diagnose the illness.
These systems require several steps like a pre-processing stage, the correct choice of the network architecture, a training stage (that sometimes requires supervision), among others. In Deep Learning systems, although the network model is already established, it is very common to use a pre-processing step to adapt the inputs to the ones needed by that model.
These techniques have been used in multiple industrial and medical systems, obtaining very good results [16,17]. Regarding its application to the medical images analysis, there are several studies that demonstrate that the results obtained are better that the ones obtained by classical diagnostic systems [18]. Furthermore, its application and effectiveness have been proven in other works [19,20,21].
So, based on these premises, this work consists of using Machine Learning techniques applied to medical X-ray images of the lung of the patients to obtain an aid system for COVID-19 diagnosis. It is important to emphasize that there are other imaging tools to detect COVID-19 like RM or CT; however, the objective of this work is not to obtain images from patients, but using an existing dataset that meets all the requirements.
And, to achieve this purpose, a public dataset that contains X-ray images about healthy, pneumonia and COVID-19 patients all over the world is used. This dataset has mainly X-ray images and this is the justification of choosing X-ray images.
With the information included in the dataset, a Deep Learning system is trained and the classification results are detailed in this work.
The rest of the paper is divided in the following way—first, the dataset and the system’s architecture are described in the Materials and Methods section, including the different stages implemented for it. Next, the results obtained after the training process in Keras and the evaluation of them are detailed and explained in the Results and Discussion section. Finally, conclusions are presented.
2. Materials and Methods
In this section, the dataset used for this work and the system’s architecture are detailed. First, the dataset is presented.
2.1. Dataset
We are using a publicly available dataset with X-ray images from healthy, pneumonia and covid-19 patients publicly available at https://public.roboflow.ai/classification/covid-19-and-pneumonia-scans. The dataset was split for training and assessment using the Hold-out technique, consisting of randomly selecting a sample subset for the training of the models, and using the remaining subset to assess the model performance. A subset with the 80% of dataset samples was used for training, while the remaining 20% subset was used for evaluation. Table 1 shows the distribution.
Preliminary results using the established data set provided some outliers, with confidence values far removed from the rest of true positives. An analysis of these specific cases established that they were particular X-ray images showing the patient’s torso from a lateral perspective. Additionally, the dataset also included few Magnetic Resonance images. Due to the small number of images in the dataset of these two types, and the fact that they are all of the COVID-19 class, a model with so many parameters cannot assimilate and generalize the characteristics necessary to classify them correctly. Considering that the X-rays taken from the front are the most common and that their performance in medical centers do not imply any type of difficulty in relation to other anatomical planes, restricting the use of the model to classify frontal images is not a relevant limitation.
So, finally those images were not taken into account for training nor for testing, including a pre-processing stage to eliminate them before starting with the training process.
2.2. Processing Architecture
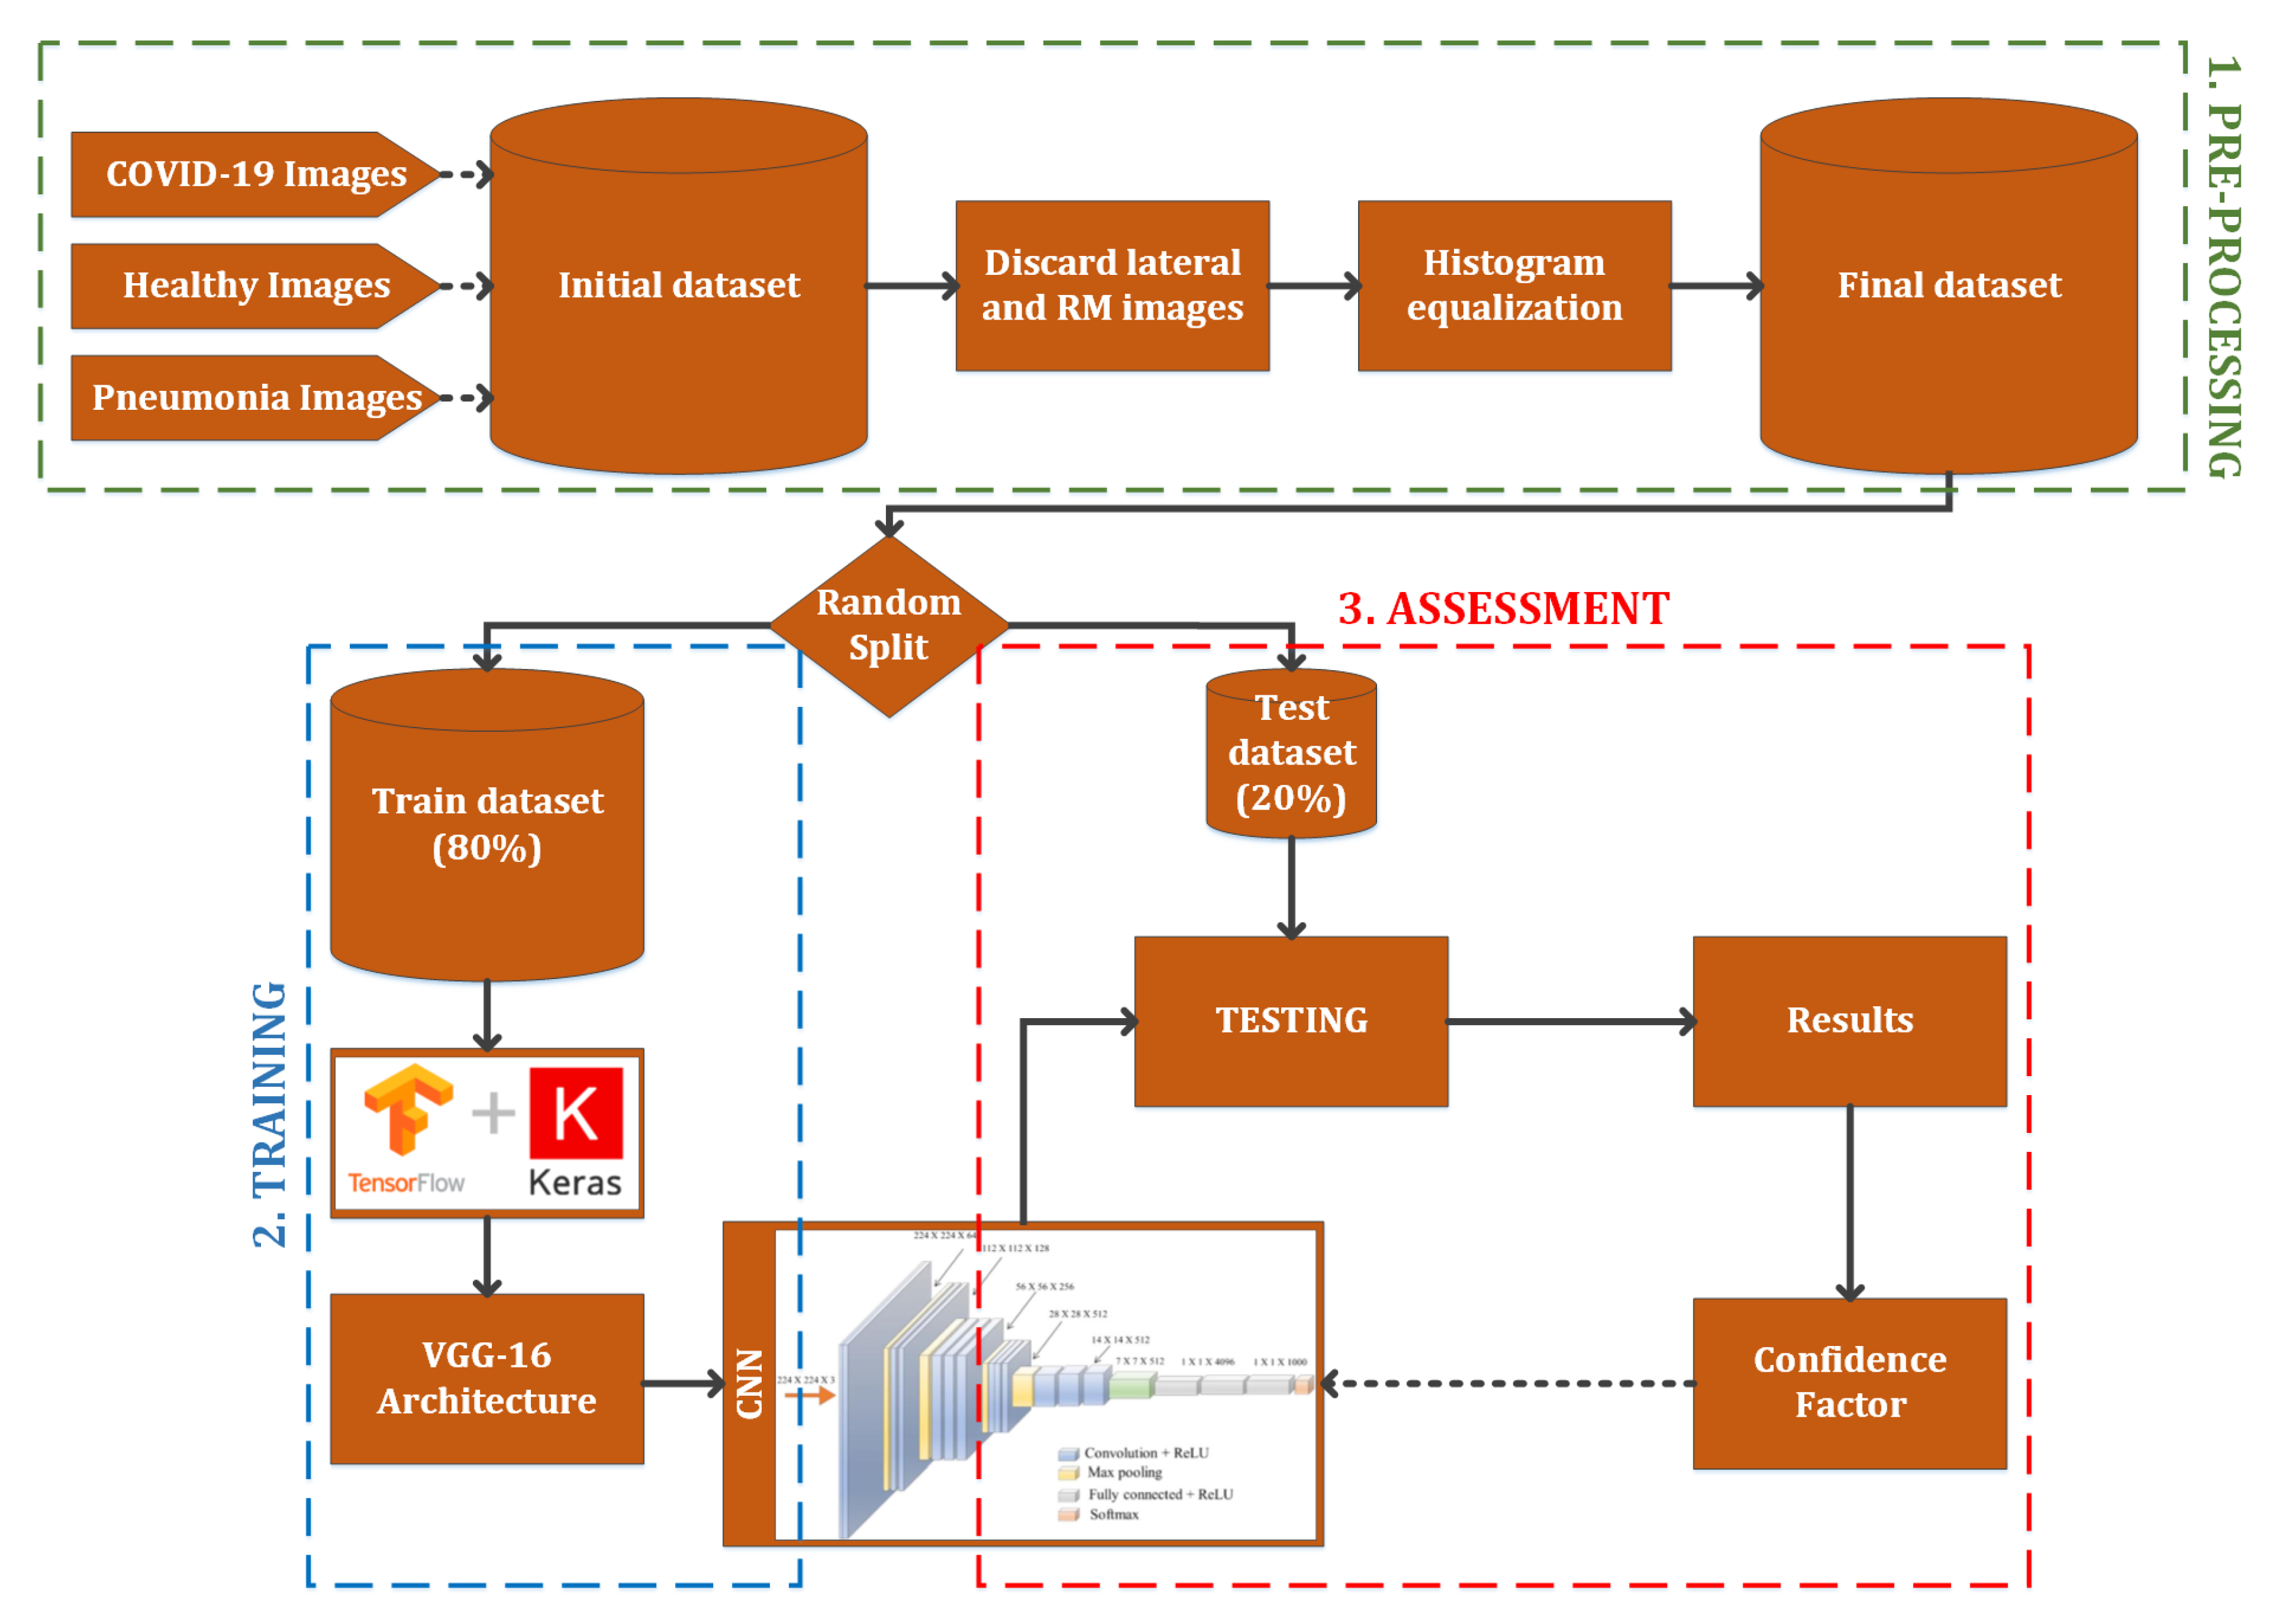
The architecture used for this work is based on a VGG-16 model trained using TensorFlow with Keras, a pre-processing stage and a final classification using the confidence parameter obtained after the training. This architecture can be observed in Figure 1. These stages are detailed below:
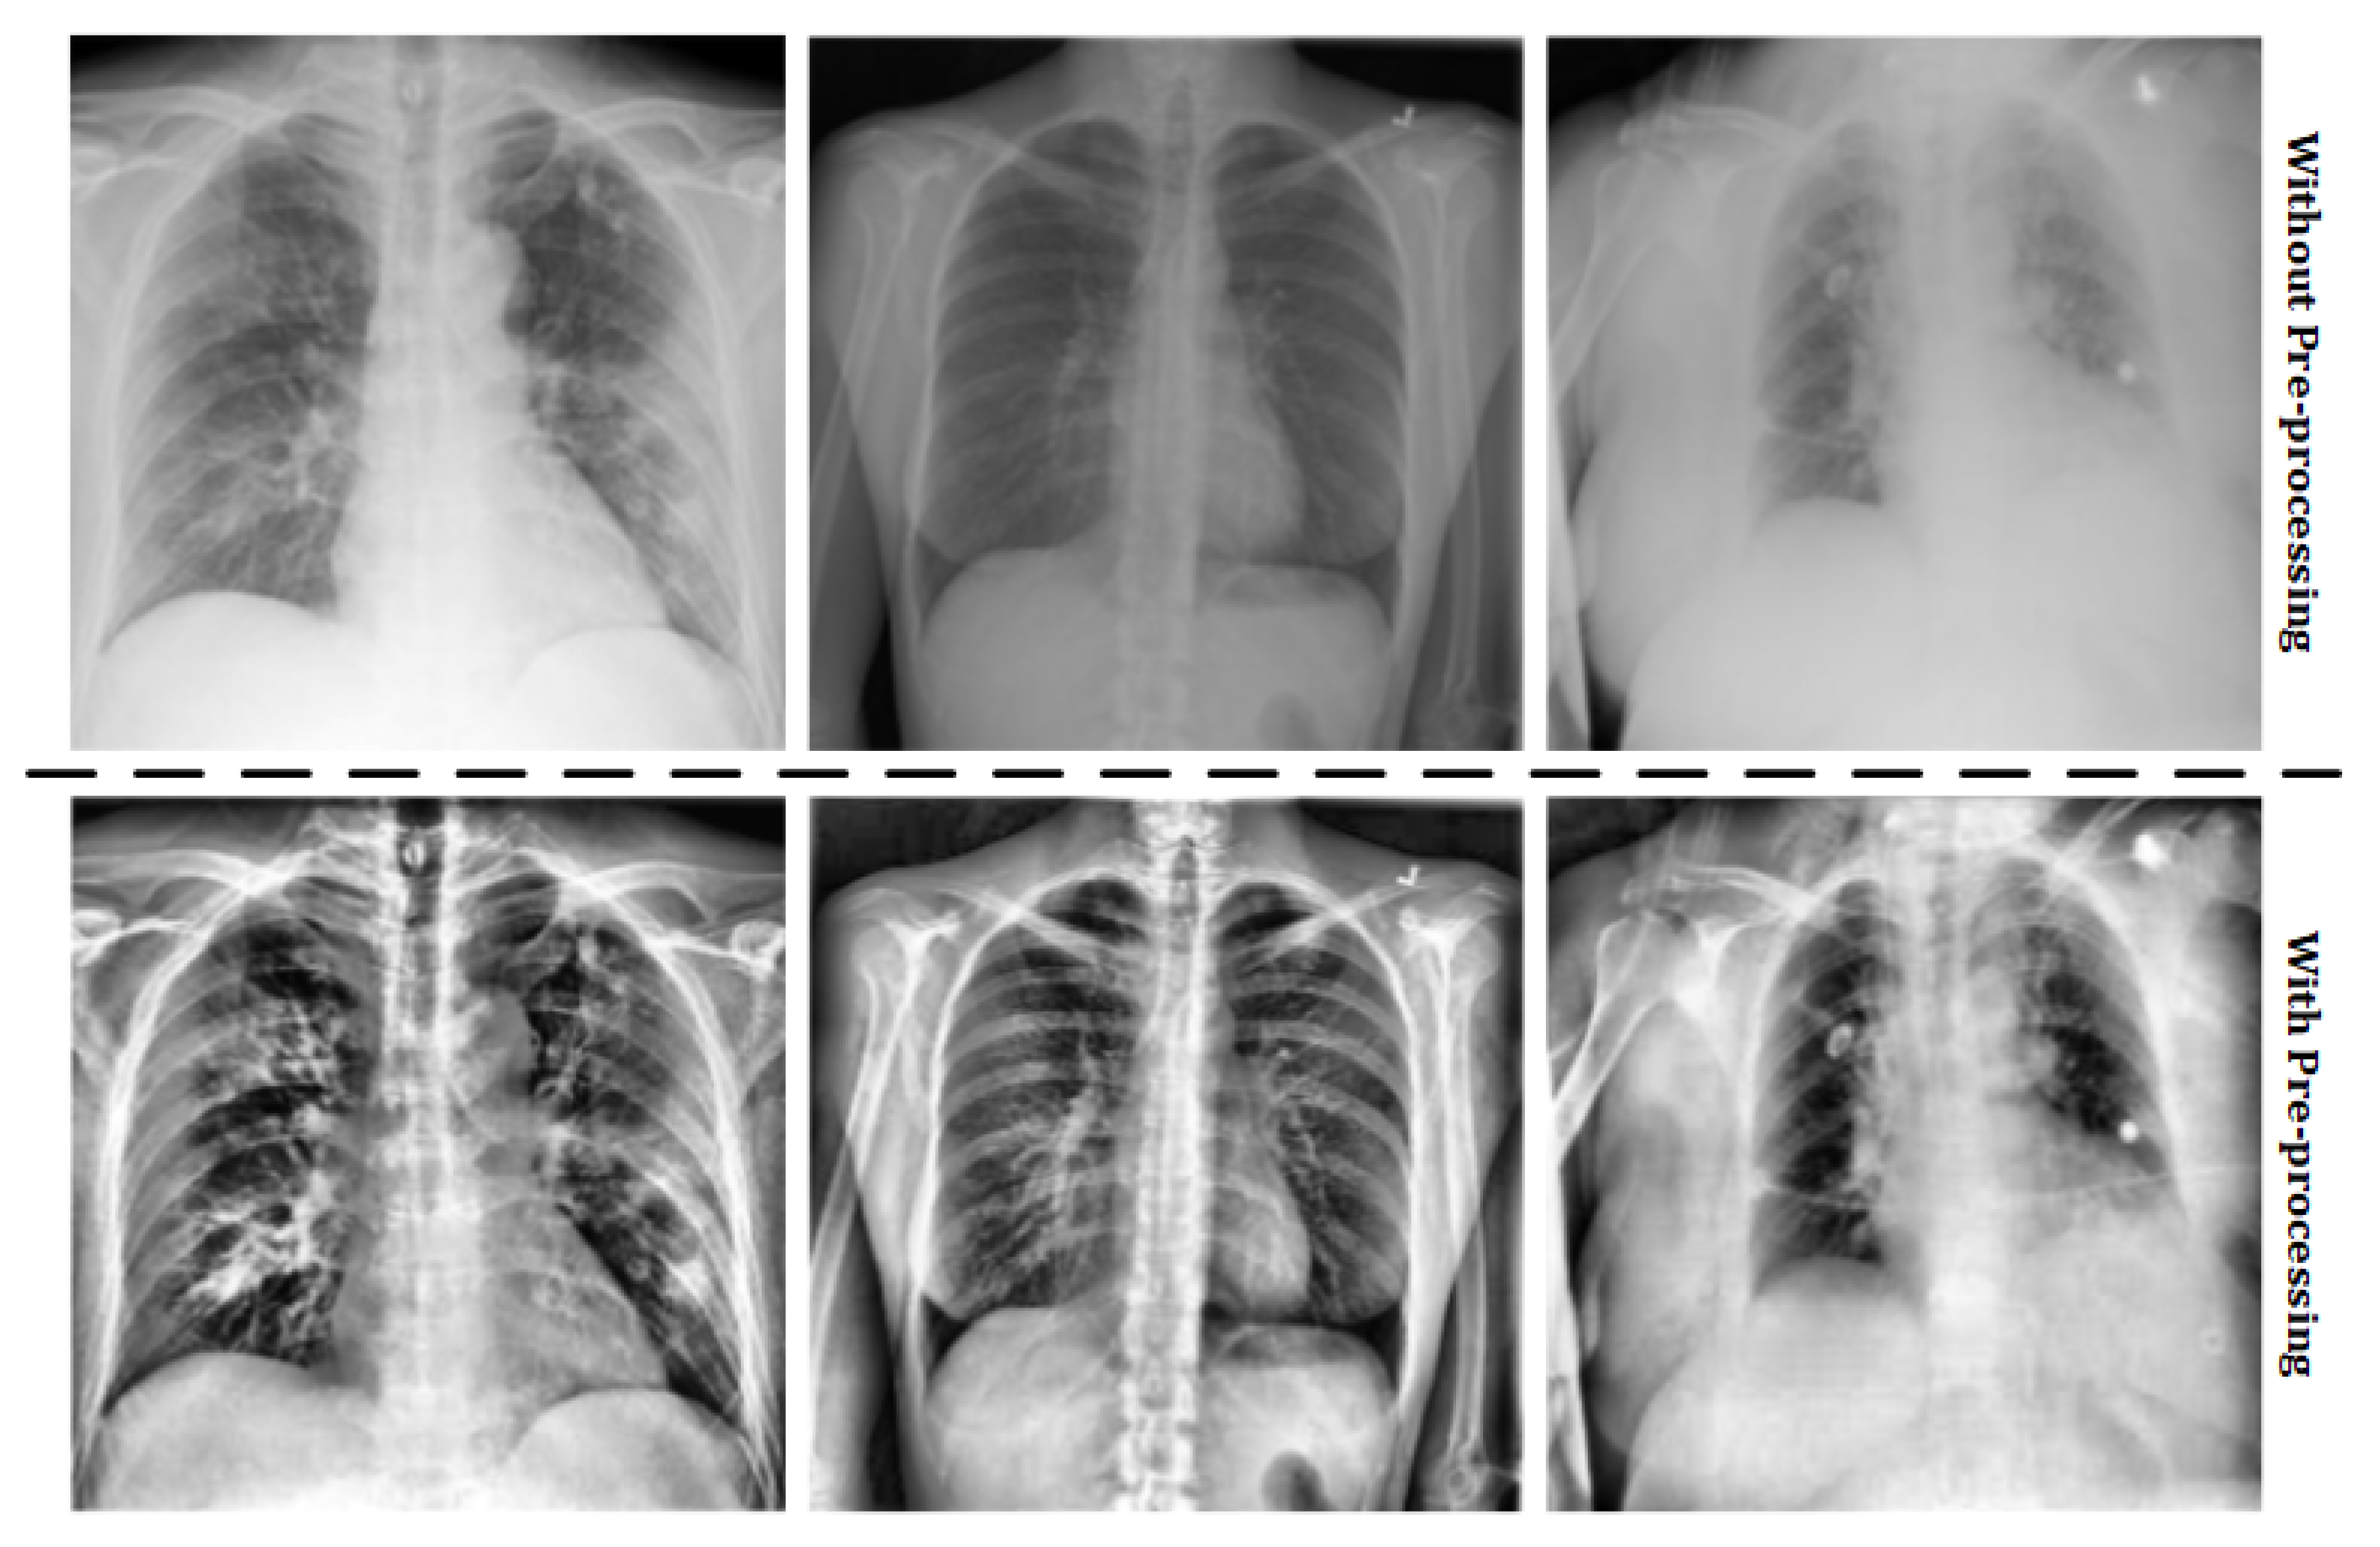
- Pre-processing: the images stored in the original dataset contains lung X-ray images of healthy patients, patients with pneumonia and COVID-19 positives. However, some images of the COVID-19 positive cases were not obtained with the same parameters as detailed above, so these images must not be taken into account. Moreover, in order to work with images of the same characteristics, an histogram equalization is applied. These two treatments compose the pre-processing stage. The results of the pre-processing step can be observed in Figure 2.
- Training: using TensorFlow framework with Keras, a VGG-16 architecture [22] is implemented and combined with a final inference layer to train a classification system with three classes (healthy, pneumonia and COVID-19). The output of this stage is the convolutional neural network model.
- Assessment: after the model is obtained, the testing dataset is used to evaluate the classification effectiveness, obtaining a confidence factor. This one is used to analyze the CNN performance in order to evaluate the usefulness as a diagnostic tool.
Once the system architecture and the dataset used to obtain the classification mechanism have been specified, the results obtained will be presented in the next section.
3. Results and Discussion
The model training was performed with an initial learning rate of 0.001, a batch size of 32 images and 40 epochs. The used optimizer was an Adam with a learning rate decay equal to the initial learning rate divided by the number of training epochs.
Effectiveness Results
We compared the effectiveness using different metrics, distinguishing between micro and macro metrics.
Macro metrics average the unweighted mean per label. They include accuracy, sensitivity (also named macro recall), specificity, macro precision and macro F1-score.
where m index refers to macro metric and . The term refers to the number of samples with class c that were classified correctly as c. The term means the set of samples with different class of c that were classified as c by the model. refers to the set of samples with class c that were classified as other different class. indicates the number of samples with a class other than c that were not classified as c.
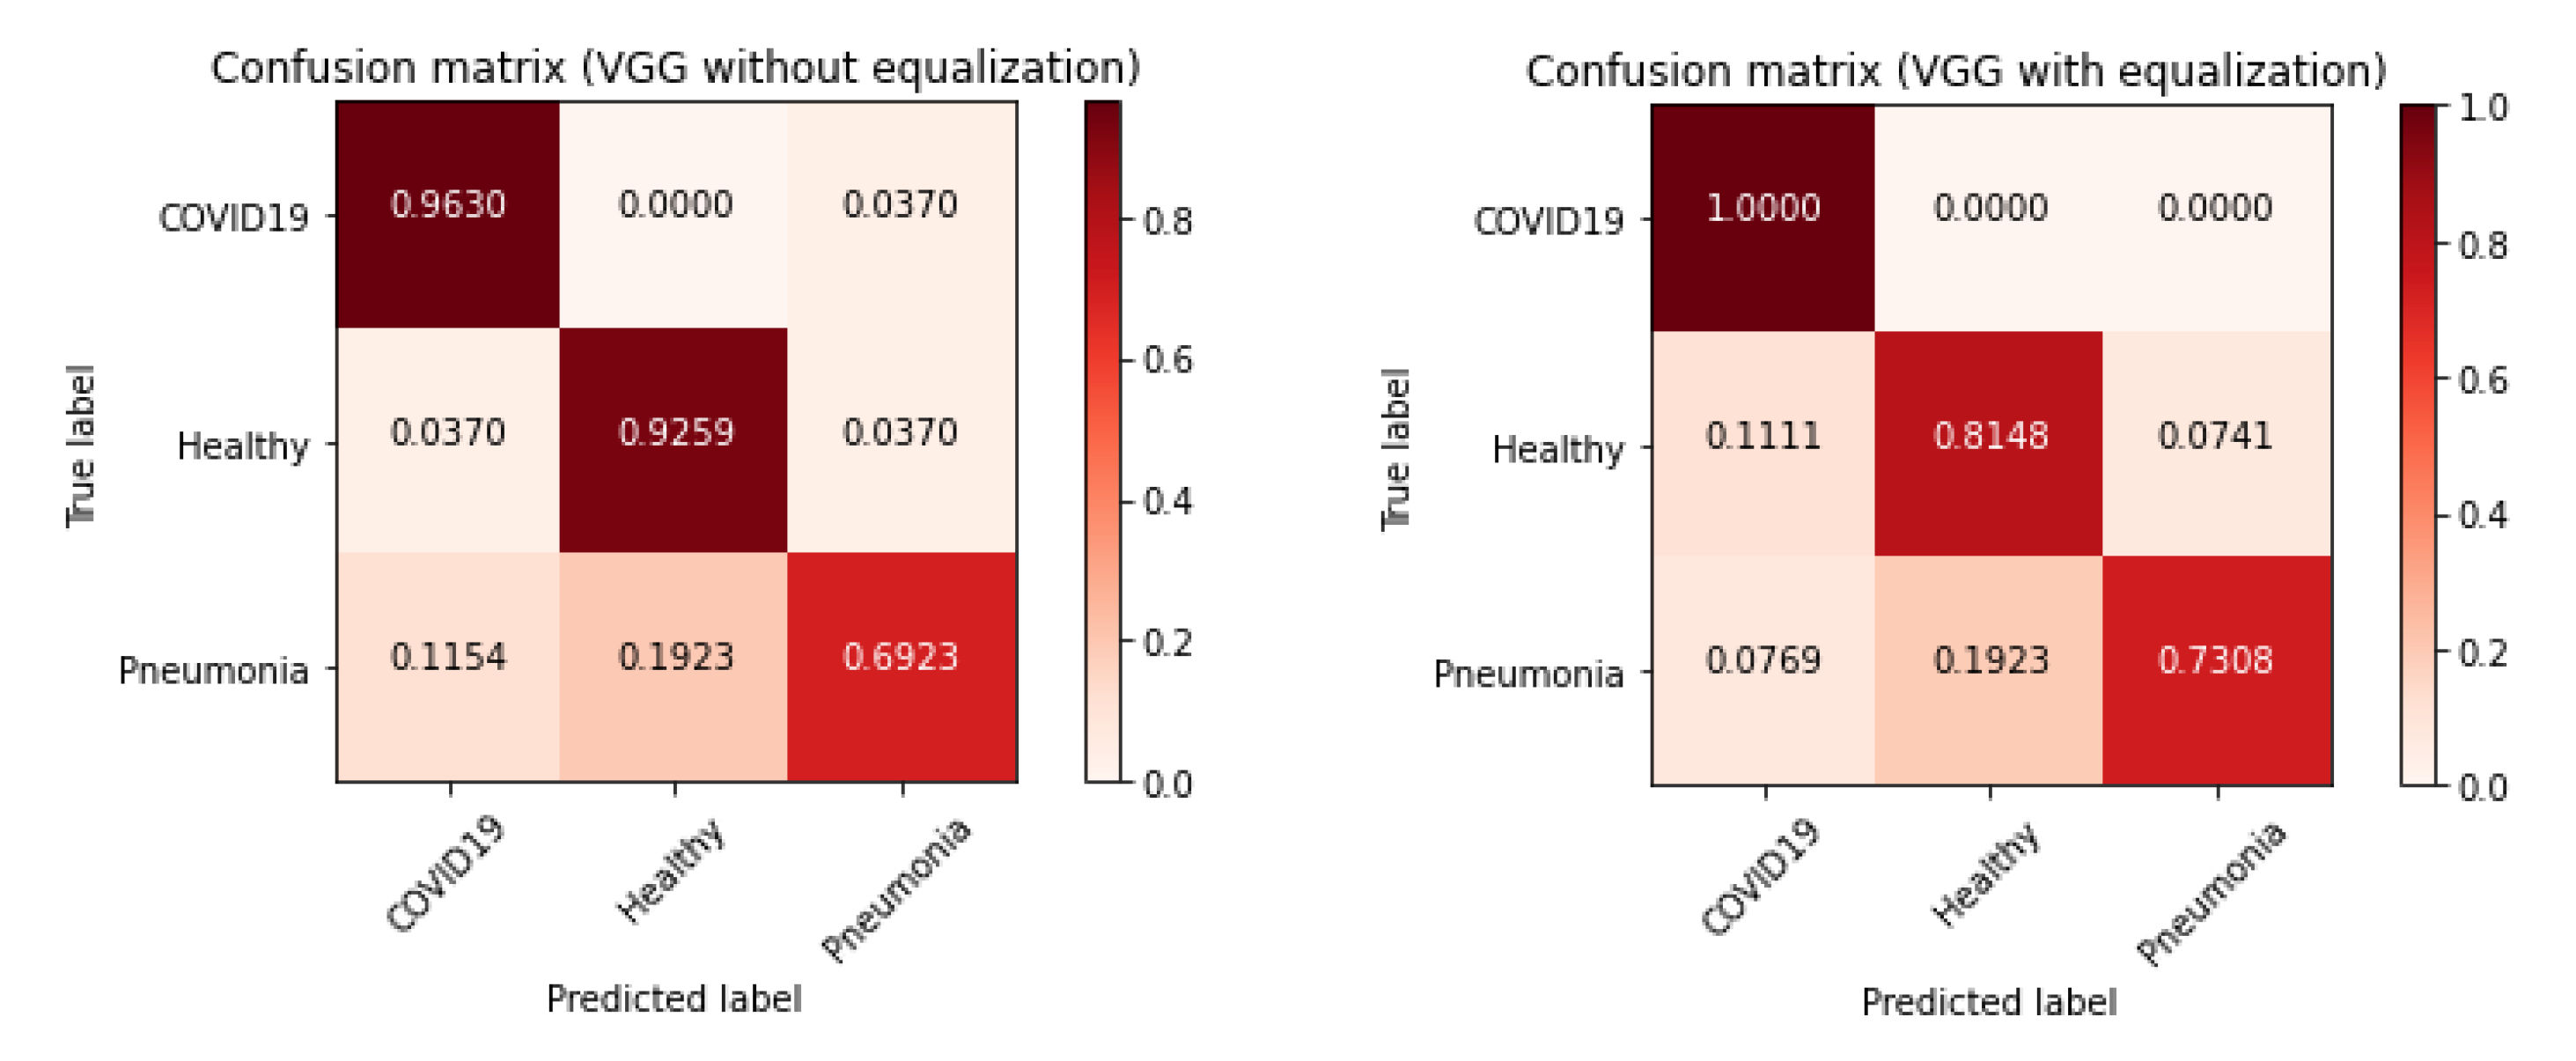
The results obtained for macro metrics are shown in Table 2. Both models presents effectiveness values over 0.85 for each metric. The higher results are the specificity values, which implies that in general the model has a low probability of generating false positives. The rest of the metrics, however, also present high values, denoting a good performance of the models identifying both true positives and negatives.
As opposed to macro metrics, micro metrics shows the results averaging the total true positives, false negatives and false positives. The results for each class and model are shown in Table 3 and Table 4. Overall, both models obtain a high effectiveness in relation to COVID-19. The metrics reveal that the model is quite sensitive to the identification of this disease with this type of images, with a low rate of false negatives. In contrast, the model is less sensitive identifying cases of pneumonia.
Macro metric results indicate that on average the first model has a slightly better performance. However, the micro average metrics values and the confusion matrices (Figure 3) reveal that the model using images without preprocessing achieves a higher hit rate in healthy individuals. On the other hand, the model that uses equalized images has a higher hit rate in the other two classes. The first model distinguishes better between patients with or without one of the pathologies considered, but it is not as effective as the second model distinguishing between pneumonia and COVID-19 disease.
This fact could, in principle, be expected as contrast enhancement increases details in the X-ray image and, in this way, increases the deferential characteristics between different deceases but may create some unexpected details in healthy images that may led to their classification as pathological. Several authors have use adaptive equalization on chest X-ray images (e.g., Reference [23] but they use it a preprocessing step before segmentation and do not try to directly classify the enhanced images.
Given the purpose of the detection system, as a diagnostic support tool, the second model can be considered more suitable, since it is more sensitive to disease identification, with few false negatives for these two classes. False positives could be discarded by a specialist doctor.
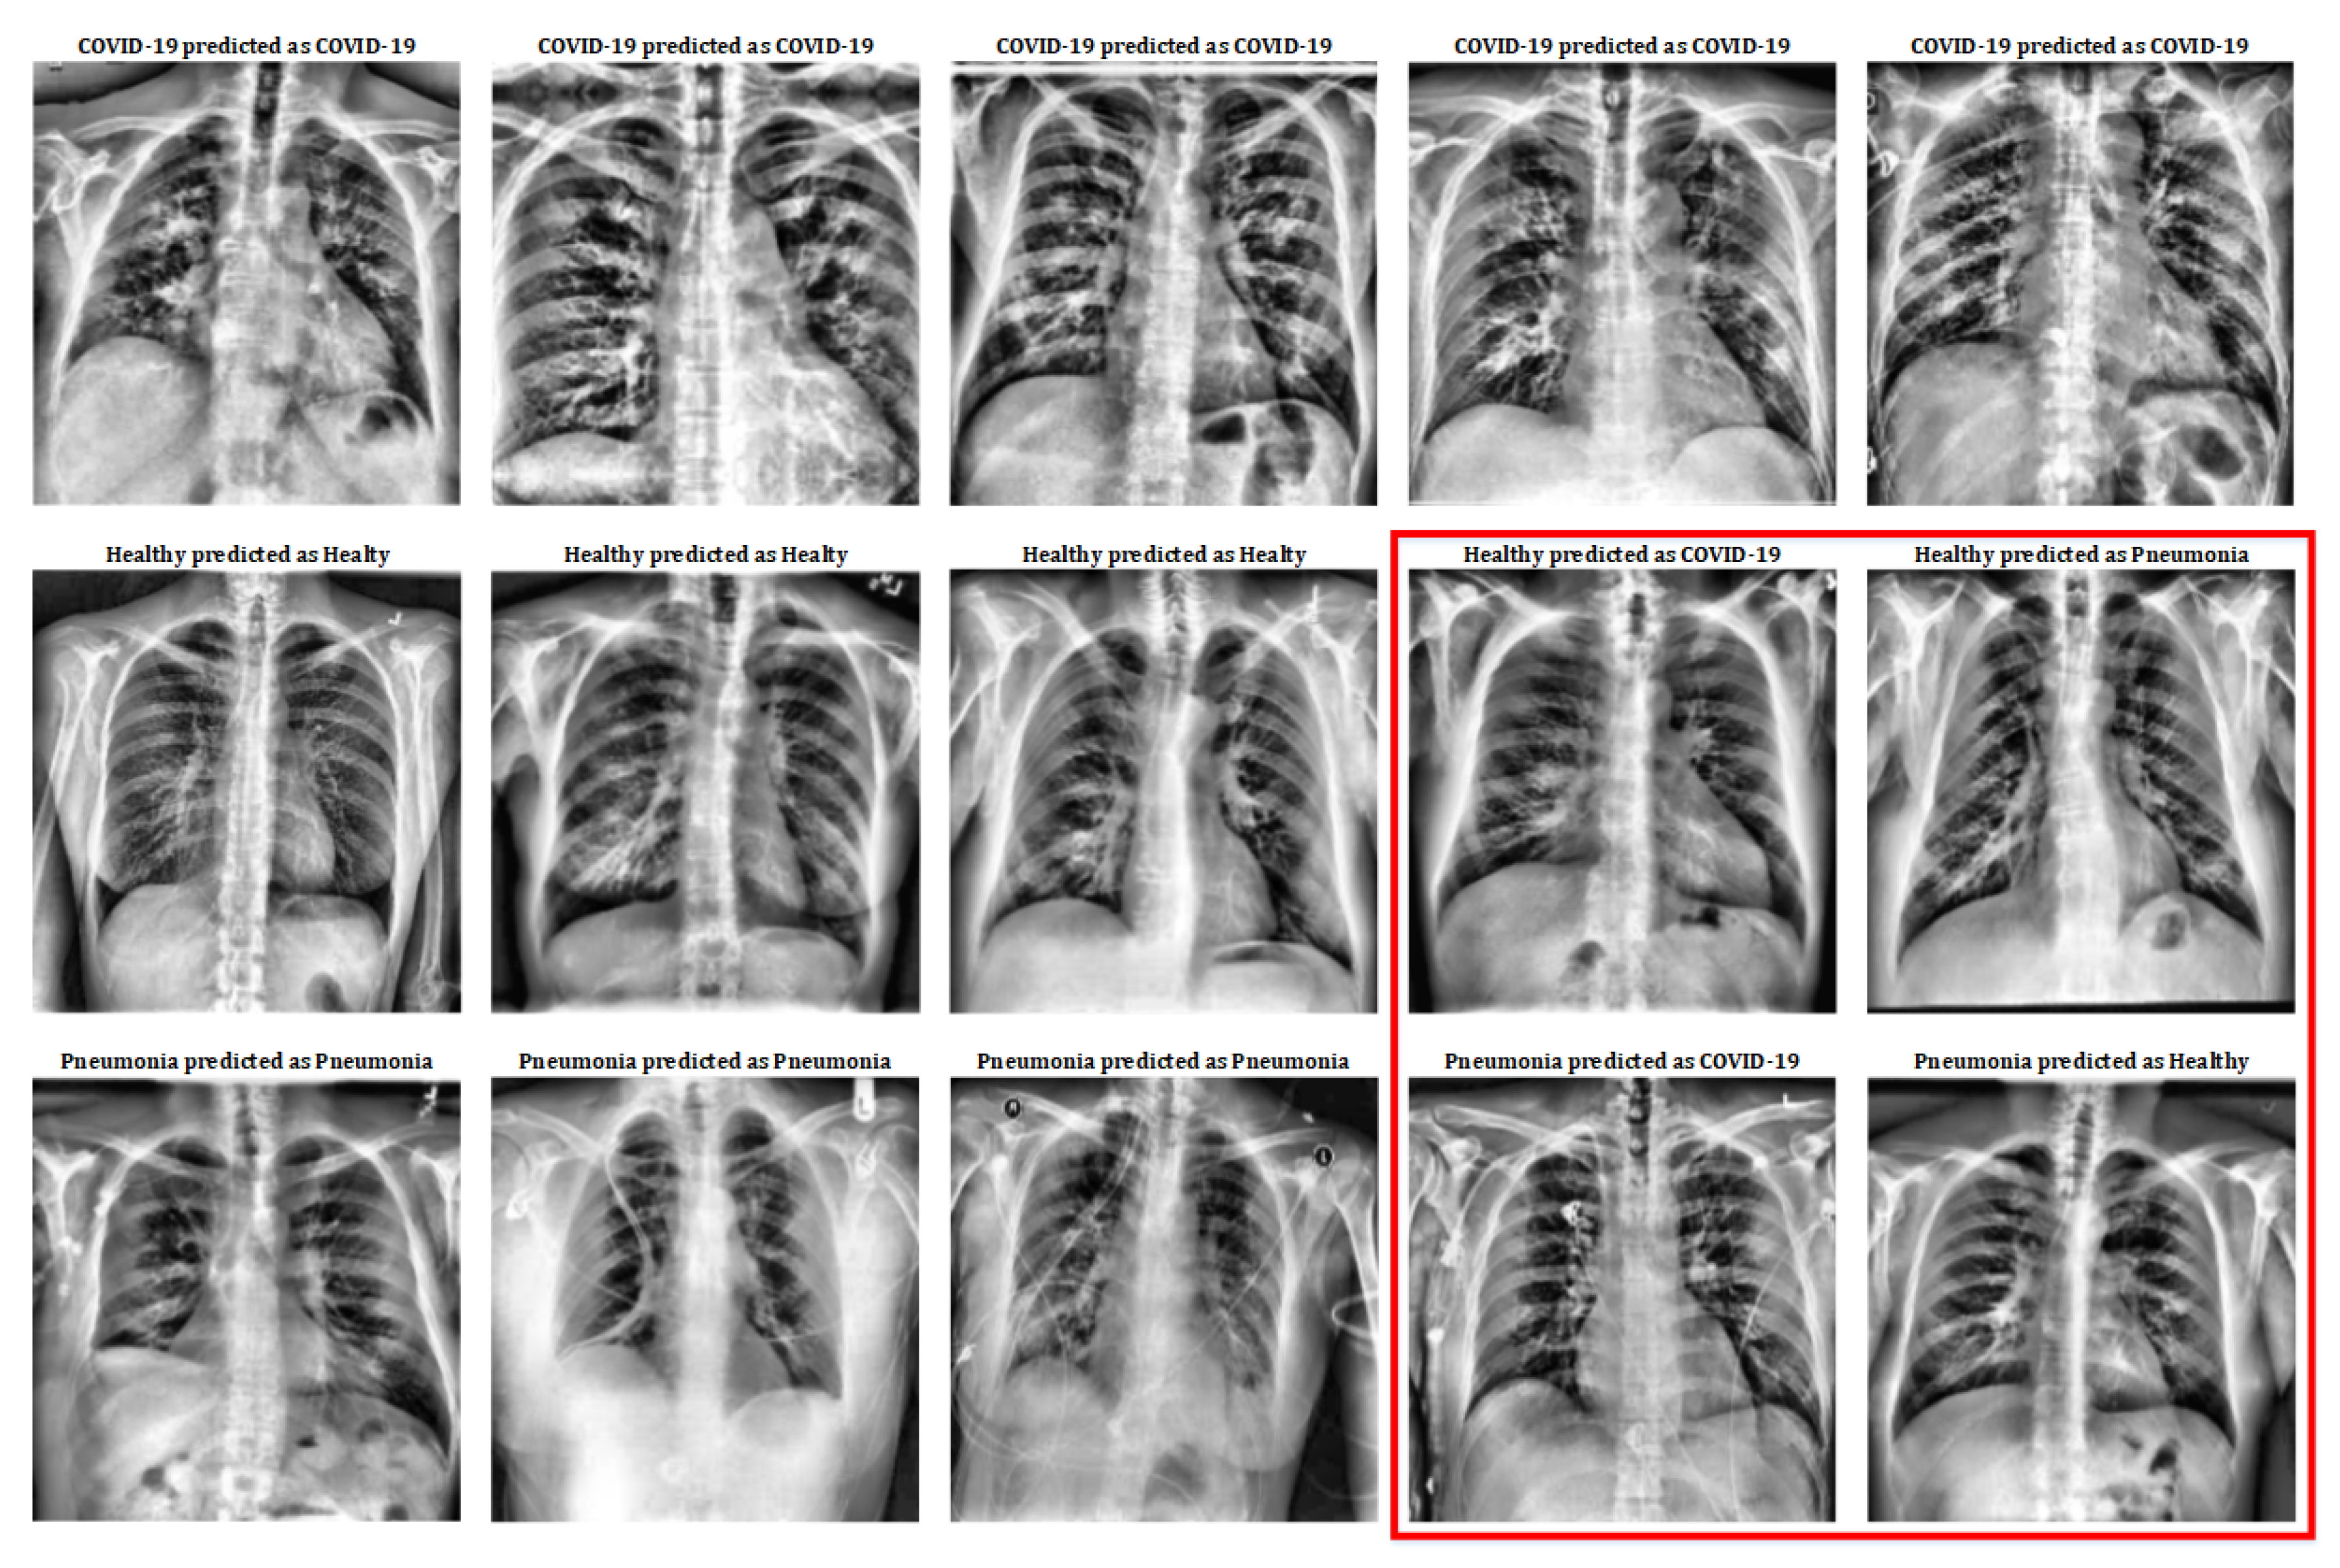
Although the numerical results obtained reflect the goodness of the implemented system, it is very interesting to observe the X-ray images that have been used on it to appreciate the similarities and differences between patients with COVID-19, patients with pneumonia and healthy patients. Some of the images used in this work and the classification results of the system can be seen in Figure 4.
In Figure 4, the first row shows five COVID-19 pulmonary X-ray images; the second row shows five healthy pulmonary X-ray images; and the third row shows five pneumonia pulmonary X-ray images. As can be observed, the first row only contains images that have been classified correctly (remember that COVID-19 class has a 100% success in the classification results, so no mistake has been done in this class). Healthy and Pneumonia classes do not have a 100% success rate, that is why this figure includes some images that have been wrongly predicted. So, Figure 4, includes a subset of the dataset used for this work with all the different cases (positive and negative) in order to show the positive and negative aspects of this classification mechanism.
If we observe deeply Figure 4 in order to extract the medical details that cause these classes distinctions, a severe inflammation in the alveoli and bronchioles can be distinguished in images of COVID-19 patients; this is related to the damage that these patients suffer in their lungs. As for healthy patients, both the alveoli and bronchioles are less inflamed. Finally, those patients with pneumonia show appreciable inflammation too, but not as marked as in patients with COVID-19.
Even so, in the red box some erroneously classified cases can be seen. Among these cases, images of healthy patients are shown who, due to inflammation in the lungs (without becoming serious) are erroneously classified as patients with pneumonia or with COVID-19. On the other hand, some of the images of patients with pneumonia have also been misclassified: in some cases, they are mild pneumonia that is classified as healthy; and, in other cases, they have a more severe pneumonia that is erroneously classified as COVID- 19.
However, two important aspects should be highlighted in these results: on the one hand, the images of patients with COVID-19 are correctly classified at 100%; and, on the other hand, the images used of patients with pneumonia come from a previous study (older database) and, therefore, were not taken with current instruments (and, in some cases, with a different zoom). This last aspect may be the trigger for why the pneumonia class has been the worst performer.
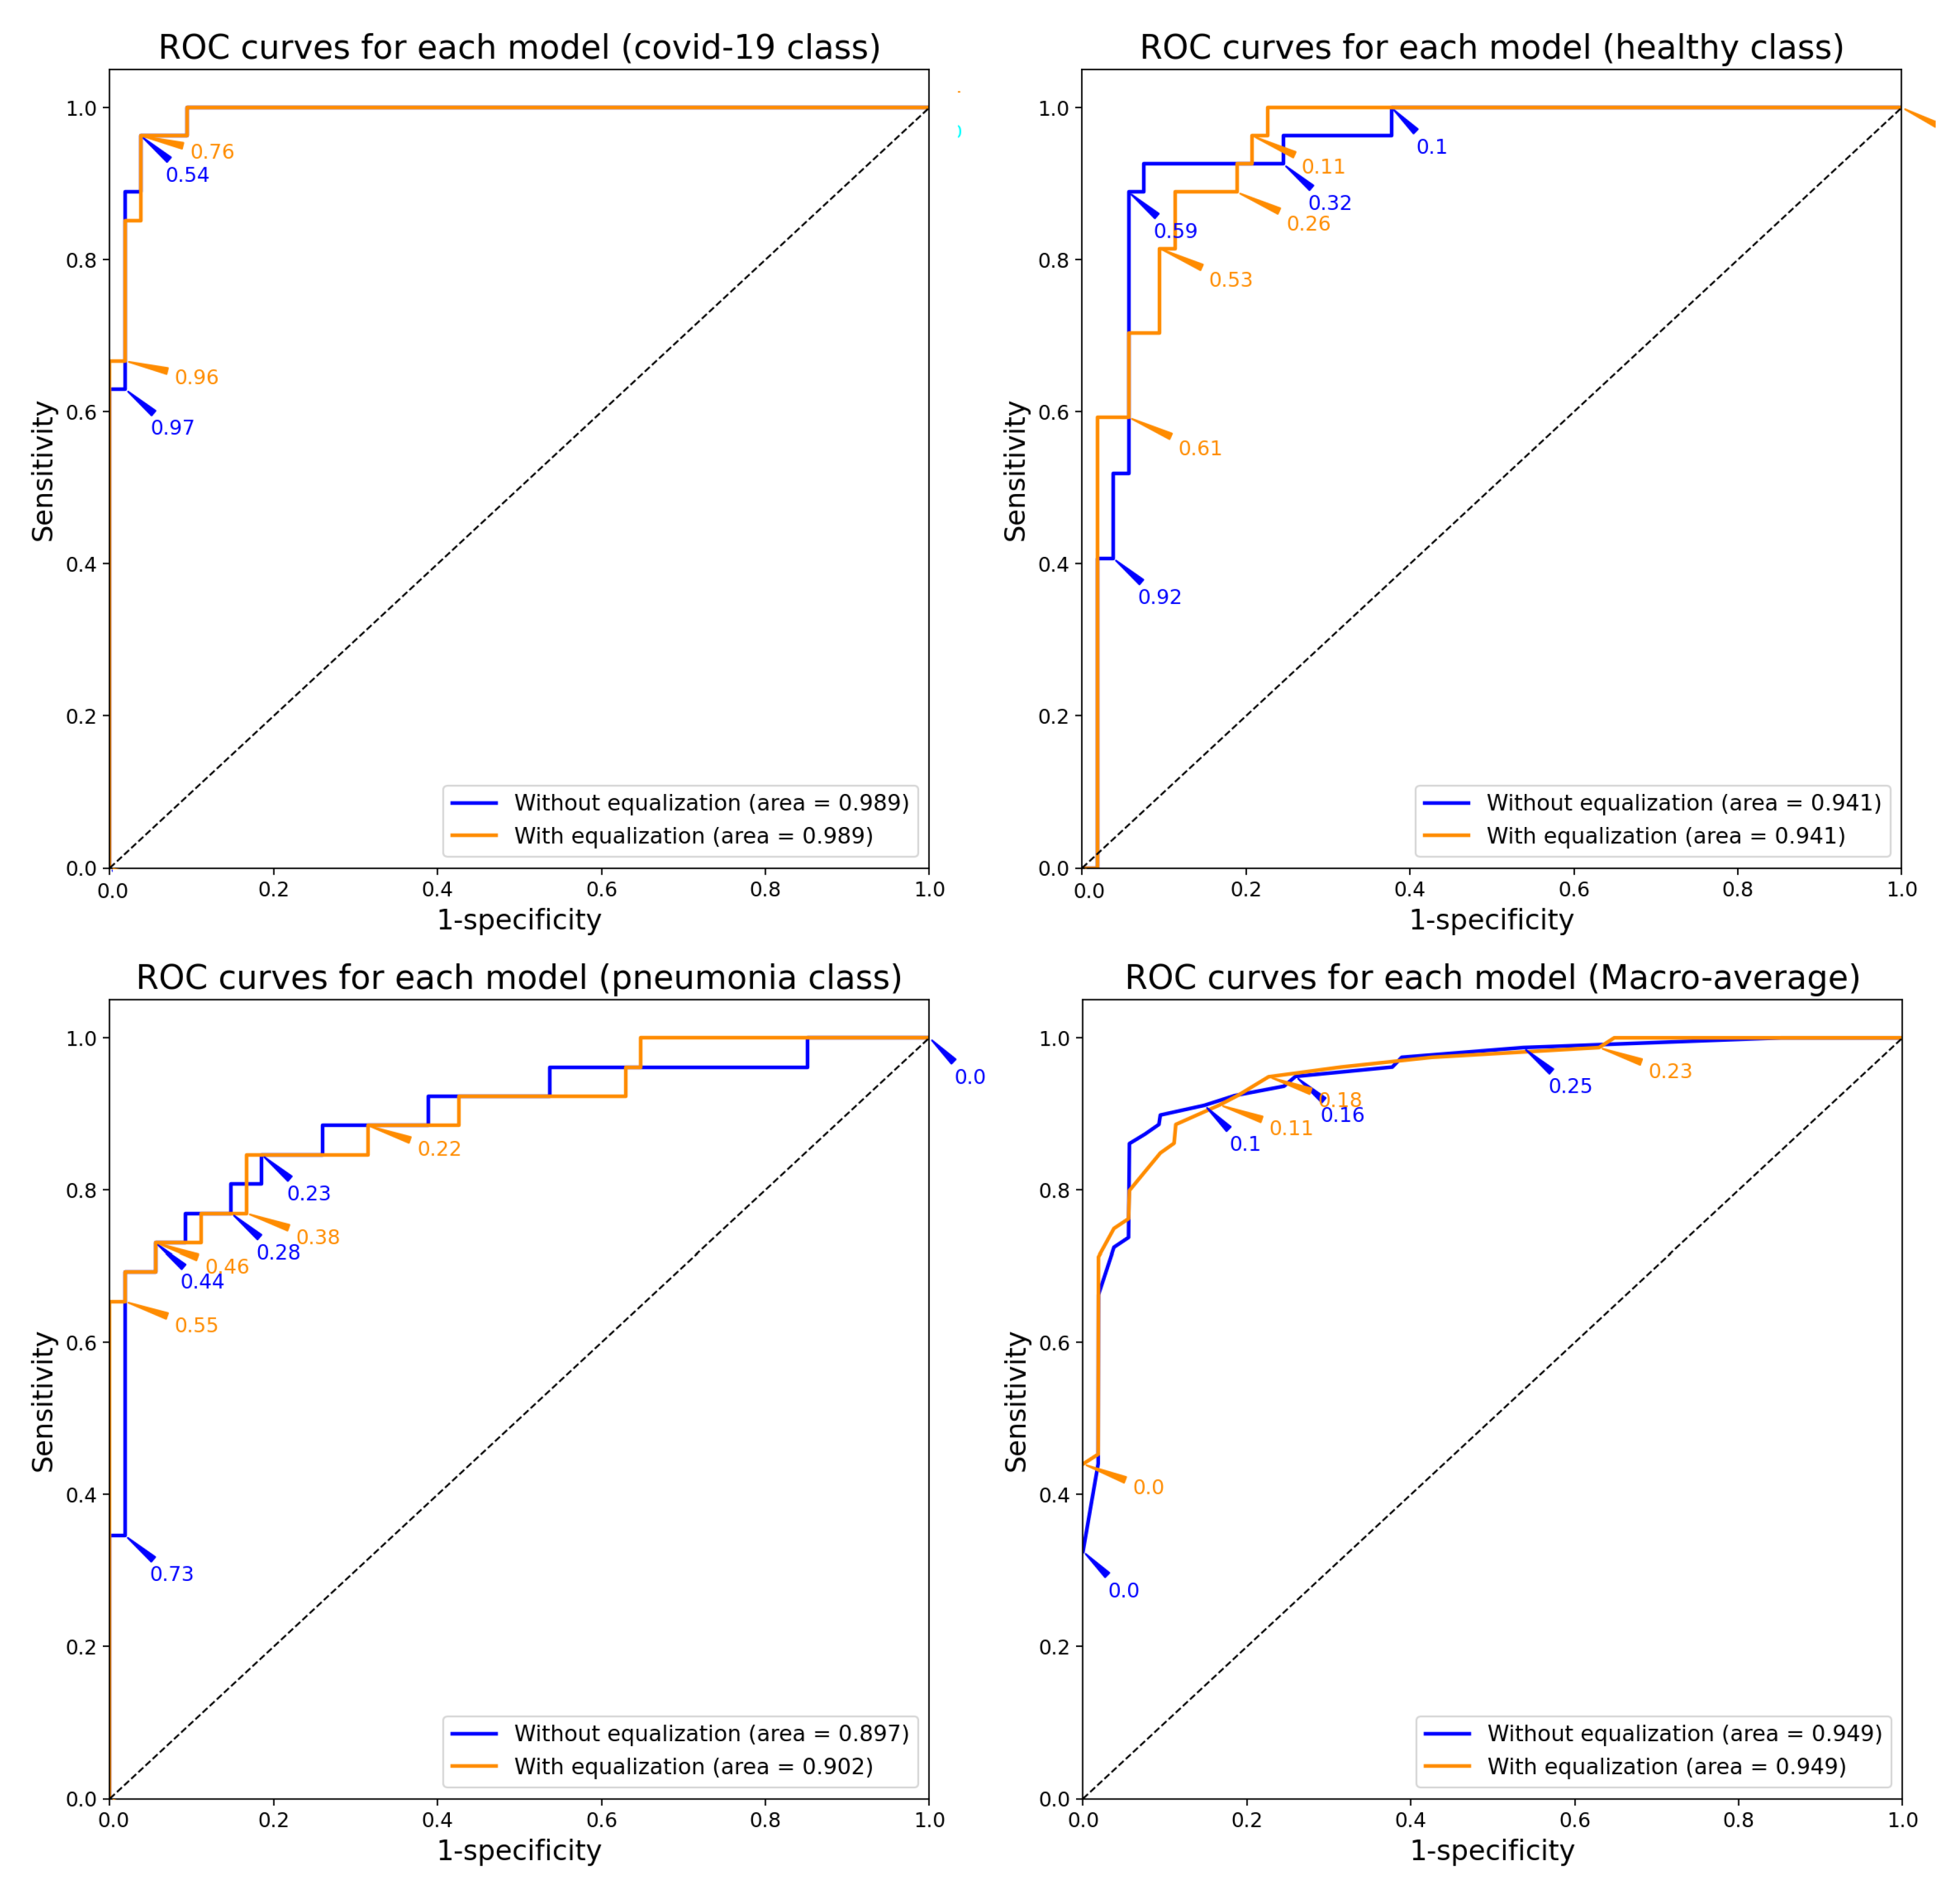
The Receiver Operating Characteristic (ROC) curves (see Figure 5) per each model and class reveal a good reliability in the classification. These curves were obtained from the results for each node of the output layer by changing the confident threshold. The Areas Under the Curve (AUC) are higher than 90%. The pneumonia class is the one with the lowest confidence index. However, the trained model with previous treatment of the images shows a higher confidence index for the identification of COVID-19. The ROC curve together with the rest of the results previously shown reveal that the model has great sensitivity regarding the classification of this disease.
4. Conclusions
In this work, a Deep-Learning classification system based on a particular convolutional neural network model (VGG16) has been trained and assessed to identify symptoms of pneumonia and COVID-19 patients. The database used is a combination of Healthy, Pneumonia and COVID-19 X-ray images from patients around the globe of both genders with different ages, and it is growing up day by day. The inputs used to train and test the system are those lung radiographs and the outputs is a classification between Pneumonia, COVID19 or Healthy, as well as a confidence value.
A pre-processing stage was done to all the X-ray images due to be obtained from different machines with different calibrations, which caused a significant variation in the histogram of the images.
After this stage, a complete study of the model in effectiveness has been made. The results indicate that the model behaves well discriminating healthy cases with respect to disease when a contrast technique is applied prior to training. In fact, 100% COVID-19 cases were successfully classified, while the other two classes obtain good results too (but not as well as the first one).
So, the model has a high sensitivity regarding the identification of COVID-19 and a remarkable specificity with respect to the three classes. This turns the model into a well-behaved tool to screen cases and support diagnosis.
Author Contributions
Conceptualization: J.C.-M. and F.L.-P.; methodology: M.D.M. and A.C.; software: J.C.-M. and F.L.-P.; validation: M.D.M. and A.C.; formal analysis: M.D.M. and A.C.; investigation: J.C.-M., F.L.-P., M.D.M. and A.C.; writing: J.C.-M., F.L.-P., M.D.M. and A.C.; supervision: M.D.M. and A.C. All authors have read and agreed to the published version of the manuscript.
Funding
This research was funded by the Telefonica Chair “Intelligence in Networks” of the Universidad de Sevilla, Spain.
Acknowledgments
This work has been supported by the Telefonica Chair “Intelligence in Networks” of the Universidad de Sevilla, Spain.
Conflicts of Interest
The authors declare no conflict of interest.
Abbreviations
The following abbreviations are used in this manuscript:
| SARS-CoV | Severe Acute Respiratory Syndrome Coronavirus |
| COVID-19 | Coronavirus Disease 2019 |
| RT-PCR | Reverse Transcription Polymerase Chain Reaction |
| BAL | Bronchoalveolar Lavage |
| MR | Magnetic Resonance |
| CT | Computerized Tomography |
| VGG-16 | Visual Geometry Group 16 |
| ROC | Receiver Operating Characteristic |
| AUC | Area Under Curve |
References
- Repici, A.; Maselli, R.; Colombo, M.; Gabbiadini, R.; Spadaccini, M.; Anderloni, A.; Carrara, S.; Fugazza, A.; Di Leo, M.; Galtieri, P.A.; et al. Coronavirus (COVID-19) outbreak: What the department of endoscopy should know. Gastrointest. Endosc. 2020, 92, 192–197. [Google Scholar] [CrossRef] [PubMed] [Green Version]
- Dong, E.; Du, H.; Gardner, L. An interactive web-based dashboard to track COVID-19 in real time. Lancet Infect. Dis. 2020, 20, P533–P534. [Google Scholar] [CrossRef]
- Sohrabi, C.; Alsafi, Z.; O’Neill, N.; Khan, M.; Kerwan, A.; Al-Jabir, A.; Iosifidis, C.; Agha, R. World Health Organization declares global emergency: A review of the 2019 novel coronavirus (COVID-19). Int. J. Surg. 2020, 76, 71–76. [Google Scholar] [CrossRef] [PubMed]
- Rothan, H.A.; Byrareddy, S.N. The epidemiology and pathogenesis of coronavirus disease (COVID-19) outbreak. J. Autoim. 2020, 109, 102433. [Google Scholar] [CrossRef] [PubMed]
- Li, Q.; Guan, X.; Wu, P.; Wang, X.; Zhou, L.; Tong, Y.; Ren, R.; Leung, K.S.; Lau, E.H.; Wong, J.Y.; et al. Early transmission dynamics in Wuhan, China, of novel coronavirus–infected pneumonia. N. Engl. J. Med. 2020, 382, 1199–1207. [Google Scholar] [CrossRef] [PubMed]
- Lauer, S.A.; Grantz, K.H.; Bi, Q.; Jones, F.K.; Zheng, Q.; Meredith, H.R.; Azman, A.S.; Reich, N.G.; Lessler, J. The incubation period of coronavirus disease 2019 (COVID-19) from publicly reported confirmed cases: Estimation and application. Ann. Intern. Med. 2020, 172, 577–582. [Google Scholar] [CrossRef] [PubMed] [Green Version]
- Cascella, M.; Rajnik, M.; Cuomo, A.; Dulebohn, S.C.; Di Napoli, R. Features, evaluation and treatment coronavirus (COVID-19). In Statpearls [Internet]; StatPearls Publishing: Tampa, FL, USA, 2020. [Google Scholar]
- World Health Organization. Modes of Transmission of Virus Causing COVID-19: Implications for IPC Precaution Recommendations; Scientific Brief, 27 March 2020; Technical Report; World Health Organization: Geneva, Switzerland, 2020. [Google Scholar]
- Xu, Z.; Shi, L.; Wang, Y.; Zhang, J.; Huang, L.; Zhang, C.; Liu, S.; Zhao, P.; Liu, H.; Zhu, L.; et al. Pathological findings of COVID-19 associated with acute respiratory distress syndrome. Lancet Respir. Med. 2020, 8, 420–422. [Google Scholar] [CrossRef]
- Lan, L.; Xu, D.; Ye, G.; Xia, C.; Wang, S.; Li, Y.; Xu, H. Positive RT-PCR test results in patients recovered from COVID-19. JAMA 2020, 323, 1502–1503. [Google Scholar] [CrossRef] [PubMed] [Green Version]
- Serebriakova, O.; Romanova, E.; Govorin, A.; Filev, A.; Shangin, A. Peculiarities of clinical and X-ray picture of pneumonia in patients with influenza A (H1N1). Klin. Med. 2012, 90, 70–72. [Google Scholar]
- Lin, Z.Q.; Xu, X.Q.; Zhang, K.B.; Zhuang, Z.G.; Liu, X.S.; Zhao, L.Q.; Lin, C.Y.; Li, Y.; Hua, X.L.; Zhao, H.L.; et al. Chest X-ray and CT findings of early H7N9 avian influenza cases. Acta Radiol. 2015, 56, 552–556. [Google Scholar] [CrossRef] [PubMed]
- Tse, G.M.; To, K.; Chan, P.K.; Lo, A.; Ng, K.; Wu, A.; Lee, N.; Wong, H.; Mak, S.; Chan, K.; et al. Pulmonary pathological features in coronavirus associated severe acute respiratory syndrome (SARS). J. Clin. Pathol. 2004, 57, 260–265. [Google Scholar] [CrossRef] [PubMed] [Green Version]
- Xie, X.; Li, X.; Wan, S.; Gong, Y. Mining X-ray Images of SARS Patients; Data Mining; Springer: Berlin, Germany, 2006; pp. 282–294. [Google Scholar]
- Ker, J.; Wang, L.; Rao, J.; Lim, T. Deep learning applications in medical image analysis. IEEE Access 2017, 6, 9375–9389. [Google Scholar] [CrossRef]
- Luna-Perejón, F.; Domínguez-Morales, M.J.; Civit-Balcells, A. Wearable fall detector using recurrent neural networks. Sensors 2019, 19, 4885. [Google Scholar] [CrossRef] [PubMed] [Green Version]
- Domínguez-Morales, M.J.; Luna-Perejón, F.; Miró-Amarante, L.; Hernández-Velázquez, M.; Sevillano-Ramos, J.L. Smart Footwear Insole for Recognition of Foot Pronation and Supination Using Neural Networks. Appl. Sci. 2019, 9, 3970. [Google Scholar] [CrossRef] [Green Version]
- Litjens, G.; Kooi, T.; Bejnordi, B.E.; Setio, A.A.A.; Ciompi, F.; Ghafoorian, M.; Van Der Laak, J.A.; Van Ginneken, B.; Sánchez, C.I. A survey on deep learning in medical image analysis. Med. Image Anal. 2017, 42, 60–88. [Google Scholar] [CrossRef] [PubMed] [Green Version]
- Asri, H.; Mousannif, H.; Al Moatassime, H.; Noel, T. Using machine learning algorithms for breast cancer risk prediction and diagnosis. Procedia Comp. Sci. 2016, 83, 1064–1069. [Google Scholar] [CrossRef] [Green Version]
- Jhuo, S.L.; Hsieh, M.T.; Weng, T.C.; Chen, M.J.; Yang, C.M.; Yeh, C.H. Trend prediction of influenza and the associated pneumonia in taiwan using machine learning. In 2019 International Symposium on Intelligent Signal Processing and Communication Systems (ISPACS); IEEE: Piscataway, NJ, USA, 2019; pp. 1–2. [Google Scholar]
- Civit-Masot, J.; Luna-Perejon, F.; Vicente-Diaz, S.; Corral, J.M.R.; Civit, A. TPU Cloud-Based Generalized U-Net for Eye Fundus Image Segmentation. IEEE Access 2019, 7, 142379–142387. [Google Scholar] [CrossRef]
- Simonyan, K.; Zisserman, A. Very deep convolutional networks for large-scale image recognition. arXiv 2014, arXiv:1409.1556. [Google Scholar]
- Jaeger, S.; Antani, S.; Thoma, G. Tuberculosis screening of chest radiographs. SPIE Newsroom 2011, 3, 89–99. [Google Scholar] [CrossRef]
Figure 1.
Processing architecture used in this work.

Figure 2.
Pre-processing results.

Figure 3.
Confusion matrix of each model.

Figure 4.
Classification results on X-ray images.

Figure 5.
ROC curves of each model.


Table 1.
Dataset distribution for each subset.
| Subset | COVID-19 | Healthy | Pneumonia | Total |
|---|---|---|---|---|
| Total | 132 | 132 | 132 | 396 |
| Training | 105 | 105 | 106 | 316 |
| Test | 27 | 27 | 26 | 80 |
Table 2.
Results for Macro average metrics.
| Model | Accuracy | Precision | F1-Score | Specificity | Sensitivity |
|---|---|---|---|---|---|
| Original | 0.86 | 0.86 | 0.86 | 0.93 | 0.86 |
| Equalized | 0.85 | 0.85 | 0.85 | 0.92 | 0.85 |
Table 3.
Results for micro average metrics for each class (model with original images).
| Class | Precision | Recall | F1-Score |
|---|---|---|---|
| COVID-19 | 0.87 | 0.96 | 0.91 |
| Healthy | 0.83 | 0.93 | 0.88 |
| Pneumonia | 0.90 | 0.69 | 0.78 |
Table 4.
Results for micro average metrics for each class (model with equalization).
| Class | Precision | Recall | F1-Score |
|---|---|---|---|
| COVID-19 | 0.84 | 1.00 | 0.92 |
| Healthy | 0.81 | 0.81 | 0.81 |
| Pneumonia | 0.90 | 0.73 | 0.81 |
© 2020 by the authors. Licensee MDPI, Basel, Switzerland. This article is an open access article distributed under the terms and conditions of the Creative Commons Attribution (CC BY) license (http://creativecommons.org/licenses/by/4.0/).
Share and Cite
MDPI and ACS Style
Civit-Masot, J.; Luna-Perejón, F.; Domínguez Morales, M.; Civit, A. Deep Learning System for COVID-19 Diagnosis Aid Using X-ray Pulmonary Images. Appl. Sci. 2020, 10, 4640. https://doi.org/10.3390/app10134640
AMA Style
Civit-Masot J, Luna-Perejón F, Domínguez Morales M, Civit A. Deep Learning System for COVID-19 Diagnosis Aid Using X-ray Pulmonary Images. Applied Sciences. 2020; 10(13):4640. https://doi.org/10.3390/app10134640
Chicago/Turabian StyleCivit-Masot, Javier, Francisco Luna-Perejón, Manuel Domínguez Morales, and Anton Civit. 2020. "Deep Learning System for COVID-19 Diagnosis Aid Using X-ray Pulmonary Images" Applied Sciences 10, no. 13: 4640. https://doi.org/10.3390/app10134640
Note that from the first issue of 2016, this journal uses article numbers instead of page numbers. See further details here.