
Serum 25-hydroxyvitamin D Concentration Significantly Decreases in Patients with COVID-19 Pneumonia during the First 48 Hours after Hospital Admission

 , ,
, ,
Abstract
:1. Introduction
2. Materials and Methods
- Patients with no need for supplemental oxygen;
- Patients not meeting the criteria for severe disease;
- COVID-19 pneumonia was not the primary diagnosis upon admission;
- Patients with another acute infection, (e.g., urinary tract infection) during the monitoring period.
3. Results
4. Discussion
Supplementary Materials
Author Contributions
Funding
Institutional Review Board Statement
Informed Consent Statement
Data Availability Statement
Acknowledgments
Conflicts of Interest
References
- Grant, W.B.; Lahore, H.; McDonnell, S.L.; Baggerly, C.A.; French, C.B.; Aliano, J.L.; Bhattoa, H.P. Evidence that Vitamin D Supplementation Could Reduce Risk of Influenza and COVID-19 Infections and Deaths. Nutrients 2020, 12, 988. [Google Scholar] [CrossRef] [Green Version]
- D’Avolio, A.; Avataneo, V.; Manca, A.; Cusato, J.; De Nicolò, A.; Lucchini, R.; Keller, F.; Cantù, M. 25-Hydroxyvitamin D Concentrations Are Lower in Patients with Positive PCR for SARS-CoV-2. Nutrients 2020, 12, 1359. [Google Scholar] [CrossRef] [PubMed]
- Campi, I.; Gennari, L.; Merlotti, D.; Mingiano, C.; Frosali, A.; Giovanelli, L.; Torlasco, C.; Pengo, M.F.; Heilbron, F.; Soranna, D.; et al. Vitamin D and COVID-19 severity and related mortality: A prospective study in Italy. BMC Infect. Dis. 2021, 21, 1–13. [Google Scholar] [CrossRef]
- Angelidi, A.M.; Belanger, M.J.; Lorinsky, M.K.; Karamanis, D.; Chamorro-Pareja, N.; Ognibene, J.; Palaiodimos, L.; Mantzoros, C.S. Vitamin D Status Is Associated With In-Hospital Mortality and Mechanical Ventilation: A Cohort of COVID-19 Hospitalized Patients. Mayo Clin. Proc. 2021, 96, 875–886. [Google Scholar] [CrossRef] [PubMed]
- Smaha, J.; Kužma, M.; Brázdilová, K.; Nachtmann, S.; Jankovský, M.; Pastírová, K.; Gažová, A.; Jackuliak, P.; Killinger, Z.; Kyselovič, J.; et al. Patients with COVID-19 pneumonia with 25(OH)D levels lower than 12 ng/ml are at increased risk of death. Int. J. Infect. Dis. 2022, 116, 313–318. [Google Scholar] [CrossRef] [PubMed]
- Batabyal, R.; Freishtat, N.; Hill, E.; Rehman, M.; Freishtat, R.; Koutroulis, I. Metabolic dysfunction and immunometabolism in COVID-19 pathophysiology and therapeutics. Int. J. Obes. 2021, 45, 1163–1169. [Google Scholar] [CrossRef]
- Quraishi, S.A.; Camargo, C.A., Jr. Vitamin D in acute stress and critical illness. Curr. Opin. Clin. Nutr. Metab. Care 2012, 15, 625–634. [Google Scholar] [CrossRef]
- Pludowski, P.; Takacs, I.; Boyanov, M.; Belaya, Z.; Diaconu, C.C.; Mokhort, T.; Zherdova, N.; Rasa, I.; Payer, J.; Pilz, S. Clinical Practice in the Prevention, Diagnosis and Treatment of Vitamin D Deficiency: A Central and Eastern European Expert Consensus Statement. Nutrients 2022, 14, 1483. [Google Scholar] [CrossRef]
- Silva, M.C.; Furlanetto, T.W. Does serum 25-hydroxyvitamin D decrease during acute-phase response? A systematic review. Nutr. Res. 2015, 35, 91–96. [Google Scholar] [CrossRef] [PubMed]
- Binkley, N.; Coursin, D.; Krueger, D.; Iglar, P.; Heiner, J.; Illgen, R.; Squire, M.; Lappe, J.; Watson, P.; Hogan, K. Surgery alters parameters of vitamin D status and other laboratory results. Osteoporos. Int. 2016, 28, 1013–1020. [Google Scholar] [CrossRef]
- Muscogiuri, G.; Barrea, L.; Di Somma, C.; Laudisio, D.; Salzano, C.; Pugliese, G.; de Alteriis, G.; Colao, A.; Savastano, S. Sex Differences of Vitamin D Status across BMI Classes: An Observational Prospective Cohort Study. Nutrients 2019, 11, 3034. [Google Scholar] [CrossRef] [PubMed] [Green Version]
- Newens, K.; Filteau, S.; Tomkins, A. Plasma 25-hydroxyvitamin D does not vary over the course of a malarial infection. Trans. R. Soc. Trop. Med. Hyg. 2006, 100, 41–44. [Google Scholar] [CrossRef]
- Louw, J.A.; Werbeck, A.; Louw, M.E.J.; Kotze, T.J.V.W.; Cooper, R.; Labadarios, D. Blood vitamin concentrations during the acute-phase response. Crit. Care Med. 1992, 20, 934–941. [Google Scholar] [CrossRef] [PubMed]
- Reid, D.; Toole, B.J.; Knox, S.; Talwar, D.; Harten, J.; O’Reilly, D.S.J.; Blackwell, S.; Kinsella, J.; McMillan, D.C.; Wallace, A.M.; et al. The relation between acute changes in the systemic inflammatory response and plasma 25-hydroxyvitamin D concentrations after elective knee arthroplasty. Am. J. Clin. Nutr. 2011, 93, 1006–1011. [Google Scholar] [CrossRef] [Green Version]
- Waldron, J.L.; Ashby, H.L.; Cornes, M.P.; Bechervaise, J.; Razavi, C.; Thomas, O.L.; Chugh, S.; Deshpande, S.; Ford, C.; Gama, R. Vitamin D: A negative acute phase reactant. J. Clin. Pathol. 2013, 66, 620–622. [Google Scholar] [CrossRef] [PubMed]
- Bang, U.C.; Novovic, S.; Andersen, A.M.; Fenger, M.; Hansen, M.B.; Jensen, J.-E.B. Variations in Serum 25-Hydroxyvitamin D during Acute Pancreatitis: An Exploratory Longitudinal Study. Endocr. Res. 2011, 36, 135–141. [Google Scholar] [CrossRef]
- Bertoldo, F.; Pancheri, S.; Zenari, S.; Boldini, S.; Giovanazzi, B.; Zanatta, M.; Valenti, M.T.; Carbonare, L.D.; Cascio, V.L. Serum 25-hydroxyvitamin D levels modulate the acute-phase response associated with the first nitrogen-containing bisphosphonate infusion. J. Bone Miner. Res. 2010, 25, 447–454. [Google Scholar] [CrossRef] [PubMed]
- Barth, J.H.; Field, H.P.; Mather, A.N.; Plein, S. Serum 25 hydroxy-vitamin D does not exhibit an acute phase reaction after acute myocardial infarction. Ann. Clin. Biochem. Int. J. Lab. Med. 2012, 49, 399–401. [Google Scholar] [CrossRef] [PubMed]
- Li, X.; Ma, X. Acute respiratory failure in COVID-19: Is it “typical” ARDS? Crit. Care 2020, 24, 198. [Google Scholar] [CrossRef]
- Wang, Y.; Dong, C.; Hu, Y.; Li, C.; Ren, Q.; Zhang, X.; Shi, H.; Zhou, M. Temporal Changes of CT Findings in 90 Patients with COVID-19 Pneumonia: A Longitudinal Study. Radiology 2020, 296, E55–E64. [Google Scholar] [CrossRef] [PubMed] [Green Version]
- Lee, P. Vitamin D metabolism and deficiency in critical illness. Best Pr. Res. Clin. Endocrinol. Metab. 2011, 25, 769–781. [Google Scholar] [CrossRef]
- Zheng, S.; Yang, J.; Hu, X.; Li, M.; Wang, Q.; Dancer, R.C.; Parekh, D.; Gao-Smith, F.; Thickett, D.R.; Jin, S. Vitamin D attenuates lung injury via stimulating epithelial repair, reducing epithelial cell apoptosis and inhibits TGF-β induced epithelial to mesenchymal transition. Biochem. Pharmacol. 2020, 177, 113955. [Google Scholar] [CrossRef]
- Kloc, M.; Ghobrial, R.M.; Lipińska-Opałka, A.; Wawrzyniak, A.; Zdanowski, R.; Kalicki, B.; Kubiak, J.Z. Effects of vitamin D on macrophages and myeloid-derived suppressor cells (MDSCs) hyperinflammatory response in the lungs of COVID-19 patients. Cell. Immunol. 2020, 360, 104259. [Google Scholar] [CrossRef] [PubMed]
- Abrishami, A.; Dalili, N.; Torbati, P.M.; Asgari, R.; Arab-Ahmadi, M.; Behnam, B.; Sanei-Taheri, M. Possible association of vitamin D status with lung involvement and outcome in patients with COVID-19: A retrospective study. Eur. J. Nutr. 2020, 60, 2249–2257. [Google Scholar] [CrossRef] [PubMed]
- Krishnan, A.; Ochola, J.; Mundy, J.; Jones, M.; Kruger, P.; Duncan, E.; Venkatesh, B. Acute fluid shifts influence the assessment of serum vitamin D status in critically ill patients. Crit. Care 2010, 14, R216. [Google Scholar] [CrossRef] [Green Version]
- Erstad, B.L. Albumin disposition in critically Ill patients. J. Clin. Pharm. Ther. 2018, 43, 746–751. [Google Scholar] [CrossRef] [PubMed] [Green Version]
- Bikle, D.D.; Schwartz, J. Vitamin D Binding Protein, Total and Free Vitamin D Levels in Different Physiological and Pathophysiological Conditions. Front. Endocrinol. 2019, 10, 317. [Google Scholar] [CrossRef] [PubMed] [Green Version]
- Skversky, A.L.; Kumar, J.; Abramowitz, M.K.; Kaskel, F.J.; Melamed, M.L. Association of Glucocorticoid Use and Low 25-Hydroxyvitamin D Levels: Results from the National Health and Nutrition Examination Survey (NHANES): 2001–2006. J. Clin. Endocrinol. Metab. 2011, 96, 3838–3845. [Google Scholar] [CrossRef] [Green Version]
- Akeno, N.; Matsunuma, A.; Maeda, T.; Kawane, T.; Horiuchi, N. Regulation of vitamin D-1alpha-hydroxylase and -24-hydroxylase expression by dexamethasone in mouse kidney. J. Endocrinol. 2000, 164, 339–348. [Google Scholar] [CrossRef] [PubMed] [Green Version]
- Kurahashi, I.; Matsunuma, A.; Kawane, T.; Abe, M.; Horiuchi, N. Dexamethasone Enhances Vitamin D-24-Hydroxylase Expression in Osteoblastic (UMR-106) and Renal (LLC-PK1) Cells Treated with 1α,25-Dihydroxyvitamin D3. Endocrine 2002, 17, 109–118. [Google Scholar] [CrossRef]
- Dhawan, P.; Christakos, S. Novel regulation of 25-hydroxyvitamin D3 24-hydroxylase (24(OH)ase) transcription by glucocorticoids: Cooperative effects of the glucocorticoid receptor, C/EBPβ, and the Vitamin D receptor in 24(OH)ase transcription. J. Cell. Biochem. 2010, 110, 1314–1323. [Google Scholar] [CrossRef] [PubMed]
- Ronchetti, S.; Ricci, E.; Migliorati, G.; Gentili, M.; Riccardi, C. How Glucocorticoids Affect the Neutrophil Life. Int. J. Mol. Sci. 2018, 19, 4090. [Google Scholar] [CrossRef] [PubMed] [Green Version]
- Voicu, S.; Malissin, I.; Pepin-Lehaleur, A.; Sutterlin, L.; Naim, G.; M’Rad, A.; Guerin, E.; Ekherian, J.; Deye, N.; Adle-Biassette, H.; et al. Cytological patterns of bronchoalveolar lavage fluid in mechanically ventilated COVID-19 patients on extracorporeal membrane oxygenation. Clin. Respir. J. 2022, 16, 329–334. [Google Scholar] [CrossRef] [PubMed]


| Variable | n = 22 | Females (n = 6) | Males (n = 16) |
|---|---|---|---|
| Females/males (n, %) | 6 (27%)/16 (73%) | N/A | N/A |
| Survivors/non-survivors (n, %) | 18 (82%)/4 (18%) | 5 (83%)/1 (17%) | 13 (81%)/3 (19%) |
| Age (years) (mean ± SD) | 60.5 ± 14.4 | 66.8 ± 12 | 58.3 ± 15 |
| Body mass index (kg/m2), median (IQR) | 29.74 (7.3) | 26.5 (8.8) | 28.9 (7.34) |
| Arterial hypertension (n, %) | 12 (55%) | 3 (50%) | 9 (56%) |
| Diabetes mellitus (n, %) | 7 (32%) | 2 (33%) | 5 (31%) |
| Coronary artery disease (n, %) | 2 (9%) | 1 (17%) | 1 (6%) |
| Chronic kidney disease (n, %) | 5 (23%) | 2 (33%) | 3 (19%) |
| Number of symptomatic days before hospitalization, mean ± SD | 7.45 ± 3.1 | 7.6 ± 3.4 | 7 ± 2.6 |
| Days of dyspnea before hospitalization, median (IQR) | 2.45 (1.1) | 2 (1.0) | 2 (3.2) |
| Need for supplemental oxygen (n, %) | 22 (100%) | 6 (100%) | 16 (100%) |
| Need for high flow oxygen (n, %) | 12 (55%) | 3 (33%) | 9 (56%) |
| Number of days of high flow oxygen, n (IQR) | 7 (6) | 4 (6) | 2.5 (6.1) |
| Invasive mechanical ventilation (n, %) | 2 (9%) | 0 (0%) | 2 (13%) |
| Vitamin D supplementation before hospitalization (n, %) | 10 (45%) | 2 (33%) | 8 (50%) |
| Variable | 25(OH)D (ng/mL) upon Admission | p-Value |
|---|---|---|
| Sex | 0.43 | |
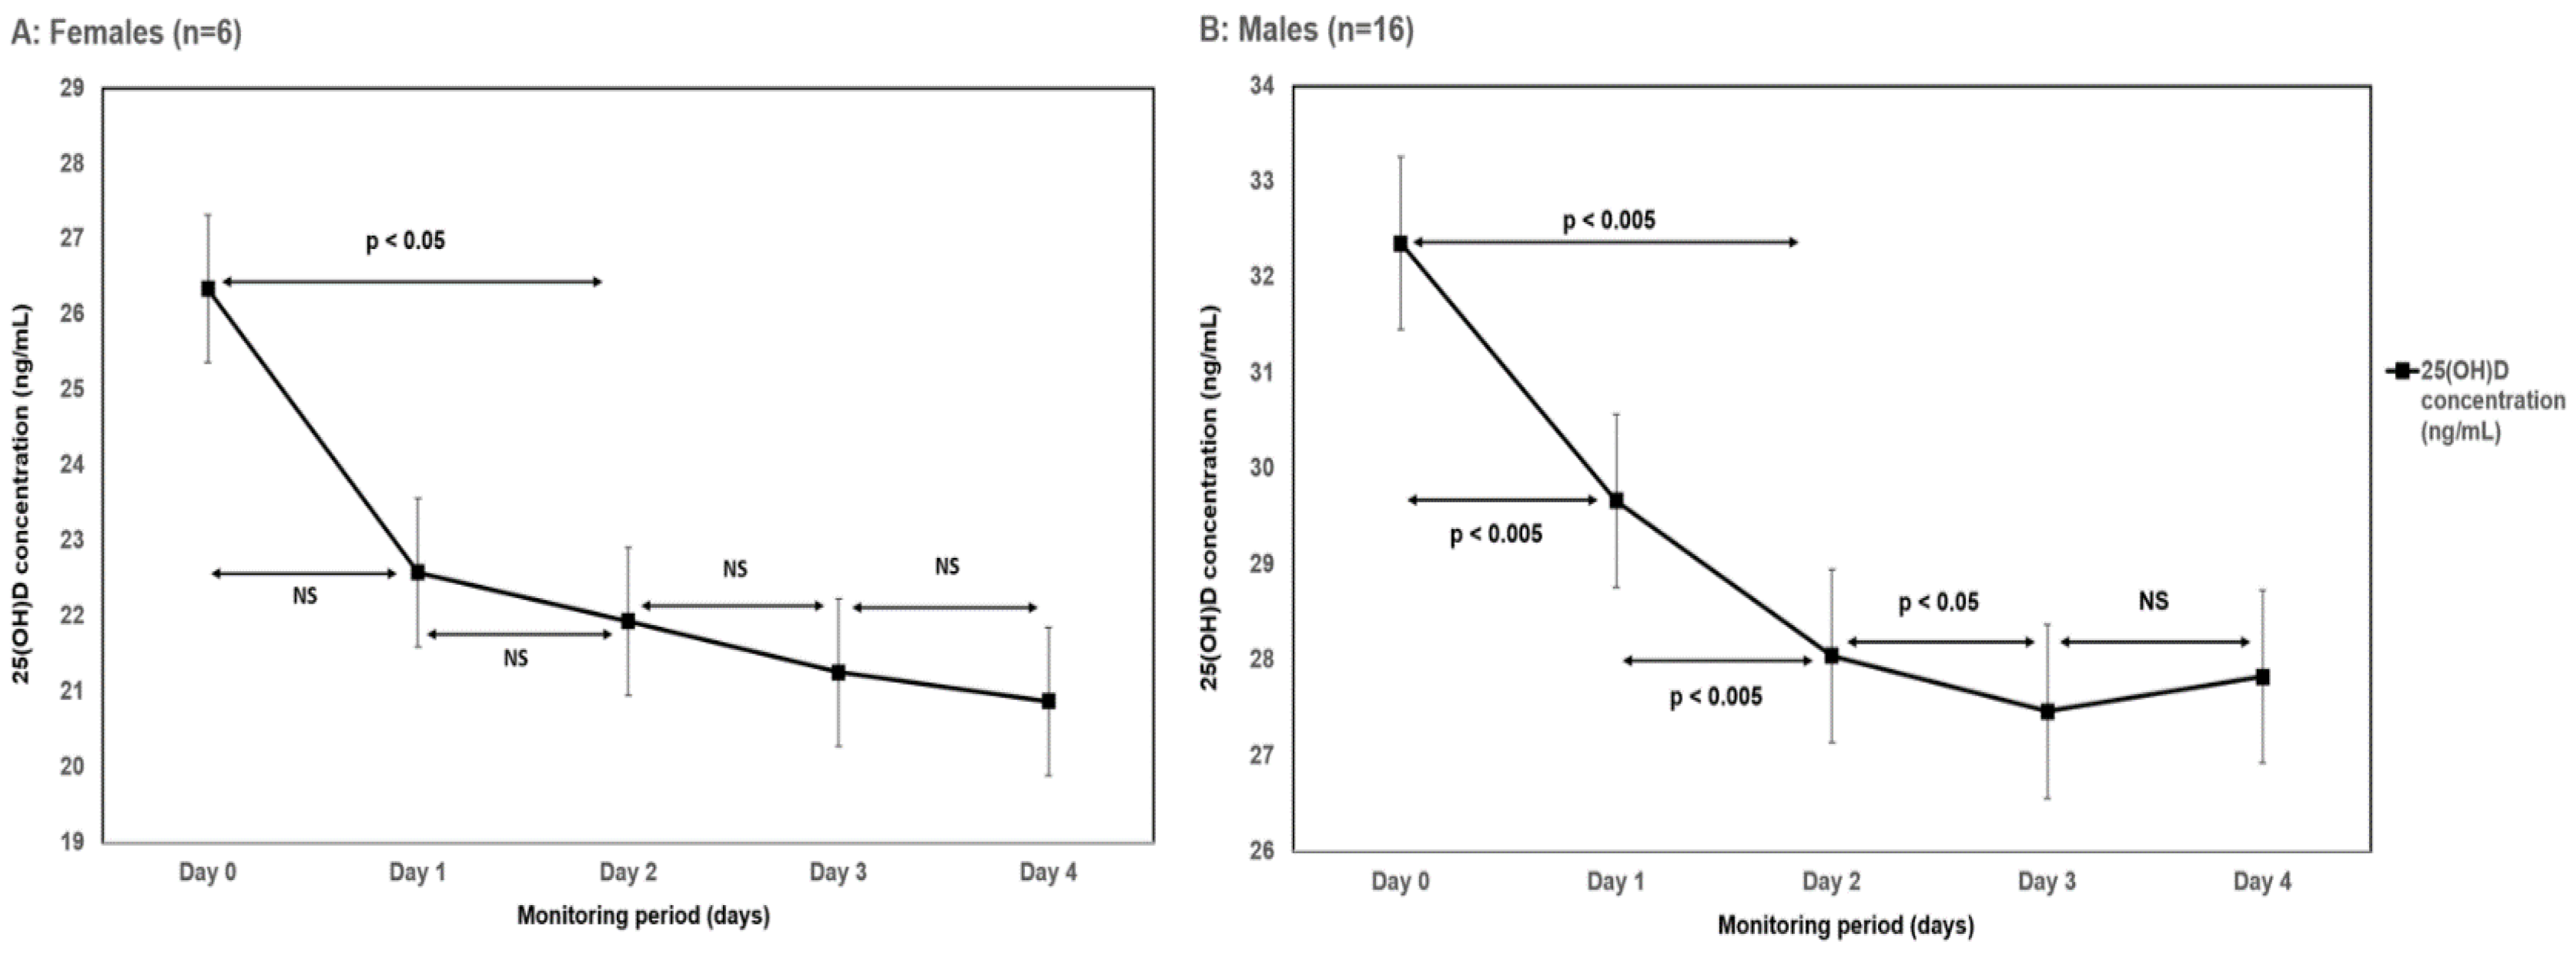
| Males | 32.3 ± 16.2 | |
| Females | 26.3 ± 12.9 | |
| Body mass index | ||
| >30 kg/m2 | 27.5 ± 16.2 | 0.47 |
| <30 kg/m2 | 32.5 ± 15.1 | |
| End of hospitalization | 0.69 | |
| Death | 33.6 ± 13.2 | |
| Discharge | 30.1 ± 16.1 | |
| Arterial hypertension | 0.57 | |
| Yes | 28.9 ± 10.4 | |
| No | 32.7 ± 20.2 | |
| Diabetes mellitus | 0.73 | |
| Yes | 29.03 ± 12.5 | |
| No | 31.5 ± 16.9 | |
| Coronary artery disease | 0.61 | |
| Yes | 25.2 ± 5.4 | |
| No | 31.2 ± 16.1 | |
| Chronic kidney disease | 0.18 | |
| Yes | 22.5 ± 10.2 | |
| No | 33.1 ± 16.1 | |
| Chronic pulmonary disease | 0.26 | |
| Yes | 18.9 ± 19.4 | |
| No | 31.8 ± 15.01 | |
| Need for high flow oxygen | 0.36 | |
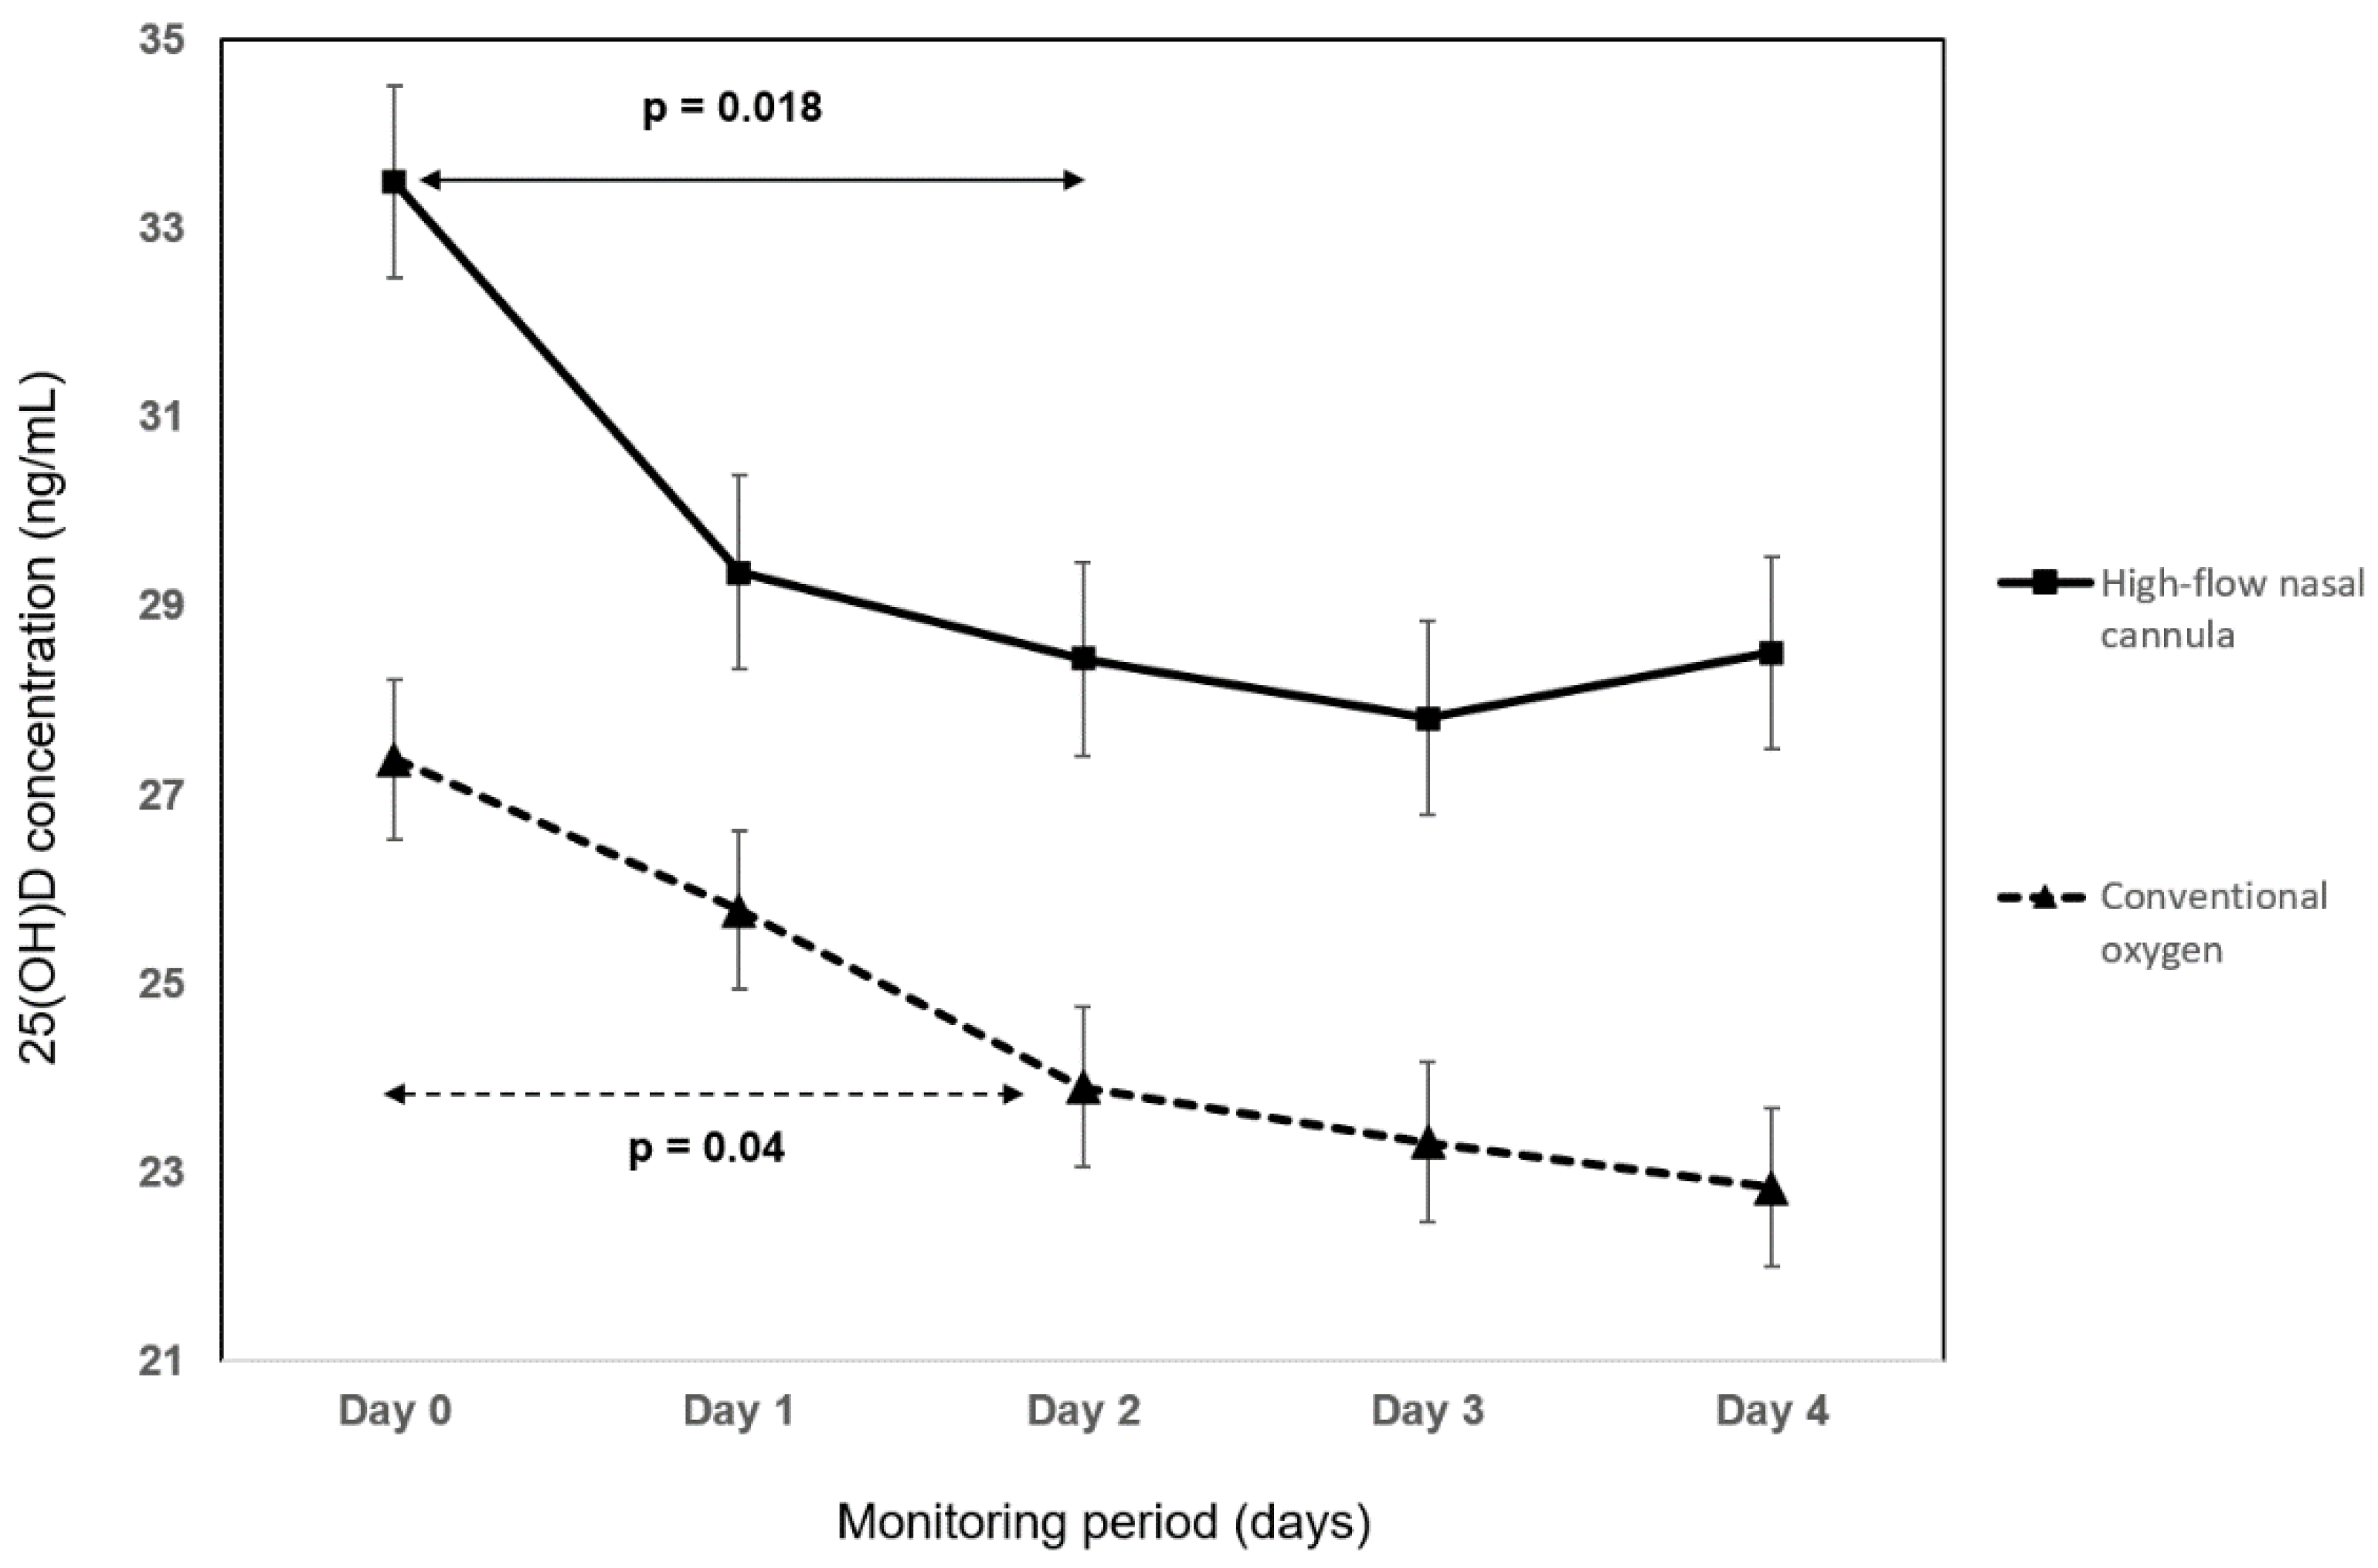
| Yes | 33.5 ± 16.6 | |
| No | 27.4 ± 13.8 | |
| Vitamin D supplementation before hospitalization | 0.0005 | |
| Yes | 41.85 ± 11.45 | |
| No | 21.4 ± 11.7 |
| Variable (Mean) | Day 0 | Day 1 | Day 2 | Day 3 | Day 4 |
|---|---|---|---|---|---|
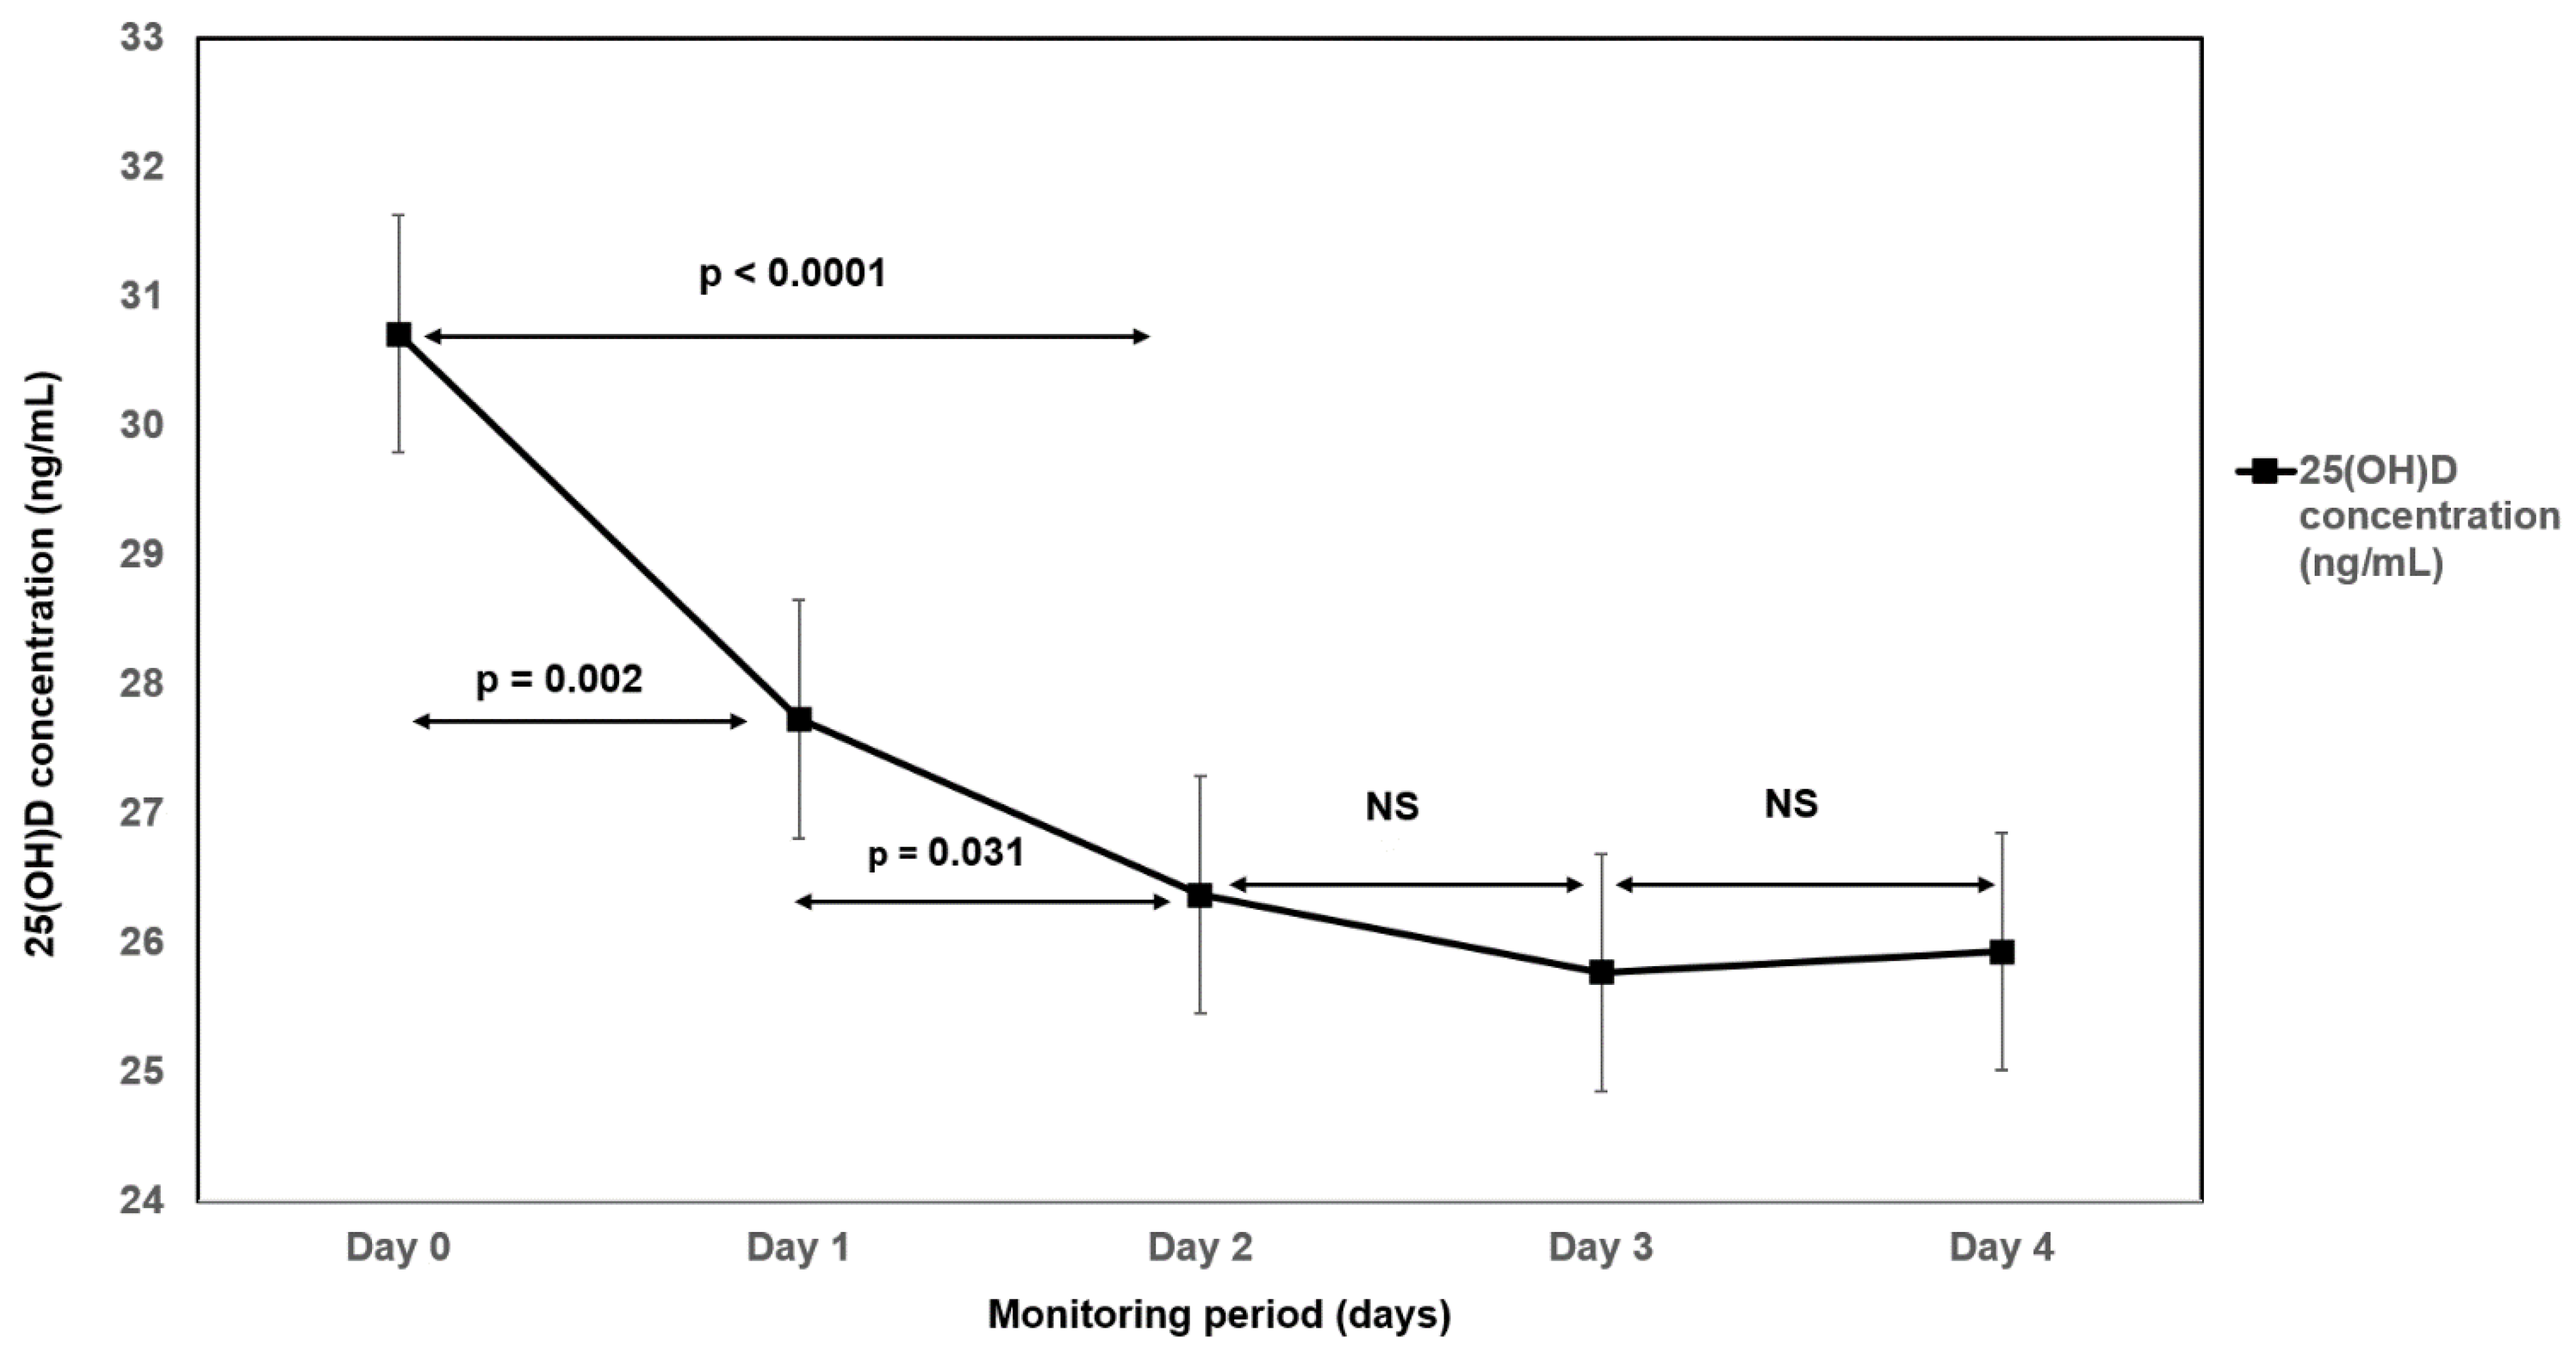
| 25(OH)D (ng/mL) ± SD | 30.7 ± 15.4 | 27.7 ± 13.5 ** | 26.4 ± 12.7 ** | 25.8 ± 12.5 ** | 25.9 ± 13.05 ** |
| Neutrophils (10 × 9/L) (IQR) | 6.0 (6.7) | 8.2 (8.1) ** | 9.4 (6.3) * | 8.7 (5.2) | 7.9 (4.6) |
| Lymphocytes (10 × 9/L) | 0.90 ± 0.42 | 0.96 ± 0.4 | 0.99 ± 0.53 | 1.19 ± 0.62 * | 1.29 ± 0.68 * |
| Monocytes (10 × 9/L) (IQR) | 0.32 (0.23) | 0.54 (0.3) ** | 0.5 (0.3) ** | 0.58 (0.27) ** | 0.53 (0.27) ** |
| C-reactive protein (mg/L) (IQR) | 162.8 (102.3) | 94.5 (100.5) ** | 66.2 (72.2) ** | 51.2 (53.3) ** | 28.9 (43.1) ** |
| Interleukin-6 (ng/L) (IQR) | 69.8 (148) | 30.3 (43.4) ** | 35.2 (69.7) * | 31.6 (61.7)* | 11.1 (44.8) ** |
| Procalcitonin (ng/mL) (IQR) | 0.28 (0.8) | 0.19 (0.34) * | 0.13 (0.23) | 0.12 (0.26)* | 0.095 (0.21) ** |
| Lactate dehydrogenase (IU) ± SD | 8.85 ± 4.4 | 8.83 ± 4.5 | 8.28 ± 4.1 | 8.28 ± 4.15 | 7.45 ± 3.82 * |
| Neutrophil to lymphocyte ratio (IQR) | 7(10.2) | 10.5(8.1) * | 10(11) | 7.5(6.5) | 6.5 (10) |
| Calcium (mmol/L) (IQR) | 2.12 (0.26) | 2.16 (0.18) | 2.02 (0.19) | 2.17 (0.15) | 2.16 (0.17) |
| Ionized calcium (mmol/L) ± SD | 1.137 ± 0.1 | 1.16 ± 0.07 * | 1.17 ± 0.1 * | 1.18 ± 0.08 * | 1.18 ± 0.1 * |
| Blood urea nitrogen (mmol/L) (IQR) | 6.6 (6.5) | 7.5 (6.8) | 8.5 (8.2) | 8.2 (3.8) | 7.6 (3.1) |
| Creatinine (umol/L) (IQR) | 94.3 (43.3) | 73.1 (31.1) | 81.2 (19.6) | 78.2 (11.6) | 79.3 (15.5) * |
| Albumin (g/L) ± SD | 34.7 ± 4.6 | 32.9 ± 3.8 * | 32.1 ± 3.8 * | 31.9 ± 3.9 * | 31.8 ± 4.1 * |
| Hemoglobin (g/L) ± SD | 138 ± 15 | 136 ± 15 | 132 ± 16.8 ** | 133 ± 15.9 * | 133 ± 17 * |
| Hematocrit ± SD | 0.42 ± 0.05 | 0.41 ± 0.05 | 0.403 ± 0.05 ** | 0.409 ± 0.05 * | 0.409 ± 0.05 * |
| Alanine aminotransferase (ukat/L) | 1.43 ± 2.03 | 1.5 ± 1.7 | 1.65 ± 2.04 | 1.91 ± 1.83 | 2.1 ± 2.17 |
| Alkaline phosphatase (ukat/L) (IQR) | 1.5 (1.38) | 1.44 (1.02) | 1.69 (0.92) | 1.71 (0.96) | 1.61 (0.91) |
Publisher’s Note: MDPI stays neutral with regard to jurisdictional claims in published maps and institutional affiliations. |
© 2022 by the authors. Licensee MDPI, Basel, Switzerland. This article is an open access article distributed under the terms and conditions of the Creative Commons Attribution (CC BY) license (https://creativecommons.org/licenses/by/4.0/).
Share and Cite
Smaha, J.; Kužma, M.; Jackuliak, P.; Nachtmann, S.; Max, F.; Tibenská, E.; Binkley, N.; Payer, J. Serum 25-hydroxyvitamin D Concentration Significantly Decreases in Patients with COVID-19 Pneumonia during the First 48 Hours after Hospital Admission. Nutrients 2022, 14, 2362. https://doi.org/10.3390/nu14122362
Smaha J, Kužma M, Jackuliak P, Nachtmann S, Max F, Tibenská E, Binkley N, Payer J. Serum 25-hydroxyvitamin D Concentration Significantly Decreases in Patients with COVID-19 Pneumonia during the First 48 Hours after Hospital Admission. Nutrients. 2022; 14(12):2362. https://doi.org/10.3390/nu14122362
Chicago/Turabian StyleSmaha, Juraj, Martin Kužma, Peter Jackuliak, Samuel Nachtmann, Filip Max, Elena Tibenská, Neil Binkley, and Juraj Payer. 2022. "Serum 25-hydroxyvitamin D Concentration Significantly Decreases in Patients with COVID-19 Pneumonia during the First 48 Hours after Hospital Admission" Nutrients 14, no. 12: 2362. https://doi.org/10.3390/nu14122362