
Pulmonary Edema in COVID-19 Treated with Furosemide and Negative Fluid Balance (NEGBAL): A Different and Promising Approach

 ,
,
Abstract
:1. Introduction
2. Materials and Methods
2.1. Ethical Approval
2.2. Study Design and Patient Population
2.3. Chest CT Imaging
2.4. Negative Fluid Balance (NEGBAL) Approach
2.5. Statistical Analysis
3. Results
4. Discussion
5. Conclusions
Supplementary Materials
Author Contributions
Funding
Institutional Review Board Statement
Informed Consent Statement
Data Availability Statement
Acknowledgments
Conflicts of Interest
References
- World Health Organization. Pneumonia of Unknown Cause—China. 2020. Available online: https://www.who.int/emergencies/disease-outbreak-news/item/2020-DON229 (accessed on 20 August 2021).
- World Health Organization. Statement on the Second Meeting of the International Health Regulations (2005) Emergency Committee Regarding the Out-Break of Novel Coronavirus (2019-nCoV). 2020. Available online: https://www.who.int/news/item/30-01-2020-statement-on-the-second-meeting-of-the-international-health-regulations-(2005)-emergency-committee-regarding-the-outbreak-of-novel-coronavirus-(2019-ncov) (accessed on 20 August 2021).
- World Health Organization. Director-General’s Opening Remarks at the Media Briefing on COVID-19—11 March 2020. 2020. Available online: https://www.who.int/director-general/speeches/detail/who-director-general-s-opening-remarks-at-the-media-briefing-on-covid-19---11-march-2020) (accessed on 20 August 2021).
- Cui, X.; Chen, W.; Zhou, H.; Gong, Y.; Zhu, B.; Lv, X.; Guo, H.; Duan, J.; Zhou, J.; Marcon, E.; et al. Pulmonary Edema in COVID-19 Patients: Mechanisms and Treatment Potential. Front. Pharmacol. 2021, 12, 664349. [Google Scholar] [CrossRef] [PubMed]
- Xu, Z.; Shi, L.; Wang, Y.; Zhang, J.; Huang, L.; Zhang, C.; Liu, S.; Zhao, P.; Liu, H.; Zhu, L.; et al. Pathological findings of COVID-19 associated with acute respiratory distress syndrome. Lancet Respir. Med. 2020, 8, 420–422. [Google Scholar] [CrossRef]
- Rasch, S.; Schmidle, P.; Sancak, S.; Herner, A.; Huberle, C.; Schulz, D.; Mayr, U.; Schneider, J.; Spinner, C.D.; Geisler, F.; et al. Increased extravascular lung water index (EVLWI) reflects rapid non-cardiogenic oedema and mortality in COVID-19 associated ARDS. Sci. Rep. 2021, 11, 11524. [Google Scholar] [CrossRef] [PubMed]
- Kuebler, W.M.; Jordt, S.-E.; Liedtke, W.B. Urgent reconsideration of lung edema as a preventable outcome in COVID-19: Inhibition of TRPV4 represents a promising and feasible approach. Am. J. Physiol. Cell. Mol. Physiol. 2020, 318, L1239–L1243. [Google Scholar] [CrossRef]
- Sun, X.; Wang, T.; Cai, D.; Hu, Z.; Chen, J.; Liao, H.; Zhi, L.; Wei, H.; Zhang, Z.; Qiu, Y.; et al. Cytokine storm intervention in the early stages of COVID-19 pneumonia. Cytokine Growth Factor Rev. 2020, 53, 38–42. [Google Scholar] [CrossRef] [PubMed]
- Mangalmurti, N.; Hunter, C.A. Cytokine Storms: Understanding COVID-19. Immunity 2020, 53, 19–25. [Google Scholar] [CrossRef]
- Langer-Gould, A.; Smith, J.B.; Gonzales, E.G.; Castillo, R.D.; Figueroa, J.G.; Ramanathan, A.; Li, B.H.; Gould, M.K. Early identification of COVID-19 cytokine storm and treatment with anakinra or tocilizumab. Int. J. Infect. Dis. 2020, 99, 291–297. [Google Scholar] [CrossRef]
- Hu, B.; Huang, S.; Yin, L. The cytokine storm and COVID-19. J. Med. Virol. 2021, 93, 250–256. [Google Scholar] [CrossRef]
- Fara, A.; Mitrev, Z.; Rosalia, R.A.; Assas, B.M. Cytokine storm and COVID-19: A chronicle of pro-inflammatory cytokines. Open Biol. 2020, 10. [Google Scholar] [CrossRef]
- Marini, J.J.; Gattinoni, L. Management of COVID-19 Respiratory Distress. JAMA 2020, 323, 2329–2330. [Google Scholar] [CrossRef]
- Sinha, P.; Matthay, M.A.; Calfee, C.S. Is a “Cytokine Storm” Relevant to COVID-19? JAMA Intern. Med. 2020, 180, 1152–1154. [Google Scholar] [CrossRef]
- Gattinoni, L.; Coppola, S.; Cressoni, M.; Busana, M.; Rossi, S.; Chiumello, D. COVID-19 does not lead to a “typical” acute respiratory distress syndrome. Am. J. Respir. Crit. Care Med. 2020, 201, 1299–1300. [Google Scholar] [CrossRef] [Green Version]
- Kuba, K.; Imai, Y.; Rao, S.; Gao, H.; Guo, F.; Guan, B.; Huan, Y.; Yang, P.; Zhang, Y.; Deng, W.; et al. A crucial role of angiotensin converting enzyme 2 (ACE2) in SARS coronavirus–induced lung injury. Nat. Med. 2005, 11, 875–879. [Google Scholar] [CrossRef]
- Imai, Y.; Kuba, K.; Rao, S.; Huan, Y.; Guo, F.; Guan, B.; Yang, P.; Sarao, R.; Wada, T.; Leong-Poi, H.; et al. Angiotensin-converting enzyme 2 protects from severe acute lung failure. Nature 2005, 436, 112–116. [Google Scholar] [CrossRef] [PubMed]
- Liu, Y.; Yang, Y.; Zhang, C.; Huang, F.; Wang, F.; Yuan, J.; Wang, Z.; Li, J.; Li, J.; Feng, C.; et al. Clinical and biochemical indexes from 2019-nCoV infected patients linked to viral loads and lung injury. Sci. China Life Sci. 2020, 63, 364–374. [Google Scholar] [CrossRef] [Green Version]
- Santos, R.A.S.; Ferreira, A.J.; Simoes e Silva, A.C. Recent advances in the angiotensin-converting enzyme 2-angiotensin(1-7)-Mas axis. Exp. Physiol. 2008, 93, 519–527. [Google Scholar] [CrossRef]
- Chen, D.; Li, X.; Song, Q.; Hu, C.; Su, F.; Dai, J.; Ye, Y.; Huang, J.; Zhang, X. Assessment of Hypokalemia and Clinical Characteristics in Patients with Coronavirus Disease 2019 in Wenzhou, China. JAMA Netw. Open 2020, 3, e2011122. [Google Scholar] [CrossRef] [PubMed]
- Connell, J.M.C.; Davies, E. The new biology of aldosterone. J. Endocrinol. 2005, 186, 1–20. [Google Scholar] [CrossRef] [PubMed]
- Choi, M.; Aiello, E.; Ennis, I.; Villa-Abrille, M. El SRAA y el SARS-CoV-2: El acertijo a resolver. Hipertens Riesgo Vasc. 2020, 37, 169–175. [Google Scholar] [CrossRef]
- Vaduganathan, M.; Vardeny, O.; Michel, T.; McMurray, J.J.; Pfeffer, M.A.; Solomon, S.D. Renin–Angiotensin–Aldosterone System Inhibitors in Patients with COVID-19. N. Engl. J. Med. 2020, 382, 1653–1659. [Google Scholar] [CrossRef]
- Gurwitz, D. Angiotensin receptor blockers as tentative SARS-CoV-2 therapeutics. Drug Dev. Res. 2020, 81, 537–540. [Google Scholar] [CrossRef] [Green Version]
- Ware, L.B.; Matthay, M.A. Clinical practice: Acute Pulmonary Edema. N. Engl. J. Med. 2005, 353, 2788–2796. [Google Scholar] [CrossRef] [Green Version]
- Lang, M.; Som, A.; Carey, D.; Reid, N.; Mendoza, D.P.; Flores, E.J.; Li, M.D.; Shepard, J.-A.O.; Little, B.P. Pulmonary Vascular Manifestations of COVID-19 Pneumonia. Radiol. Cardiothorac. Imaging 2020, 2, e200277. [Google Scholar] [CrossRef]
- Eslami, V.; Abrishami, A.; Zarei, E.; Khalili, N.; Baharvand, Z.; Sanei-Taheri, M. The Association of CT-measured Cardiac Indices with Lung Involvement and Clinical Outcome in Patients with COVID-19. Acad. Radiol. 2021, 28, 8–17. [Google Scholar] [CrossRef]
- Argulian, E.; Sud, K.; Vogel, B.; Bohra, C.; Garg, V.P.; Talebi, S.; Lerakis, S.; Narula, J. Right Ventricular Dilation in Hospitalized Patients With COVID-19 Infection. JACC Cardiovasc. Imaging 2020, 13, 2459–2461. [Google Scholar] [CrossRef]
- Li, Y.-L.; Zheng, J.-B.; Jin, Y.; Tang, R.; Li, M.; Xiu, C.-H.; Dai, Q.-Q.; Zuo, S.; Wang, H.-Q.; Wang, H.-L.; et al. Acute right ventricular dysfunction in severe COVID-19 pneumonia. Rev. Cardiovasc. Med. 2020, 21, 635–641. [Google Scholar] [CrossRef]
- Patil, V.P.; Salunke, B.G. Fluid Overload and Acute Kidney Injury. Indian J. Crit. Care Med. 2020, 24, 94–97. [Google Scholar] [CrossRef]
- Gluecker, T.; Capasso, P.; Schnyder, P.; Gudinchet, F.; Schaller, M.-D.; Revelly, J.-P.; Chiolero, R.; Vock, P.; Wicky, S. Clinical and Radiologic Features of Pulmonary Edema. RadioGraphics 1999, 19, 1507–1531. [Google Scholar] [CrossRef]
- Gandhi, S.K.; Powers, J.C.; Nomeir, A.-M.; Fowle, K.; Kitzman, D.W.; Rankin, K.M.; Little, W.C. The Pathogenesis of Acute Pulmonary Edema Associated with Hypertension. N. Engl. J. Med. 2001, 344, 17–22. [Google Scholar] [CrossRef] [PubMed] [Green Version]
- Pan, F.; Ye, T.; Sun, P.; Gui, S.; Liang, B.; Li, L.; Zheng, D.; Wang, J.; Hesketh, R.L.; Yang, L.; et al. Time Course of Lung Changes at Chest CT during Recovery from Coronavirus Disease 2019 (COVID-19). Radiology 2020, 295, 715–721. [Google Scholar] [CrossRef] [PubMed] [Green Version]
- Bonifazi, M.; Mei, F.; Skrami, E.; Latini, L.; Amico, D.; Balestro, E.; Bini, F.; Bonifazi, F.; Caminati, A.; Candoli, P.; et al. Predictors of Worse Prognosis in Young and Middle-Aged Adults Hospitalized with COVID-19 Pneumonia: A Multi-Center Italian Study (COVID-UNDER50). J. Clin. Med. 2021, 10, 1218. [Google Scholar] [CrossRef] [PubMed]
- Tao, Z.; Xu, J.; Chen, W.; Yang, Z.; Xu, X.; Liu, L.; Chen, R.; Xie, J.; Liu, M.; Wu, J.; et al. Anemia is associated with severe illness in COVID-19: A retrospective cohort study. J. Med. Virol. 2021, 93, 1478–1488. [Google Scholar] [CrossRef] [PubMed]
- Taneri, P.E.; Gómez-Ochoa, S.A.; Llanaj, E.; Raguindin, P.F.; Rojas, L.Z.; Roa-Díaz, Z.M.; Salvador, D., Jr.; Groothof, D.; Minder, B.; Kopp-Heim, D.; et al. Anemia and iron metabolism in COVID-19: A systematic review and meta-analysis. Eur. J. Epidemiol. 2020, 35, 763–773. [Google Scholar] [CrossRef]
- Hariyanto, T.I.; Kurniawan, A. Anemia is associated with severe coronavirus disease 2019 (COVID-19) infection. Transfus. Apher. Sci. 2020, 59, 102926. [Google Scholar] [CrossRef] [PubMed]
- Hu, L.; Gong, L.; Jiang, Z.; Wang, Q.; Zou, Y.; Zhu, L. Clinical analysis of sinus bradycardia in patients with severe COVID-19 pneumonia. Crit. Care 2020, 24, 257. [Google Scholar] [CrossRef]
- Amaratunga, E.A.; Corwin, D.S.; Moran, L.; Snyder, R. Bradycardia in Patients With COVID-19: A Calm Before the Storm? Cureus 2020, 12, e8599. [Google Scholar] [CrossRef]
- Capoferri, G.; Osthoff, M.; Egli, A.; Stoeckle, M.; Bassetti, S. Relative bradycardia in patients with COVID-19. Clin. Microbiol. Infect. 2021, 27, 295–296. [Google Scholar] [CrossRef]
- Habib, M.B.; Elshafei, M.; Rahhal, A.; Mohamed, M.F.H. Severe sinus bradycardia associated with favipiravir in a COVID-19 patient. Clin. Case Rep. 2021, 9, e04566. [Google Scholar] [CrossRef]
- Amir, M.; Renata, A.; Ratana, L.T. Symptomatic sinus bradycardia due to electrolyte imbalances in syndrome of inappropriate antidiuretic hormone (SIADH) related COVID-19: A case report. BMC Infect. Dis. 2021, 21, 465. [Google Scholar] [CrossRef]
- Kang, Y.; Wang, H.; Chen, H.; Wang, B.; Yang, Y.; Zhao, X.; Ran, Q.; Wei, J. Suspected Hydroxychloroquine-Induced Sinus Bradycardia and QTc Prolongation in a Patient with COVID-19. Int. Hear. J. 2020, 61, 1056–1058. [Google Scholar] [CrossRef]
- Touafchia, A.; Bagheri, H.; Carrié, D.; Durrieu, G.; Sommet, A.; Chouchana, L.; Montastruc, F. Serious bradycardia and remdesivir for coronavirus 2019 (COVID-19): A new safety concerns. Clin. Microbiol. Infect. 2021, 27, 791.e5–791.e8. [Google Scholar] [CrossRef] [PubMed]
- Attena, E.; Albani, S.; Maraolo, A.E.; Mollica, M.; De Rosa, A.; Pisapia, R.; Fiorentino, G.; Parrella, R.; Severino, S.; Russo, V. Remdesivir-Induced Bradycardia in COVID-19: A Single Center Prospective Study. Circ. Arrhythmia Electrophysiol. 2021, 14, e009811. [Google Scholar] [CrossRef]
- Beyls, C.; Martin, N.; Hermida, A.; Abou-Arab, O.; Mahjoub, Y. Lopinavir-Ritonavir Treatment for COVID-19 Infection in Intensive Care Unit. Circ. Arrhythmia Electrophysiol. 2020, 13, e008798. [Google Scholar] [CrossRef]
- Maiese, A.; Manetti, A.C.; La Russa, R.; Di Paolo, M.; Turillazzi, E.; Frati, P.; Fineschi, V. Autopsy findings in COVID-19-related deaths: A literature review. Forensic Sci. Med. Pathol. 2021, 17, 279–296. [Google Scholar] [CrossRef]
- Gibson, P.G.; Qin, L.; Puah, S.H. COVID-19 acute respiratory distress syndrome (ARDS): Clinical features and differences from typical pre-COVID-19 ARDS. Med. J. Aust. 2020, 213, 54e1–56e1. [Google Scholar] [CrossRef]
- Mason, R.J. Thoughts on the alveolar phase of COVID-19. Am. J. Physiol. Cell. Mol. Physiol. 2020, 319, L115–L120. [Google Scholar] [CrossRef]
- Pomara, C.; Volti, G.L.; Cappello, F. COVID-19 Deaths: Are We Sure It Is Pneumonia? Please, Autopsy, Autopsy, Autopsy! J. Clin. Med. 2020, 9, 1259. [Google Scholar] [CrossRef] [PubMed]
- Carey, R.M.; Padia, S.H. Physiology and regulation of the renin–Angiotensin–Aldosterone system. In Textbook of Nephro-Endocrinology, 2nd ed.; Singh, A.K., Williams, G.H., Eds.; Academic Press: London, UK, 2018; pp. 1–25. Available online: https://www.sciencedirect.com/science/article/pii/B9780128032473000015 (accessed on 13 September 2021). [CrossRef]
- Aoyagi, T.; Izumi, Y.; Hiroyama, M.; Matsuzaki, T.; Yasuoka, Y.; Sanbe, A.; Miyazaki, H.; Fujiwara, Y.; Nakayama, Y.; Kohda, Y.; et al. Vasopressin regulates the renin-angiotensin-aldosterone system via V1a receptors in macula densa cells. Am. J. Physiol. Physiol. 2008, 295, F100–F107. [Google Scholar] [CrossRef] [Green Version]
- Firth, J.; Raine, A.; Ledingham, J. Raised venous pressure: A direct cause of renal sodium retention in oedema? Lancet 1988, 331, 1033–1035. [Google Scholar] [CrossRef]
- Chappell, D.; Bruegger, D.; Potzel, J.; Jacob, M.; Brettner, F.; Vogeser, M.; Conzen, P.; Becker, B.F.; Rehm, M. Hypervolemia increases release of atrial natriuretic peptide and shedding of the endothelial glycocalyx. Crit. Care 2014, 18, 538. [Google Scholar] [CrossRef] [PubMed] [Green Version]
- Mei, F.; Berardino, A.D.M.; Bonifazi, M.; Latini, L.; Zuccatosta, L.; Gasparini, S. Validation of Remote Dielectric Sensing (ReDS) in Monitoring Adult Patients Affected by COVID-19 Pneumonia. Diagnostics 2021, 11, 1003. [Google Scholar] [CrossRef] [PubMed]


| CASE | APACHE II | VAC-1 | VAC-2 | BMI | DBT | CARD | SMK | HCT | PaO2/FiO2 | CT Score |
|---|---|---|---|---|---|---|---|---|---|---|
| 1 | 21 | SPK | 27 | HT | No | 43.1 | 60 | 21 | ||
| 2 | 13 | 23 | No | 25 | 62 | 13 | ||||
| 3 | 13 | A-Z | 28 | No | 37 | 65 | 20 | |||
| 4 | 8 | SNP | 24 | No | 29.3 | 188 | 17 | |||
| 5 | 3 | 33 | No | 42.7 | 56 | 17 | ||||
| 6 | 7 | 27 | No | 43 | 110 | 14 | ||||
| 7 | 13 | SPK | 25 | AF | No | 35 | 61 | 23 | ||
| 8 | 9 | SPK | 35 | Yes | 41 | 100 | 19 | |||
| 9 | 7 | 32 | No | 38 | 177 | 18 | ||||
| 10 | 9 | A-Z | 26 | DBT2 | No | 37.4 | 86 | 25 | ||
| 11 | 3 | 33 | No | 38 | 120 | 12 | ||||
| 12 | 10 | SNP | 31 | No | 35.3 | 121 | 20 | |||
| 13 | 9 | SNP | SNP | 25 | HT | No | 45 | 101 | 16 | |
| 14 | 8 | SNP | 27 | Yes | 39 | 185 | 11 | |||
| 15 | 5 | 28 | HT | No | 35.7 | 145 | 22 | |||
| 16 | 3 | 22 | No | 41 | 197 | 12 | ||||
| 17 | 12 | 22 | DBT2 | HT | No | 38.3 | 102 | 17 | ||
| 18 | 10 | SPK | 25 | AF | Yes | 34.9 | 160 | 17 | ||
| 19 | 7 | A-Z | 25 | No | 31.3 | 104 | 11 | |||
| 20 | 5 | 33 | DBT2 | No | 40 | 162 | 19 |
| CASE | COVID-19 Diagnosis | HCT | LEUK | LYMP | D-Dimer | proBNP | Troponin | CRP | PCT |
|---|---|---|---|---|---|---|---|---|---|
| 1 | PCR+ | 43.1 | 12,140 | 364 | NO | 1191 | 10 | 0.2 | |
| 2 | PCR+ | 25 | 16,760 | 1710 | 0.04 | 8 | 0.38 | ||
| 3 | PCR+ | 37 | 22,000 | 1180 | 0.2 | 655 | 6 | ||
| 4 | PCR+ | 29.3 | 8450 | 2130 | 0.33 | 253 | 7 | 48.9 | 0 |
| 5 | PCR+ | 42.7 | 9210 | 1234 | 0.37 | 16 | 11 | 15.5 | 0.1 |
| 6 | PCR+ | 43 | 16,560 | 894 | 0.92 | 35 | 3 | 16.6 | |
| 7 | PCR+ | 35 | 16,830 | 539 | 0.19 | ||||
| 8 | PCR+ | 41 | 8000 | 770 | 2.4 | 330 | 31 | ||
| 9 | PCR+ | 38 | 8510 | 885 | 1.09 | 280 | 6 | 18 | 0.07 |
| 10 | PCR+ | 37.4 | 14,450 | 795 | 0.55 | 109 | 0.8 | ||
| 11 | PCR+ | 38 | 5850 | 1433 | 0.19 | 133 | 5 | 33 | 0.05 |
| 12 | PCR+ | 35.3 | 13,670 | 1121 | 0.48 | 351 | 5 | 44.9 | 0 |
| 13 | PCR+ | 45 | 17,700 | 779 | 0.22 | 80 | 9 | 40 | 0.17 |
| 14 | PCR+ | 39 | 16,900 | 3700 | 0.25 | 10 | 4 | 18 | 0 |
| 15 | PCR+ | 35.7 | 14,090 | 1043 | 0.91 | 111 | 6 | 52.6 | 0.31 |
| 16 | IgM+ | 41 | 6900 | 1553 | 0.19 | 18 | 7 | 15.8 | 0.05 |
| 17 | PCR+ | 38.3 | 7050 | 455 | >4.4 | 367 | 6 | 35 | |
| 18 | PCR+ | 34.9 | 16,500 | 446 | <0.19 | 537 | 5 | 37 | 0.24 |
| 19 | PCR+ | 31.3 | 6530 | 581 | 0.45 | NO | 4 | 59.4 | 0.05 |
| 20 | PCR+ | 40 | 6660 | 733 | 0.26 | 85 | 5 | 46 | 0.08 |
| Variable | Prior NEGBAL | Admission NEGBAL | Day 4 NEGBAL | |||||
|---|---|---|---|---|---|---|---|---|
| Mean | SD | p Value (a) | Mean | SD | p Value (b) | Mean | SD | |
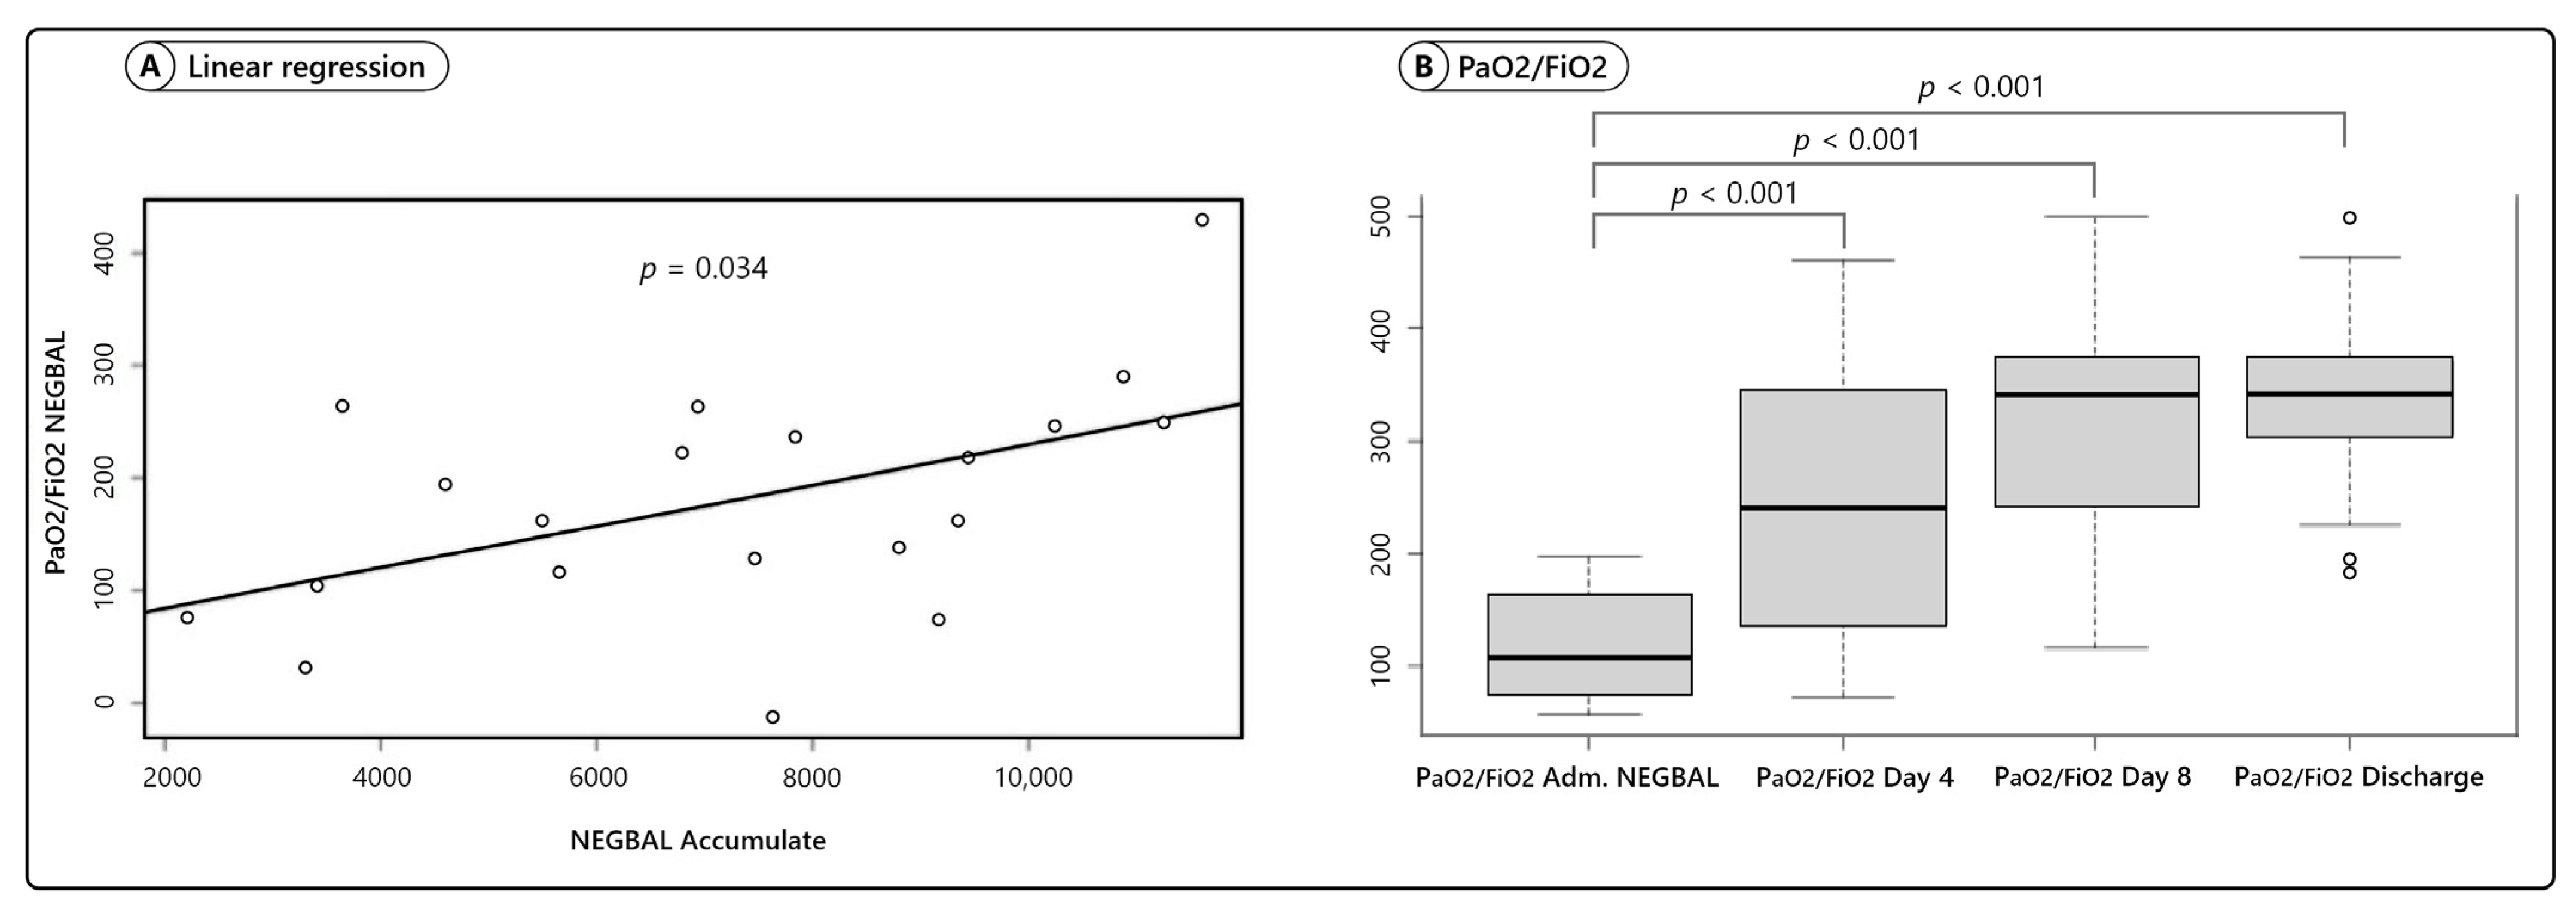
| PaO2FiO2 | 118 | ±47 | p < 0.001 | 246 | ±111 | |||
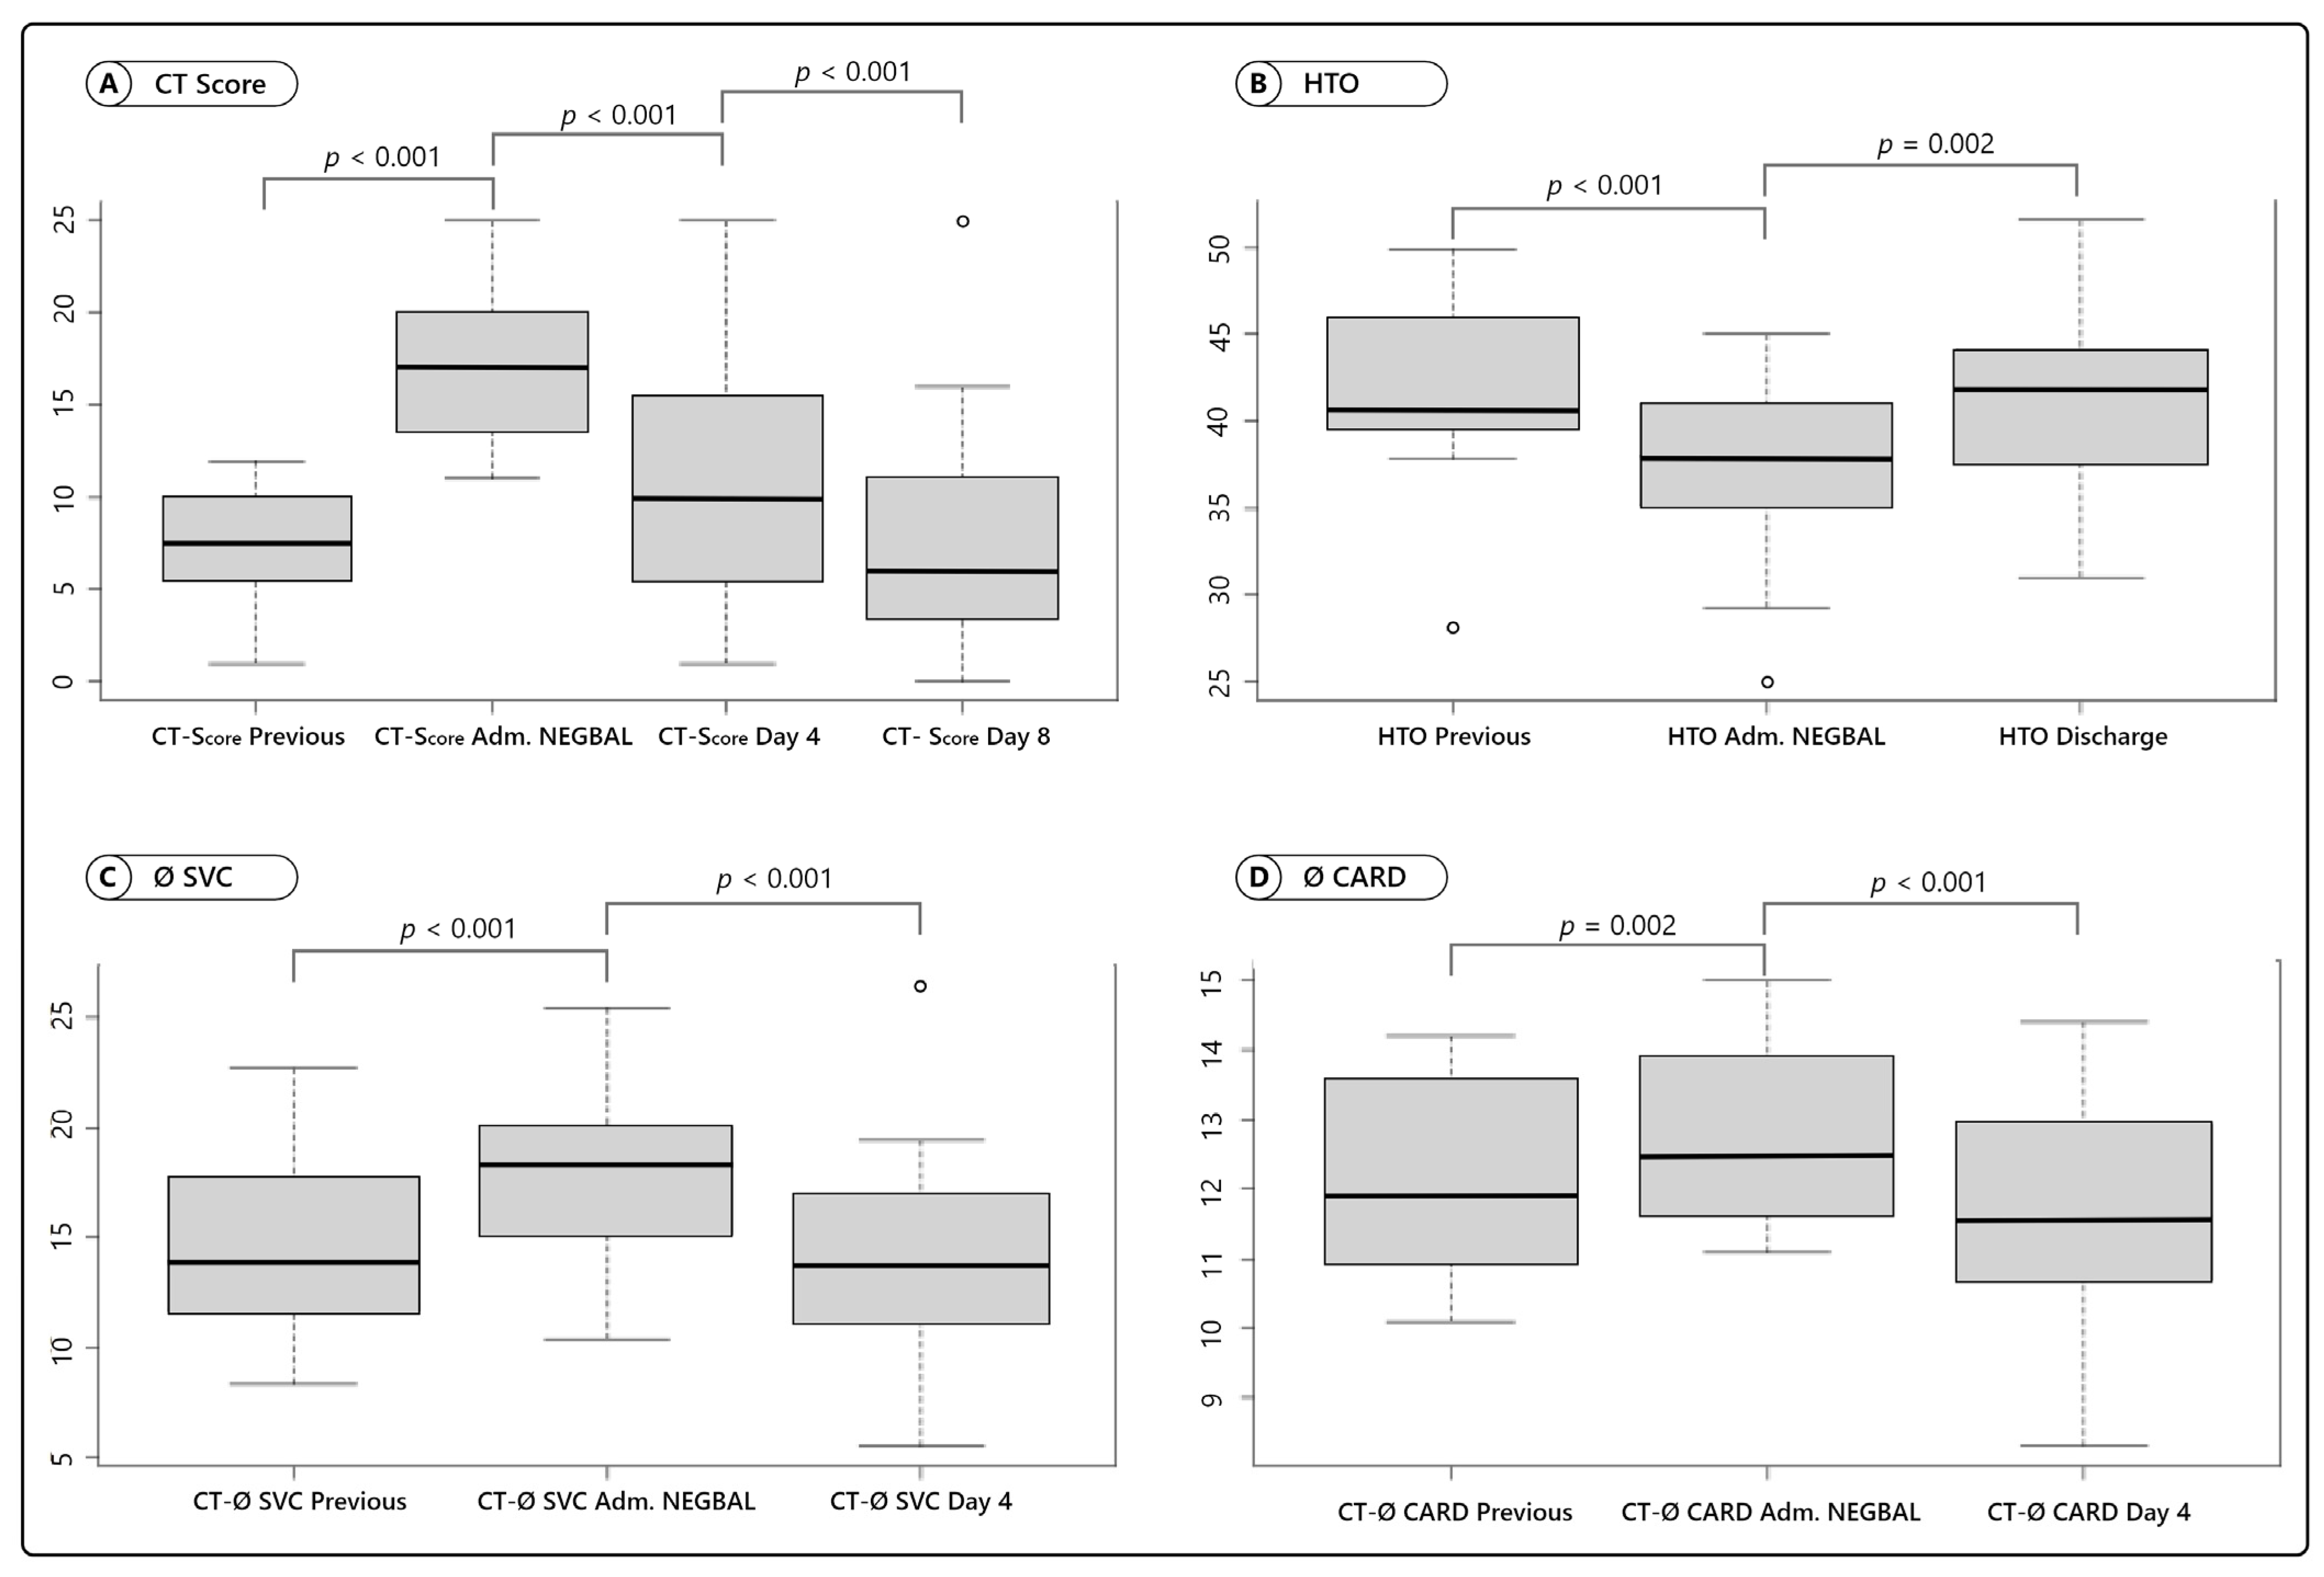
| CT Score | 7.1 | ±1.4 | p < 0.001 | 17.2 | ±1.3 | p < 0.001 | 10.6 | ±1.6 |
| Diameter SVC, mm | 14.6 | ±4.4 | p < 0.001 | 17.9 | ±3.8 | p < 0.001 | 14.2 | ±4.5 |
| Cardiac Axis, cm | 12.2 | ±1.4 | p < 0.001 | 12.8 | ±1.3 | p < 0.001 | 11.7 | ±1.6 |
| CTR | 0.45 | ±0.05 | p = 0.002 | 0.49 | ±0.04 | p < 0.001 | 0.45 | ±0.06 |
| Hematocrit, % | 41.5 | ±5.6 | p < 0.001 | 37.5 | ±4.9 | p = 0.002 | Discharge Day | |
| 40.7 | ±5 | |||||||
Publisher’s Note: MDPI stays neutral with regard to jurisdictional claims in published maps and institutional affiliations. |
© 2021 by the authors. Licensee MDPI, Basel, Switzerland. This article is an open access article distributed under the terms and conditions of the Creative Commons Attribution (CC BY) license (https://creativecommons.org/licenses/by/4.0/).
Share and Cite
Santos, J.L.F.; Zanardi, P.; Alo, V.; Rodriguez, M.; Magdaleno, F.; De Langhe, V.; Dos Santos, V.; Murialdo, G.; Villoldo, A.; Coria, M.; et al. Pulmonary Edema in COVID-19 Treated with Furosemide and Negative Fluid Balance (NEGBAL): A Different and Promising Approach. J. Clin. Med. 2021, 10, 5599. https://doi.org/10.3390/jcm10235599
Santos JLF, Zanardi P, Alo V, Rodriguez M, Magdaleno F, De Langhe V, Dos Santos V, Murialdo G, Villoldo A, Coria M, et al. Pulmonary Edema in COVID-19 Treated with Furosemide and Negative Fluid Balance (NEGBAL): A Different and Promising Approach. Journal of Clinical Medicine. 2021; 10(23):5599. https://doi.org/10.3390/jcm10235599
Chicago/Turabian StyleSantos, Jose L. Francisco, Patricio Zanardi, Veronica Alo, Marcelo Rodriguez, Federico Magdaleno, Virginia De Langhe, Vanina Dos Santos, Giuliana Murialdo, Andrea Villoldo, Micaela Coria, and et al. 2021. "Pulmonary Edema in COVID-19 Treated with Furosemide and Negative Fluid Balance (NEGBAL): A Different and Promising Approach" Journal of Clinical Medicine 10, no. 23: 5599. https://doi.org/10.3390/jcm10235599