


Abstract
In a retrospective cohort study, among 131 773 patients with previous coronavirus disease 2019 (COVID-19), reinfection with severe acute respiratory syndrome coronavirus 2 (SARS-COV-2) was suspected in 253 patients (0.2%) at 238 US healthcare facilities between 1 June 2020 and 28 February 2021. Women displayed a higher cumulative reinfection risk. Healthcare burden and illness severity were similar between index and reinfection encounters.
The United States encountered the heaviest burden of severe acute respiratory syndrome coronavirus 2 (SARS-CoV-2) infections globally in 2020 with >30 million infected. These individuals are a large group at risk for reinfection, because the durability of immunity offered by natural infection beyond 6 months remains unclear [1]. Understanding the ongoing risk of reinfection with SARS-CoV-2 is critical to guiding appropriate personal safety and public health measures.
Several studies have consistently indicated that SARS-CoV-2 reinfection is a relatively rare occurrence, with frequencies ranging between 0.02% and 1.0% [2, 3]. A Danish surveillance study covering 69% of the population of Denmark suggested a reinfection frequency of 0.65% [4]. The United States lacks population surveillance data on this topic; evidence thus far is limited to 2 smaller retrospective cohort studies that similarly found that suspected reinfections occurred infrequently, at 0.7% [5, 6]. One of these studies [5], however, was limited to a single healthcare system in 2 US states, and the other [6] ended follow-up in November 2020, before the period of heaviest incident cases during the third wave of the pandemic (December 2020 to January 2021). We therefore sought to leverage observational clinical and administrative data from electronic medical records and included data from the first full year of the US pandemic to retrospectively determine the incidence and associated healthcare utilization of suspected SARS-CoV-2 reinfection and the evolution and predictors of reinfection risk over time.
METHODS
The Premier Healthcare Database contains administrative data on inpatient and outpatient discharges from >800 centers across 48 US states. All adult patients aged ≥18 years who underwent SARS-CoV-2 polymerase chain reaction (PCR) testing at a participating healthcare facility, from 1 March 2020 through 28 February 2021, were identified from a subset of 247 healthcare facilities that also submits clinical data from the TheraDoc clinical surveillance systems. This research activity was reviewed by the US Centers for Disease Control and Prevention and was conducted consistently with applicable federal law and Centers for Disease Control and Prevention policy (see, eg, 45 CFR part 46, 21 CFR part 56, 42 USC §241[d], 5 USC §552a, and 44 USC §3501 et seq). Given the deidentified nature of the data, the study was exempt from institutional review board review under the Revised Common Rule of the National Institutes of Health Office of Human Subject Research Protections.
Suspected reinfection was defined as ≥2 positive SARS-CoV-2 PCR test results ≥90 days apart [7]. The last recorded positive PCR test result (for the index encounter) was used as the start date for the 90-day interval before the reinfection risk period. Patients whose index positive SARS-CoV-2 PCR test result occurred after 30 November 2020 were excluded to allow a minimum of 90 days of follow-up within the study period. Fisher exact tests were used to compared demographic and clinical characteristics of between patients with a sole SARS-CoV-2 infection and those with a suspected reinfection, while McNemar tests were used to compare the initial versus potential reinfection encounters. An alluvial plot was constructed for one-to-one comparison between the care settings of index versus suspected reinfection encounters. Univariate comparisons of cumulative risk were made for age (<65 vs ≥65 years), sex (male vs female), US census region, and high versus low monthly SARS-CoV-2 testing frequency (below vs at or above the median) for each healthcare facility. These variables were included in a multivariable Cox proportional hazards model to further assess their association with higher cumulative reinfection risk.
RESULTS
Between 1 March and 30 November 2020, we identified 131 773 patients who received ≥1 positive SARS-CoV-2 PCR result (positivity rate, 8.8%; see Supplementary Figure 1). Of these, 2536 patients (1.9%) also underwent repeated SARS-CoV-2 PCR testing ≥90 days later, with 253 unique patients meeting criteria for suspected reinfection (0.2% of patients with a positive result, 10.0% of those who were retested), corresponding to a reinfection rate of 4.96 per 10 000 person-months of potentially exposed time. Demographic and clinical encounter characteristics for patients who developed a suspected reinfection versus those who did not are shown in Table 1, and characteristics of the index and reinfection clinical encounters for those with suspected reinfection in Table 2. More patients with (vs without) suspected reinfection were female (64.8% vs 54.0%; P = .001), and more frequently had ≥1 underlying medical condition (32.5% vs 25.0%; P = .03). The majority of reinfections required the same level of care as the index infection (Figure 1).
Demographic and Clinical Encounter Characteristics of Patients With or Without Suspected Severe Acute Respiratory Syndrome Coronavirus 2 Reinfectiona
| Characteristic | Patients With SARS-CoV-2 Infection, No. (%)b | P Valuec | |
|---|---|---|---|
| Reinfection Not Suspected (n = 131 520) | Reinfection Suspected (n = 253) | ||
| Age, median (IQR), y | 47.0 (31.0–62.0) | 45.0 (31.0–63.0) | .75 |
| Sex | |||
| Female | 71 066 (54.0) | 164 (64.8) | .001 |
| Male | 60 454 (46.0) | 89 (35.2) | |
| Race/ethnicity | |||
| Hispanic | 28 404 (21.6) | 64 (25.3) | .47 |
| Non-Hispanic Asian | 2753 (2.1) | 8 (3.2) | |
| Non-Hispanic black | 24 754 (18.8) | 47 (18.6) | |
| Non-Hispanic, all other races | 7885 (6.0) | 14 (5.5) | |
| Non-Hispanic white | 60 509 (46.0) | 110 (43.5) | |
| Unknown race | 7215 (5.5) | 10 (4.0) | |
| Facility type | |||
| Urban | 114 725 (87.2) | 230 (90.9) | .09 |
| Teaching | 59 676 (45.4) | 129 (51.0) | .08 |
| No. of acute care beds | |||
| ≤99 | 12 501 (9.5) | 17 (6.7) | .14 |
| 100–199 | 18 916 (14.4) | 30 (11.9) | |
| 200–299 | 23 873 (18.2) | 51 (20.2) | |
| 300–399 | 18 568 (14.1) | 32 (12.6) | |
| 400–499 | 8290 (6.3) | 11 (4.3) | |
| ≥500 | 49 372 (37.5) | 112 (44.3) | |
| US census region | |||
| Midwest | 29 968 (22.8) | 48 (19.0) | .04 |
| Northeast | 12 595 (9.6) | 25 (9.9) | |
| South | 86 691 (65.9) | 180 (71.1) | |
| West | 2266 (1.7) | 0 (0) | |
| Comorbid conditionsd,e | |||
| Any | 20 643 (25.0) | 51 (32.5) | .03 |
| Cancer | 1091 (1.3) | <5 | .16 |
| Stage 3 CKD | 2947 (3.6) | 11 (7.0) | .03 |
| COPD | 3011 (3.6) | 7 (4.5) | .52 |
| Immunocompromise | 1206 (1.5) | <5 | >.99 |
| Obesity/overweight | 7114 (8.6) | 19 (12.1) | .12 |
| Pregnancy | 1847 (2.2) | <5 | >.99 |
| Diabetes | 9919 (12.0) | 30 (19.1) | .009 |
| Asthma | 760 (0.9) | <5 | .18 |
| Interstitial lung disease | 227 (0.3) | <5 | .35 |
| Thalassemia | 26 (0.03) | 0 | >.99 |
| Heart failure | 4695 (5.7) | 18 (11.5) | .005 |
| Cerebrovascular disease | 1760 (2.1) | <5 | >.99 |
| Hypertension | 6907 (8.4) | 19 (12.1) | .11 |
Abbreviations: CKD, chronic kidney disease; COPD, chronic obstructive pulmonary disorder; IQR, interquartile range; SARS-CoV-2, severe acute respiratory syndrome coronavirus 2.
aThe study was conducted in 238 US healthcare facilities. The primary infection period was from 1 March to 30 November 2020; the reinfection risk period, from 1 June 2020 to 28 February 2021.
bData represent no. (%) of patients unless otherwise specified.
cStatistically significant differences were determined using 2-sample t tests for continous variables, and Pearson χ 2 or McNemar tests for categorical variables, as appropriate.
dRestricted to patients receiving care in inpatient or emergency department/observation settings, for single positive test group (n = 82 733) and the reinfection cohort (n = 157).
eRestricted to comorbid conditions present on admission and associated with increased risk for severe coronavirus disease 2019. Sickle cell disease, cystic fibrosis, and cirrhosis were not excluded but were not found in the reinfection cohort.
Clinical Encounter Characteristics in Patients With Suspected Severe Acute Respiratory Syndrome Coronavirus 2 Reinfectiona
| Characteristic | Patients With Suspected SARS-CoV-2 Reinfection, No. (%)b | P Valuec | |
|---|---|---|---|
| Index Infection Encounter (n = 253) | Suspected Reinfection Encounter (n = 253) | ||
| COVID-19 diagnosis | |||
| Primary/admitting | 162 (64.0) | 102 (40.3) | <.001 |
| Secondary | 31 (12.3) | 72 (28.5) | <.001 |
| Acute respiratory failure indicators POA | |||
| No acute respiratory failure | 234 (92.1) | 240 (94.9) | .21 |
| Acute respiratory failure | 13 (5.1) | 13 (5.1) | |
| ICU admission or NIPPV | 6 (2.4) | 0 | |
| Mechanical ventilation | <5 | 0 | |
| Other acute organ failure indicators POAd | |||
| Renal failure | 14 (5.5) | 11 (4.3) | .44 |
| Hepatic failure | <5 | <5 | >.99 |
| Hematologic failure | 10 (4.0) | <5 | .08 |
| Metabolic failure | <5 | 10 (4.0) | .02 |
| Neurologic failure | 9 (3.6) | 9 (3.6) | >.99 |
| Medications administered during encounter | |||
| Remdesivir | 7 (2.8) | 8(3.2) | .78 |
| Systemic corticosteroids | 28 (11.1) | 32 (12.7) | .56 |
Abbreviations: COVID-19, coronavirus disease 2019; ICU, intensive care unit; IQR, interquartile range; NIPPV, noninvasive positive pressure ventilation; POA, present on admission; SARS-CoV-2, severe acute respiratory syndrome coronavirus 2.
aThe study was conducted in 238 US healthcare facilities. The primary infection period was from 1 March to 30 November 2020; the reinfection risk period, from 1 June 2020 to 28 February 2021.
bTo protect patient privacy, counts <5 were suppressed.
cStatistically significant differences were determined using 2-sample t tests for continuous variables, and Pearson χ2 or McNemar tests for categorical variables, as appropriate.
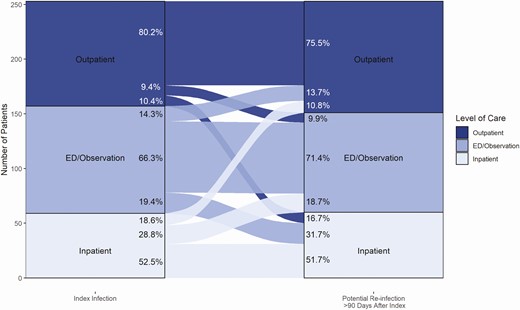
Comparison of care settings between index severe acute respiratory syndrome coronavirus 2 (SARS-CoV-2) infection encounters (n = 253) and suspected SARS-CoV-2 reinfection encounters (n = 253), in 90 US healthcare facilities, from 1 March 2020 to 28 February 2021. The alluvial plot displays the one-to-one relationship between the care setting required at the time of identification of the index and the suspected reinfection, respectively, for patients identitied as having suspected SARS-CoV-2 reinfection. Percentages represent the proportion of patients moving from one care setting in the index infection to the respective care setting in the reinfection encounter and the proportion of the reinfection encounters they contributed per care setting (eg, 80.2% of patients needing outpatient care in the index infection would require outpatient care in the reinfection encounter, and these patients represented 75.5% of outpatient care encounters for all reinfections). Abbreviation: ED, emergency department.
The International Classification of Diseases, Tenth Revision (ICD-10), diagnosis code for coronavirus disease 2019 (COVID-19) (U07.1) was listed as the primary (including admitting) diagnosis for 64.0% of index infections versus 40.3% of reinfection encounters (P < .001). ICD-10 codes for fever, cough, and/or dyspnea were recorded as primary or secondary diagnoses for 31.9% of index encounters versus 30.0% of suspected reinfection encounters (P = .23). Patients with suspected reinfection were less likely to have received remdesivir and corticosteroids during their index infection, while there was no difference in the use of tocilizumab between patients with and those without suspected reinfection (remdesivir, 2.8% vs 7.1%, respectively [P = .007]; corticosteroids, 11.0% vs 23.3% [P < .001]; and tocilizumab, 0.0% vs 1.3% [P = .20]).
The same proportions of patients with suspected reinfections received ICD-10 diagnosis coding for acute respiratory failure for their suspected reinfection and for their index infection encounters (5.1% vs 5.1%; P = .21). Six patients with suspected reinfections needed intensive care unit admission and/or noninvasive positive pressure ventilation, and <5 patients (exact count suppressed) needed mechanical ventilation within a day after admission. The use of remdesivir and the use of corticosteroids were comparable between the index infection and the suspected reinfection encounter (2.8% vs 3.2% [P = .78] and 11.1% vs 12.7% [P = .56], respectively). No tocilizumab administration was reported in either encounter among those with suspected reinfection. Of patients with suspected reinfection, 7 died during their suspected reinfection encounter (2.8%).
Women were at higher risk for reinfection than men (hazard ratio for suspected reinfection in women vs men, 1.579 [95% confidence interval: 1.283–1.941]; P < .001) (Supplementary Figure 2C and Supplementary Table 1). There was no significant difference in cumulative risk of reinfection between patients <65 versus ≥65 years of age, nor by geographic region or testing rate.
DISCUSSION
In the current study, COVID-19 reinfections were rarely detected in healthcare facilities in the United States during the first 9 months of risk for reinfection, and reinfection currently seems to account for a small portion of the morbidity, mortality, and healthcare resource burden in the United States. Our results complement existing evidence from international surveillance and other US- and non–US-based studies on the topic [4–6]. The SARS-CoV-2 reinfection rate of 0.2% in our study is lower than reported in 2 previous smaller US studies (both reported a reinfection rate ≤0.7%) [5, 6], likely reflecting differences in study populations, inclusion criteria, reinfection definitions, and follow-up times, but the findings collectively reinforce a common theme that the risk of reinfection remains low.
In this study, there was a higher rate of suspected reinfection in women than in men, which has not been previously reported and contrasts with previously published sex-specific infection rates [8]. However, a recent report has identified that women have more breakthrough infections after SARS-CoV-2 vaccination than men [9]. The mechanistic basis for this female sex predilection for reinfection and vaccination breakthroughs warrants investigation. In contrast to a population surveillance study in Denmark [4], age ≥65 years was not identified as a significant risk factor for reinfection in our relatively larger study, although a nonsignificant trend of increased risk with older age was observed on longer follow-up. Our results did not identify any geographic differences in reinfection rates, stratified by month (data not shown). While locally circulating SARS-CoV-2 variants can pose increased transmissibility or higher risks of evading previously established immunity, variants of concern were not identified in the United States until late in the time frame of this analysis [10, 11].
There were some notable similarities between the index infection and suspected reinfection encounters in the same patient, including similar frequencies of ICD-10 diagnostic coding for common COVID-19 symptoms and acute respiratory failure, distributions of care setting, and inpatient COVID-19–targeted medication use. While coding for clinical features might provide an incomplete account of actual frequency, at least our study suggests that patients tend not to be markedly sicker in subsequent episodes, which has prognostic and resource implications.
The current study has its strengths. Our study population includes the largest number of individuals with COVID-19 in whom the risk of reinfection has been examined to date—>10–fold larger than in other contemporaneous studies [4–6]—and the first multi–healthcare system analysis to capture potential reinfections occurring during the third wave of the pandemic in the United States. We identified suspected reinfections spanning a range of care settings, periods of high and low community transmission, and a long follow-up period. Finally, because vaccination only became available to the general population towards the end of our study period, the impact of vaccination on the reinfection rates identified here is likely negligible.
Our study also has limitations. First, without any genome sequencing data to confirm reinfection, it relied on renewed PCR positivity in a previously infected patient as a marker of reinfection. Some positive test results could represent persistent viral shedding from the index infection, including in patients with impaired immunity (<5% of the cohort), although our requirement of a minimum 90-day interval between positive PCRs likely minimized this possibility [12]. Conversely, given the plethora of SARS-CoV-2 testing avenues in the United States, we likely missed test results obtained outside healthcare facilities reporting to Premier Inc. Furthermore, all patients reinfected and coming to medical attention before the 90-day cutoff would also have been missed. As such, our 0.2% estimate of the frequency of reinfection is likely to be an underestimate of all reinfections but more closely captures the frequency of patients that seek medical attention. Second, survival bias and the administrative nature of the patient-level data might preclude rigorous assessments of comparisons of illness severity. Third, we were unable to determine the indication for SARS-CoV-2 testing and cannot distinguish among clinically indicated, exposure-based, and routine admissions-based testing.
Overall, these results are encouraging from a public health perspective, as the burden of symptomatic and/or acutely ill patients with suspected reinfection was low. Variants of concern and the possible waning of immunity over time might lead to a higher burden of reinfection in the future. Ongoing surveillance will be critical.
Supplementary Data
Supplementary materials are available at Clinical Infectious Diseases online. Consisting of data provided by the authors to benefit the reader, the posted materials are not copyedited and are the sole responsibility of the authors, so questions or comments should be addressed to the corresponding author.
Notes
Financial support. This work was supported by the Intramural Research Program of the NIH Clinical Center.
Potential conflicts of interest. All authors: No reported conflicts. All authors have submitted the ICMJE Form for Disclosure of Potential Conflicts of Interest. Conflicts that the editors consider relevant to the content of the manuscript have been disclosed.
References
Author notes
A. L. and S. W. contributed equally to this work


Comments