Article Text

Abstract
Objectives A number of studies have shown that the airborne transmission route could spread some viruses over a distance of 2 meters from an infected person. An epidemic model based only on respiratory droplets and close contact could not fully explain the regional differences in the spread of COVID-19 in Italy. On March 16th 2020, we presented a position paper proposing a research hypothesis concerning the association between higher mortality rates due to COVID-19 observed in Northern Italy and average concentrations of PM10 exceeding a daily limit of 50 µg/m3.
Methods To monitor the spreading of COVID-19 in Italy from February 24th to March 13th (the date of the Italian lockdown), official daily data for PM10 levels were collected from all Italian provinces between February 9th and February 29th, taking into account the maximum lag period (14 days) between the infection and diagnosis. In addition to the number of exceedances of the daily limit value of PM10, we also considered population data and daily travelling information for each province.
Results Exceedance of the daily limit value of PM10 appears to be a significant predictor of infection in univariate analyses (p<0.001). Less polluted provinces had a median of 0.03 infections over 1000 residents, while the most polluted provinces showed a median of 0.26 cases. Thirty-nine out of 41 Northern Italian provinces resulted in the category with the highest PM10 levels, while 62 out of 66 Southern provinces presented low PM10 concentrations (p<0.001). In Milan, the average growth rate before the lockdown was significantly higher than in Rome (0.34 vs 0.27 per day, with a doubling time of 2.0 days vs 2.6, respectively), thus suggesting a basic reproductive number R0>6.0, comparable with the highest values estimated for China.
Conclusion A significant association has been found between the geographical distribution of daily PM10 exceedances and the initial spreading of COVID-19 in the 110 Italian provinces.
- epidemiology
- public health
- virology
This is an open access article distributed in accordance with the Creative Commons Attribution Non Commercial (CC BY-NC 4.0) license, which permits others to distribute, remix, adapt, build upon this work non-commercially, and license their derivative works on different terms, provided the original work is properly cited, appropriate credit is given, any changes made indicated, and the use is non-commercial. See: http://creativecommons.org/licenses/by-nc/4.0/.
Statistics from Altmetric.com
Strengths and limitations of this study
In the perspective of observational study design, we have analysed daily data relevant to ambient PM10 levels, urban conditions and COVID-19 incidence from all Italian provinces, in order to assess the potential association between exceedances of particulate matter (PM) and the initial spread of COVID-19 in Italy.
We used PM10 daily concentration levels collected by the official air quality monitoring stations for each Italian province, but no information about the presence of the virus on PM and its vitality or infective potential was available.
All the provinces have been assigned to two geographical areas (Northern or Southern Italy).
The number of PM10 daily limit value exceedances (50 µg/m3) detected in the different provinces and the number of PM10 monitoring stations for each province, as well as the latitude and population data (number of inhabitants and density), were considered in the analyses.
The number of PM exceedances were computed between February 9th and February 29th in order to take into account the lag period of 14 days, which is the maximum average time elapsed between the contagion and the first weeks of the Italian epidemic (February 24th to March 13th).
Introduction
COVID-19 (due to the new SARS-CoV-2 virus), is known to spread via respiratory droplets and close contact.1 However, this unique transmission model does not seem to explain properly the different initial spreading of the virus observed in Italy from February 24th 2020 to March 13th 2020. The huge virulence of COVID-19 in the Po Valley is not comparable to the milder contagiousness observed in the Central-Southern regions. Demographic factors related to the ageing of the population and the possibility of infection without clinical symptoms for a quite long time—together with the high rate of asymptomatic people that characterises COVID-19 (estimated at 50%–75% of infections)—may only partially explain the fast spreading of the virus in Lombardy and Northern Italy.2 3 Cai et al3 reported different incubation periods in patients infected in Wuhan,4 but an epidemic model based only on respiratory droplets and close contact could not fully explain the regional differences in the spread of COVID-19 in Italy, which was fast and dramatic only in Lombardy and Po Valley. At the same time, a number of studies have shown that the airborne transmission route could spread viruses over a distance of 2 meters from an infected person.5–19 Paules et al4 highlighted that—besides close distance contacts—airborne transmission of SARS-CoV can also occur.5 It has been reported that for some pathogens airborne transport can reach long distances.6–8 Reche et al8 described the aerosolisation of soil-dust and organic aggregates in sea spray that facilitates the long-range transport of bacteria, and likely of viruses, free in the atmosphere.
In particular, virus deposition rates were positively correlated with organic aerosol <0.7 µm, implying that viruses could have longer persistence time in the atmosphere and, consequently, can be dispersed further.8 Moreover Qin et al analysed the microbiome of the airborne particulate matter (PM2.5 and PM10) in Beijing over a period of 6 months in 2012 and 2013, putting in evidence variability of the composition that depended on the months analysed.9 Temporal distribution of the relative abundance of the microbiome on PM showed the highest presence of viruses in January and February, just in coincidence with most severe pollution due to PM. Chen et al demonstrated the relationship between short-term exposure to PM2.5 concentrations and incidence of measles in 21 cities in China.10 Their meta-analyses showed that the nationwide measles incidence was significantly associated with an increase of 10 µg/m3 in PM2.5 levels.
Other recent studies have also reported associations between PM and infectious diseases (eg, influenza, haemorrhagic fever with renal syndrome) as inhalation could bring PM deep into the lungs, and viruses attached to particles may directly invade the lower part of the respiratory tract, thus enhancing the induction of infections, as demonstrated by Sedlmaier et al. 11 Zhao et al showed that the majority of the patients positive for the highly pathogenic avian influenza H5N2 in Iowa (USA) in 2015 might have been infected by airborne viruses carried by fine PM from infected farms, both within the same state and from neighbouring states.12 Ma et al13 observed a positive correlation between the incidence of measles and PM10 in western China during the period 1986–2005; the condensation and stabilisation of the bioaerosol, generating aggregates with atmospheric particles from primary (ie, dust) and secondary particulates, have been indicated as mechanisms able to transport airborne bacteria and viruses to distant regions, even by the intercontinentally transported dust.13 Ferrari et al14 showed measles outbreaks occurring in dry seasons and disappearing at the onset of rainy seasons in Niger,14 while Brown et al15 found that the most severe measles epidemic in the USA occurred in Kansas in 1935 during the Dust Bowl period.15 Coming to recent specific studies, laboratory experiments by van Doremalen et al16 indicated that airborne and fomite transmission of SARS-Cov-2 is plausible, since the virus can remain viable and infectious in aerosol for several hours.16 On-field measurement carried out by Liu et al showed evidence of coronavirus RNA in indoor air samples from Wuhan hospitals and even in ambient air in close proximity, during the COVID-19 outbreak, highlighting the airborne route as a possible important pathway for contamination that should undergo further confirmations.17 Santarpia et al reported the presence of airborne SARS-COV-2 in indoor air samples at the Nebraska University Hospital,18 while—the opposite—some negative evidence of presence of virus in air reported by Ong et al19 comes from explicitly poor sampling schemes.19 Recently, we have published the first evidence in the world of the presence of COVID-19 on outdoor PM in samples collected between 23 February and 9 March in the province of Bergamo (Lombardy, Italy), which experienced the highest diffusion and mortality rates in Italy.20 A research carried out by the Harvard School of Public Health seems to confirm an association between increases in PM concentration and mortality rates due to COVID-19.21 On March 16th 2020, we have released an official position paper highlighting that there is enough evidence to consider the airborne route as a possible additional factor for interpreting the anomalous COVID-19 outbreaks notified in Northern Italy, known to be one of the European areas characterised by the highest PM concentrations.22 23
This article presents the data that led to the publication of the position paper and triggered high interest in the research community working on the hypothesis of a possibility of further transmission via airborne dust,24–26 taking into account the possibility that the potential survival of the virus could be influenced by climatic parameters such as humidity and temperature as well as by fine dust concentrations.27 Other papers support the possible merging of contaminated aerosol with fine particulate in the atmosphere.28–30 The concentration of fine particles has also been repeatedly recognised by other authors as an important cofactor causing higher mortality rates in heavily contaminated areas.31 32 This study is aimed at searching for a possible association between the initial spread of COVID-19 in Italy, registered from the end of February to the first weeks of March 2020 (February 24th to March 13th), and the frequency of high daily average concentrations of PM, recorded before the lockdown, taking into account the lag period of the infection (February 9th to February 29th). The research hypotheses that we addressed is the possibility that air pollution could produce a ‘boost effect’ of the COVID-19 epidemic, thus representing a kind of an exceptional ‘super-spread event’.
Methods
In the frame of an observational design of the study, we have analysed daily data relevant to ambient PM10 levels, urban conditions and COVID-19 incidence from all Italian provinces, in order to reliably determine the association between PM pollution levels and the initial spread of COVID-19 in Italy. Daily PM10 concentrations were collected by the official air quality monitoring stations of the Regional Environmental Protection Agencies, publicly available on their websites. The number of daily PM10 limit value exceedances (50 µg/m3) detected in the different provinces, divided by the total number of PM10 monitoring stations for each selected province was computed.
Population data related to each Italian province were collected from the National Institute for Statistics for all the 110 Italian provinces,33 paying specific attention to the absolute number of inhabitants and their density (number of inhabitants/km2 for each province) as well as to the number of commuters (people travelling from other provinces for job reasons) and its proportion with respect to the province population. We have computed the number of COVID-19 infected people for each province and the infection rate based on the number of inhabitants from February 24th to March 13th (the date when the lockdown was decided), as reported by the official government website, updated with daily frequency.34 The number of PM exceedances were computed between February 9th and February 29th, as we had to take into account the maximum lag period of 14 days, which is the average time elapsed between the contagion and the first weeks of the Italian epidemic (February 24th to March 13th). Further covariates related to the different provinces have also been considered: the number of air quality monitoring stations available in each province, and the longitude and the latitude of the province city centre. All the provinces have been assigned to two geographical areas (Northern or Southern Italy). The data set is publicly available on our web page35 along with statistical analyses reproducible code in R language.36
To investigate how PM exceedances might relate to infection diffusion, we started performing an exploratory analysis on exceedances of PM10 considering the recursive partitioning tree approach, as implemented into the party package.37 Such implementation connects the exploratory techniques to the classical statistical test approach, presenting the advantage to exploit a motivated stopping criterion when pruning the tree (ie, the p value of a significance test on independence of any covariate and response).38 Within recursive partitioning analyses, the response variable was represented by the proportion of COVID-19 cases over province population; the log-transforms of responses of such proportions were reported in figures. Cut-offs identified by recursive partitioning tree analyses were subsequently used in binomial generalised linear models, both univariate and multivariable (ie, logistic regression). The response of the binomial generalised linear models is expressed as a two-dimensional vector39 obtained by binding the number of COVID-19 cases and the rest of the province population. In the presence of overdispersion, quasi-binomial distributions were addressed. When suitable, association in the contingency table has also been expressed in terms of ORs, and Fisher’s exact test was used to assess statistical significance. Exploratory analyses of exceedance rates of PM2.5 were held by the recursive partitioning tree approach too. Correlation between PM2.5 and PM10 exceedance rates per province have been addressed by using a linear model. Pearson’s coefficient was applied to evaluate correlation; diagnostics plots were used to assess model adequacy.
Similarly, we performed statistical inference analyses on data from Milan and Rome, in order to observe the potential association between PM levels and spread of COVID-19 in big cities located in different geographical areas with remarkable differences in exceedances of PM10, but presenting at the same time similar urbanisation, lifestyle, population, ageing index and number of commuters. The Roman municipality is far more extensive, with 1287 km2 of surface area compared with just 182 km2 of Milan. Talking about population, Rome has 2.87 million inhabitants compared with 1.35 million of Milan, but it is much less densely populated: 2232 inhabitants/km2 versus 7439 (mainly due to the huge extension of the city of Rome). However, an additional one million inhabitants live in Roman neighbourhoods with an average density between 6720 and 9231 inhabitants/km2. The underground extensions of Milan and Rome are currently about 98 km and 54 km, respectively. Looking at the numbers of annual visitors, Rome has about 29.0 million tourists per year, compared with 12.1 million people visiting Milan. The number of daily commuters (people moving to Rome due to working reasons or similar) is higher in Rome (2.04 million trips) compared with Milan (1.66 million trips).Patient and public involvement
Patient and public involvement
Patients and/or the public were not involved in the design, or conduct, or reporting, or dissemination plans of this research.
Results
The spatial distribution of ambient PM10 exceedances between Italian cities was geographically heterogeneous and it is presented in figure 1A. The highest number of exceedances were generally located in Northern Italian regions suffering from a rapid diffusion of the COVID-19 epidemic, while zones with a lower contagion were located in the central and southern regions. The maps shown in figure 1 illustrate the mean values of exceedances of PM10 on the number of PM10 stations in all Italian provinces during the period February 9th to February 29th 2020 (figure 1A), compared with the total COVID-19 infection per province observed in the period March 3rd to March 13th (figure 1B–E). Overall, there were 17 660 of the 60.4 million inhabitants in Italy infected at the time of the study. The highest incidence rates of COVID-19 were recorded in cities located in Northern Italy, and particularly in the Lombardy region, including Milan. The lowest incidence of COVID-19 was observed in Southern Italy as well as in the Lazio region (which includes Rome).

(A) Average daily exceedances of PM10 versus number of monitoring stations in different Italian provinces from February 9th to February 29th, 2020. (B–E) Spreading of COVID-19 infections (officially confirmed cases) during the period March 3rd to March 13th, 2020.
SARS-Cov-2 has been subsequently recognised as a highly contagious virus transmitted by airborne direct contact, showing super-spread event characteristics that has pushed the Italian Government to adopt extraordinary measures (namely total lockdown) to contain the outbreak.40 In figure 2A, two main discontinuity trends are evident and can be attributed to the Italian lockdown. If continuing the observation beyond the dates of the lockdown (11 March to 13 March), it was possible—by analysing the trend of new daily COVID-19 infections—to observe a first reduction in the spreading rate of the contagion around March 22nd (reflecting the school closure ordered on March 5th) and a second one around March 28th (reflecting the lockdown ordered between March 11th and March 13th).

(A) Daily new COVID-19 infections in Italy from February 24th to April 4th 2020. (B) Trend of COVID-19 spread in Italy during the first 15 days of the epidemic.
As the lag period for SARS-COV-2 infection can be estimated in maximum 14 days, our study analysed the Italian outbreak before March 11th, when the incidence growth rate was showing a typical exponential trend of the spread (figure 2B). In the univariate analysis, the daily limit value of exceedances of PM10 appear to be a significant predictor (p<0.001) of infection with a cut-off value of 1.29 (figure 3). The cut-off divides the provinces into two classes, characterised by higher (n=43) and lower (n=67) PM10 concentrations, respectively: the less polluted provinces had a median 0.03 infection cases over 1000 inhabitants (first to third quartile 0.01–0.09; range 0.00–0.56), while the most polluted provinces had a median 0.26 infection cases over 1000 inhabitants (first to third quartile 0.14–0.51, range 0.00–4.92). The box plots in figure 3 are log-transformed to enhance figure readability.

Relationship between the daily limit value of exceedances of PM10 and COVID-19 case ratios over the population in Italian provinces. (A) Scatter plot on a semilogarithmic scale relating the proportion of COVID-19 cases of the population of northern (grey squares) and southern (black bullets) Italian provinces vs the average daily limit value of exceedances of PM10. The dashed binomial (logistic) regression is characterised by an increasing slope of 0.25 (p<0.001). (B) Box plots showing that—with a 1.29 cut-off value of exceedance of PM10—the proportion of COVID-19 cases is greater (p<0.001) in the most polluted provinces (39 out of 41 located in Northern Italy) than the less polluted provinces, mainly located in Southern Italy (62 out of 66). (C) Box plots showing that even considering PM2.5 exceedance rates (despite 39% missing data due to the absence of monitoring stations for PM2.5) the proportion of COVID-19 in Po Valley might be stratified consistently (p<0.001) with PM10 data presented in figure 1B–E.
Dividing the Italian peninsula into two areas, the northern and southern parts along the Tuscan-Emilian Apennines watershed, the results of exceedances of PM10 are as follows: 39 out of 41 northern provinces fall in the higher PM10 category, while for the southern provinces the ratio is reverse: 62 out of 66 provinces present lower PM10 values (OR 0.00, Fisher’s exact test p<0.001).
Also the proportion of commuters over the population of the province (people coming to the examined city for job reasons on a daily basis) seems to have a significant role (p=0.01, not depicted) in predicting the infection rates according to the univariate binary partitioning tree analysis. We set a commuters’ cut-off at 47% describing the number of job travellers. In the 51 provinces with a lower number of commuters (<47%), the median infection cases over 1000 inhabitants of the province was 0.03 (first to third quartile 0.01–0.05; range 0.00–0.33), while in the other provinces (commuters >47%) the median infection cases over 1000 inhabitants was 0.18 (first to third quartile 0.13–0.36; range 0.00–4.92).
Notably, when performing a bivariate conditional regression exploratory analysis combining both the pollution and the proportion of commuters as possible predictors of the infection rates, we obtained exactly the same tree depicted in figure 3: the commuters’ proportion loses its effect, thus suggesting a strong association between air quality and COVID-19 infections.
The logistic regression depicted in figure 3 (on semilogarithmic scales) confirms the exploratory analysis: a binomial distributed generalised linear model, corrected for overdispersion, reveals an increasing slope of 0.25 (SE 0.04; p<0.001) of the linear predictor. PM2.5 exceedances have been also explored: the possible association between PM2.5 and PM10 exceedances observed in each province has been assessed by a linear model (intercept 1.06, slope 1.38), with satisfactory accuracy (p<0.001; mild lack of normality into residuals according to diagnostic plots, residual SE: 1.82). The PM2.5 exceedance rates appear to be very highly correlated to PM10 exceedance rates, showing a Pearson’s coefficient of 0.94 (95% CI 0.90 to 0.96). When repeating exploratory analyses on PM2.5 exceedance rates by recursive partitioning tree analysis, a cut-off of 11 was identified, and an improved recursive partitioning tree was disclosed (figure 3). Despite the limitation of 39% missing values concerning PM2.5 data (no data available for 43 provinces out of 110), it appears that, consistently with main study outcome, the highest number of PM2.5 exceedances are mainly located in Po Valley.
In order to observe the effect of PM in big cities presenting similar urbanisation, lifestyle, population and number of commuters, Milan and Rome were chosen, finding out that the first infected people were identified on February 25th both in Milan and Rome (eight and three patients, respectively). However, we considered 1 March as the first day of COVID-19 outbreak for both cities, when in Rome there were at least six confirmed cases (figure 4).
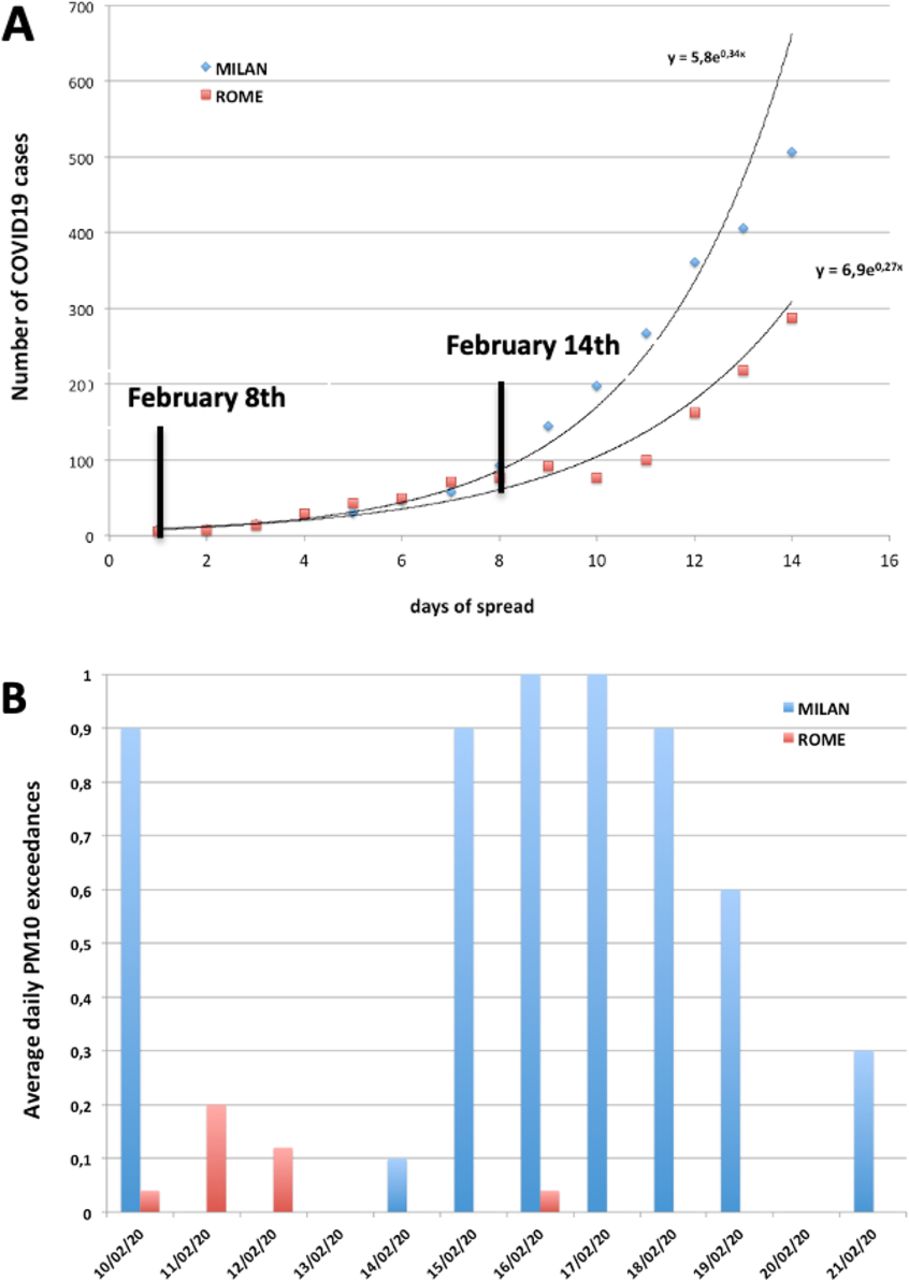
(A) Trends of COVID-19 spread in Milan and Rome during the first 14 days of the epidemic; the starting date in Milan is February 25th and could correspond to infections acquired by February 8th that became clinically evident or detectable within the subsequent 17 days (lag period between the infection and diagnosis). (B) Distribution of the average daily PM10 exceedances in Rome and Milan on February 2020.
The comparison of the COVID-19 outbreaks between Milan and Rome showed a higher exponential phase for the first city compared with the latter one. However, the trends presented a similar behaviour up to 8 days; after 9 days, the increase in COVID-19 incidence showed a sudden acceleration of the viral infectivity only in Milan. Besides the transmission of SARS-CoV-2 occurring via close contact with infected people through the direct inhalation of liquid droplets emitted by cough or exhalation and/or by contact with surfaces contaminated by the virus, the dynamics of COVID-19 diffusion observed in Milan—if compared with that observed in Rome—suggest to consider other possible routes of transmission also including the airborne route (with the virus covering longer distances). If assuming 14–17 days as the average length of the lag phase, the first day of the infection considered for Milan (February 25th) should be referred to as contagion occurred by February 8th. According to this assumption, the acceleration of COVID-19 diffusion in Milan started on February 14th (figure 4A), in correspondence to the presence of a relevant peak of PM10 exceedances (figure 4B), that was not observed in Rome, where the initial contagion likely started on February 13th in the absence of PM10 exceedances.
The growth rate of incidence of COVID-19 infections in Italy was 0.19 per day with a doubling time close to 3.6 days, the same shown by Sanche et al41 in Wuhan (Hubei Province, China), where a growth rate close to 0.21–0.30 per day with a doubling time of 2.3–3.3 was described in January 2020.41 The Italian basic reproductive number (R0), estimated by the researchers was 5.7,42 consistently with ‘super-spread event’ characteristics possibly related to transmission of airborne droplets, as described by Wallinga and Teunis for the epidemic curves of severe acute respiratory syndrome (SARS) during the outbreak that occurred in February–June 2003 in Hong Kong, Vietnam, Singapore and Canada.43 In Rome, the growth rate before the lockdown (March 13th) was 0.27 per day with a doubling time of 2.6 days, consistent with the ‘super-spread event’ model described for SARS. In Milan, the growth rate was significantly higher, close to 0.34 per day, with a doubling time of 2.0 days, thus suggesting an R0 value higher than 6.0, quite similar to the transmission of the epidemic via airborne droplets observed for measles (known to have reached a value of 12–18)44 and to the highest R0 estimates documented for China, ranging from 1.4 to 6.49 with a mean of 3.28 and a median of 2.79 (Wuhan: 2.55–2.68; Hubei Province: 6.49; China: 2.2–6.47).45
Discussion
Research Hypothesis. Based on the available literature, and following our recent publication confirming the presence of SARS-COV-2 RNA on PM10 collected in Bergamo area (the epicentre of the Italian epidemic),20 there is enough evidence to consider the airborne route—and specifically the role of PM—as a possible additional infection ‘boosting’ factor for interpreting the anomalous COVID-19 outbreaks observed in Northern Italy, known to be one of the areas characterised by the highest PM concentrations in Europe.1 Airborne transmission is certainly more effective in indoor environments, with little ventilation, but it must be considered that the Po Valley—due to its atmospheric stability—closely resembles a confined environment, and that long-distance virus transportation is favoured by high concentration of dust.
Current knowledge. Although bioaerosol is a well known factor for airborne transmission of virus, the highly diluted nature of viral bioaerosol in ambient air has been considered a major impediment to aerobiological detection of virus, including the investigation of viral interactions with other airborne particles. Recently, Groulx et al46 using an in vitro PM concentrator, suggested that the interaction between airborne viruses and airborne fine PM is able to influence viral stability and infection potential.46 The stability of aerosols and condensation reactions occurs frequently in atmosphere, as organic aerosols change properties (hygroscopicity, toxicity, optical properties) of other aerosols.47 Cruz-Sanchez et al48 demonstrated that respiratory syncytial virus exposed to black carbon, in the form of India ink, prior to co-aerosolisation in vitro, and then deposited on a cell substrate, increased viral infectivity.48 Similarly, in areas of high vehicle traffic, many different pollutants arising from a variety of sources coexist (car or truck exhausts, emissions from heating installations etc),49 which present PM emissions containing carbon, ammonium, nitrate and sulfate.
Findings and research perspectives. Our observations showed that high frequency of PM10 concentration peaks (exceeding 50 µg/m3) resulted in an accelerated spread of COVID-19, suggesting a possible ‘boost effect’ for viral infectivity. We found significant differences both in PM10 exceedances and spread of COVID-19 between Northern and Southern Italian regions, and we focused on Milan and Rome. The infection rate of disease has been higher in Milan, (1.35 million inhabitants, Northern Italy) than in Rome (2.87 million inhabitants, Southern Italy), even if there were no substantial differences in urban management and social confinement as well as in the ageing index of the two populations. Our findings suggest that the acceleration of the growth rate observed in Milan could be attributed to a ‘boost effect’ (a kind of exceptional ‘super-spread event’) on the viral infectivity of COVID-19, corresponding to the peaks of PM. According to this hypothesis, PM could then act as a potential ‘carrier’ for droplet nuclei, triggering a boost effect on the spread of the virus (figure 5). It could be possible to look at the airborne route of transmission, and specifically to PM, as a ‘highway’ for viral diffusion, in which the droplet nuclei emitted by the exhalations are stabilised in the air through the coalescence of aerosol with the PM at high concentrations in stability conditions. In fact, a small droplet of virus, under normal conditions of clean air and atmospheric turbulence, evaporates and/or disperses quickly in atmosphere. On the contrary, in conditions of atmospheric stability and high concentrations of PM, there is a high probability of viruses creating clusters with the particles and, by reducing their diffusion coefficient, enhancing their permanence time and amount in atmosphere and promoting contagion. These first observations suggest that PM could be regarded as a contributing factor to the severity of COVID-19 infection in terms of airborne diffusion and health outcomes, in accordance with the findings published by Isaifan.50

Scheme of possible enhancement of viral transmission through stabilised human exhalation on particulate matter (PM).
The potential role of climatic variables. Nevertheless, coalescence phenomena require optimal conditions of temperature and humidity to stabilise the aerosols in the air, namely around 0°C–5°C and 90%–100% relative humidity. Recently, Ficetola et al51 showed that the spread of COVID-19 peaked in temperate regions of the Northern Hemisphere with mean temperature of 5°C and humidity of 0.6–1.0 kPa, while it decreased in warmer and colder regions.51 These climatic variables could have played a role, along with the presence of high concentrations of PM in the air, in favouring the stabilisation of the aerosol in air, in line with the model proposed in figure 5.
Limitations and Practical Implications. This was an observational study and therefore further experiments are needed to confirm the possibility that PM may act as a ‘carrier’ for the viral droplet nuclei, impressing a boost effect for the spreading of the viral infection, as it has been shown for other viruses. Virological studies could be performed, specifically aimed at testing the vitality and infectious potential of SARS-COV-2-contaminated particulate matter, if any. Recent studies52 and recommendations53 about increased social distancing indicate that a recommended interpersonal distance of more than 1 m and use of face masks54 are useful prevention measures. It must also be pointed out that long-term exposures to high levels of PM chronically impair human health and possibly influence the clinical course of infections acquired by already debilitated individuals, especially in the most vulnerable age groups. Indeed, according to 2005 WHO guidelines, annual average concentrations of PM10 should not exceed 20 µg/m3 (compared with current EU legal limits of 40 µg/m3) and PM2.5 should not exceed 10 µg/m3 (compared with current EU legal limits of 25 µg/m3). Moreover, the exposure-effect relationship between fine PM and health damages is not of linear type, so that it is not really possible to set a threshold below which is foreseeable a complete absence of damage to human health.55
Conclusion
The available literature on the role of airborne transmission—as well as these first preliminary observations concerning the association between the number of COVID-19 infected people and PM10 peaks—points to the opportunity of performing further computational and experimental research on the airborne route of transmission, and the potential role of PM on viral spread and infectivity. There is the rational for carrying out experimental studies specifically aimed at confirming or excluding the presence of SARS-CoV-2 and its potential virulence on PM. Moreover, the possibility of looking at PM levels as an ‘indicator’ of the expected impact of COVID-19 in most polluted areas should be considered. Urgent actions must be adopted to counteract climate changes and the alteration of ecosystems that might trigger new and unexpected threats to human health that we are so dramatically experiencing worldwide.
Acknowledgments
The authors thank all the members of the RESCOP Group (Research group on COVID-19 and Particulate Matter), promoted by the Italian/International Society of Environmental Medicine (SIMA/ISEM) with the aim of using the presence of SARS-COV-2 on PM10 as an early indicator of epidemic recurrence. SIMA is grateful to Falck Renewables and to the UNESCO Chair for Health Education and Sustainable Development for their support.
References
Footnotes
Contributors LS, FP, GDG, PB, MGP, AP, MB, SL, JP, ADG, ER, AC, PP, AM equally contributed to conceive, design, write, manage and revise the manuscript.
Funding The authors have not declared a specific grant for this research from any funding agency in the public, commercial or not-for-profit sectors.
Map disclaimer The depiction of boundaries on the map(s) in this article does not imply the expression of any opinion whatsoever on the part of BMJ (or any member of its group) concerning the legal status of any country, territory, jurisdiction or area or of its authorities. The map(s) are provided without any warranty of any kind, either express or implied.
Competing interests None declared.
Patient consent for publication Not required.
Provenance and peer review Not commissioned; externally peer reviewed.
Data availability statement Data are available in a public, open access repository. All data are published at http://www.biostatisticaumg.it/bmj and available upon request to the corresponding author email leonardo.setti@unibo.it.