
A Comparative Evaluation between Convolutional Neural Networks and Vision Transformers for COVID-19 Detection

1
Department of Computer Engineering, College of Computer and Information Sciences, King Saud University, Riyadh 11543, Saudi Arabia
2
Department of Software Engineering, College of Computer and Information Sciences, King Saud University, Riyadh 11543, Saudi Arabia
*
Author to whom correspondence should be addressed.
Mathematics 2023, 11(6), 1489; https://doi.org/10.3390/math11061489
Submission received: 7 February 2023
/
Revised: 13 March 2023
/
Accepted: 16 March 2023
/
Published: 18 March 2023
(This article belongs to the Special Issue Modelling, Analysis and Control of COVID-19 Spread Dynamics)
Abstract
:Early illness detection enables medical professionals to deliver the best care and increases the likelihood of a full recovery. In this work, we show that computer-aided design (CAD) systems are capable of using chest X-ray (CXR) medical imaging modalities for the identification of respiratory system disorders. At present, the COVID-19 pandemic is the most well-known illness. We propose a system based on explainable artificial intelligence to detect COVID-19 from CXR images by using several cutting-edge convolutional neural network (CNN) models, as well as the Vision of Transformer (ViT) models. The proposed system also visualizes the infected areas of the CXR images. This gives doctors and other medical professionals a second option for supporting their decision. The proposed system uses some preprocessing of the images, which includes the segmentation of the region of interest using a UNet model and rotation augmentation. CNN employs pixel arrays, while ViT divides the image into visual tokens; therefore, one of the objectives is to compare their performance in COVID-19 detection. In the experiments, a publicly available dataset (COVID-QU-Ex) is used. The experimental results show that the performances of the CNN-based models and the ViT-based models are comparable. The best accuracy was 99.82%, obtained by the EfficientNetB7 (CNN-based) model, followed by the SegFormer (ViT-based). In addition, the segmentation and augmentation enhanced the performance.
Keywords:
COVID-19; chest X-ray; convolutional neural network; vision transformer; artificial intelligenceMSC:
68T07; 68T45; 00-02; 94-081. Introduction
Many illnesses are regarded as being fatal. The disease and its impact on human life determine the risk factors [1]. Some of these illnesses are brought on by various bacterial, viral, fungal, and parasitic species. One of the key systems in the human body is the respiratory system. There are various reasons why the respiratory system is significant. Clinical judgment and empirical treatment or waiting for the findings of diagnostics performed in specialist laboratories were formerly the only options available to clinicians when diagnosing a patient with common symptoms with a variety of potential diseases, such as respiratory infections. While the pandemic poses a significant risk to economics and public health around the world, an infectious disease also poses a hazard. In 2018, the World Health Organization (WHO) listed antimicrobial resistance (AMR) as one of the top ten risks to public health [2].
The new, extremely fatal disease known as COVID-19 was born in December 2019 in Wuhan Province, China, and it quickly spread throughout the world [3]. The biological structure of COVID-19 is a single-stranded RNA-type with a positive orientation. The COVID-19 outbreak has been of significant concern to the medical community because there is now no effective treatment for the condition, making it difficult to treat [4]. COVID-19 is an acronym denoting Coronavirus Disease 2019. The severe acute respiratory syndrome coronavirus 2 (SARS-CoV-2) is the infectious agent that causes it [5]. Rapid quarantine and medical treatment are essential for patient prognosis, epidemic control, and public health security [6]. The accurate and prompt diagnosis of suspected COVID-19 patients at an early stage is also essential. The most common COVID-19 symptoms are coughing, fever, and shortness of breath; other symptoms include vomiting, diarrhea, sore muscles, a painful throat, the formation of sputum, stomach pain, and a loss of taste and smell [7]. Additionally, the WHO indicated that the top six countries for confirmed cases and deaths until today are the United States, China, India, France, Germany, and Brazil (ranked based on confirmed cases until 21 February 2023). The United States has 1,103,936 deaths out of 101,496,168 cases; China has 697,894 deaths out of 98,873,697 cases; India has 530,757 deaths out of 44,684,658 cases; France has 161,009 deaths out of 38,475,606 cases; Germany has 167,214 deaths out of 37,986,750 cases, while Brazil has 697,899 deaths out of 36,960,888 cases.
A significant and crucial step in eradicating COVID-19 is the effective screening of infected persons so that positive people may be discovered and treated. The most frequently used technique for COVID-19 detection is the reverse transcription-polymerase chain reaction (RT-PCR) [8]. A chest X-ray (CXR) is performed after a sample of nasopharyngeal exudate is obtained for testing the RT-PCR during the main examination. According to the researchers in [9], infected people with pneumonia may exhibit a pattern on CXR and computed tomography (CT) scans, which is merely distinguishable to the human eye. X-ray imaging and CT scans have played crucial roles in the early detection and quick diagnosis of this disease. As a RT-PCR requires a lot of time and has a low sensitivity, of 60–70%, it is possible to detect the detrimental effects of COVID-19 by examining images of the patient’s lungs and guarantee early treatment. X-ray imaging can be used to diagnose COVID-19 and is a relatively affordable way to find lung infections. CXR images of COVID-19 patients usually show patchy infiltrates or opacities, which are akin to other viral pneumonia symptoms. CXR images taken early on in COVID-19 do not reveal any anomalies [10]. On CT scans, almost all COVID-19 patients displayed similar features, including early ground-glass opacities and later lung consolidation [11].
Many studies describing the techniques for finding COVID-19 in chest radiography images have been published by numerous researchers. On a small dataset, these strategies yielded interesting results, but they are not at all adequate for production [12]. Researchers are using deep learning algorithms to identify certain characteristics in chest radiography images of COVID-19 patients. Recent research shows that deep learning is quite successful in a range of visual applications, including medical image processing. Cough, fever, and shortness of breath are among the moderate to severe symptoms that most COVID-19 patients suffer. The new coronavirus may cause severe pneumonia in both lungs in certain patients; however, pneumonia caused by COVID-19 has the potential to be lethal [1]. Surprisingly, effusions, tuberculosis (TB), and pneumonia all had lower average certainty ratings. This shows that there are several levels of diagnostic confidence—doubt with the right diagnosis, and overconfidence with a false diagnosis [13].
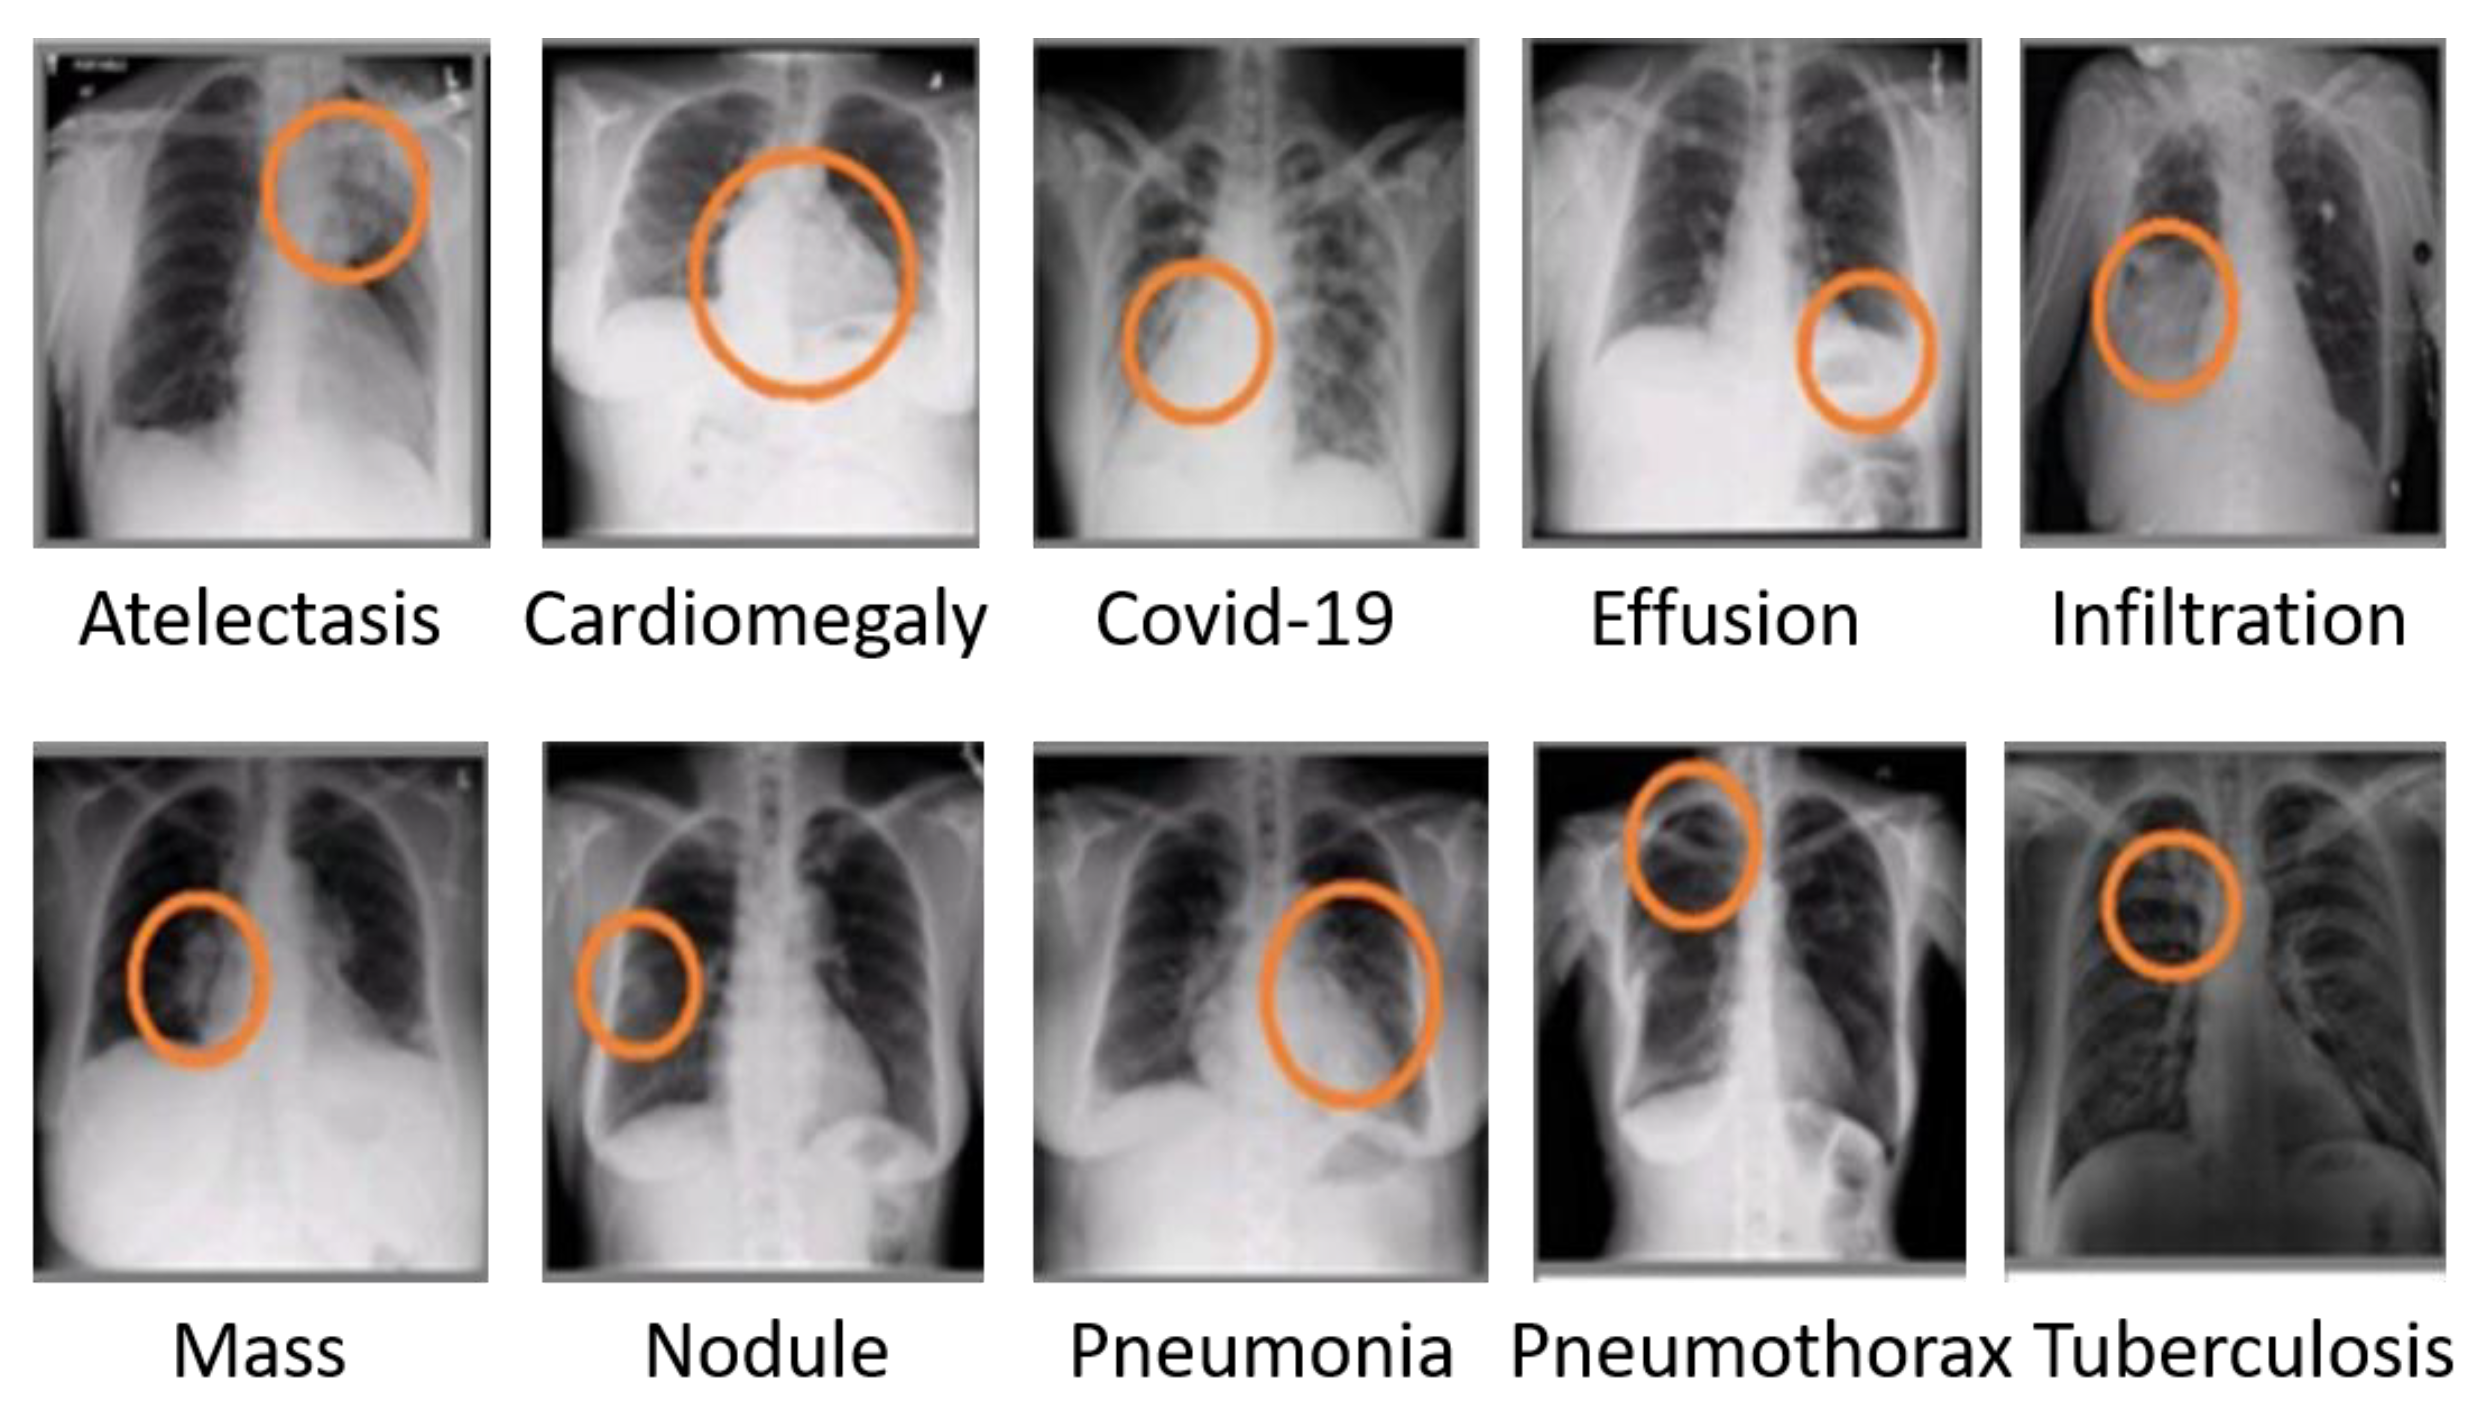
A CXR image assists medical professionals in the diagnosis of several respiratory disorders. Doctors may identify a variety of illnesses, including pneumonia and COVID-19, by analyzing CXR images. Figure 1 depicts a variety of respiratory illnesses that medical professionals may identify [13]. Science advances continuously, and the medical area of CXR patient assessment is no exception. However, mistakes might occur while conducting CXR screening [14]. Some medical facilities in nations with few resources and dense populations lack the essential or modern equipment to conduct CXR screening [15]. The sooner COVID-19 is identified, the more successful the therapy will be, in turn decreasing the risk of infection, as well as the spread of illness. COVID-19 and viral pneumonitis are fatal respiratory diseases. They are dangerous because they may spread quickly among humans [11,16]. To diagnose any condition, clinicians often examine and focus on a particular region of the CXR of a patient. A computer with image processing capabilities may segment, analyze, and filter CXR images to enhance the diagnostic performance by enabling a neural network to forecast illness. Doctors can more quickly and accurately diagnose pneumonia from a chest X-ray thanks to computer-aided diagnosis (CAD). The application of artificial intelligence methods in healthcare is growing as a result of their potential to handle very large datasets [17].
Numerous viruses, bacteria, and their combinations may cause disease, but few rapid and easily available laboratory assays exist for the majority of pathogens, which may help to explain why antibiotic treatment is mostly empirical and etiology is seldom proven in clinical practice [18]. The ability of standard radiographic and laboratory examinations to differentiate between viral and bacterial pneumonia is therefore unknown. The majority of infants with alveolar pneumonia, especially those who have lobar infiltrates, display laboratory evidence of a bacterial infection, according to the authors in [18]. Interstitial infiltrates may be seen in pneumonia caused by bacteria or viruses. In [19], the authors assert that, whereas viral pneumonia affects both lungs, bacterial pneumonia only affects one side of the lung. For example, bacterial pneumonia may display focal lobar consolidation in one lung, and viral pneumonia may create diffuse interstitial patterns in two lungs. Depending on the kind of bacteria involved, antibiotics are often used to treat bacterial pneumonia, while antiviral medications may be used to treat viral pneumonia when it comes to influenza. Viral pneumonia has no definitive therapy, but is typically managed by drinking a lot of fluids.
At present, due to the potency and utility of the Machine Learning (ML) approaches, they are now being used in a wide range of medical sectors, including the categorization of diverse illnesses, as well as the detection of corneal patterns [20]. Deep learning (DL) is a kind of artificial neural network (ANN) that is inspired by human cognition. Due to their remarkable capacity to learn underlying patterns and features from picture databases and then make predictions on fresh and unseen data, deep learning algorithms have recently attracted a lot of study attention.
As a result, we focus on an artificial intelligence (AI) approach that employs a deep learning model to identify CXR images of active COVID-19, automatically and accurately, against inactive COVID-19 CXR images. An explainable artificial intelligence (XAI)-based system can provide visualization cues to doctors to assist in making the correct decisions. These strategies have shown promise in terms of minimizing medical mistakes, as well as the early discovery or monitoring of asymptomatic carriers, and techniques to improve disease treatment and patient care [13,14,21].
Transformer models have been particularly effective in the field of natural language processing (NLP) in recent years [22]. The transformer architecture, which is entirely built on attention mechanisms, can naturally simulate token long-term reliance and learn contextual information. Convolutional neural networks (CNNs), on the other hand, lack this capacity as convolutions are inherently local processes [23,24].
Recently, a vision transformer model called ViT [25] was suggested that is exclusively built on a stack of transformer blocks and has equaled or exceeded state-of-the-art CNNs when pre-trained on extremely large-scale ImageNet-21K [26] type datasets. Following that, several transformer models, for example, [24,27], were presented to enhance the transformer design, with remarkable performance advantages when trained on ImageNet with 1K classes [28].
The main research problem focused on in this paper is the lack of a sophisticated system with XAI to detect COVID-19. An accurate XAI-based COVID-19 detection system will not only help screen the patients automatically, but also assist the doctors in making their decision.
The goal of the proposed study is to create an automated COVID-19 identification system from CXR images utilizing image processing methods and deep learning models to enhance the performance across many kinds of objective and subjective measures. First, CXR images are segmented in terms of regions of interest. Then, we make a comparative study between several state-of-the-art CNN models and transformer models for the application of an automatic COVID-19 system using CXR images. By scanning the CXR, the suggested system would automatically forecast whether COVID-19 is active or inactive. The performance of the system is evaluated on multiple public datasets with three cases: COVID-19, viral pneumonia, and normal health cases. In both the original and segmented CXR images, we additionally apply augmentation in the form of a rotation at nine distinct angles. The proposed system also includes a visualization tool for prediction outputs to help medical professionals diagnose COVID-19 and viral pneumonia. The proposed system may identify COVID-19 infections more quickly by identifying the signs of infected people as hazy or black spots in X-ray images of the lungs.
The major research contributions of this paper can be summarized as follows:
- -
- An automated COVID-19 detection system using state-of-the-art CNN models and transformer models is proposed.
- -
- The performances using the CNN models and the transformer models are compared in the COVID-19 detection system with lung CXR images.
- -
- Visualization in CXR images is provided to boost the doctor’s decision. Normally, doctors do not rely on the output accuracy of a system; rather, they mainly focus on the radiographic images themselves. Therefore, if the system can produce a colorful visual representation of an image to indicate which area to focus on or to give more attention to, it will be a great help to the doctors. The proposed system outputs this colorful image.
- -
- The study compares the performances between balanced and unbalanced cases of the proposed system.
The remaining sections of the paper are as follows: The original UNet model for lung segmentation, exclusive pretrained CNN models, and transformer models for image classification are summarized in Section 2. The proposed study’s methodology, suggested system, dataset utilized in the tests, and augmentation phases are all described in Section 3. The experiment results for the unsegmented CXR images, segmented CXR images, and each kind of image with and without augmentation are provided in Section 4. A performance comparison between the proposed system and more recent systems is also provided in this section. Section 5 concludes the study and offers ideas for the next research.
2. Related Work
AI describes computer programs and systems that imitate human intelligence-assisted functions, including reasoning, deep learning, adaptability, engagement, and sensory perception. Since the 1950s, when doctors have tried to improve their diagnosis using computer-aided algorithms, AI has been applied in healthcare. Due to the greatly enhanced processing power of modern computers and the vast quantity of digital data available for collection and use, the interest and advancement in medical AI applications have intensified recently [29].
As stated by Arthur Samuel (in 1959), a pioneer in the field of machine learning (ML), ML is differentiated by the fact that it is data-driven, providing machines (computers) “the capacity to learn without being explicitly instructed” [30]. Massive volumes of data may be used by machine learning algorithms. They do it as part of their search for crucial linkages to decision-making.
To develop the computer system into an expert that can be used for prediction and decision-making, DL methods can perform well. A kind of machine learning known as “deep learning” enables computers to learn from a fact and to understand the world in terms of idea hierarchy. While DL is being researched, it may be utilized as a backup plan to assist physicians in making judgments.
2.1. State-of-the-Art DL in Medical Imaging
A CNN is a well-known deep-learning architecture that is often used for image analysis and classification. It directly extracts and learns characteristics from images. Different CNN models are available, each with unique features and benefits. Pure transformer models reliably build final classifiers using only the classification tokens, never explicitly incorporating high-level word tokens, despite significant development. Although the classification token interacts with all of the word tokens through the attention mechanisms of the network backbone [23], we believe that high-level word tokens contain rich information that the classification token cannot handle.
2.1.1. CNN-Based Transfer Learning
Different models were proposed in [9,12,31] with the same objective: the detection of the COVID-19 virus. The objective is the same, but the behavior is different. A model was created by the authors in [9] to initialize the VGGNet model and prepare it ready for fine-tuning. They developed a new fully connected layer head with the following layers: AveragePooling2D, Flatten, Dense, Dropout, and a final Dense with the “softmax” activation to categorize the classes. It is layered over VGG16. The VGG16 convolutional weights are then frozen, allowing for the training of only the fully connected layer head. The VGG16-based model is computationally expensive.
A model termed CoroNet with three instances for the desired purpose was proposed in [12]. With a CNN, the authors classified the image into four categories in the first model. The primary multi-class model is modified in the other two models by the binary 2-class CoroNet model (Normal and abnormal) and the 3-class CoroNet model (COVID-19, Normal and Pneumonia). The authors in [13] proposed a system to detect Tuberculosis from CXR images. They did not compare the balanced and unbalanced cases because the number of image samples was limited.
Based on [11], different types of image modalities can be used to detect COVID-19. These modalities include CXR images, CT scans, and ultrasound images. With the aid of various AI-based approaches, numerous efforts have been conducted to detect COVID-19 using CXR images [32]. The described research was unable to generalize the findings and could not guarantee that the findings would be replicated when these models were tested on a bigger dataset because they used a dataset with a very small number of COVID-19 CXR images. Therefore, it will be very helpful to examine alternative CXR image-enhancing methods on a large dataset of normal (healthy class), non-COVID (other lung illnesses), and COVID-19-affected individuals. The quality of the X-ray images acquired for COVID-19 patients, which are acquired in vast numbers each day in hospitals, can vary for several reasons, including patient condition, breathing pattern, and human error. The most popular techniques for chest X-ray images are posterior-anterior (PA) and anterior-posterior (AP) front-view X-rays.
2.1.2. Transformer-Based Vision Backbones
Transformer models are helpful in both computer vision and natural language processing (NLP). Despite significant progress, the majority of studies favor classification above architectural improvement [27]. Image classification challenges have been dominated by CNN-based algorithms. Transformer-based techniques, nevertheless, have just begun to acquire acceptance and use [24]. The DenseNet, InceptionV3 WideResNet101, and Vision Transformer models were employed by the authors of [24] in the transfer learning procedure, where the model is pre-trained on the ImageNet dataset. The comparison was based on natural images, not on COVID-19-related images. As it only extracts broad aspects, the lowest layer of the architecture is frozen. They changed the model’s top layer such that the linear layer now outputs dataset-specific results.
The Mix Transformer encoders (MiT) from MiT-B0 to MiT-B5, all with the same design, but different sizes, were developed by the authors in [33]. The smallest model, MiT-B0, is designed for speedy inference, while the biggest model, MiT-B5, is designed for maximum performance. While ViT served as some of the design inspiration for MiT, it was modified and optimized for semantic segmentation. This module aims to produce CNN-like multi-level features from an input picture, in contrast to ViT, which can only build a single-resolution feature map. These qualities provide both low-resolution fine-grained features and high-resolution coarse features, which often enhance the semantic segmentation performance. ViT uses positional encoding (PE) to transmit location information. PE has a fixed resolution. To avoid losing accuracy, the positional information must be interpolated when the test resolution and training resolution are different. PE, according to the authors, is not necessary for semantic segmentation. Instead, they intentionally used a 3 × 3 Conv in the feed-forward network to offer Mix-FFN, which considers the impact of zero padding on location information leaking (FFN). The model is named the SegFormer. Although this model is promising, it has not yet been used to detect COVID-19.
An RGB input picture is first divided into discrete, non-overlapping patches via a patch-splitting module, such as in ViT. Each patch is seen as a “token,” with its feature set being composed of the RGB values of the raw pixels. These patch tokens receive a lot of Swin Transformer blocks, which have altered self-attention computation [34]. By patch-combining the layers to form a hierarchical representation, the number of tokens decreases as the network depth grows. Each pair of neighboring patches’ characteristics are combined in the first patch merging layer. A window-shifted module is used to create the Swin Transformer by swapping out the traditional multi-head self-attention (MSA) module in a Transformer block, while leaving the other layers alone. The shifted window partitioning technique builds linkages between the adjacent non-overlapping windows in the previous layer, which is why it is effective in image classification, object identification, and semantic segmentation [34]. Although Swin Transformer is a good model for image classification tasks, it has not been utilized for COVID-19 detection.
Two simple but effective spatial designs for vision transformers are provided by the authors in [35]. The first tactic only uses global attention and is based on Polymorphic Ventricular Tachycardia (PVT) and Catecholaminergic PVT (CPVT); Twins-PCPVT is the name given to the architecture as a consequence. The second is based on the combination of local and global attention and is known as Twins-SVT. Vision transformers suffer heavily from the high processing cost of dense prediction workloads because of the high-resolution inputs. The proposed designs overcome this limitation.
3. Methodology
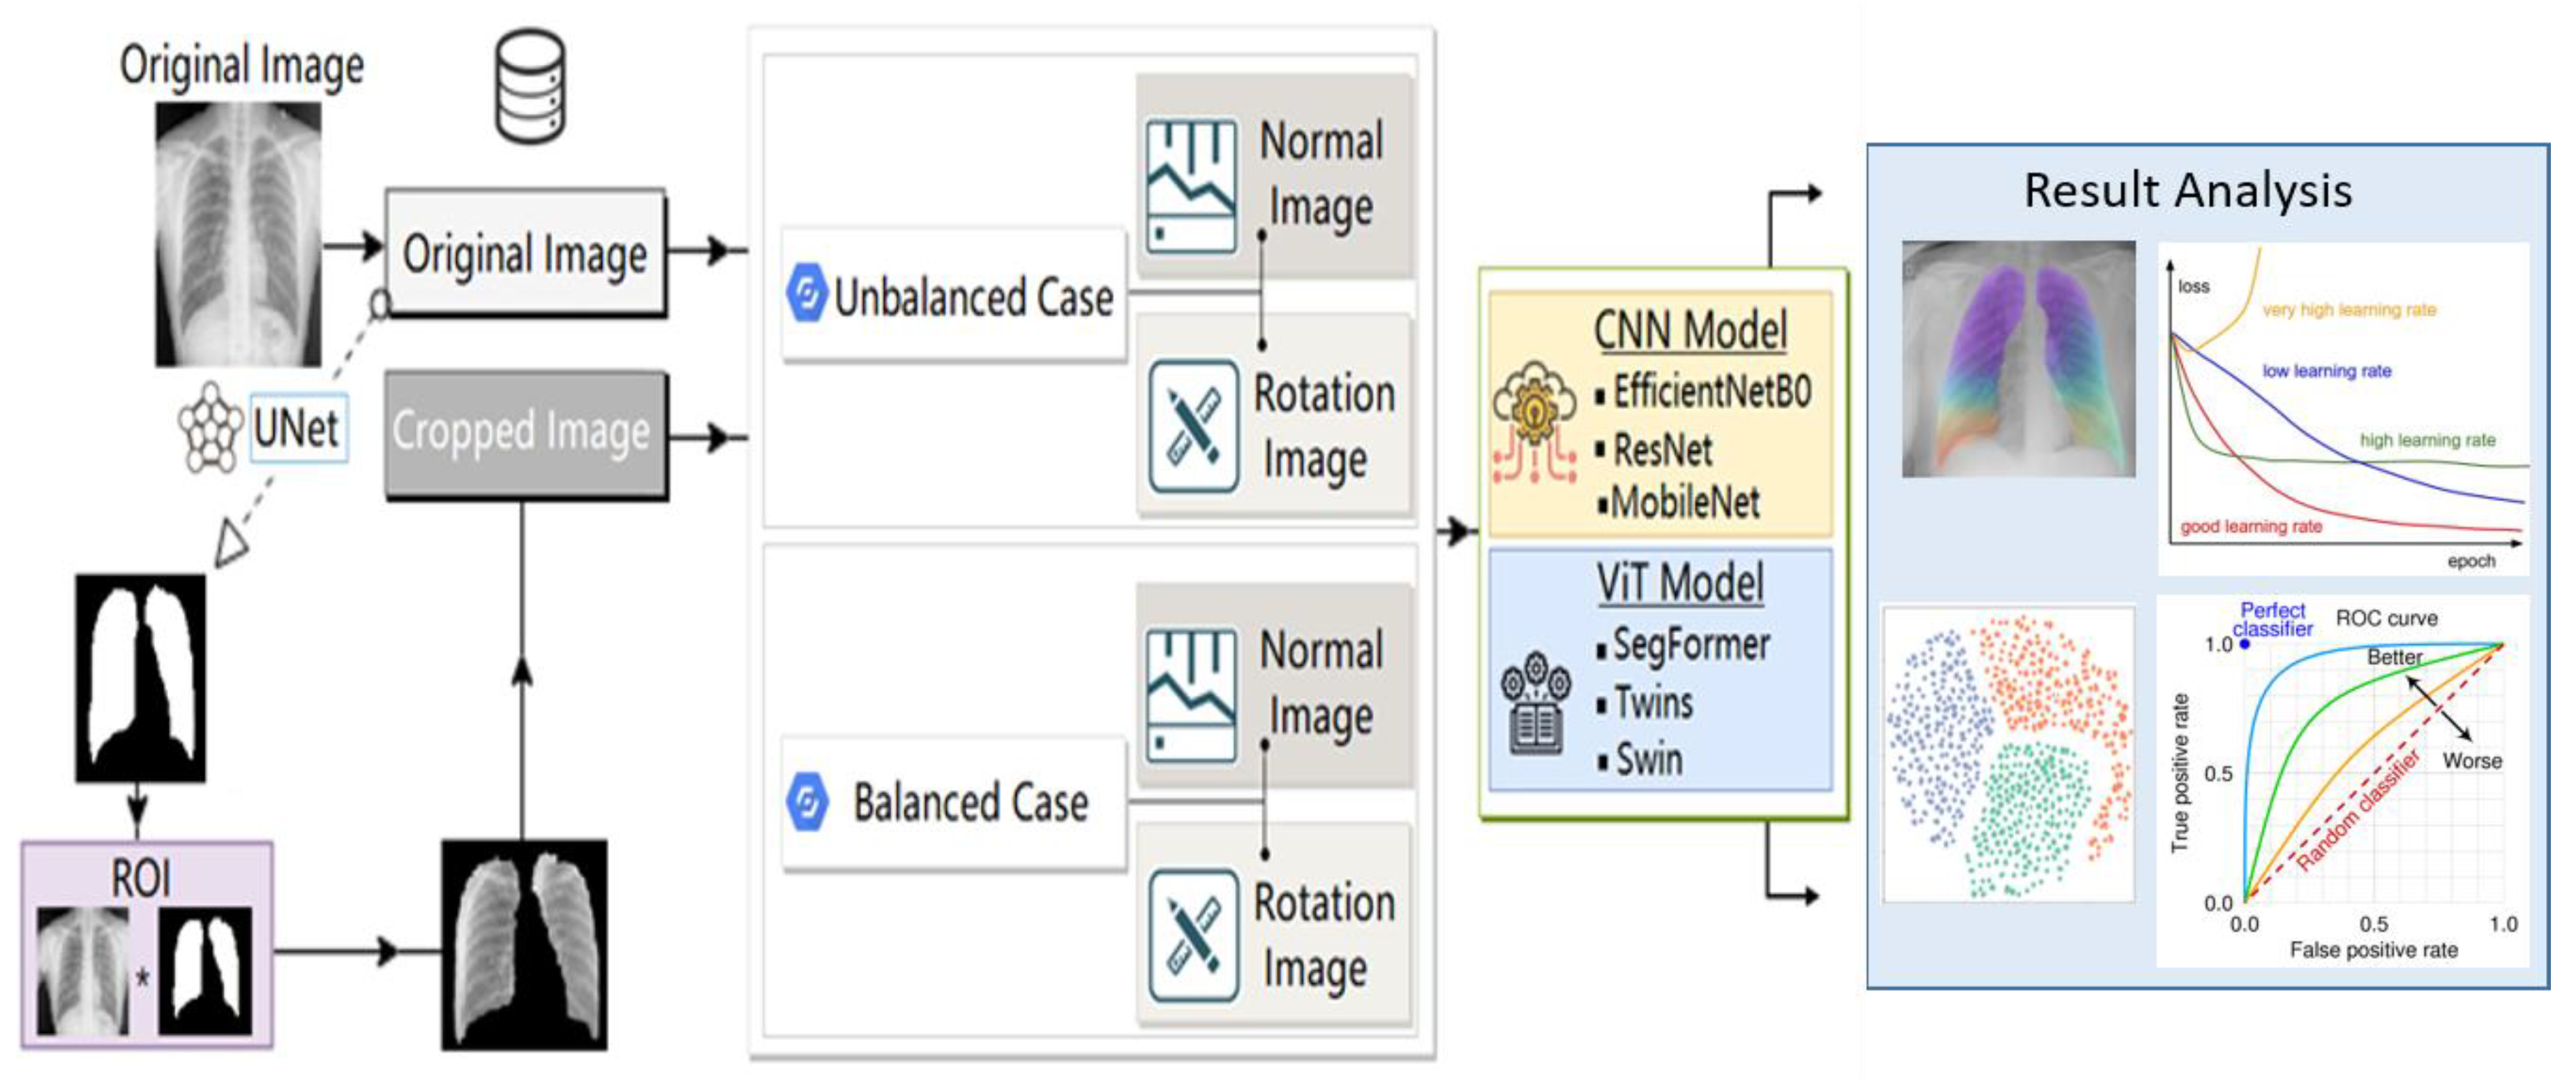
We research and evaluate several DL techniques for the accurate COVID-19 and Pneumonia radiographic diagnosis of a patient’s respiratory condition. In this paper, we propose an automated COVID-19 and pneumonitis identification system for CXR images. To obtain a binary image with a white spot in the lungs of the original image, we use a state-of-the-art UNet to extract the region of interest (ROI). The result is a cropped image that only shows the lungs. Subsequently, in order to improve the overall performance of the system, we apply the image pre-processing approach as an augmentation rotation at various angles. For image classification, the system combines the segmented lung CXR images with the existing pre-trained CNN models and ViT models. The dataset with three classes is used to assess the system. The system consists of several components, each of which will be discussed, in turn, below. The outcomes will be divided into two types. While some of the outcomes will help us demonstrate the efficacy and accuracy of the proposed system, the other type of outcomes will assist physicians in making judgments. A block diagram of the proposed detection system is shown in Figure 2.
3.1. Dataset
We used a large CXR dataset (COVID-QU-Ex) consisting of, at the time of the experiments: 21,165 CXR images with 10192 normal (healthy), 7357 non-COVID lung infections (viral pneumonia), and 3616 COVID-19 images and their corresponding ground truth lung masks. This dataset is released in stages [36]. This is the largest public COVID-positive database and lung masks. The images are converted into a portable graphics format (PNG). The bit depth of the images is 8-bit gray-scale, the resolution is 256 × 256, and the images are of the frontal view. This dataset is available to download, and the link is provided in the data availability statement towards the end of the paper.
In the experiment, we studied two cases. In the first case, we had all of the samples mentioned in the above paragraph. This is called the unbalanced case. However, in the second case, we took an equivalent number of samples for each class. The second case is called the balanced case. Table 1 shows the number of samples in both cases. The system’s resilience will be shown through trials employing the imbalanced dataset, regardless of the images acquired at a certain setting.
3.2. Data Augmentation
It takes a lot of data to increase the learning performance of DL models as the performance of DL relies on the quantity of accessible data. Data augmentation is a method for artificially generating new training data from the current training data. We must make it clear that monochromatic data is the kind used in medical images. We will thus have a more effective/accurate outcome if we add more CXR images to the model to train. There are many strategies for data augmentation, such as zooming, filtering, histogram equalization, flipping, rotating, adding noise, and scaling [11,31,37,38]; the authors in these papers found that data augmentation increased the performance of the systems using CXR images.
In this paper, we use only rotation augmentation with angles 0°, 45°, 90°, 135°, 180°, 225°, 270°, 315°, and 360°. We do not use other types of augmentation because they may disturb the semantic meaning of the CXR images.
3.3. UNet-Based Segmentation
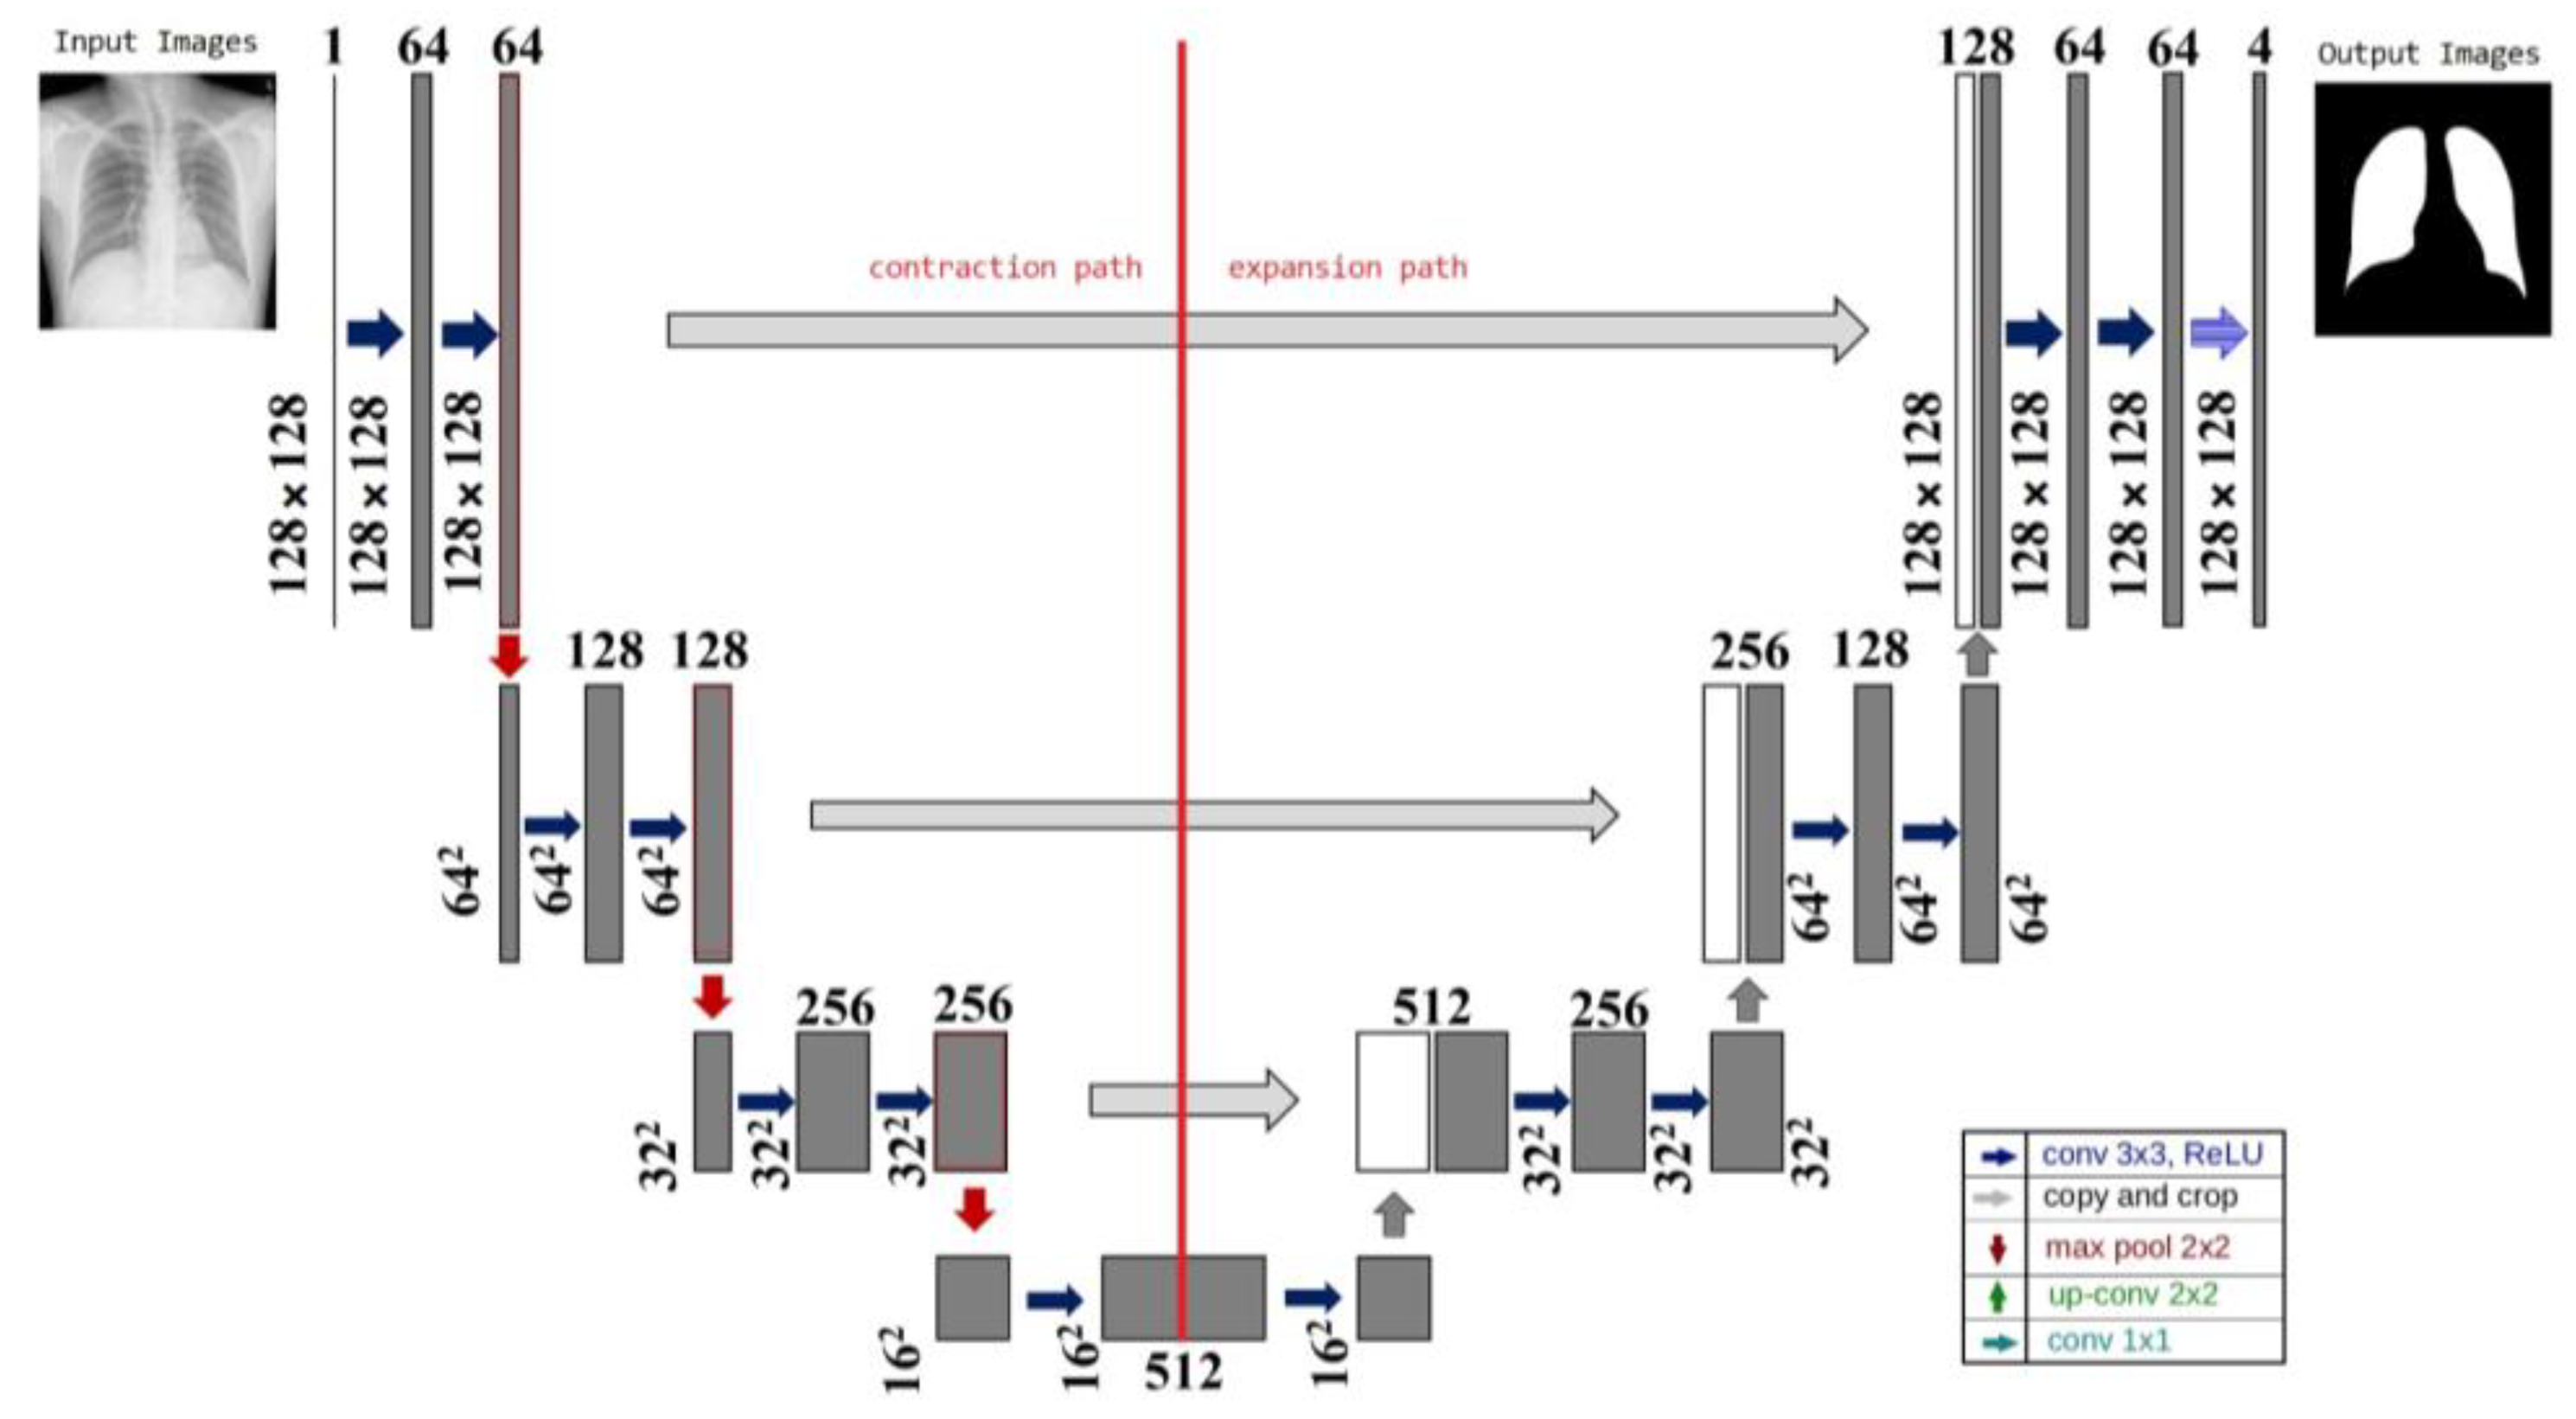
The network topology of the method, which resembles the letter U, is where the name came from. Segmenting medical images is the primary goal of UNet [39]. The step-by-step output of the U-net technique is shown in Figure 3. The network has 23 layers in total, which is far fewer than the existing networks, yet guarantees accuracy. Up-sampling and down-sampling are the two divisions of the UNet network. Given that it mainly uses the convolutional and pooling layers to extract features from the input image, down-sampling is sometimes referred to as the feature extraction stage. The feature map is up-sampled using a deconvolution method. The arrangement of down- and up-sampling is frequently referred to as a decoder-encoder structure. In the down-sampling stage, convolutional and pooling layers are applied to the input image to produce feature maps at different levels. These feature maps include variously abstracted image features. The down-sampled feature map is combined with the up-sampled feature map to restore the less abstract detail information lost during the training phase and to boost the segmentation accuracy of the network. The deconvolution layer is used in the up-sampling section to gradually recover the size of the feature map.
In the system proposed in this paper, we use UNet to extract the ROI of the CXR image. This helps the system concentrate only on the focused area and reduce the amount of unnecessary information in the image.
3.4. Visualization
Recently, the deep learning community has been more interested in the t-Distributed Stochastic Neighbour Embedding (t-SNE) method for visualizing model activations and unique properties of datasets. The goal of t-SNE is to preserve the local structure of the data by matching pairwise similarity distributions in both the lower-dimensional projection space and the higher-dimensional original data space [40]. However, the current t-SNE implementations are ineffective for showing huge datasets. Running t-SNE on larger datasets is infeasible as all of the currently available publicly accessible implementations, which all run on the CPU, require a lengthy time to process even small datasets [41].
Gradient-weighted Class Activation Mapping (Grad-CAM), which was created to draw attention to important areas of an input image for CNN prediction utilizing deep feature maps, may preserve both the semantic and spatial information [42]. Grad-CAM is defined as a linear combination of feature maps in which each feature map’s weight is equal to the average of its gradients. Deep learning applications are commonly hampered by the lack of a sufficient amount of annotation data; hence, much of this research focuses on the specific illnesses for which benchmark data is available. Obtaining solid annotation data is becoming more difficult as medical imaging analysis demands expertise in data annotation [41]. Several methods employ simply image-level category data for training to overcome the need for thorough supervision (weak annotation data). One such method is localization using class activation mapping (CAM) [42]. From the standpoint of the physicians, the outcome is extremely helpful in explaining their choice.
3.5. CNN Processing
Before training and analyzing the DL models, image normalization should be carried out. As a first stage in DL, shrinking the input images will cause the dimension of the input images to be reduced. The image sizes for CNN models used in classification applications are predetermined. Thus, the models adapt to the varied sizes of the convolutional layers by first using the input image size. In the proposed system, we investigate three pretrained CNN models: ResNet-50 [43], MobileNet [44], and EfficientNetB7 [45]. The sizes of each CNN model used in our experiment are shown in Table 2.
3.6. ViT Processing
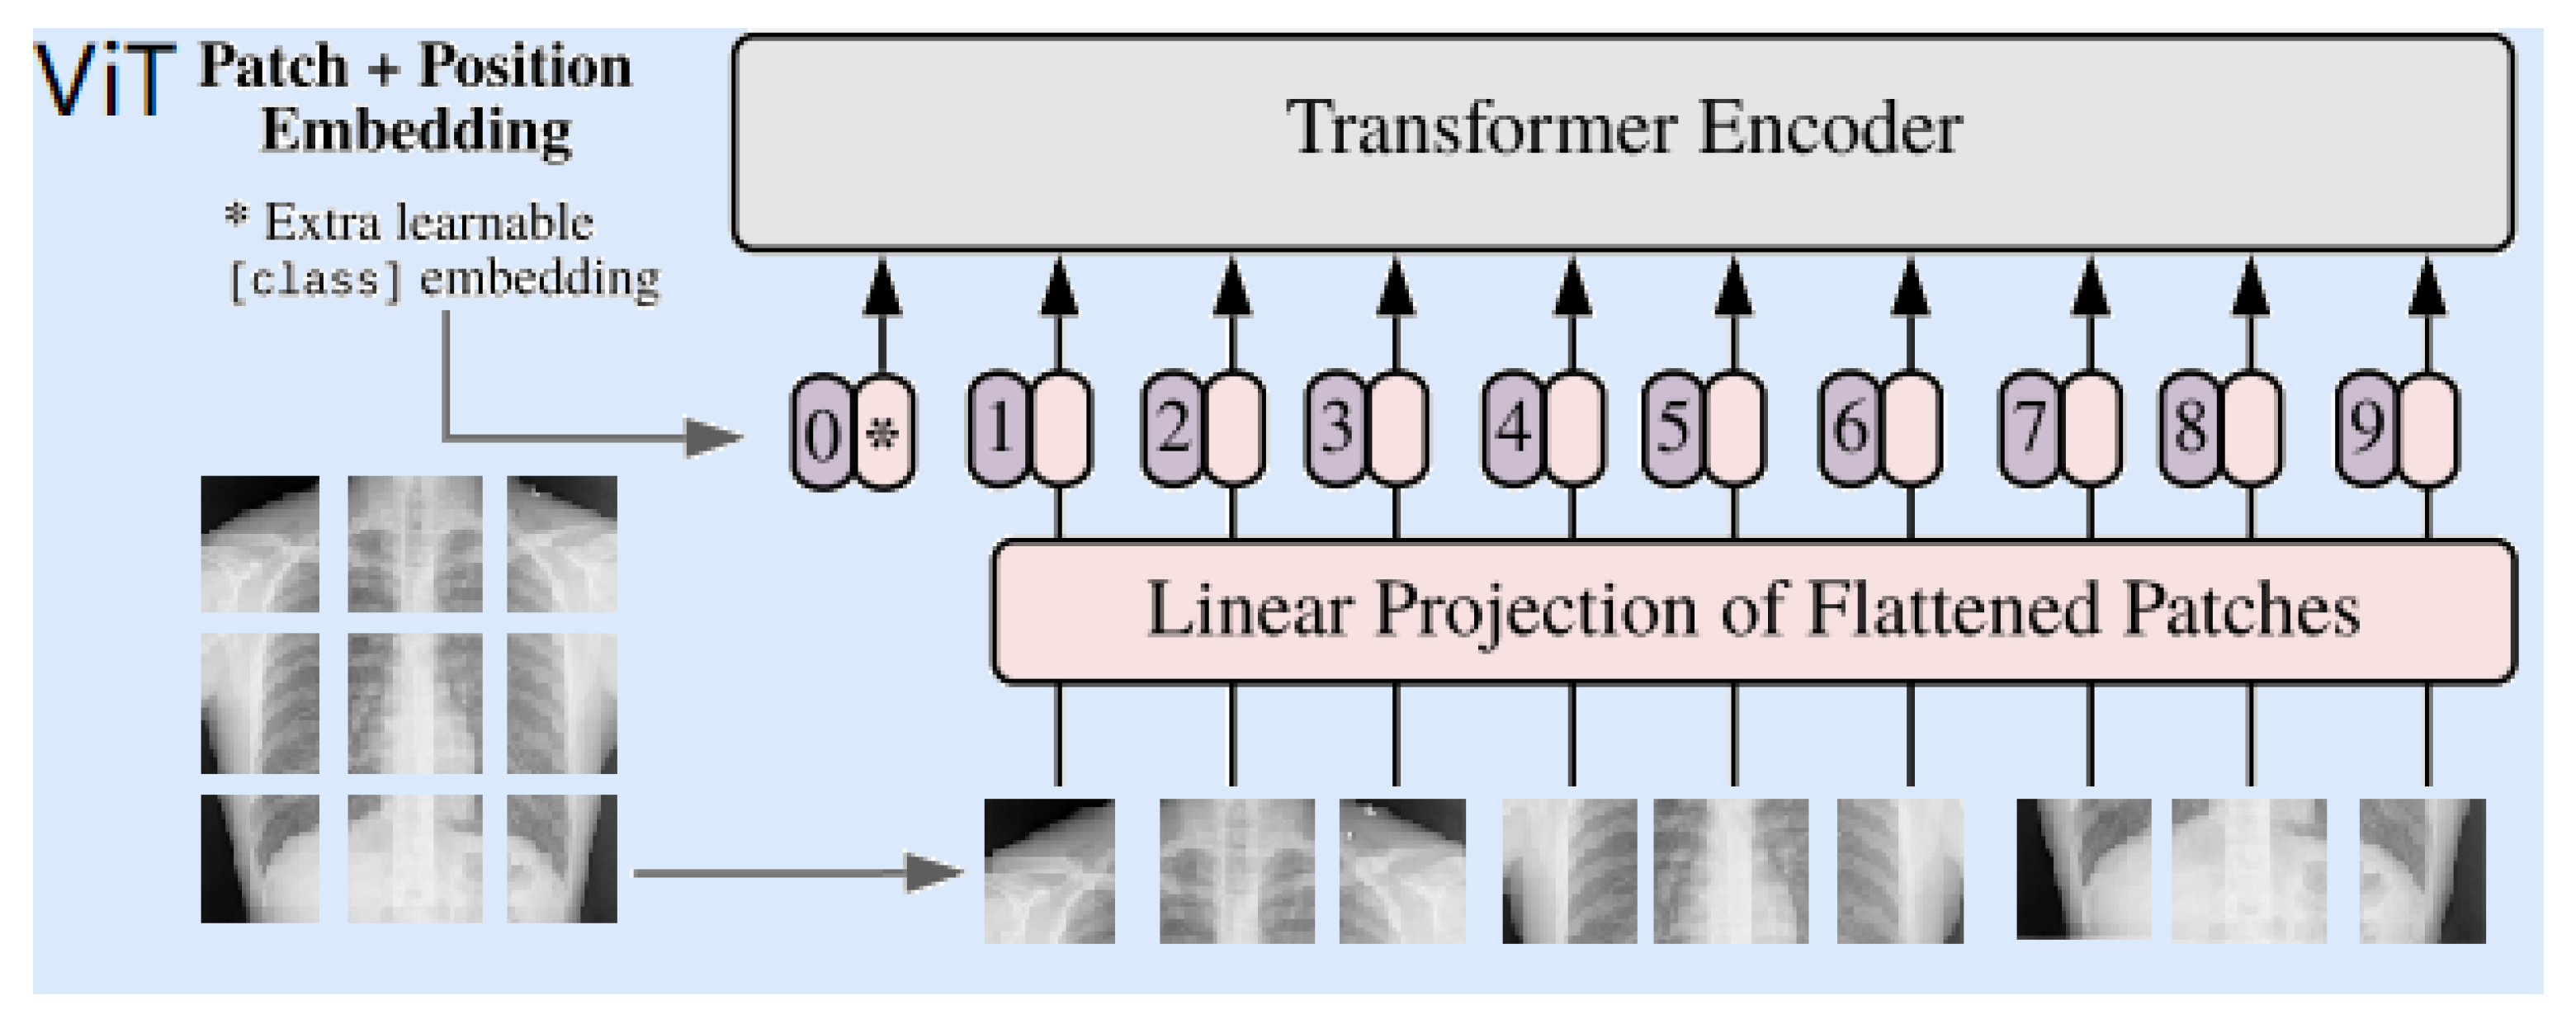
In the proposed system, three versions of ViT are adopted. These are Twins, Swins, and Segformer. The input image is split into several patches, usually in the shape of height × width × channels. In addition, the augmentation rotation is performed individually. The input image splits into patches, and those patches are the same size in height and width. The size of the Swin and Twin transformers is 800 × 800, whereas the size of the SegFormer is 512 × 512. The transformer learns how to follow a pattern by measuring the relationship between the input token pairs. Most input token pairs for cropped images are 0 (black). Then, the input images are ready for the next step, which flattens the images to reach the next level. This feeds the sequence of flattened images to the next step, which is encoding inside each transformer. In the encoder, there are three main layers. A multi-head self-attention layer linearly concatenates all of the attention outputs to the appropriate dimensions. The several attention heads aid in the training of the local and global dependencies in an image. A multi-layer perceptron layer is made up of two layers with activation functions. A normalization layer is inserted before each block as it has no new dependencies between the training images. As a result, the training time and overall performance are improved. A simplified block diagram of CXR image processing using the ViT is shown in Figure 4.
Different parameters of ViT models used in our experiment are shown in Table 3.
4. Results and Discussion
This section describes the different parameters of the proposed system, the experimental results, and the discussion.
4.1. Experimental Setup
The publicly accessible COVID-QU-Ex dataset, which contains a significant number of instances of COVID-19, viral pneumonia, and healthy cases, was used in the experiments. Randomly selected 80% of the samples were used for the training, and the remaining 20% were used for the testing. Additionally, we investigated the effectiveness and accuracy of the system in two cases: a balanced case and an imbalanced case. We would want to compare the ViT and CNNs in CXR classification using various metrics to describe the suggested model or to aid physicians in making better judgments, given the enormous volume of training data and processing resources.
During the experiment, we used the Adam optimizer with a learning rate of 1 × 10⁻³, a mini-batch size of 64 images, a dropout rate of 0.3, and 300 epochs. These parameters were empirically chosen. We also used a Windows® system with Intel® Xeon® CPU E5-2640v3 3.00-GHz processor, 2 TB of hard disk space, 16-GB RAM, and a CUDA-enabled NVIDIA GTX 1080 Ti 11-GB graphical processing unit. The networks were implemented using Pytorch libraries in Python 3.8. Instead of starting with random weight values during the training of the five CNN and ViT models, we used pretrained models (pretrained with the ImageNet database), and the convergence was achieved after at least 30 epochs, with a batch size of 32 images as a default value. In addition, all of the images in the experiments were CXR in frontal view PA, as previously mentioned.
4.2. Performance Metrics
The following performance metrics are used in this study:
- Accuracy
- Recall
- Precision
- F1-score
- Kappa value
The equations of the performance metrics are given below.
where Pe represents the expected value of the correct prediction and P0 is the observed value of prediction. The kappa value can also be calculated as follows.
where N is the total number of samples, n is the total number of classes (in our case, n = 3), Ti is the total number of true samples of class i, and Pi is the total number of predicted samples of class i. Therefore, the kappa value is an agreement between the classification map and the true data. A high value of kappa (near 100%) indicates a reliable performance of the system.
The following visualization metrics can provide an assessment and illustration:
- Model Accuracy vs. epoch
- Model Loss vs. epoch
- The area under the curve (AUC)-receiver operating characteristics (ROC)
- t-SNE
- grad-CAM
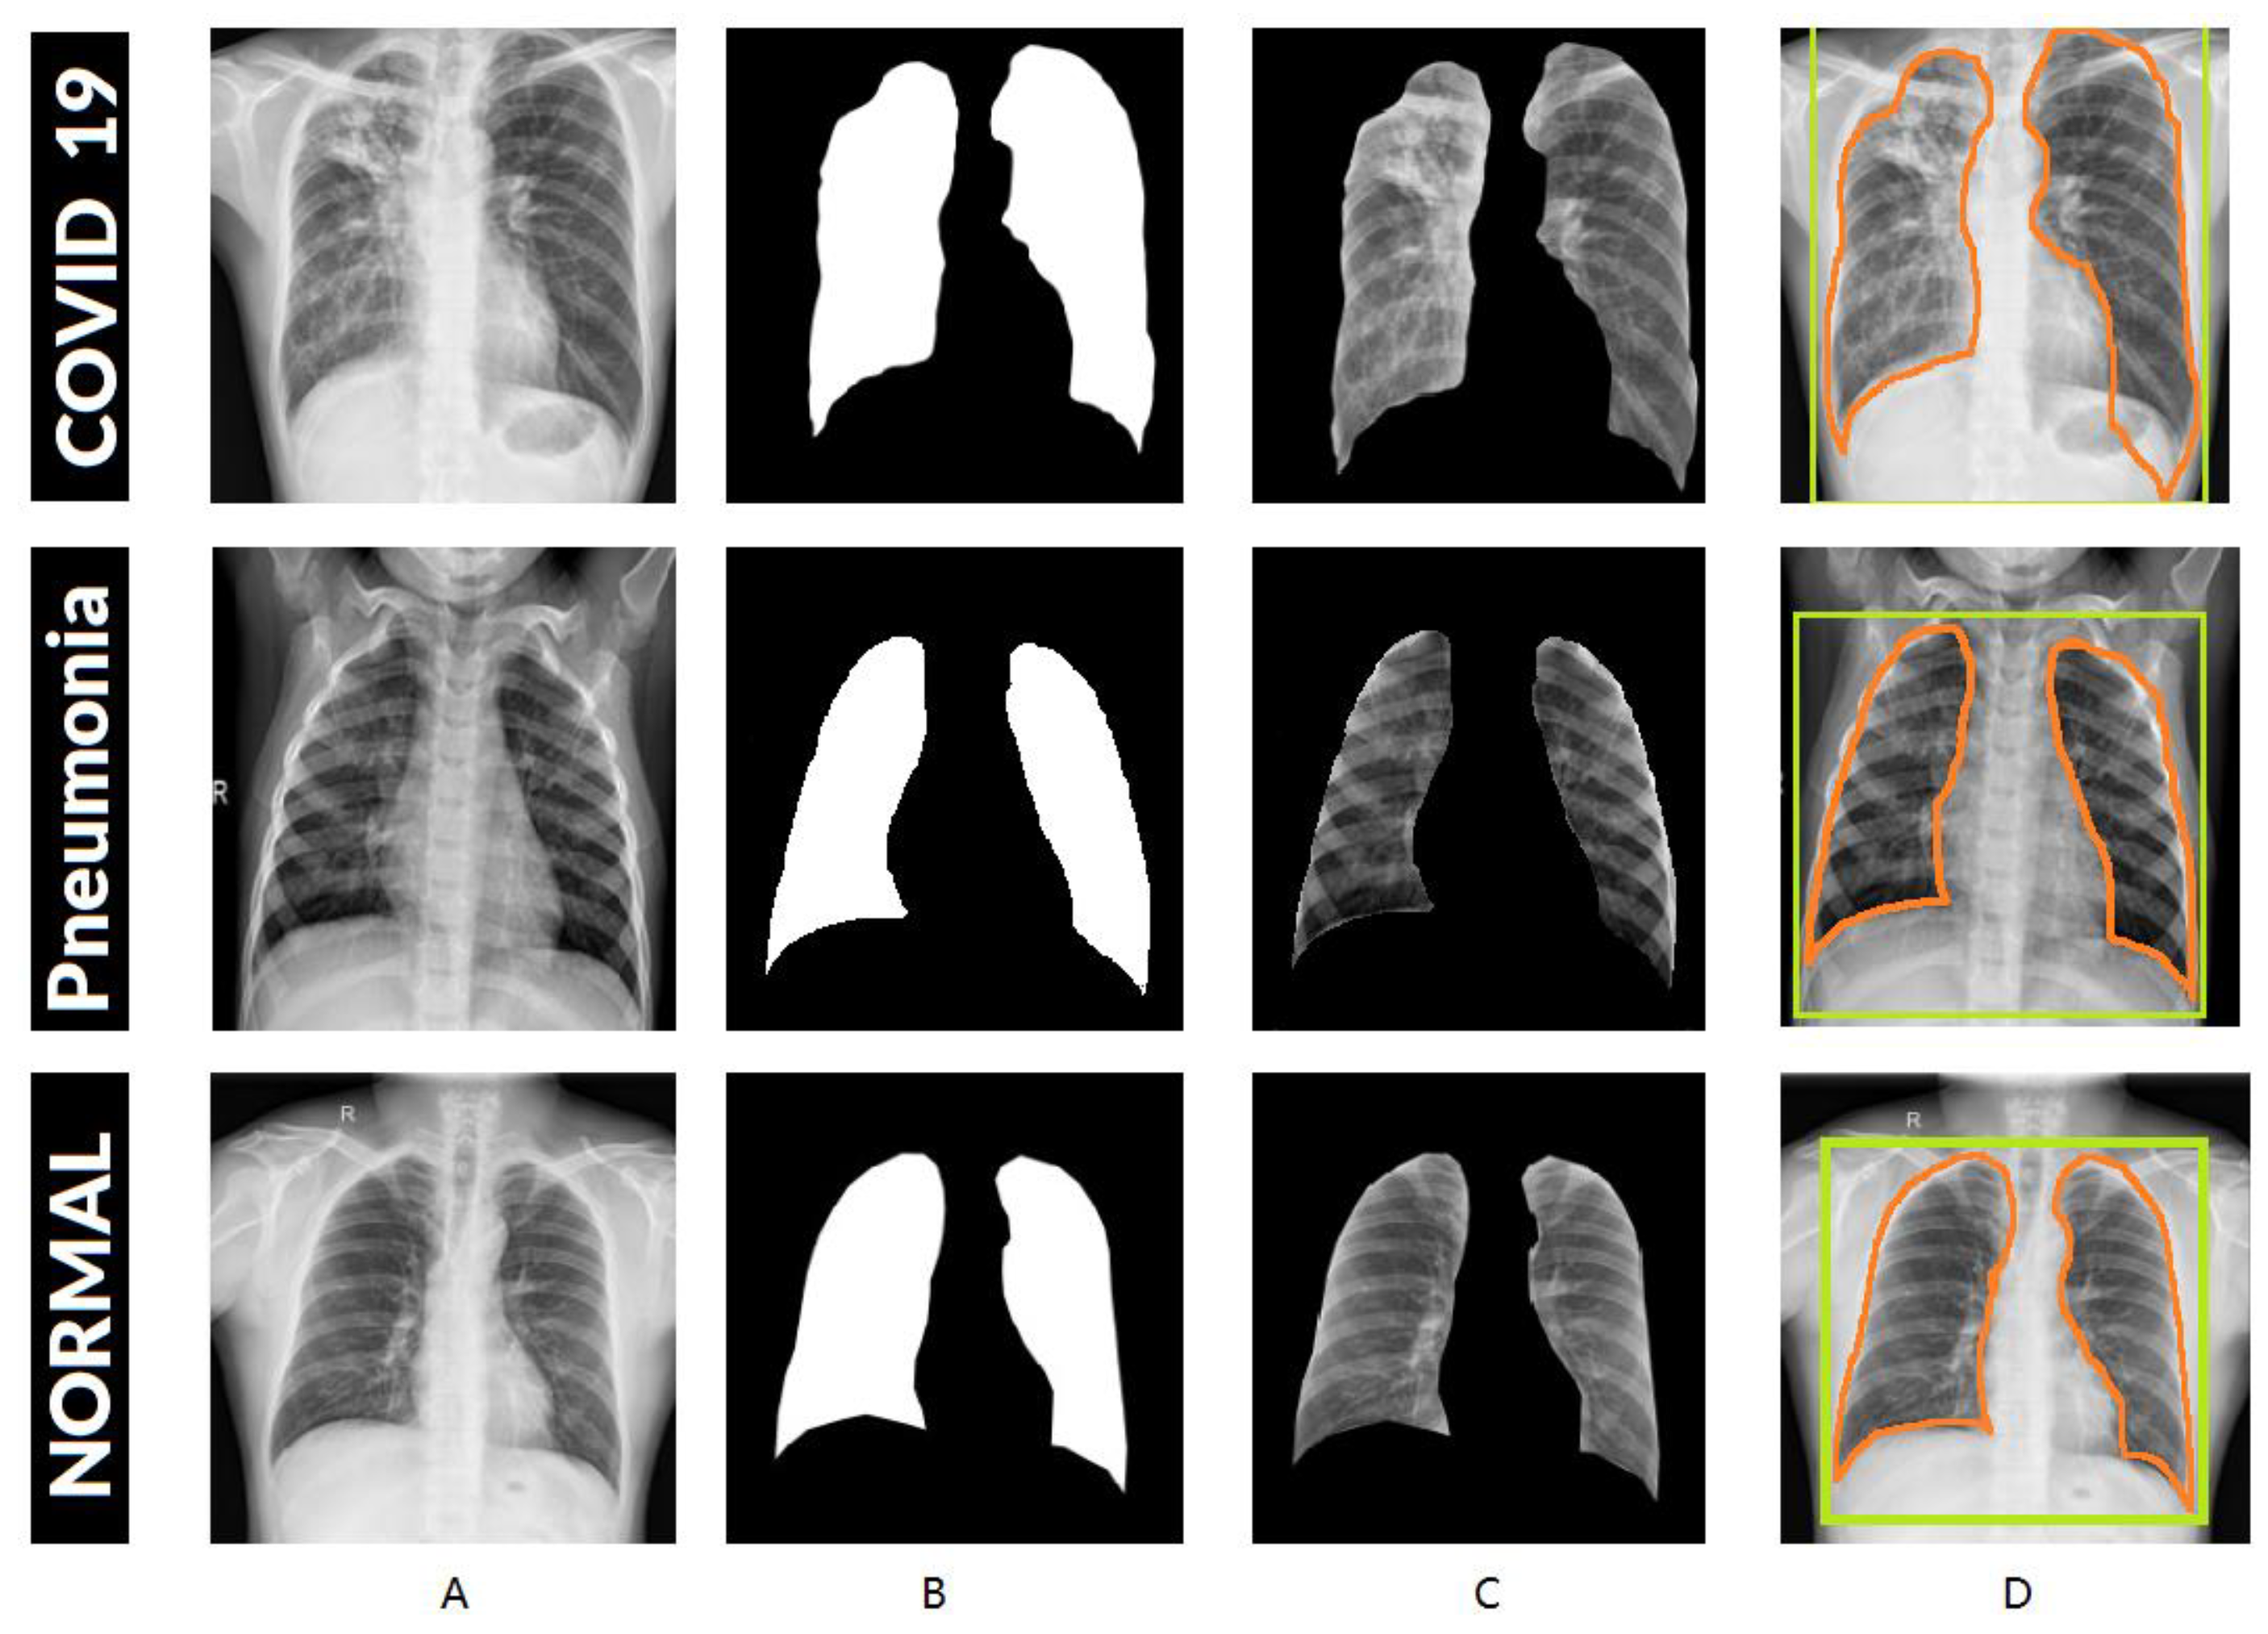
The UNet is used to extract the ROI of the CXR images. The parameters of the UNet are given in Table 4. Figure 5 shows the results of the UNet samples and the steps for segmenting lung images. The segmented images are then fed to the classifier to detect COVID-19.
After the segmentation, the images are input to the CNN-based and ViT-based models. The information on the different settings of the experiments is provided in Table 5.
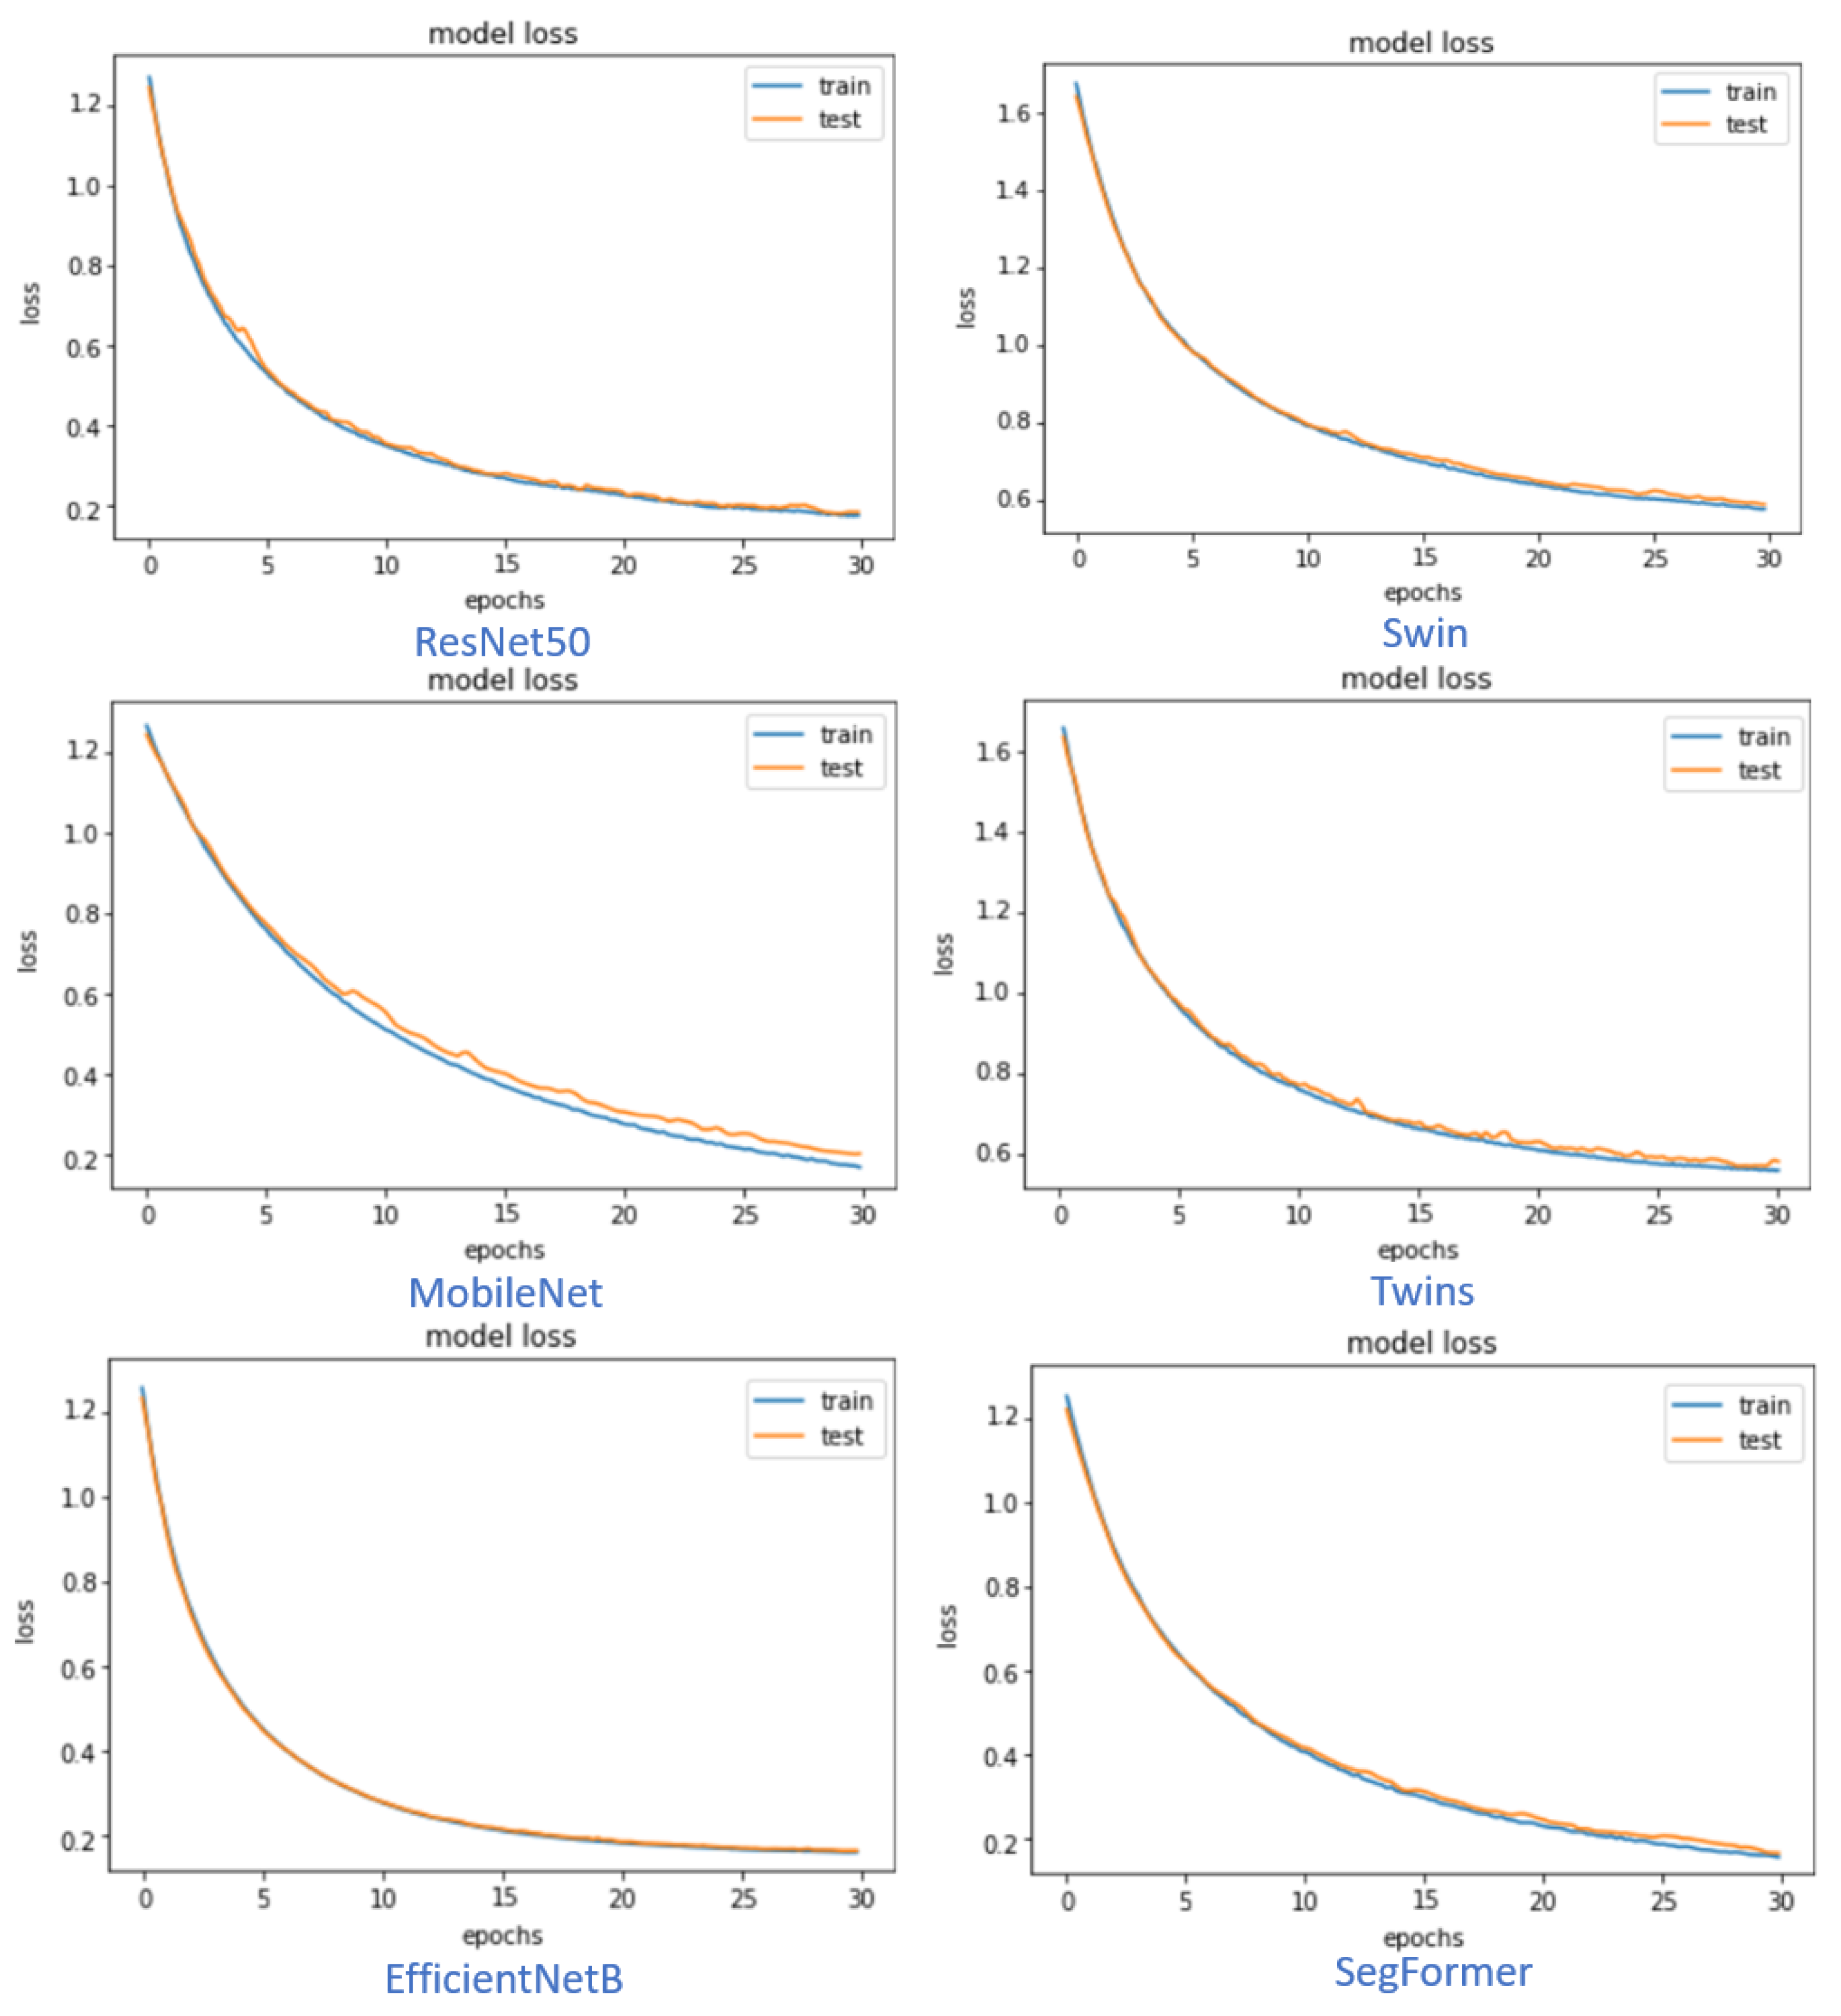
Figure 6 shows the training and testing loss versus epochs for the different models of CNN and ViT. It is shown that the CNN EfficientNetB7 model and the ViT Segformer-B5 model curves are smoother than the others within the same type of models. Most of the models’ loss graphs are smooth, and the system is nicely converged. The figures are achieved using augmented and segmented lung CXR images.
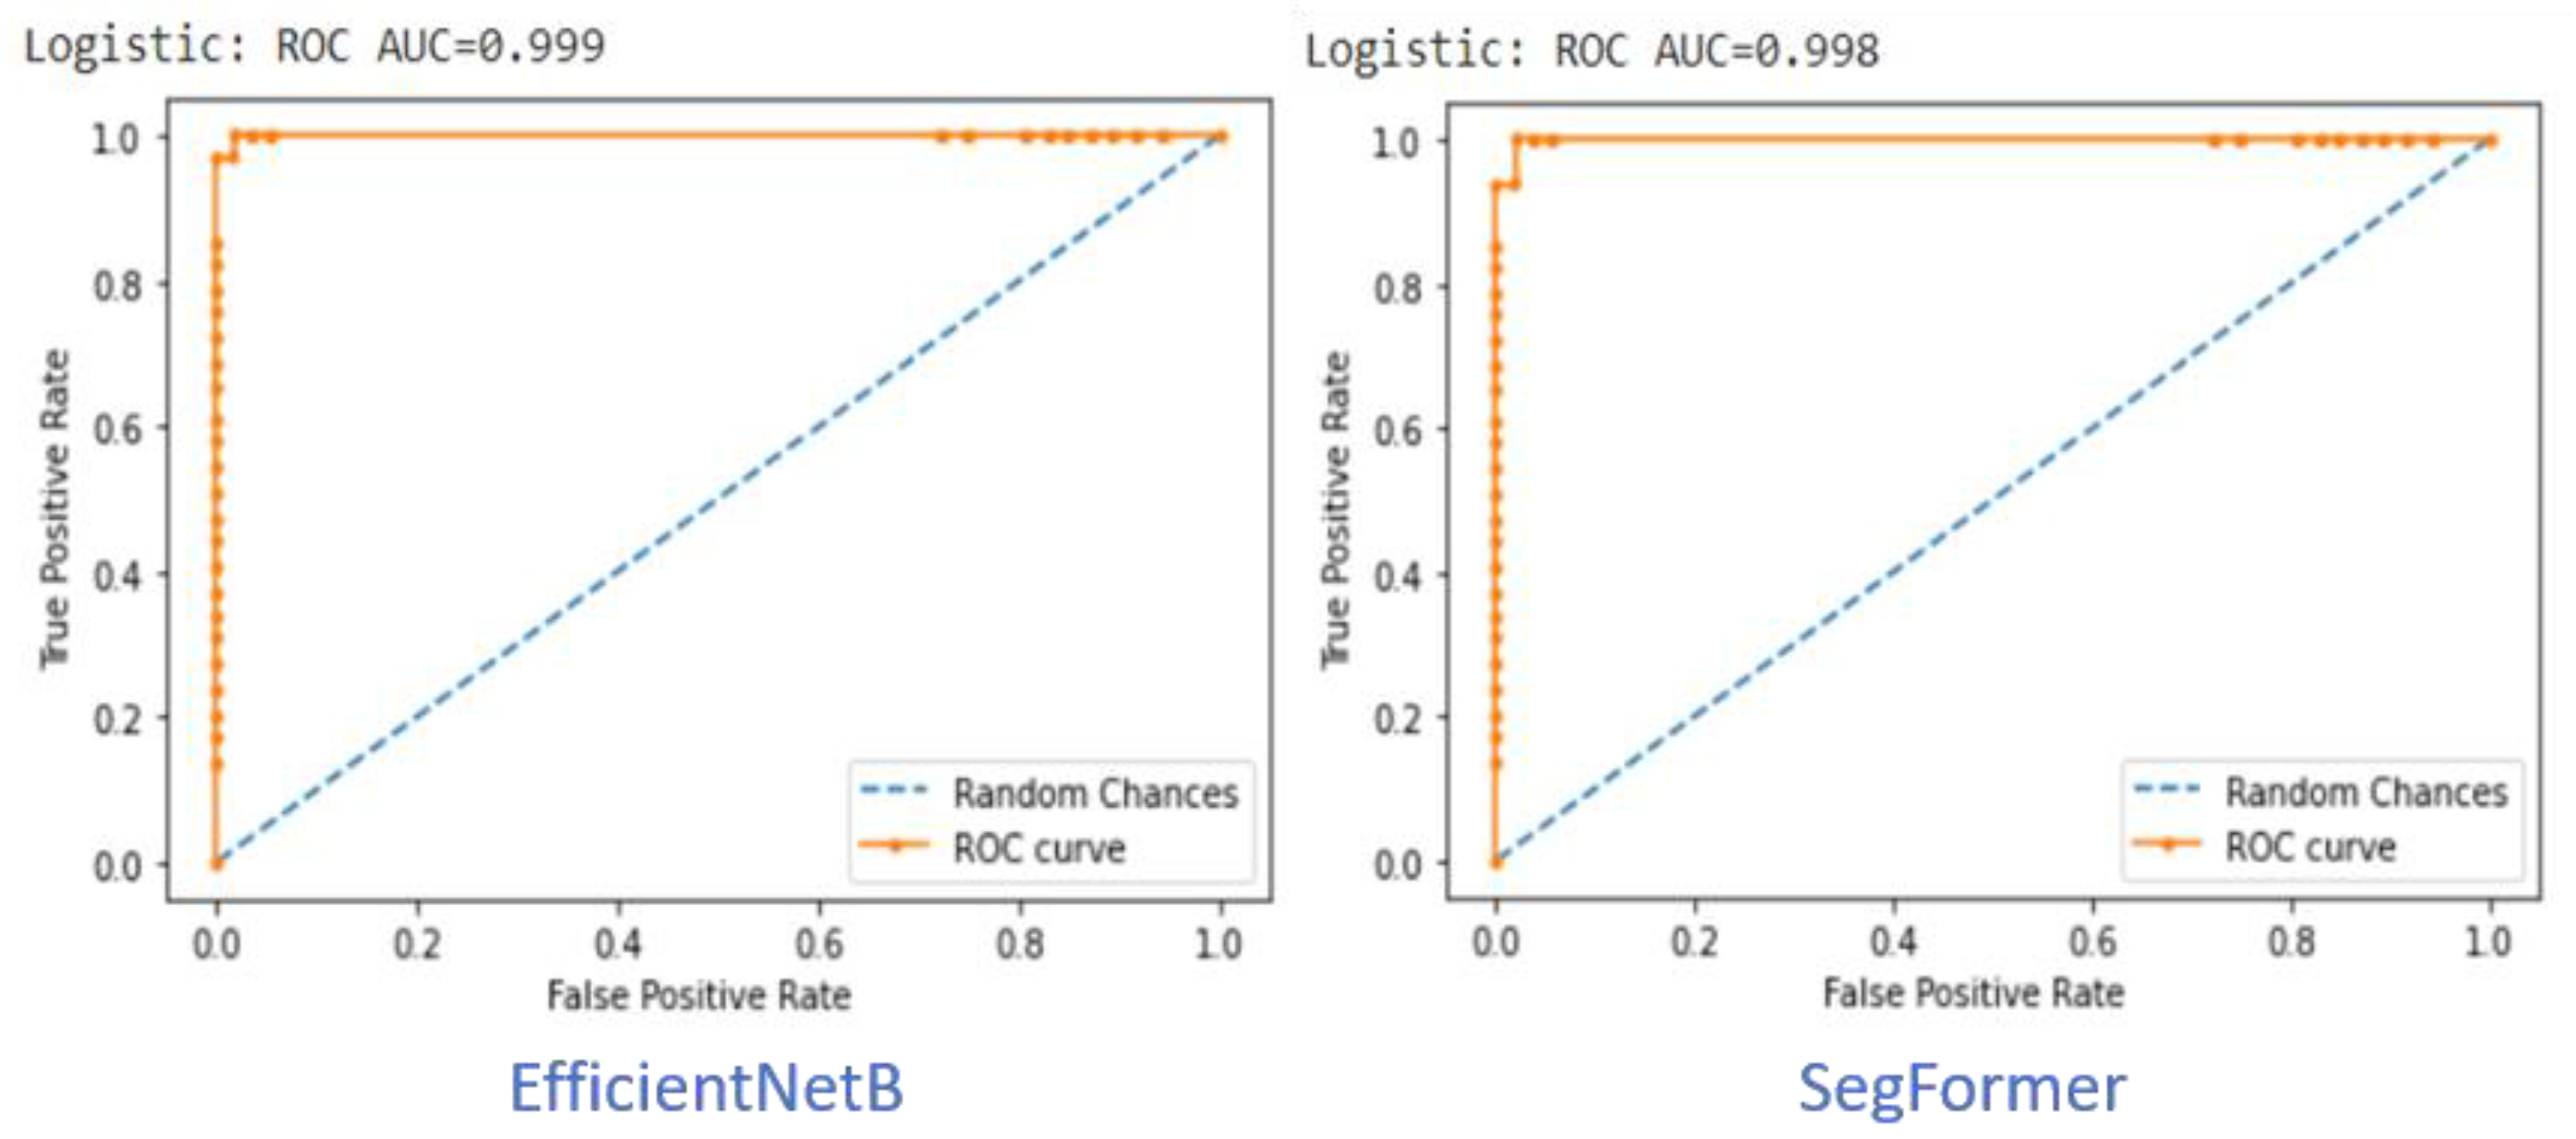
The ROC curve of the three classes (COVID-19, Pneumonia, and Healthy) of detection demonstrates the proposed system’s excellent ability to localize abnormal areas in the CXR. The False Positive Rate (FPR) is on the x-axis within the values between (0,1), and the True Positive Rate (TPR) is within the values between (0,1). The area that has been covered, which is under the ROC curve, is more efficient and more accurate for estimating the accuracy of the model. In addition, an excellent model poses an AUC near value 1, which shows that it has a good measure of separability. We compare the best results within the CNN and ViT models using segmented and augmented lung CXR images in the balanced case. Figure 7 shows the performance of the best CNN model (EfficientNetB7) and ViT model (Segformer-B5). In both cases, the AUC is very close to 1, and the EfficientNetB7 has a slight edge over the Segformer-B5.
Table 6 displays the results of 80% of the training and 20% of the testing for the original CXR images (without segmentation) without applying augmentation rotation, in both cases, for the balanced and unbalanced cases. Table 7 illustrates the results of 80% of the training and 20% of the testing for the segmented cropped CXR with augmentation applied, in both cases, for the balanced and unbalanced cases. According to the results in Table 6 and Table 7, we see that the performance for the balanced case is better than for the unbalanced case. EfficientNetB performed the best among the CNN-based models, and SegFormer performed the best among the ViT-based models. The performances of EfficientNetB7 and SegFormer are comparable to each other.
Although the kappa values are mostly used for the qualitative assessment between the raters, they are often used in many machine learning-based systems. In the proposed approach, with the balanced sample case, ViT-based SegFormer achieved a kappa value of 86.15% without segmentation and augmentation, and 99.58% with segmentation and augmentation. This implies that the approach with segmentation and augmentation has more certainty or reliability to detect the correct class than that without segmentation and augmentation.
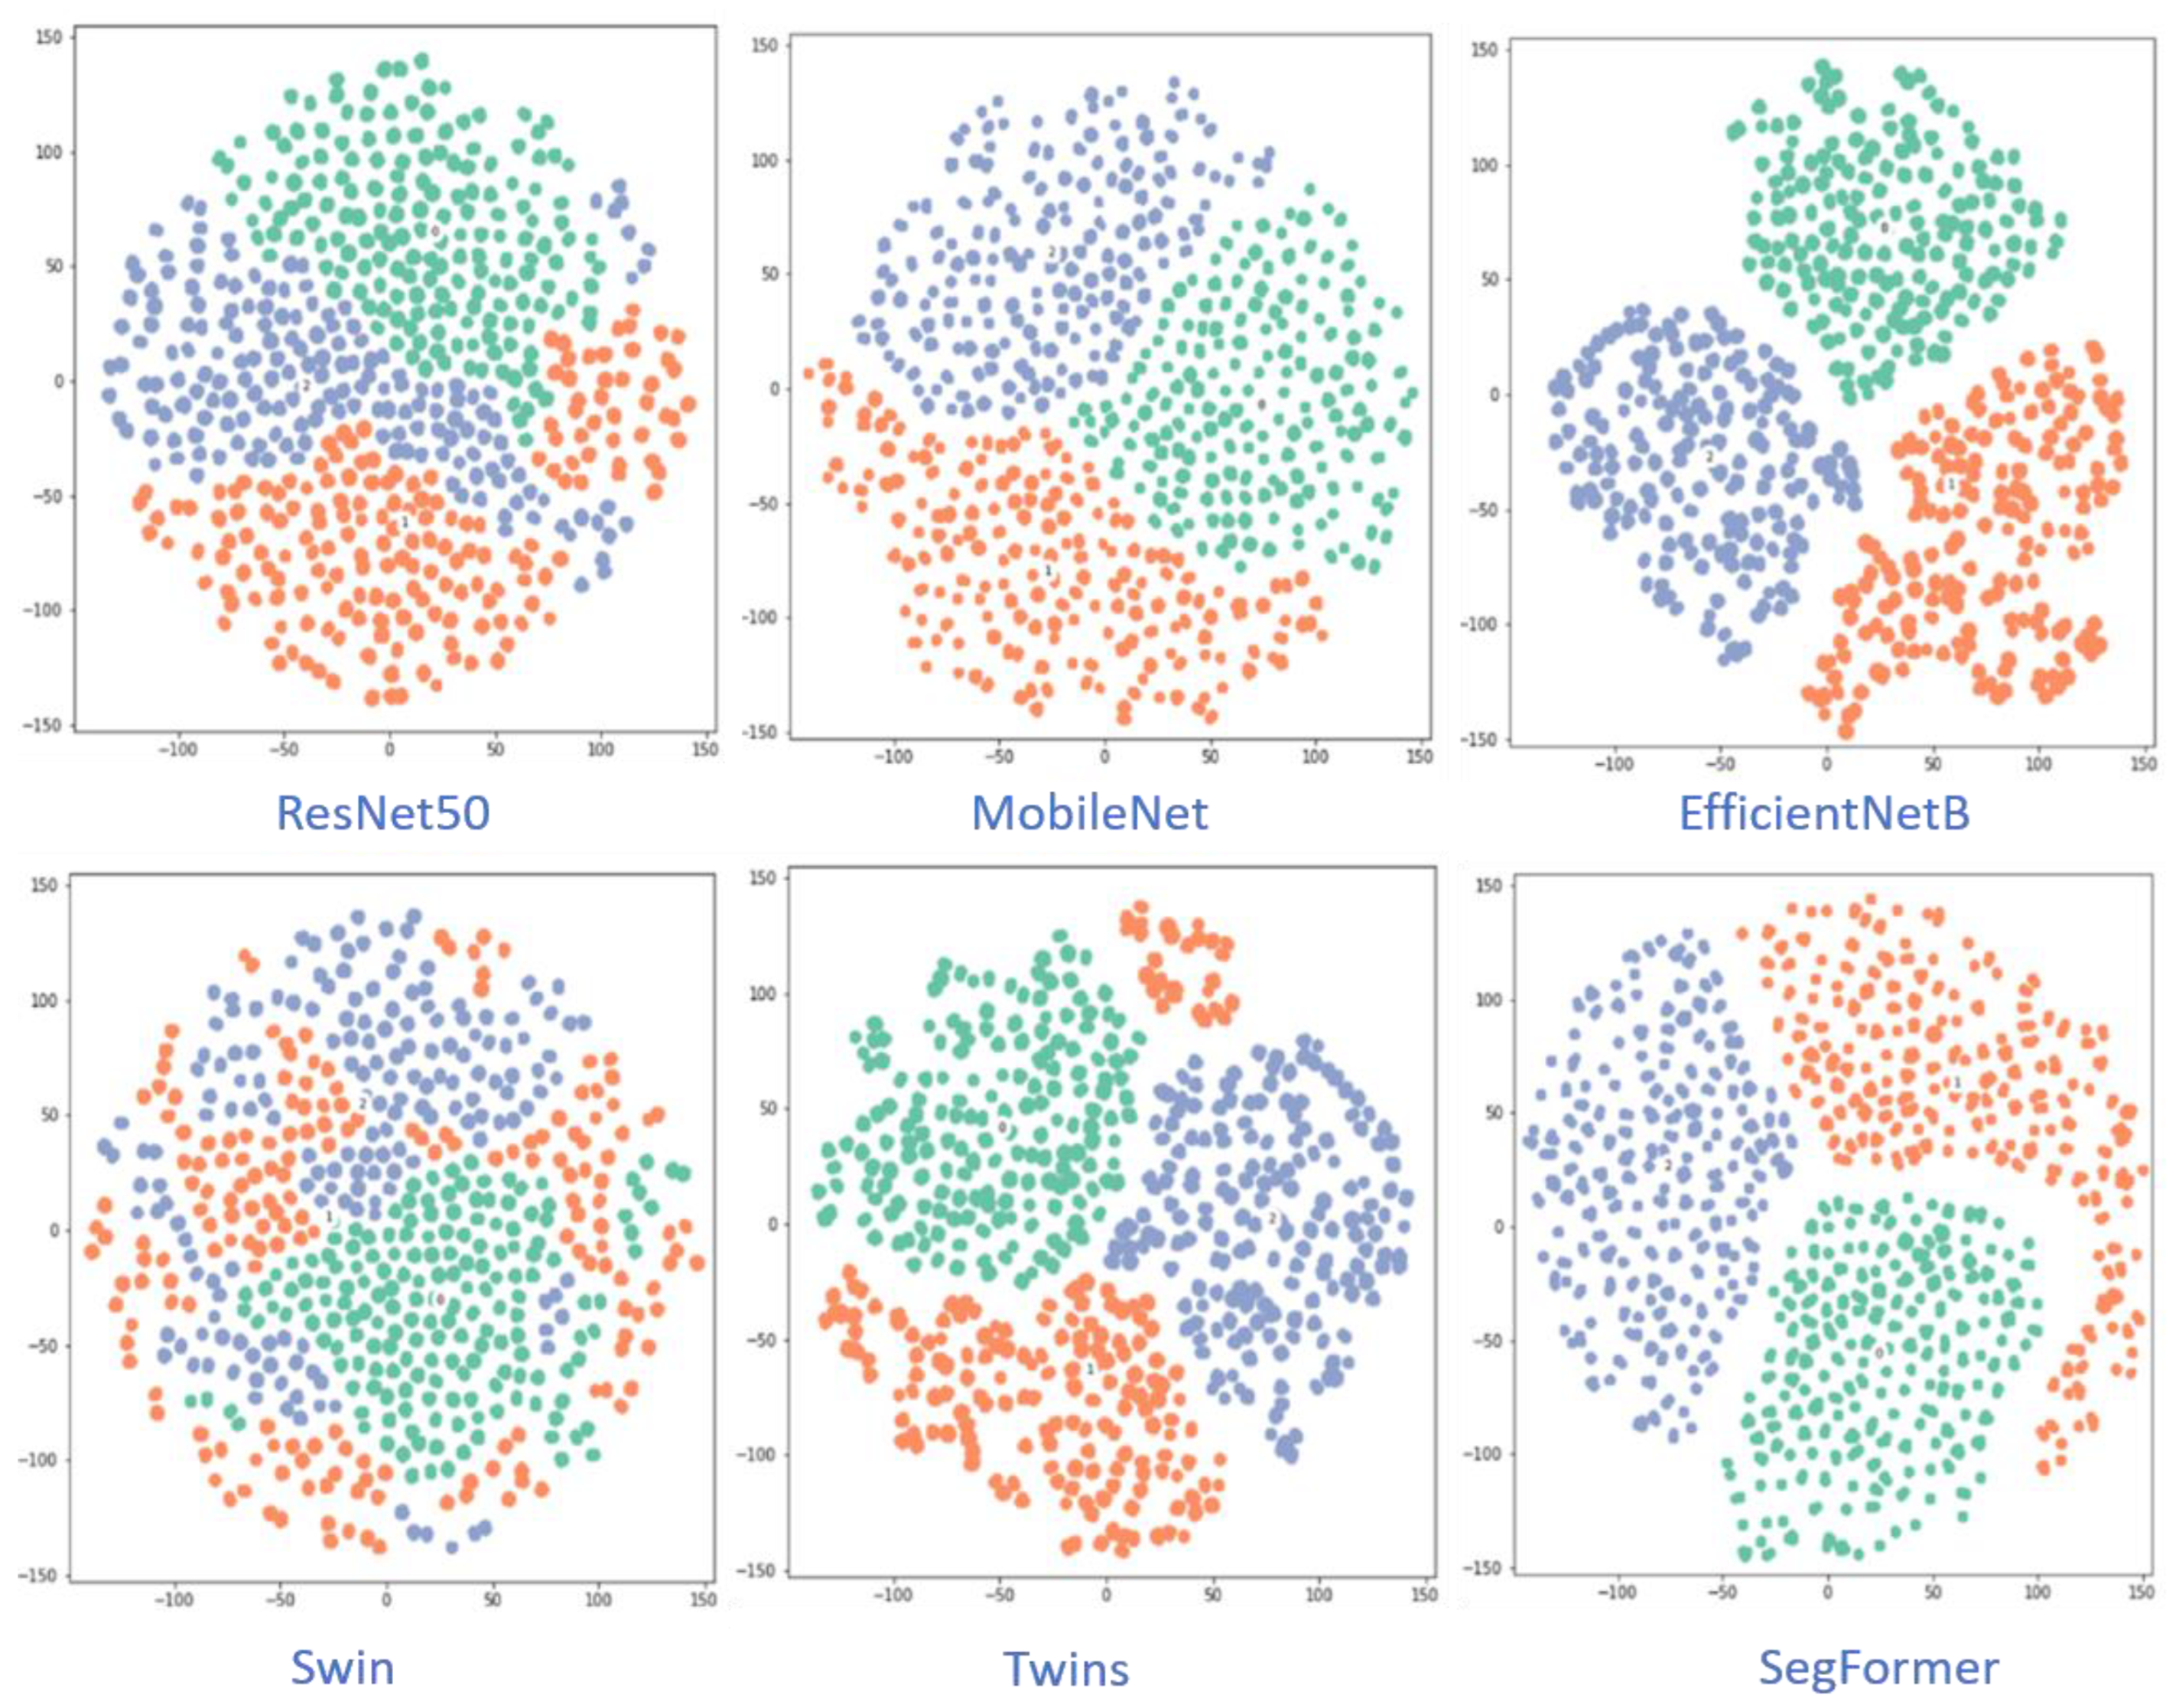
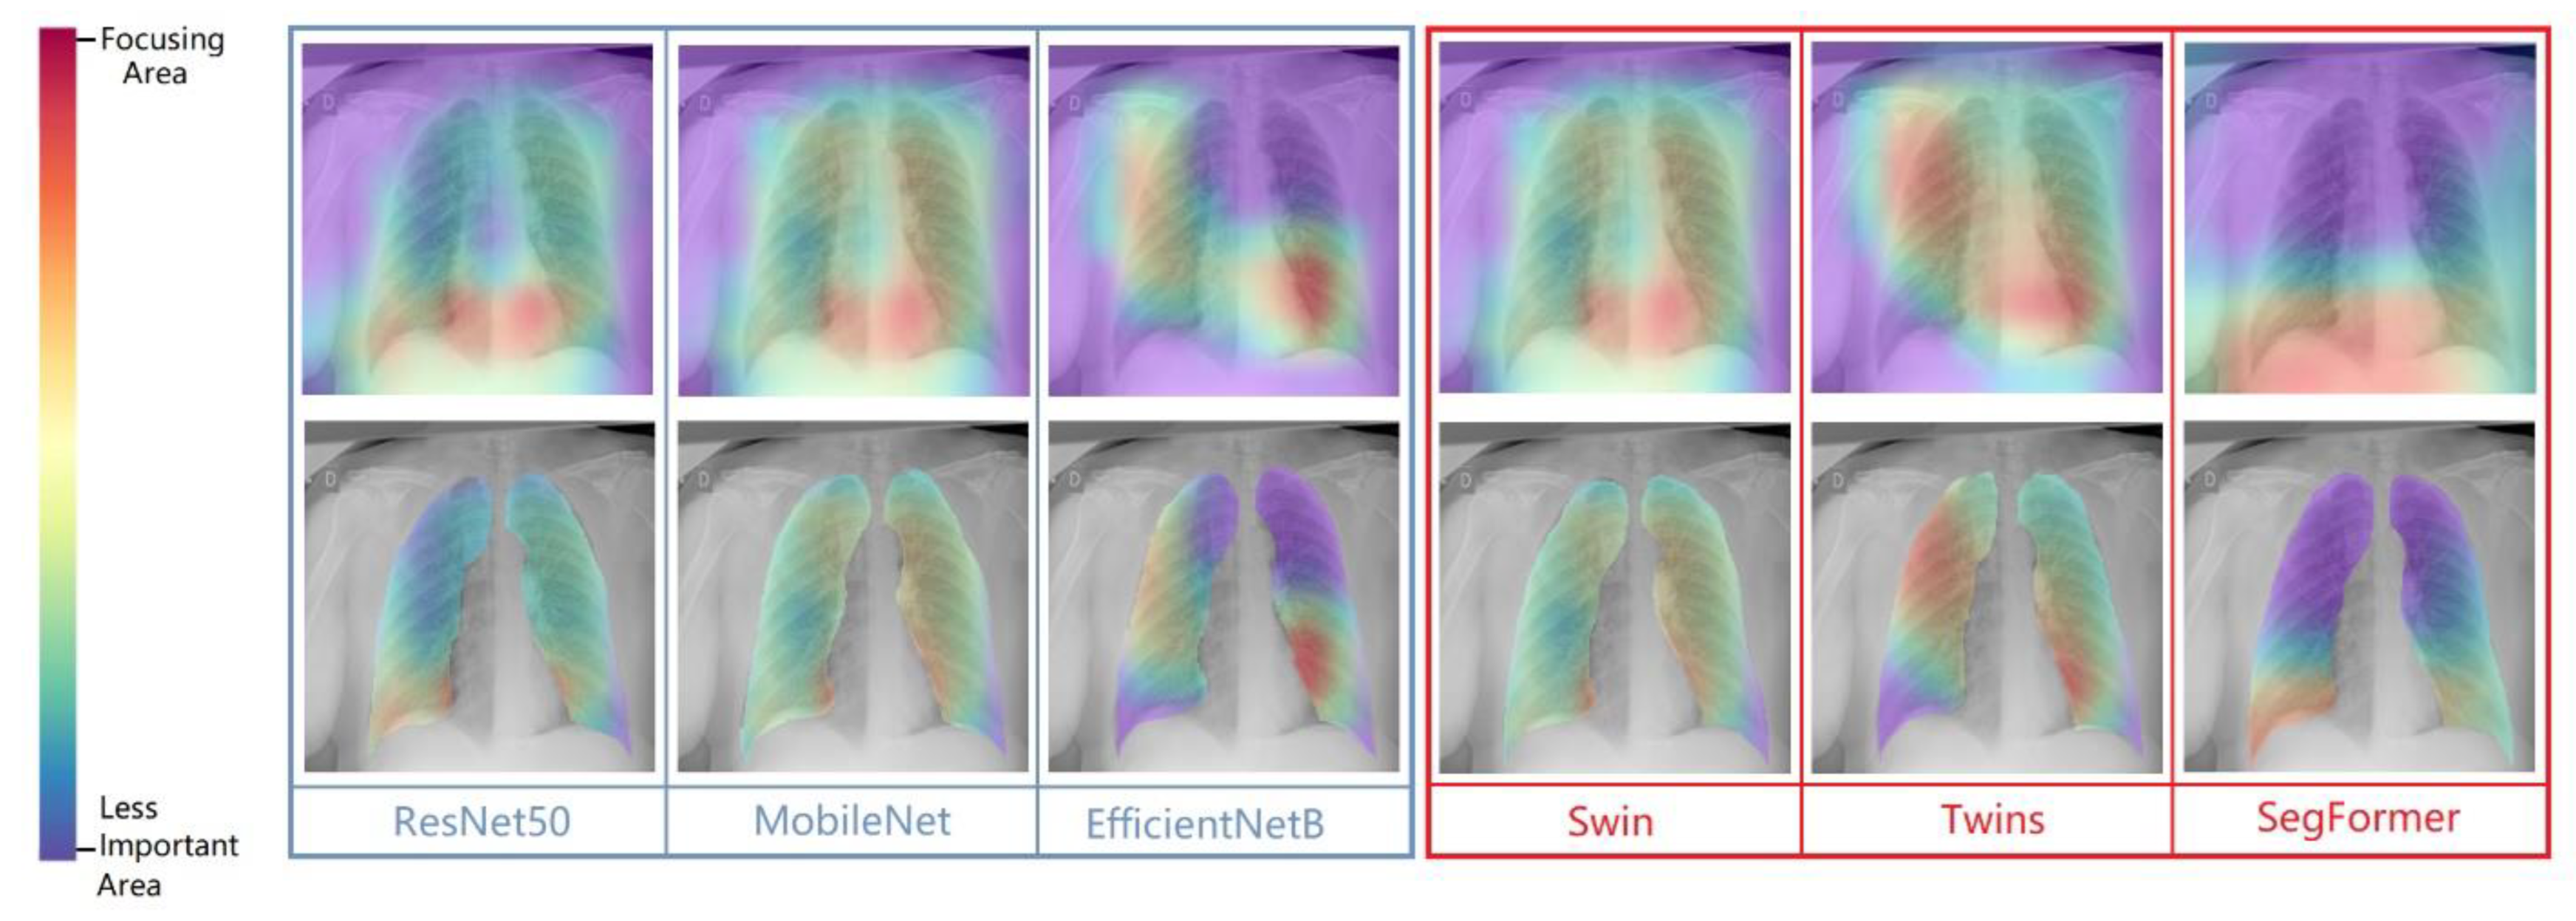
Figure 8 visualizes the class-separation capability of the different CNN-based and ViT-based models. The EfficientNetB and Segformer models have better class-separation capability than the other models. Figure 9 shows the grad-CAM images of six models for two samples.
While using the CNN-based models, EfficientNet performed the best. This is due to the characteristics of the model. The CNN model is scaled evenly over depth, breadth, and resolution using EfficientNet, a network design and scaling approach that uses a compound coefficient. The EfficientNet scaling approach uses a set of preset scaling coefficients to consistently scale the network width, depth, and resolution, as opposed to the standard practice of arbitrarily scaling these elements. Among the ViT models, the SegFormer performed the best in the experiments. This can be explained by the fact that the SegFormer uses semantic information, and fuses multi-level features in the form of low-resolution and high-resolution features. In addition, it uses FFN instead of PE to avoid information leakage.
Table 8 shows a comparison of the performances between the state-of-the-art models. We compared the proposed model with more than ten models, where all the models were deployed from the year 2020 onwards. The work in [32,46,47,48] and the proposed method use the same dataset and the same number of samples [36]. Compared to these four models, our proposed model achieved the highest accuracy by some distance. The work in [9,11,14,31,49,50,51] used CNN-based methods but different datasets. Compared to the other models, the proposed model’s performance is better in most cases. EfficientNetB (CNN-based) and SegFormer (ViT-based) performed the best, achieving an accuracy higher than 99.8%.
5. Conclusions
A deep learning-based automated approach for the early identification of COVID-19 and pneumonia was presented in this work. This study specifically provided a variety of cutting-edge CNN models and transformer models for comparison and investigation into which performs better in terms of various metrics that will characterize the performance visually and in numerical figures. Instead of learning from the whole CXR image, the ROI was first extracted and then fed into the models. In addition to the ViT-based Swin, Twins, and SegFormer models, we also studied the CNN-based ResNet50, MobileNet, and EfficientNetB7 models. In the experiments, we found that the ROI-segmented images performed better than the raw CXR images. The performance of deep learning models may be impacted by network depth; thus, it is crucial to balance the number of parameters and training data utilized in the training. Notably, the network performance is not dependent on the network depth in the experiments. RenNet50 is deeper than MobileNet, but MobileNet achieved a better performance. EfficientNetB7 demonstrated a good example of transfer learning and output compared to the other networks for detecting COVID-19 between three classes. On the other hand, SegFormerB5 provided the best results among the ViT-based models. The performances of CNN-based EfficientNetB7 (accuracy of 99.82%) and ViT-based SegFormerB5 (accuracy of 99.81%) are comparable.
The proposed approach was not evaluated on edge computing. In addition, in the proposed approach, we only used rotation augmentation. The number of samples could be increased by generating new samples using generative adversarial networks. Further, the generalization of the proposed models was not performed using cross-dataset experiments. However, we want to mention that the COVID-QU-Ex dataset was developed using CXR images of different settings and environments.
This study’s state-of-the-art detection performance may be used as a quick and efficient diagnostic tool, which would greatly reduce the number of fatalities annually brought on by inaccurate or delayed diagnoses. In a future study, we will investigate the use of multi-head attention in CNN-based models.
Author Contributions
Conceptualization, S.I.N. and G.M.; methodology, S.I.N.; software, S.I.N. and G.M.; validation, S.I.N., G.M. and M.S.H.; formal analysis, S.I.N.; investigation, S.I.N. and G.M.; resources, M.S.H. and S.A.A.; data curation, S.I.N.; writing—original draft preparation, S.I.N. and G.M.; writing—review and editing, M.S.H. and S.A.A.; visualization, S.I.N.; supervision, G.M.; project administration, G.M., M.S.H., and S.A.A.; funding acquisition, G.M. All authors have read and agreed to the published version of the manuscript.
Funding
This work was funded by the Deputyship for Research and Innovation, Ministry of Education in Saudi Arabia through the project no. (IFKSURG-2-244).
Data Availability Statement
We used a publicly accessible dataset. The website to download the dataset is https://www.kaggle.com/datasets/anasmohammedtahir/covidqu/versions/5, accessed on 15 January 2023.
Acknowledgments
The authors extend their appreciation to the Deputyship for Research and Innovation, Ministry of Education in Saudi Arabia for funding this research work through the project no. (IFKSURG-2-244).
Conflicts of Interest
The authors declare no conflict of interest.
References
- Fan, E.; Beitler, J.R.; Brochard, L.; Calfee, C.S.; Ferguson, N.D.; Slutsky, A.S.; Brodie, D. COVID-19-associated acute respiratory distress syndrome: Is a different approach to management warranted? Lancet Respir. Med. 2020, 8, 816–821. [Google Scholar] [CrossRef] [PubMed]
- World Health Organization. Antibiotic Resistance: Key Facts. WHO. 2018. Available online: https://www.who.int/news-room/fact-sheets/detail/antibiotic-resistance (accessed on 10 November 2022).
- Masud, M.; Gaba, G.S.; Alqahtani, S.; Muhammad, G.; Gupta, B.B.; Kumar, P.; Ghoneim, A. A Lightweight and Robust Secure Key Establishment Protocol for Internet of Medical Things in COVID-19 Patients Care. IEEE Internet Things J. 2021, 8, 15694–15703. [Google Scholar] [CrossRef] [PubMed]
- Gaur, L.; Bhatia, U.; Jhanjhi, N.Z.; Muhammad, G.; Masud, M. Medical image-based detection of COVID-19 using Deep Convolution Neural Networks. Multimedia Syst. 2021, 1–10. [Google Scholar] [CrossRef]
- van der Pol, S.; Garcia, P.R.; Postma, M.J.; Villar, F.A.; van Asselt, A.D.I. Economic Analyses of Respiratory Tract Infection Diagnostics: A Systematic Review. Pharmacoeconomics 2021, 39, 1411–1427. [Google Scholar] [CrossRef]
- Muhammad, G.; Alqahtani, S.; Alelaiwi, A. Pandemic Management for Diseases Similar to COVID-19 Using Deep Learning and 5G Communications. IEEE Netw. 2021, 35, 21–26. [Google Scholar] [CrossRef]
- Aiyegbusi, O.L.; Hughes, S.E.; Turner, G.; Rivera, S.C.; McMullan, C.; Chandan, J.S.; Haroon, S.; Price, G.; Davies, E.H.; Nirantharakumar, K.; et al. Supplemental material for Symptoms, complications and management of long COVID: A review. J. R. Soc. Med. 2021, 114, 428–442. [Google Scholar] [CrossRef]
- Raveendran, A.V.; Jayadevan, R.; Sashidharan, S. Diabetes & metabolic syndrome: Clinical research & reviews long COVID: An overview. Diabetes Metab. Syndr. Clin. Res. Rev. 2021, 15, 869–875. [Google Scholar]
- Brunese, L.; Mercaldo, F.; Reginelli, A.; Santone, A. Explainable Deep Learning for Pulmonary Disease and Coronavirus COVID-19 Detection from X-rays. Comput. Methods Programs Biomed. 2020, 196, 105608. [Google Scholar] [CrossRef] [PubMed]
- Hussain, E.; Hasan, M.; Rahman, A.; Lee, I.; Tamanna, T.; Parvez, M.Z. CoroDet: A deep learning based classification for COVID-19 detection using chest X-ray images. Chaos Solitons Fractals 2020, 142, 110495. [Google Scholar] [CrossRef]
- Horry, M.J.; Chakraborty, S.; Paul, M.; Ulhaq, A.; Pradhan, B.; Saha, M.; Shukla, N. COVID-19 Detection Through Transfer Learning Using Multimodal Imaging Data. IEEE Access 2020, 8, 149808–149824. [Google Scholar] [CrossRef]
- Khan, A.I.; Shah, J.L.; Bhat, M.M. CoroNet: A deep neural network for detection and diagnosis of COVID-19 from chest x-ray images. Comput. Methods Programs Biomed. 2020, 196, 105581. [Google Scholar] [CrossRef] [PubMed]
- Nafisah, S.I.; Muhammad, G. Tuberculosis detection in chest radiograph using convolutional neural network architecture and explainable artificial intelligence. Neural Comput. Appl. 2022, 1–21. [Google Scholar] [CrossRef] [PubMed]
- Vaid, S.; Kalantar, R.; Bhandari, M. Deep learning COVID-19 detection bias: Accuracy through artificial intelligence. Int. Orthop. 2020, 44, 1539–1542. [Google Scholar] [CrossRef]
- Bakare, O.O.; Fadaka, A.O.; Klein, A.; Keyster, M.; Pretorius, A. Diagnostic approaches of pneumonia for commercial-scale biomedical applications: An overview. All Life 2020, 13, 532–547. [Google Scholar] [CrossRef]
- Albahli, S. Efficient GAN-based Chest Radiographs (CXR) augmentation to diagnose coronavirus disease pneumonia. Int. J. Med. Sci. 2020, 17, 1439–1448. [Google Scholar] [CrossRef] [PubMed]
- Alshehri, F.; Muhammad, G. A Comprehensive Survey of the Internet of Things (IoT) and AI-Based Smart Healthcare. IEEE Access 2020, 9, 3660–3678. [Google Scholar] [CrossRef]
- Virkki, R.; Juven, T.; Rikalainen, H.; Svedström, E.; Mertsola, J.; Ruuskanen, O. Differentiation of bacterial and viral pneumonia in children. Thorax 2002, 57, 438–441. [Google Scholar] [CrossRef] [Green Version]
- Garg, M.; Prabhakar, N.; Gulati, A.; Agarwal, R.; Dhooria, S. Spectrum of imaging findings in pulmonary infections. Part 1: Bacterial and viral. Pol. J. Radiol. 2019, 84, e205–e213. [Google Scholar] [CrossRef]
- Muhammad, G.; Alshehri, F.; Karray, F.; El Saddik, A.; Alsulaiman, M.; Falk, T.H. A comprehensive survey on multimodal medical signals fusion for smart healthcare systems. Inf. Fusion 2021, 76, 355–375. [Google Scholar] [CrossRef]
- Siddiqui, S.; Arifeen, M.; Hopgood, A.; Good, A.; Gegov, A.; Hossain, E.; Rahman, W.; Hossain, S.; Al Jannat, S.; Ferdous, R.; et al. Deep Learning Models for the Diagnosis and Screening of COVID-19: A Systematic Review. SN Comput. Sci. 2022, 3, 1–22. [Google Scholar] [CrossRef]
- Vaswani, A.; Shazeer, N.; Parmar, N.; Uszkoreit, J.; Jones, L.; Gomez, A.N.; Kaiser, Ł.; Polosukhin, I. Attention Is All You Need. Adv. Neural Inf. Process. Syst. 2017, 30, 1–15. [Google Scholar]
- Cuenat, S.; Couturier, R. Convolutional Neural Network (CNN) vs Vision Transformer (ViT) for Digital Holography. In Proceedings of the 2022 2nd International Conference on Computer, Control and Robotics (ICCCR), Shanghai, China, 18–20 March 2022; pp. 235–240. [Google Scholar] [CrossRef]
- Lu, K.; Xu, Y.; Yang, Y. Comparison of the potential between transformer and CNN in image classification. In Proceedings of the ICMLCA 2021 2nd International Conference on Machine Learning and Computer Application, Shenyang, China, 17–19 December 2021. [Google Scholar]
- Dosovitskiy, A.; Beyer, L.; Kolesnikov, A.; Weissenborn, D.; Zhai, X.; Unterthiner, T.; Dehghani, M.; Minderer, M.; Heigold, G.; Gelly, S. An Image is Worth 16x16 Words: Transformers for Image Recognition at Scale. arXiv 2021, arXiv:2010.11929v2. [Google Scholar]
- Russakovsky, O.; Deng, J.; Su, H.; Krause, J.; Satheesh, S.; Ma, S.; Huang, Z.; Karpathy, A.; Khosla, A.; Bernstein, M.; et al. ImageNet Large Scale Visual Recognition Challenge. Int. J. Comput. Vis. 2015, 115, 211–252. [Google Scholar] [CrossRef] [Green Version]
- Xie, J.; Zeng, R.; Wang, Q.; Zhou, Z.; Li, P. SoT: Delving Deeper into Classification Head for Transformer. arXiv 2021, arXiv:2104.10935. [Google Scholar]
- Deng, J.; Dong, W.; Socher, R.; Li, L.J.; Li, K.; Fei-Fei, L. ImageNet: A large-scale hierarchical image database. In Proceedings of the 2009 IEEE Conference on Computer Vision and Pattern Recognition, Miami, FL, USA, 20–25 June 2009. [Google Scholar]
- Barragán-Montero, A.; Javaid, U.; Valdés, G.; Nguyen, D.; Desbordes, P.; Macq, B.; Willems, S.; Vandewinckele, L.; Holmström, M.; Löfman, F. Artificial intelligence and machine learning for medical imaging: A technology review. Phys. Med. 2021, 83, 242–256. [Google Scholar] [CrossRef] [PubMed]
- Samuel, A.L. Some Studies in Machine Learning Using the Game of Checkers. IBM J. Res. Dev. 1959, 3, 210–229. [Google Scholar] [CrossRef]
- Sedik, A.; Iliyasu, A.M.; Abd El-Rahiem, B.; Abdel Samea, M.E.; Abdel-Raheem, A.; Hammad, M.; Peng, J.; Abd El-Samie, F.E.; Abd El-Latif, A.A. Deploying Machine and Deep Learning Models for Efficient Data-Augmented Detection of COVID-19 Infections. Viruses 2020, 12, 769. [Google Scholar] [CrossRef]
- Alam, N.A.; Ahsan, M.; Based, A.; Haider, J.; Kowalski, M. COVID-19 Detection from Chest X-Ray Images Using Feature Fusion and Deep Learning. Sensors 2021, 21, 1480. [Google Scholar] [CrossRef]
- Xie, E.; Wang, W.; Yu, Z.; Anandkumar, A.; Alvarez, J.M.; Luo, P. SegFormer: Simple and Efficient Design for Semantic Segmentation with Transformers. In Proceedings of the 35th Conference on Neural Information Processing Systems (NeurIPS 2021), Virtual, 6–14 December 2021. [Google Scholar]
- Liu, Z.; Lin, Y.; Cao, Y.; Hu, H.; Wei, Y.; Zhang, Z.; Lin, S.; Guo, B. Swin Transformer: Hierarchical Vision Transformer Using Shifted Windows. In Proceedings of the IEEE/CVF International Conference on Computer Vision, Montreal, QC, Canada, 10–17 October 2021. [Google Scholar]
- Chu, X.; Tian, Z.; Wang, Y.; Zhang, B.; Ren, H.; Wei, X.; Xia, H.; Shen, C. Twins: Revisiting the Design of Spatial Attention in Vision Transformers. In Proceedings of the Thirty-Fifth Conference on Neural Information Processing Systems (NeurIPS 2021), Virtual, 7 December 2021. [Google Scholar]
- Tahir, A.M.; Chowdhury, M.E.; Khandakar, A.; Rahman, T.; Qiblawey, Y.; Khurshid, U.; Kiranyaz, S.; Ibtehaz, N.; Rahman, M.S.; Al-Maadeed, S.; et al. COVID-19 infection localization and severity grading from chest X-ray images. Comput. Biol. Med. 2021, 139, 105002. [Google Scholar] [CrossRef]
- Sakib, S.; Tazrin, T.; Fouda, M.M.; Fadlullah, Z.M.; Guizani, M. DL-CRC: Deep Learning-Based Chest Radiograph Classification for COVID-19 Detection: A Novel Approach. IEEE Access 2020, 8, 171575–171589. [Google Scholar] [CrossRef]
- Sahoo, P.; Saha, S.; Mondal, S.; Gowda, S. Vision Transformer Based COVID-19 Detection Using Chest CT-scan images. In Proceedings of the 2022 IEEE-EMBS International Conference on Biomedical and Health Informatics (BHI), Ioannina, Greece, 27–30 September 2022. [Google Scholar]
- Ronneberger, O.; Fischer, P.; Brox, T. U-Net: Convolutional Networks for Biomedical Image Segmentation. In Medical Image Computing and Computer-Assisted Intervention (MICCAI); Springer: Berlin/Heidelberg, Germany, 2015; Volume 9351, pp. 234–241. [Google Scholar]
- Van der Maaten, L.; Hinton, G. Visualizing Data using t-SNE. J. Mach. Learn. Res. 2008, 9, 2579–2605. [Google Scholar]
- Oliveira, F.H.M.; Machado, A.R.P.; Andrade, A.O. On the Use of t-Distributed Stochastic Neighbor Embedding for Data Visualization and Classification of Individuals with Parkinson’s Disease. Comput. Math. Methods Med. 2018, 2018, 1–17. [Google Scholar] [CrossRef] [PubMed] [Green Version]
- Selvaraju, R.R.; Cogswell, M.; Das, A.; Vedantam, R.; Parikh, D.; Batra, D. Grad-CAM: Visual Explanations from Deep Networks via Gradient-Based Localization. In Proceedings of the 2017 IEEE International Conference on Computer Vision (ICCV), Venice, Italy, 22–29 October 2017. [Google Scholar]
- He, K.; Zhang, X.; Ren, S.; Sun, J. Deep residual learning for image recognition. arXiv 2015, arXiv:1512.03385. [Google Scholar]
- Howard, A.G.; Zhu, M.; Chen, B.; Kalenichenko, D.; Wang, W.; Weyand, T.; Andreetto, M.; Adam, H. MobileNets: Efficient Convolutional Neural Networks for Mobile Vision Applications. arXiv 2017, arXiv:1704.04861. [Google Scholar]
- Tan, M.; Le, Q. EfficientNet: Rethinking Model Scaling for Convolutional Neural Networks. In Proceedings of the 36th International Conference on Machine Learning, PMLR, Long Beach, CA, USA, 9–15 June 2019. [Google Scholar]
- El-Dahshan, E.S.A.; Bassiouni, M.M.; Hagag, A.; Chakrabortty, R.K.; Loh, H.; Acharya, U.R. RESCOVIDTCNnet: A residual neural network-based framework for COVID-19 detection using TCN and EWT with chest X-ray images. Expert Syst. Appl. 2022, 204, 117410. [Google Scholar] [CrossRef]
- Jiang, J.; Lin, S. COVID-19 Detection in Chest X-ray Images Using Swin-Transformer and Transformer in Transformer. arXiv 2021, arXiv:2110.08427. [Google Scholar]
- Laouarem, A.; Kara-Mohamed, C.; Bourenane, E.B.; Hamdi-Cherif, A. A deep learning model for CXR-based COVID-19 detection. In Proceedings of the 2021 International Conference on Engineering and Emerging Technologies (ICEET), Istanbul, Turkey, 27–28 October 2021. [Google Scholar]
- Toğaçar, M.; Ergen, B.; Cömert, Z. COVID-19 detection using deep learning models to exploit Social Mimic Optimization and structured chest X-ray images using fuzzy color and stacking approaches. Comput. Biol. Med. 2020, 121, 103805. [Google Scholar] [CrossRef]
- Salman, F.M.; Abu-Naser, S.S.; Alajrami, E.; Abu-Nasser, B.S.; Alashqar, B.A. COVID-19 Detection using Artificial Intelligence. Int. J. Acad. Eng. Res. 2020, 4, 18–25. [Google Scholar]
- Wang, X.; Deng, X.; Fu, Q.; Zhou, Q.; Feng, J.; Ma, H.; Liu, W.; Zheng, C. A Weakly-Supervised Framework for COVID-19 Classification and Lesion Localization from Chest CT. IEEE Trans. Med. Imaging 2020, 39, 2615–2625. [Google Scholar] [CrossRef] [PubMed]
Figure 1.
Different types of diseases’ radiography perspectives.

Figure 2.
block diagram of the proposed (COVID-19 and Pneumonia) detection system.

Figure 3.
UNet architecture.

Figure 4.
ViT processing of CXR images.

Figure 5.
UNet output segmentation results for three samples from different three classes for lung CXR images. (A) shows the original images. (B) shows the results of UNet. (C) shows the results after ROI extraction. (D) shows the process of labeling the lungs.
Figure 5.
UNet output segmentation results for three samples from different three classes for lung CXR images. (A) shows the original images. (B) shows the results of UNet. (C) shows the results after ROI extraction. (D) shows the process of labeling the lungs.

Figure 6.
Model loss for augmented segmented CXR images.

Figure 7.
Comparison between best results between EfficientNetB7 “CNN” and SegFormer-B5 “ViT” using ROC-AUC. In both cases, the AUC is very close to 1.0.
Figure 7.
Comparison between best results between EfficientNetB7 “CNN” and SegFormer-B5 “ViT” using ROC-AUC. In both cases, the AUC is very close to 1.0.

Figure 8.
t-SNE using segmented and augmented images with the balanced dataset. Three colors of dots represent the samples of three classes.
Figure 8.
t-SNE using segmented and augmented images with the balanced dataset. Three colors of dots represent the samples of three classes.

Figure 9.
Grad-CAM visualization of classified between three classes but we focused on COVID-19 in raw CXR images with augmentation with segmentation cropped images balanced case.
Figure 9.
Grad-CAM visualization of classified between three classes but we focused on COVID-19 in raw CXR images with augmentation with segmentation cropped images balanced case.


Table 1.
Samples in balanced and unbalanced cases.
| Case | COVID-19 | Viral Pneumonia | Normal |
|---|---|---|---|
| Unbalanced | 3616 | 7357 | 10,192 |
| Balanced | 3616 | 3616 | 3616 |
Table 2.
CNN models’ general information. ‘M’ stands for million.
| Information | ResNet-50 | MobileNet | EfficientNetB7 |
|---|---|---|---|
| Input size | 224 × 224 | 224 × 224 | 224 × 224 |
| Parameters | 60.4 M | 4.3 M | 66.7 M |
| Year published | 2015 | 2017 | 2019 |
| Size (MB) | 232 | 16 | 256 |
| Depth | 311 | 55 | 438 |
| Layers number | 150 | 28 | 813 |
Table 3.
ViT models’ general information.
| Information | Twins [35] | Swin [34] | Segformer [33] |
|---|---|---|---|
| Input size | 800 × 800 | 800 × 800 | 512 × 512 |
| Year published | Aug-2021 | Sep-2021 | Oct-2021 |
| Input Channel | Any | 3-RBG | Any |
| Patch Size | Based on Function | 4 × 4 | 7 × 7 |
| Block Name | LSA and GSA blocks | Swin Transformer block | Transformer block |
| Number of Block | 4 | 4 | 4 |
| Windows | Shifted local | Non-overlapping | Multi-size |
Table 4.
UNet information used in the experiments.
| # | Information | Values/Method |
|---|---|---|
| 1 | Training images | 400 |
| 2 | Testing Images | 18,479 |
| 3 | Input Image size | 512 × 512 |
| 4 | Optimizer | Adam |
| 5 | Training time | 05:13:15 |
| 6 | Learning rate | 0.001 |
| 7 | Epochs | 5 |
| 8 | Epochs per step | 400 |
| 9 | Testing time | 02:18:12 |
| 10 | Training accuracy | 96.17% |
| 11 | Loss | 0.1245 |
| 12 | Total params | 30,789,145 |
| 13 | Trainable params | 30,777,522 |
| 14 | Non-trainable params | 11,623 |
Table 5.
Experiment information.
| # | Information | Detail | Notes |
|---|---|---|---|
| 1 | Number of images | 21,165 | 3 Classes |
| 2 | Number of cropped images | 21,165 | After applying ROI |
| 3 | Augmentation | Rotation | 9 different angles |
| 4 | Normalized | Yes | (Dataset)/255 |
| 5 | Dropout | Yes | 0.25 |
| 6 | Number of Epochs | 300 | 300 iterations. |
| 7 | Optimizer | Adam | |
| 8 | Learning Rate | 0.0001 | |
| 9 | COVID-19 | 3616 | |
| 10 | Pneumonia | 7357 | |
| 11 | Healthy | 10,192 | |
| 12 | Unbalanced Case | Total Images | 21,165 |
| 13 | 80% Training | 16,932 | |
| 14 | 20% Testing | 4233 | |
| 15 | COVID-19 | 3616 | |
| 16 | Pneumonia | 3616 | |
| 17 | Balanced Case | Healthy | 3616 |
| 18 | Total Images | 10,848 | |
| 19 | 80% Training | 8679 | |
| 20 | 20% Testing | 2169, Each class 723 | |
| 21 | Data Shuffle | True | activate |
Table 6.
Comparative results of CNN and ViT models for COVID-19 detection in the original dataset (no segmentation) with no augmentation.
Table 6.
Comparative results of CNN and ViT models for COVID-19 detection in the original dataset (no segmentation) with no augmentation.
| Schema | Case | Models | Average (%) | |||||
|---|---|---|---|---|---|---|---|---|
| Accuracy | Recall | Precision | F1-Score | Specificity | Kappa Value | |||
| Without Segmentation Without Augmentation | Unbalanced CNN | ResNet50 | 78.87 | 84.61 | 78.57 | 81.48 | 71.87 | 56.96 |
| MobileNet | 81.10 | 85.94 | 78.57 | 82.09 | 76.19 | 62.17 | ||
| EfficientNetB | 87.00 | 92.80 | 82.85 | 87.54 | 81.39 | 74.10 | ||
| Unbalanced ViT | Swin | 64.56 | 72.22 | 56.52 | 63.41 | 58.89 | 30.03 | |
| Twins | 78.73 | 82.09 | 78.57 | 80.29 | 75.00 | 57.00 | ||
| SegFormer | 86.53 | 90.62 | 83.93 | 87.15 | 82.38 | 73.05 | ||
| Balanced CNN | ResNet50 | 82.98 | 89.02 | 89.07 | 89.05 | 61.98 | 50.96 | |
| MobileNet | 85.38 | 90.00 | 91.07 | 90.53 | 69.32 | 58.47 | ||
| EfficientNetB | 93.13 | 96.87 | 93.82 | 95.33 | 83.33 | 82.37 | ||
| Balanced ViT | Swin | 84.55 | 89.02 | 90.90 | 89.95 | 69.00 | 56.57 | |
| Twins | 87.13 | 94.96 | 88.16 | 91.44 | 66.67 | 65.72 | ||
| SegFormer | 94.51 | 97.50 | 95.00 | 9623 | 86.89 | 86.15 | ||
Table 7.
Comparative results of CNN and ViT models for COVID-19 detection in the segmented images with augmentation.
Table 7.
Comparative results of CNN and ViT models for COVID-19 detection in the segmented images with augmentation.
| Schema | Case | Models | Average (%) | |||||
|---|---|---|---|---|---|---|---|---|
| Accuracy | Recall | Precision | F1-Score | Specificity | Kappa Value | |||
| With Segmentation With Augmentation | Unbalanced CNN | ResNet50 | 92.91 | 95.65 | 91.66 | 93.62 | 89.65 | 85.66 |
| MobileNet | 95.27 | 95.04 | 96.64 | 95.83 | 95.59 | 90.38 | ||
| EfficientNetB | 98.11 | 99.19 | 97.61 | 98.40 | 96.60 | 96.10 | ||
| Unbalanced ViT | Swin | 92.60 | 95.62 | 91.04 | 93.28 | 88.96 | 84.99 | |
| Twins | 95.98 | 96.28 | 96.68 | 96.48 | 95.59 | 91.80 | ||
| SegFormer | 97.64 | 99.12 | 96.82 | 97.97 | 95.51 | 95.13 | ||
| Balanced CNN | ResNet50 | 98.94 | 98.90 | 97.95 | 98.42 | 98.96 | 97.63 | |
| MobileNet | 99.20 | 99.20 | 98.34 | 98.75 | 99.17 | 98.13 | ||
| EfficientNetB | 99.82 | 99.72 | 99.72 | 99.72 | 99.86 | 99.59 | ||
| Balanced ViT | Swin | 98.20 | 97.43 | 97.30 | 97.36 | 98.60 | 96.00 | |
| Twins | 99.63 | 99.72 | 99.17 | 99.45 | 99.59 | 99.17 | ||
| SegFormer | 99.81 | 99.86 | 99.58 | 99.72 | 99.79 | 99.58 | ||
Table 8.
Comparison with state-of-the-art models.
| Work | Year | Image Number | Dataset | Method | Results |
|---|---|---|---|---|---|
| Mesut, et al. [49] | 2020 | 458: Three classes. | University of Montreal and Joseph Paul Cohen dataset accessible publicly. CXR | (CNNs): MobileNetV2 | Overall Accuracy 99.27%. |
| Fatima, et al. [50] | 2020 | 260: Two classes. | University of Montreal and Kaggle repository accessible publicly. CXR | (CNNs): VGG16 ResNet50 InceptionV3 | Accuracy, Sensitivity 100% |
| Sadman et al. [37] | 2020 | 33,231: Three classes. | GitHub for COVID-19 X-rays, Stanford ML group, accessible publicly. CXR and CT. | (CNNs): proposed DL-CRC InceptionV3 ResNet DenseNet | Accuracy 98.83% |
| Xinggang, et al. [51] | 2020 | Two classes. | CT | (CNNs): DeCoVNet | Accuracy 90.80% |
| Luca, et al. [9] | 2020 | 6523: Three classes. | COVID-19 image data collection, National Institutes of Health Chest X-Ray. CXR accessible publicly | (CNNs): proposed model | Accuracy 98% |
| Micheal, et al. [11] | 2020 | 5840 CXR | From multiple resources. | (CNNs): VGG16 VGG19 ResNet Xception InceptionV3 | positive predictive value of 99% |
| Shashank, et al. [14] | 2020 | 364 CXR | collected from a collection of recently published papers accessible publicly. CXR | (CNNs): Modified VGG-19 | Accuracy 96.3% |
| Ahmed Sedik, et al. [31] | 2020 | Limited number of CXR and CT with rotation | Publicly available datasets. CXR, CT. | (CNNs): proposed model | Accuracy 99% |
| Alam et al. [32] | 2021 | 21165CXR: Three classes. | large X-ray dataset (COVQU) accessible publicly. | (CNNs): Resnet18 Resnet50 ResNet101 DenseNet201 Inceptionresnet V3 | Accuracy 96.29% |
| Jiang, J et al. [47] | 2021 | 21165CXR: Three classes. | large X-ray dataset (COVQU) accessible publicly. | (ViT): Swin | Accuracy 94.48% |
| El-Dahshan et al. [46] | 2021 | 21165CXR: Three classes. | large X-ray dataset (COVQU) accessible publicly. | (CNNs): ResNet with TCN and EWT | Precision 0.984 |
| Laouarem, A, et al. [48] | 2022 | 21165CXR: Three classes. | large X-ray dataset (COVQU) accessible publicly. | (CNNs): Proposed Model | Accuracy 97% |
| This Study | 2021 | 21165CXR: Three classes. | large X-ray dataset (COVQU) accessible publicly. | CNNs 98.94%, 99.20%, 99.82% ViT 98.20% 99.63% 99.81% |
Disclaimer/Publisher’s Note: The statements, opinions and data contained in all publications are solely those of the individual author(s) and contributor(s) and not of MDPI and/or the editor(s). MDPI and/or the editor(s) disclaim responsibility for any injury to people or property resulting from any ideas, methods, instructions or products referred to in the content. |
© 2023 by the authors. Licensee MDPI, Basel, Switzerland. This article is an open access article distributed under the terms and conditions of the Creative Commons Attribution (CC BY) license (https://creativecommons.org/licenses/by/4.0/).
Share and Cite
MDPI and ACS Style
Nafisah, S.I.; Muhammad, G.; Hossain, M.S.; AlQahtani, S.A. A Comparative Evaluation between Convolutional Neural Networks and Vision Transformers for COVID-19 Detection. Mathematics 2023, 11, 1489. https://doi.org/10.3390/math11061489
AMA Style
Nafisah SI, Muhammad G, Hossain MS, AlQahtani SA. A Comparative Evaluation between Convolutional Neural Networks and Vision Transformers for COVID-19 Detection. Mathematics. 2023; 11(6):1489. https://doi.org/10.3390/math11061489
Chicago/Turabian StyleNafisah, Saad I., Ghulam Muhammad, M. Shamim Hossain, and Salman A. AlQahtani. 2023. "A Comparative Evaluation between Convolutional Neural Networks and Vision Transformers for COVID-19 Detection" Mathematics 11, no. 6: 1489. https://doi.org/10.3390/math11061489
Note that from the first issue of 2016, this journal uses article numbers instead of page numbers. See further details here.