

Correlates of Changes in Physical Activity and Sedentary Behaviors during the COVID-19 Lockdown in France: The NutriNet-Santé Cohort Study
 , , , , , , , , , , and
Abstract
:1. Introduction
2. Materials and Methods
2.1. Study Population: The NutriNet-Santé Cohort
2.2. Data Collection during the COVID-19 Lockdown
2.2.1. Physical Activity and Sedentary Behaviors
2.2.2. Covariates
2.3. Statistical Analyses
3. Results
3.1. Perceived Changes in Physical Activity and Sedentary Behavior
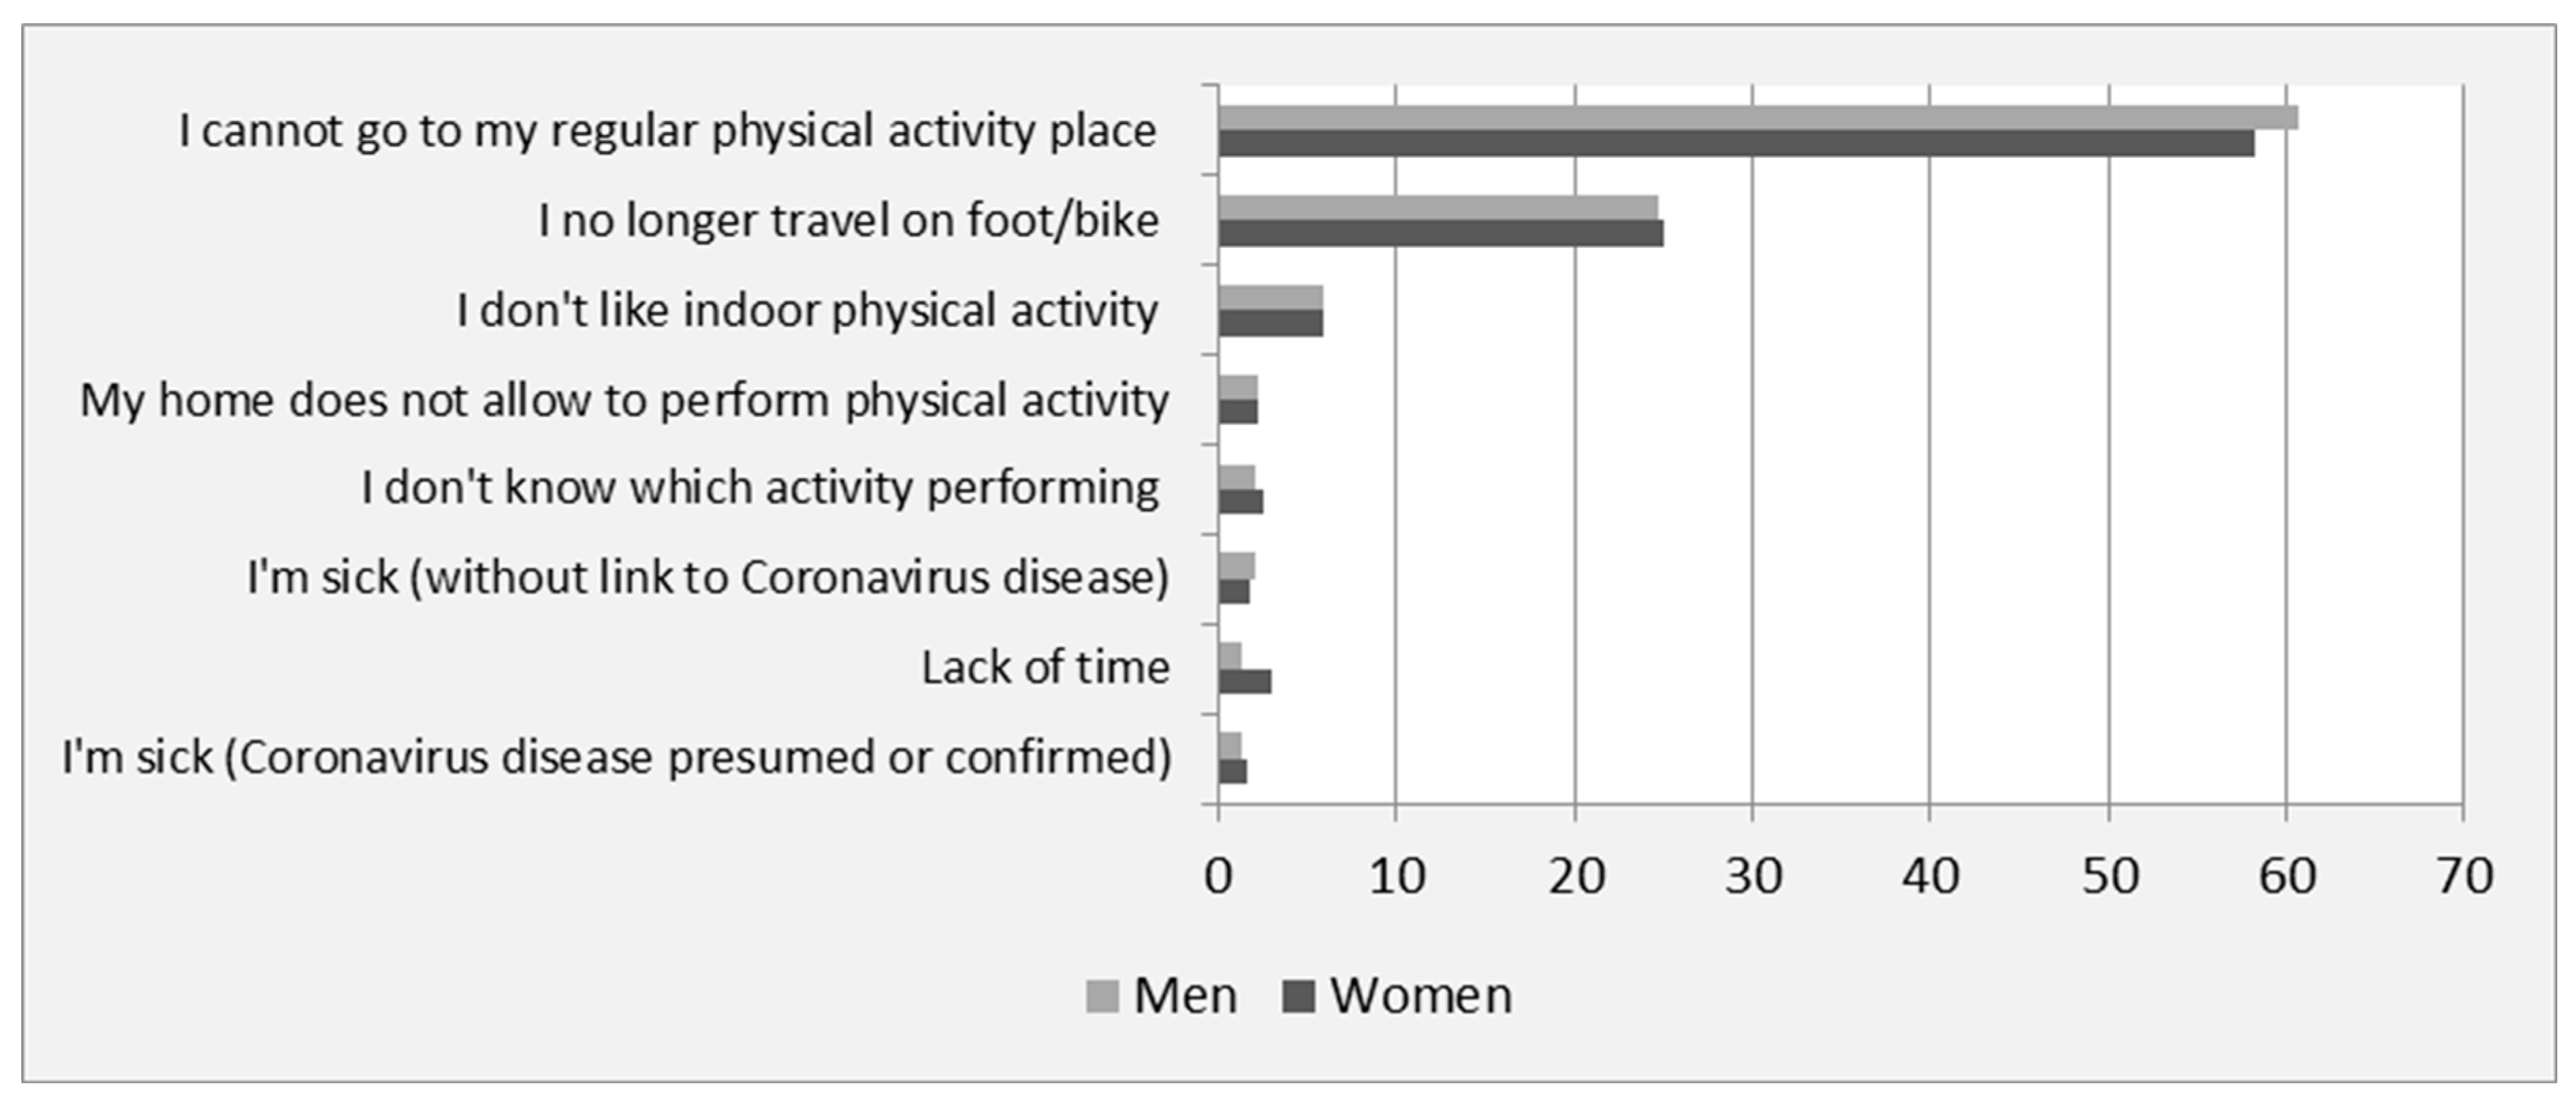
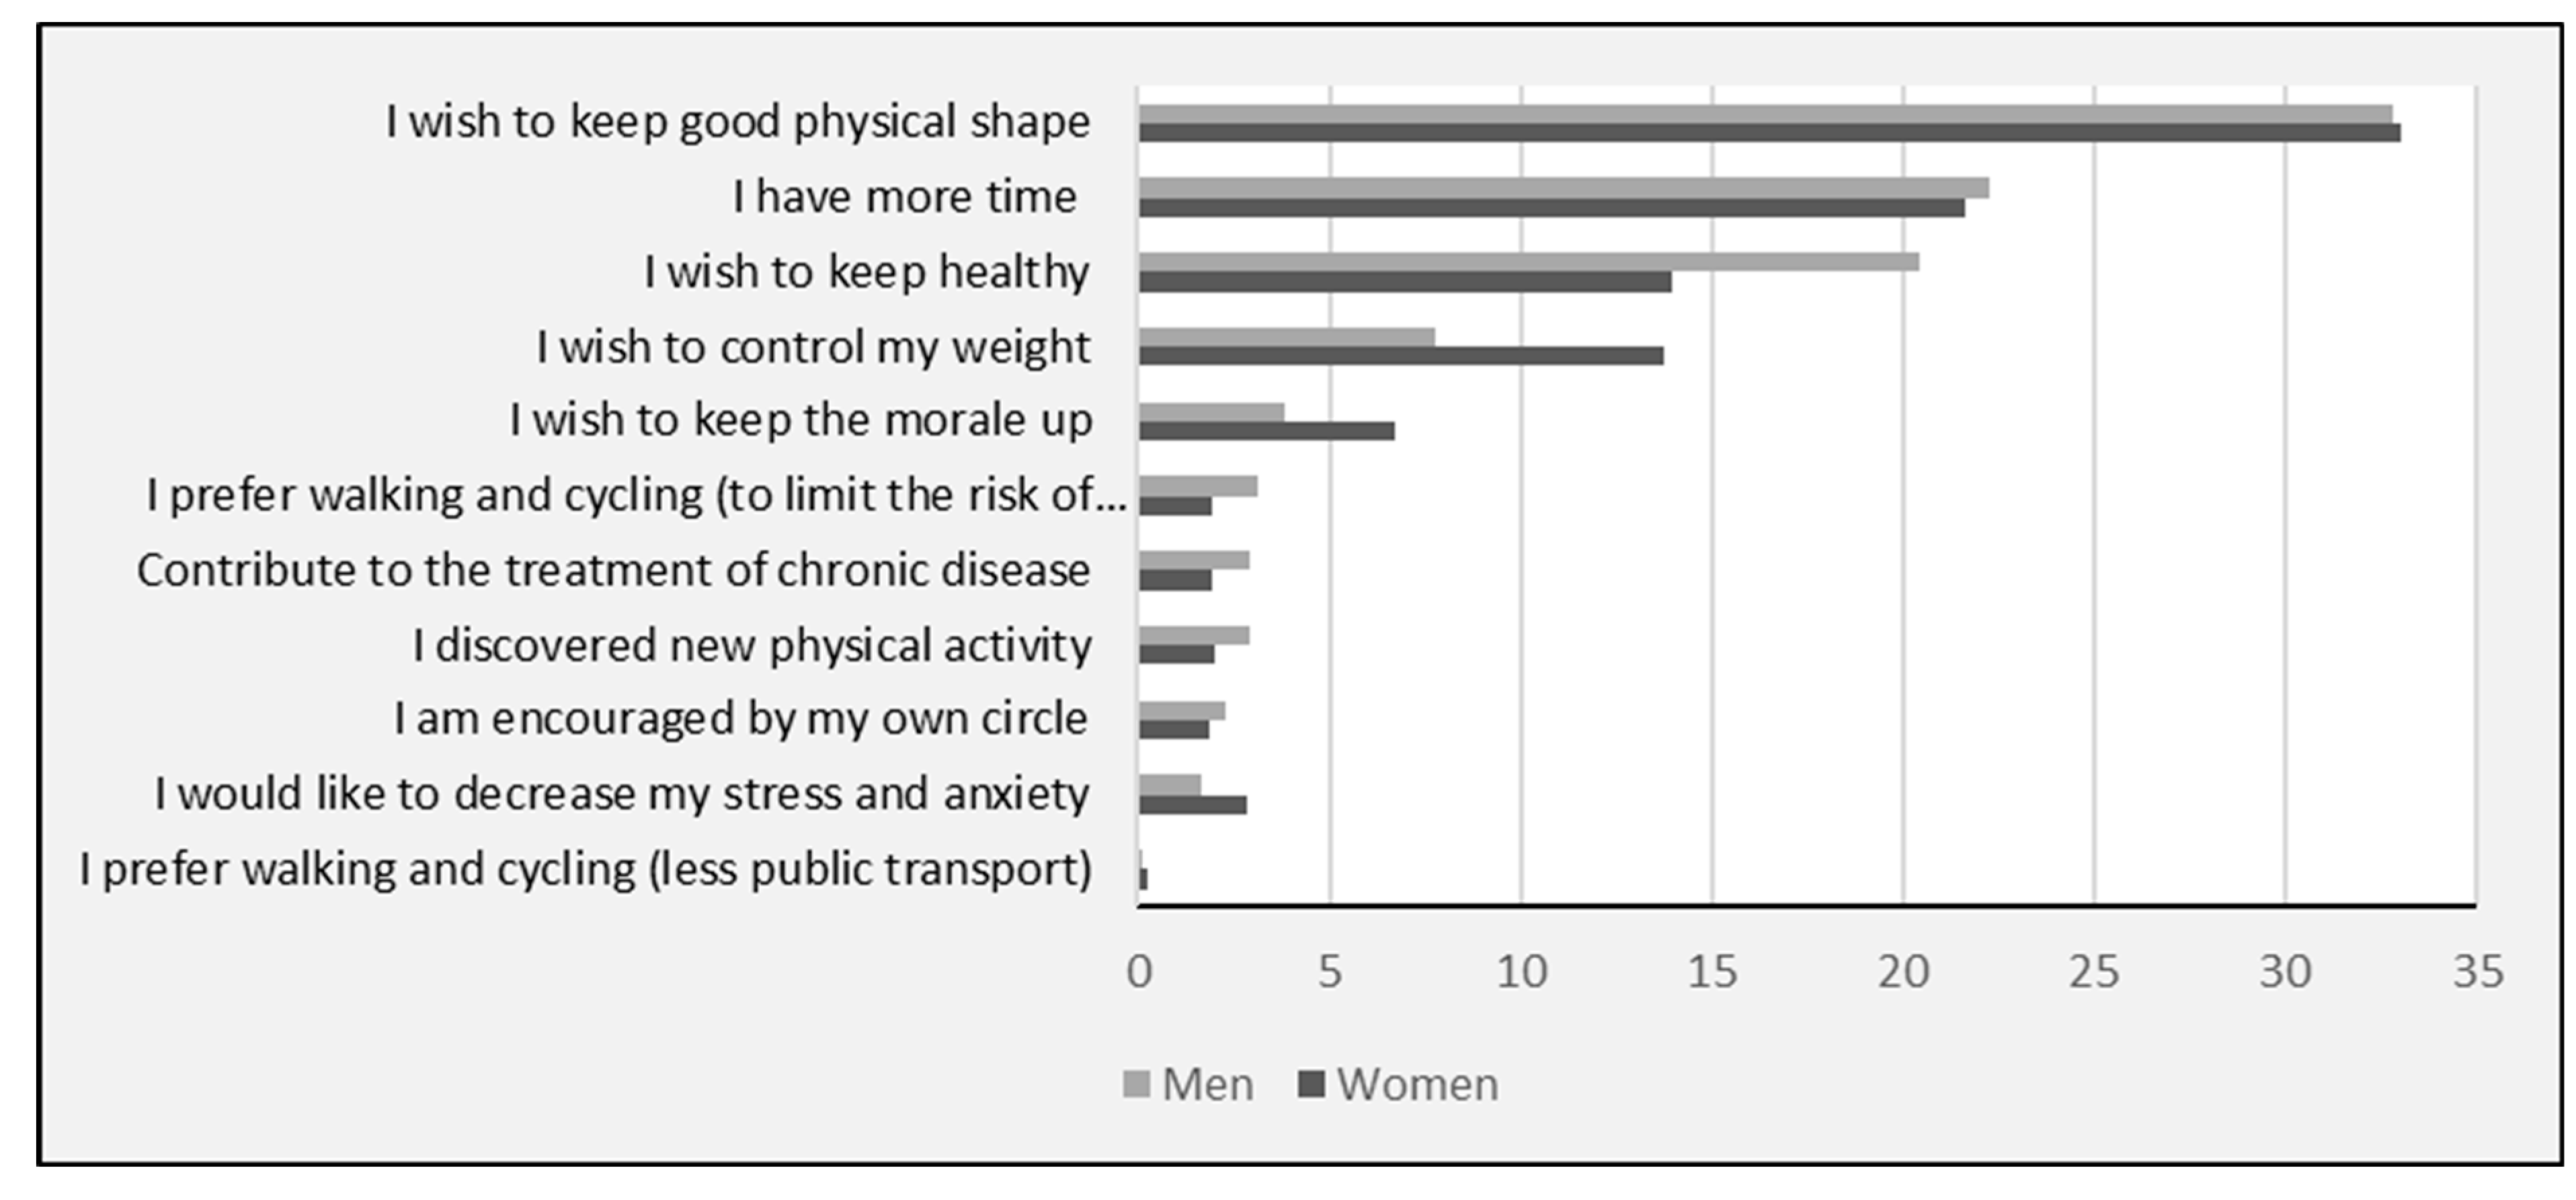
3.2. Main Reasons for Change in Physical Activity
3.3. Changes in Different Types of Physical Activity
3.4. Characteristics of Participants According to Physical Activity Changes
4. Discussion
5. Strengths and Limitations
6. Conclusions
Supplementary Materials
Author Contributions
Funding
Institutional Review Board Statement
Informed Consent Statement
Data Availability Statement
Acknowledgments
Conflicts of Interest
Abbreviations
| ANCOVA | ANalysis of COVAriance |
| BMI | Body Mass Index |
| CNIL | Commission Nationale de l’Informatique et des Libertés |
| GAD-7 | Generalized Anxiety Disorder–7 scale |
| IPAQ | International Physical Activity Questionnaire |
| COVID-19 | Coronavirus disease 2019 |
| PA | Physical Activity |
| PHQ-9 | Patient Health Questionnaire–9 scale |
| SARS-CoV-2 | Severe Acute Respiratory Syndrome CoronaVirus 2 |
References
- Coronavirus Disease (COVID-19)—World Health Organization. Available online: https://www.who.int/emergencies/diseases/novel-coronavirus-2019 (accessed on 8 February 2022).
- Lee, I.-M.; Shiroma, E.J.; Lobelo, F.; Puska, P.; Blair, S.N.; Katzmarzyk, P.T. Effect of Physical Inactivity on Major Non-Communicable Diseases Worldwide: An Analysis of Burden of Disease and Life Expectancy. Lancet 2012, 380, 219–229. [Google Scholar] [CrossRef]
- Stockwell, S.; Trott, M.; Tully, M.; Shin, J.; Barnett, Y.; Butler, L.; McDermott, D.; Schuch, F.; Smith, L. Changes in Physical Activity and Sedentary Behaviours from before to during the COVID-19 Pandemic Lockdown: A Systematic Review. BMJ Open Sport Exerc. Med. 2021, 7, e000960. [Google Scholar] [CrossRef] [PubMed]
- Escalon, H.; Deschamps, V.; Verdot, C. Activité Physique et Sédentarité Des Adultes Pendant La Période de Confinement Lié à l’épidémie de COVID-19: État Des Lieux et Évolutions Perçues (CoviPrev, 2020). Bull. Epidémiol. Hebd. 2021, Cov3, 2–13. [Google Scholar]
- Deschasaux-Tanguy, M.; Druesne-Pecollo, N.; Esseddik, Y.; Szabo de Edelenyi, F.; Alles, B.; Andreeva, V.A.; Baudry, J.; Charreire, H.; Deschamps, V.; Egnell, M.; et al. Diet and Physical Activity during the COVID-19 Lockdown Period (March-May 2020): Results from the French NutriNet-Sante Cohort Study. Am. J. Clin. Nutr. 2021, 113, 924–938. [Google Scholar] [CrossRef]
- Strain, T.; Sharp, S.J.; Spiers, A.; Price, H.; Williams, C.; Fraser, C.; Brage, S.; Wijndaele, K.; Kelly, P. Population Level Physical Activity before and during the First National COVID-19 Lockdown: A Nationally Representative Repeat Cross-Sectional Study of 5 Years of Active Lives Data in England. Lancet Reg. Health Eur. 2022, 12. [Google Scholar] [CrossRef]
- Wunsch, K.; Kienberger, K.; Niessner, C. Changes in Physical Activity Patterns Due to the COVID-19 Pandemic: A Systematic Review and Meta-Analysis. Int. J. Environ. Res. Public Health 2022, 19, 2250. [Google Scholar] [CrossRef] [PubMed]
- Tremblay, M.S.; Aubert, S.; Barnes, J.D.; Saunders, T.J.; Carson, V.; Latimer-Cheung, A.E.; Chastin, S.F.M.; Altenburg, T.M.; Chinapaw, M.J.M. SBRN Terminology Consensus Project Participants Sedentary Behavior Research Network (SBRN)—Terminology Consensus Project Process and Outcome. Int. J. Behav. Nutr. Phys. Act. 2017, 14, 75. [Google Scholar] [CrossRef]
- Verdot, C.; Salanave, B.; Deschamps, V. Activité Physique et Sédentarité Dans La Population Française. Situation En 2014–2016 et Évolution Depuis 2006–2007. Bull. Epidémiol. Hebd. 2020, 15, 296–304. [Google Scholar]
- Genin, P.M.; Lambert, C.; Larras, B.; Pereira, B.; Toussaint, J.-F.; Baker, J.S.; Tremblay, A.; Thivel, D.; Duclos, M. How Did the COVID-19 Confinement Period Affect Our Physical Activity Level and Sedentary Behaviors? Methodology and First Results From the French National ONAPS Survey. J. Phys. Act. Health 2021, 18, 296–303. [Google Scholar] [CrossRef]
- Constant, A.; Conserve, D.F.; Gallopel-Morvan, K.; Raude, J. Socio-Cognitive Factors Associated With Lifestyle Changes in Response to the COVID-19 Epidemic in the General Population: Results From a Cross-Sectional Study in France. Front. Psychol. 2020, 11, 579460. [Google Scholar] [CrossRef]
- Constandt, B.; Thibaut, E.; De Bosscher, V.; Scheerder, J.; Ricour, M.; Willem, A. Exercising in Times of Lockdown: An Analysis of the Impact of COVID-19 on Levels and Patterns of Exercise among Adults in Belgium. Int. J. Environ. Res. Public Health 2020, 17, 4144. [Google Scholar] [CrossRef] [PubMed]
- Woodruff, S.J.; Coyne, P.; St-Pierre, E. Stress, Physical Activity, and Screen-related Sedentary Behaviour within the First Month of the COVID-19 Pandemic. Appl. Psychol. Health Well-Being 2021, 13, 454–468. [Google Scholar] [CrossRef] [PubMed]
- Farah, B.Q.; do Prado, W.L.; Malik, N.; Lofrano-Prado, M.C.; de Melo, P.H.; Botero, J.P.; Cucato, G.G.; de Almeida Correia, M.; Ritti-Dias, R.M. Barriers to Physical Activity during the COVID-19 Pandemic in Adults: A Cross-Sectional Study. Sport Sci. Health 2021, 17, 441–447. [Google Scholar] [CrossRef]
- Hercberg, S.; Castetbon, K.; Czernichow, S.; Malon, A.; Mejean, C.; Kesse, E.; Touvier, M.; Galan, P. The Nutrinet-Santé Study: A Web-Based Prospective Study on the Relationship between Nutrition and Health and Determinants of Dietary Patterns and Nutritional Status. BMC Public Health 2010, 10, 1–6. [Google Scholar] [CrossRef] [PubMed]
- Vergnaud, A.-C.; Touvier, M.; Méjean, C.; Kesse-Guyot, E.; Pollet, C.; Malon, A.; Castetbon, K.; Hercberg, S. Agreement between Web-Based and Paper Versions of a Socio-Demographic Questionnaire in the NutriNet-Santé Study. Int. J. Public Health 2011, 56, 407–417. [Google Scholar] [CrossRef]
- for the SAPRIS study group; Carrat, F.; Touvier, M.; Severi, G.; Meyer, L.; Jusot, F.; Lapidus, N.; Rahib, D.; Lydié, N.; Charles, M.-A.; et al. Incidence and Risk Factors of COVID-19-like Symptoms in the French General Population during the Lockdown Period: A Multi-Cohort Study. BMC Infect. Dis. 2021, 21, 169. [Google Scholar] [CrossRef]
- Kroenke, K.; Spitzer, R.L.; Williams, J.B.W. The PHQ-9: Validity of a Brief Depression Severity Measure. J. Gen. Intern. Med. 2001, 16, 606–613. [Google Scholar] [CrossRef]
- Spitzer, R.L.; Kroenke, K.; Williams, J.B.W.; Löwe, B. A Brief Measure for Assessing Generalized Anxiety Disorder: The GAD-7. Arch. Intern. Med. 2006, 166, 1092. [Google Scholar] [CrossRef]
- Bu, F.; Bone, J.K.; Mitchell, J.J.; Steptoe, A.; Fancourt, D. Longitudinal Changes in Physical Activity during and after the First National Lockdown Due to the COVID-19 Pandemic in England. Sci. Rep. 2021, 11, 17723. [Google Scholar] [CrossRef]
- Lesser, I.A.; Nienhuis, C.P. The Impact of COVID-19 on Physical Activity Behavior and Well-Being of Canadians. Int. J. Environ. Res. Public Health 2020, 17, 3899. [Google Scholar] [CrossRef]
- Meyer, J.; McDowell, C.; Lansing, J.; Brower, C.; Smith, L.; Tully, M.; Herring, M. Changes in Physical Activity and Sedentary Behavior in Response to COVID-19 and Their Associations with Mental Health in 3052 US Adults. Int. J. Environ. Res. Public Health 2020, 17, 6469. [Google Scholar] [CrossRef]
- Knell, G.; Robertson, M.C.; Dooley, E.E.; Burford, K.; Mendez, K.S. Health Behavior Changes During COVID-19 Pandemic and Subsequent “Stay-at-Home” Orders. Int. J. Environ. Res. Public Health 2020, 17, 6268. [Google Scholar] [CrossRef] [PubMed]
- Ong, J.L.; Lau, T.; Massar, S.A.A.; Chong, Z.T.; Ng, B.K.L.; Koek, D.; Zhao, W.; Yeo, B.T.T.; Cheong, K.; Chee, M.W.L. COVID-19-Related Mobility Reduction: Heterogenous Effects on Sleep and Physical Activity Rhythms. Sleep 2021, 44, zsaa179. [Google Scholar] [CrossRef] [PubMed]
- Ding, D.; Cheng, M.; del Pozo Cruz, B.; Lin, T.; Sun, S.; Zhang, L.; Yang, Q.; Ma, Z.; Wang, J.; Jia, Y.; et al. How COVID-19 Lockdown and Reopening Affected Daily Steps: Evidence Based on 164,630 Person-Days of Prospectively Collected Data from Shanghai, China. Int. J. Behav. Nutr. Phys. Act. 2021, 18, 40. [Google Scholar] [CrossRef]
- McCarthy, H.; Potts, H.W.W.; Fisher, A. Physical Activity Behavior Before, During, and After COVID-19 Restrictions: Longitudinal Smartphone-Tracking Study of Adults in the United Kingdom. J. Med. Int. Res. 2021, 23, e23701. [Google Scholar] [CrossRef] [PubMed]
- Beck, A.M.; Gilbert, A.S.; Duncan, D.D.; Wiedenman, E.M. A Cross-Sectional Comparison of Physical Activity during COVID-19 in a Sample of Rural and Non-Rural Participants in the US. Int. J. Environ. Res. Public Health 2021, 18, 4991. [Google Scholar] [CrossRef]
- García-Tascón, M.; Sahelices-Pinto, C.; Mendaña-Cuervo, C.; Magaz-González, A.M. The Impact of the COVID-19 Confinement on the Habits of PA Practice According to Gender (Male/Female): Spanish Case. Int. J. Environ. Res. Public Health 2020, 17, 6961. [Google Scholar] [CrossRef]
- Orlandi, M.; Rosselli, M.; Pellegrino, A.; Boddi, M.; Stefani, L.; Toncelli, L.; Modesti, P.A. Gender Differences in the Impact on Physical Activity and Lifestyle in Italy during the Lockdown, Due to the COVID-19 Pandemic. Nutr. Metab. Cardiovasc. Dis. 2021, 31, 2173–2180. [Google Scholar] [CrossRef]
- Frontini, R.; Rebelo-Gonçalves, R.; Amaro, N.; Salvador, R.; Matos, R.; Morouço, P.; Antunes, R. The Relationship Between Anxiety Levels, Sleep, and Physical Activity During COVID-19 Lockdown: An Exploratory Study. Front. Psychol. 2021, 12, 659599. [Google Scholar] [CrossRef]
- Jacques-Aviñó, C.; López-Jiménez, T.; Medina-Perucha, L.; de Bont, J.; Gonçalves, A.Q.; Duarte-Salles, T.; Berenguera, A. Gender-Based Approach on the Social Impact and Mental Health in Spain during COVID-19 Lockdown: A Cross-Sectional Study. BMJ Open 2020, 10, e044617. [Google Scholar] [CrossRef]
- Karageorghis, C.I.; Bird, J.M.; Hutchinson, J.C.; Hamer, M.; Delevoye-Turrell, Y.N.; Guérin, S.M.R.; Mullin, E.M.; Mellano, K.T.; Parsons-Smith, R.L.; Terry, V.R.; et al. Physical Activity and Mental Well-Being under COVID-19 Lockdown: A Cross-Sectional Multination Study. BMC Public Health 2021, 21, 988. [Google Scholar] [CrossRef] [PubMed]
- Mækelæ, M.J.; Reggev, N.; Dutra, N.; Tamayo, R.M.; Silva-Sobrinho, R.A.; Klevjer, K.; Pfuhl, G. Perceived Efficacy of COVID-19 Restrictions, Reactions and Their Impact on Mental Health during the Early Phase of the Outbreak in Six Countries. R. Soc. Open Sci. 2020, 7, 200644. [Google Scholar] [CrossRef] [PubMed]
- Salfi, F.; Lauriola, M.; Amicucci, G.; Corigliano, D.; Viselli, L.; Tempesta, D.; Ferrara, M. Gender-Related Time Course of Sleep Disturbances and Psychological Symptoms during the COVID-19 Lockdown: A Longitudinal Study on the Italian Population. Neurobiol. Stress 2020, 13, 100259. [Google Scholar] [CrossRef] [PubMed]
- Werneck, A.O.; Silva, D.R.; Malta, D.C.; Souza-Júnior, P.R.B.; Azevedo, L.O.; Barros, M.B.A.; Szwarcwald, C.L. Physical Inactivity and Elevated TV-Viewing Reported Changes during the COVID-19 Pandemic Are Associated with Mental Health: A Survey with 43,995 Brazilian Adults. J. Psychosom. Res. 2021, 140, 110292. [Google Scholar] [CrossRef] [PubMed]
- Maugeri, G.; Castrogiovanni, P.; Battaglia, G.; Pippi, R.; D’Agata, V.; Palma, A.; Di Rosa, M.; Musumeci, G. The Impact of Physical Activity on Psychological Health during COVID-19 Pandemic in Italy. Heliyon 2020, 6, e04315. [Google Scholar] [CrossRef]
- Wenham, C.; Smith, J.; Morgan, R. COVID-19: The Gendered Impacts of the Outbreak. Lancet 2020, 395, 846–848. [Google Scholar] [CrossRef]
- Michelini, E.; Bortoletto, N.; Porrovecchio, A. Outdoor Physical Activity During the First Wave of the COVID-19 Pandemic. A Comparative Analysis of Government Restrictions in Italy, France, and Germany. Front. Public Health 2021, 9, 615745. [Google Scholar] [CrossRef]


| Women (n = 17,364, 73.7%) | Men (n = 6194, 26.3%) | |||
|---|---|---|---|---|
| n | % | n | % | |
| Age (years) | ||||
| 18–35 | 1661 | 9.6 | 274 | 4.4 |
| 36–50 | 4063 | 23.4 | 921 | 14.9 |
| 51–65 | 6506 | 37.5 | 1849 | 29.9 |
| >65 | 5134 | 29.6 | 3150 | 50.9 |
| Educational level | ||||
| <High-school degree | 2479 | 14.3 | 1346 | 21.7 |
| High-school degree | 2268 | 13.1 | 684 | 11.0 |
| Undergraduate degree | 5746 | 33.1 | 1608 | 26.0 |
| Graduate degree | 6701 | 38.6 | 2504 | 40.4 |
| Unknown | 170 | 1.0 | 52 | 0.8 |
| Monthly income (€ per household) | ||||
| <1430 | 1059 | 6.1 | 211 | 3.4 |
| 1430–2700 | 4047 | 23.3 | 1173 | 18.9 |
| 2700–4800 | 6255 | 36.0 | 2745 | 44.3 |
| ≥4800 | 3165 | 18.2 | 1471 | 23.7 |
| Unknown | 498 | 2.9 | 73 | 1.2 |
| Did not wish to answer | 2340 | 13.5 | 521 | 8.4 |
| Reside with partner during the lockdown | ||||
| Yes | 11,908 | 68.6 | 4882 | 78.8 |
| No | 1431 | 8.2 | 238 | 3.8 |
| No partner | 4025 | 23.2 | 1074 | 17.3 |
| Children or grandchildren at home during the lockdown [yes] | 3744 | 21.6 | 917 | 14.8 |
| Professional activity changes during lockdown | ||||
| No professional activity (unemployed, retired, homemaker, maternity leave) or no professional activity during the last seven days (short-term leave). | 10,764 | 62.0 | 4422 | 71.4 |
| No change | 1807 | 10.4 | 442 | 7.1 |
| Yes, change (working from home, new job) | 4410 | 25.4 | 1262 | 20.4 |
| Other | 383 | 2.2 | 68 | 1.1 |
| Essential providers or workers during lockdown | ||||
| Yes | 2565 | 14.8 | 517 | 8.3 |
| No | 14,040 | 80.9 | 5498 | 88.8 |
| Don’t know | 759 | 4.4 | 179 | 2.9 |
| Residential area during the lockdown (number of inhabitants) | ||||
| Urban area >100,000 | 3449 | 19.9 | 1176 | 19.0 |
| Urban area 20,000 to 100,000 | 3969 | 22.9 | 1330 | 21.5 |
| Urban area <20,000 | 4011 | 23.1 | 1527 | 24.7 |
| Rural area | 5935 | 34.2 | 2161 | 34.9 |
| Smoking status | ||||
| Never smoker | 16,210 | 93.4 | 5830 | 94.1 |
| Occasional smoker | 289 | 1.7 | 103 | 1.7 |
| Current smoker | 865 | 5.0 | 261 | 4.2 |
| Current weight status | ||||
| Overweight | 5424 | 31.2 | 2806 | 45.3 |
| Non-overweight | 11,840 | 68.2 | 3359 | 54.2 |
| Unknown | 100 | 0.6 | 29 | 0.5 |
| Chronic disease | ||||
| Yes | 6152 | 35.4 | 2779 | 44.9 |
| No | 11,078 | 63.8 | 3366 | 54.3 |
| Don’t know | 134 | 0.8 | 49 | 0.8 |
| PHQ-9 (depressive symptoms) | ||||
| Mild | 3872 | 22.3 | 774 | 12.5 |
| Minimal | 11,884 | 68.4 | 5179 | 83.6 |
| Moderate | 1064 | 6.1 | 156 | 2.5 |
| Moderately severe to severe | 544 | 3.1 | 85 | 1.4 |
| GAD-7 (anxiety disorders) | ||||
| Mild | 3502 | 20.2 | 697 | 11.3 |
| Minimal | 12,383 | 71.3 | 5284 | 85.3 |
| Moderate | 949 | 5.5 | 141 | 2.3 |
| Severe | 530 | 3.1 | 72 | 1.2 |
| T1 | T2 | |||||||
|---|---|---|---|---|---|---|---|---|
| Women | Men | Women | Men | |||||
| (n = 17,364) | (n = 6194) | (n = 17,364) | (n = 6194) | |||||
| n | % | n | % | n | % | n | % | |
| Physical activity | ||||||||
| Increased | 3436 | 19.8 | 867 | 14.0 | 4036 | 23.2 | 1134 | 18.3 |
| Decreased | 10,077 | 58.0 | 3413 | 55.1 | 9794 | 56.4 | 3255 | 52.6 |
| Unchanged | 3851 | 22.2 | 1914 | 30.9 | 3326 | 19.2 | 1770 | 28.6 |
| Don’t know | 208 | 1.2 | 35 | 0.6 | ||||
| Sitting time | ||||||||
| Increased | 11,485 | 66.1 | 3755 | 60.6 | 6531 | 37.6 | 2381 | 38.4 |
| Decreased | 854 | 4.9 | 201 | 3.2 | 1248 | 7.2 | 275 | 4.4 |
| Unchanged | 4384 | 25.2 | 2069 | 33.4 | 8654 | 49.8 | 3299 | 53.3 |
| Don’t know | 590 | 3.4 | 143 | 2.3 | 842 | 4.8 | 210 | 3.4 |
| Missing | 51 | 0.3 | 26 | 0.4 | 89 | 0.5 | 29 | 0.5 |
| (a) | ||||||||||||
|---|---|---|---|---|---|---|---|---|---|---|---|---|
| Decrease Category (n = 9090, 53.3%) | Increase Category (n = 3519, 20.3%) | Stable Category (n = 2140, 15.3%) | Other Category (n = 2651, 12.1%) | |||||||||
| OR | 95% CI | OR | 95% CI | OR | 95% CI | OR | 95% CI | |||||
| Age (years) | ||||||||||||
| 18–35 | 0.91 | 0.80 | 1.03 | 1.07 | 0.93 | 1.24 | 1.12 | 0.94 | 1.35 | 0.96 | 0.82 | 1.14 |
| 36–50 | 1.00 | Ref | 1.00 | Ref | 1.00 | Ref | 1.00 | Ref | ||||
| 51–65 | 1.48 | 1.33 | 1.63 | 0.72 | 0.64 | 0.81 | 0.94 | 0.81 | 1.09 | 0.79 | 0.69 | 0.92 |
| >65 | 2.08 | 1.85 | 2.35 | 0.47 | 0.40 | 0.54 | 0.97 | 0.82 | 1.15 | 0.60 | 0.50 | 0.72 |
| Educational level | ||||||||||||
| <High-school degree | 1.08 | 0.96 | 1.22 | 0.89 | 0.76 | 1.04 | 1.03 | 0.88 | 1.20 | 0.87 | 0.71 | 1.07 |
| High-school degree | 1.00 | Ref | 1.00 | Ref | 1.00 | Ref | 1.00 | Ref | ||||
| Undergraduate degree | 0.95 | 0.85 | 1.05 | 1.08 | 0.95 | 1.23 | 0.96 | 0.83 | 1.10 | 1.09 | 0.93 | 1.28 |
| Graduate degree | 1.00 | 0.90 | 1.11 | 0.97 | 0.85 | 1.11 | 0.87 | 0.75 | 1.01 | 1.24 | 1.05 | 1.46 |
| Unknown | 0.96 | 0.67 | 1.36 | 1.00 | 0.65 | 1.55 | 0.87 | 0.53 | 1.41 | 1.30 | 0.77 | 2.21 |
| Monthly income (€ per household) | ||||||||||||
| <1430 | 1.00 | Ref | 1.00 | Ref | 1.00 | Ref | 1.00 | Ref | ||||
| 1430 to 2700 | 1.16 | 1.00 | 1.34 | 0.98 | 0.81 | 1.17 | 0.78 | 0.64 | 0.94 | 0.97 | 0.78 | 1.22 |
| 2700 to 4800 | 1.10 | 0.95 | 1.27 | 1.11 | 0.92 | 1.33 | 0.65 | 0.53 | 0.80 | 1.12 | 0.89 | 1.40 |
| ≥4800 | 1.00 | 0.85 | 1.18 | 1.11 | 0.90 | 1.35 | 0.67 | 0.54 | 0.84 | 1.31 | 1.03 | 1.68 |
| Unknown | 0.88 | 0.70 | 1.12 | 1.18 | 0.89 | 1.56 | 0.79 | 0.57 | 1.08 | 1.31 | 0.93 | 1.83 |
| Did not wish to answer | 1.11 | 0.94 | 1.30 | 0.98 | 0.80 | 1.20 | 0.83 | 0.67 | 1.03 | 0.97 | 0.76 | 1.25 |
| Reside with partner during the lockdown | ||||||||||||
| Yes | 1.10 | 0.97 | 1.24 | 0.80 | 0.69 | 0.92 | 1.13 | 0.94 | 1.35 | 1.00 | 0.84 | 1.19 |
| No | 1.00 | Ref | 1.00 | Ref | 1.00 | Ref | 1.00 | Ref | ||||
| No partner | 1.12 | 0.98 | 1.28 | 0.84 | 0.72 | 0.98 | 0.94 | 0.77 | 1.15 | 1.07 | 0.88 | 1.30 |
| Children or grandchildren at home during the lockdown | ||||||||||||
| Yes | 1.00 | Ref | 1.00 | Ref | 1.00 | Ref | 1.00 | Ref | ||||
| No | 0.83 | 0.75 | 0.91 | 1.25 | 1.12 | 1.41 | 0.93 | 0.81 | 1.08 | 1.11 | 0.97 | 1.28 |
| Professional activity changes during the lockdown | ||||||||||||
| No professional activity (unemployed, retired, homemaker, maternity leave) or no professional activity during the last seven days (short-term leave). | 1.00 | Ref | 1.00 | Ref | 1.00 | Ref | 1.00 | Ref | ||||
| No change | 1.17 | 1.01 | 1.36 | 0.74 | 0.62 | 0.89 | 1.25 | 1.03 | 1.54 | 0.75 | 0.60 | 0.93 |
| Yes, change (working from home, new job) | 0.91 | 0.82 | 1.00 | 1.15 | 1.03 | 1.29 | 0.89 | 0.76 | 1.03 | 1.04 | 0.90 | 1.19 |
| Other | 0.93 | 0.74 | 1.17 | 0.94 | 0.71 | 1.24 | 1.29 | 0.95 | 1.76 | 0.96 | 0.69 | 1.34 |
| Essential providers or workers during lockdown | ||||||||||||
| Yes | 1.11 | 0.98 | 1.25 | 0.80 | 0.69 | 0.92 | 1.16 | 0.97 | 1.38 | 0.96 | 0.81 | 1.14 |
| No | 1.00 | Ref | 1.00 | Ref | 1.00 | Ref | 1.00 | Ref | ||||
| Don’t know | 1.07 | 0.91 | 1.26 | 0.94 | 0.78 | 1.14 | 0.92 | 0.70 | 1.20 | 1.01 | 0.81 | 1.27 |
| Residential area during the lockdown (number of inhabitants) | ||||||||||||
| Urban area >100.000 | 1.30 | 1.19 | 1.43 | 0.77 | 0.69 | 0.87 | 0.67 | 0.59 | 0.77 | 1.25 | 1.10 | 1.43 |
| Urban area ≥20.000 to 100.000 | 1.32 | 1.21 | 1.44 | 0.83 | 0.75 | 0.93 | 0.68 | 0.60 | 0.77 | 1.12 | 0.99 | 1.28 |
| Urban area <20.000 | 1.21 | 1.12 | 1.32 | 0.86 | 0.78 | 0.96 | 0.80 | 0.71 | 0.90 | 1.12 | 0.99 | 1.28 |
| Rural area | 1.00 | Ref | 1.00 | Ref | 1.00 | Ref | 1.00 | Ref | ||||
| Smoking status | ||||||||||||
| Never smoker | 1.00 | Ref | 1.00 | Ref | 1.00 | Ref | 1.00 | Ref | ||||
| Occasionally smoker | 0.98 | 0.77 | 1.25 | 1.14 | 0.86 | 1.51 | 1.29 | 0.92 | 1.80 | 0.62 | 0.42 | 0.93 |
| Current smoker | 1.10 | 0.95 | 1.27 | 0.83 | 0.69 | 0.99 | 1.54 | 1.28 | 1.87 | 0.61 | 0.48 | 0.78 |
| Current weight status | ||||||||||||
| Overweight | 0.99 | 0.92 | 1.06 | 0.93 | 0.85 | 1.02 | 1.16 | 1.06 | 1.28 | 0.95 | 0.86 | 1.06 |
| Non-overweight | 1.00 | Ref | 1.00 | Ref | 1.00 | Ref | 1.00 | Ref | ||||
| Unknown | 1.08 | 0.69 | 1.70 | 1.10 | 0.65 | 1.87 | 0.85 | 0.43 | 1.68 | 0.79 | 0.40 | 1.57 |
| Chronic disease | ||||||||||||
| Yes | 1.02 | 0.95 | 1.09 | 0.93 | 0.86 | 1.02 | 1.05 | 0.96 | 1.16 | 1.01 | 0.92 | 1.12 |
| No | 1.00 | Ref | 1.00 | Ref | 1.00 | Ref | 1.00 | Ref | ||||
| Don’t know | 0.83 | 0.58 | 1.19 | 1.43 | 0.95 | 2.16 | 1.39 | 0.87 | 2.22 | 0.51 | 0.26 | 1.01 |
| PHQ-9 (depressive symptoms) | ||||||||||||
| Mild | 1.08 | 0.99 | 1.17 | 0.86 | 0.77 | 0.95 | 0.86 | 0.75 | 0.97 | 1.22 | 1.08 | 1.38 |
| Minimal | 1.00 | Ref | 1.00 | Ref | 1.00 | Ref | 1.00 | Ref | ||||
| Moderate | 1.11 | 0.96 | 1.30 | 0.82 | 0.68 | 0.99 | 0.91 | 0.72 | 1.15 | 1.14 | 0.93 | 1.41 |
| Moderately severe to severe | 1.43 | 1.14 | 1.79 | 0.65 | 0.48 | 0.88 | 0.68 | 0.47 | 0.96 | 1.16 | 0.85 | 1.58 |
| GAD-7 (anxiety disorders) | ||||||||||||
| Mild | 1.00 | Ref | 1.00 | Ref | 1.00 | Ref | 1.00 | Ref | ||||
| Minimal | 0.97 | 0.89 | 1.06 | 1.01 | 0.91 | 1.12 | 1.02 | 0.90 | 1.16 | 1.02 | 0.90 | 1.15 |
| Moderate | 0.99 | 0.85 | 1.16 | 0.99 | 0.81 | 1.20 | 1.06 | 0.84 | 1.34 | 0.98 | 0.78 | 1.22 |
| Severe | 1.03 | 0.82 | 1.28 | 0.71 | 0.52 | 0.97 | 1.37 | 0.99 | 1.88 | 1.06 | 0.78 | 1.43 |
| Sedentary time change | ||||||||||||
| Decrease | 0.75 | 0.64 | 0.89 | 2.23 | 1.90 | 2.62 | 0.26 | 0.24 | 0.29 | 1.47 | 1.16 | 1.86 |
| Increase | 2.47 | 2.29 | 2.67 | 0.65 | 0.59 | 0.71 | 0.44 | 0.35 | 0.54 | 1.77 | 1.55 | 2.01 |
| No change | 1.00 | Ref | 1.00 | Ref | 1.00 | Ref | 1.00 | Ref | ||||
| Don’t know | 1.03 | 0.86 | 1.24 | 1.52 | 1.25 | 1.84 | 0.52 | 0.42 | 0.65 | 1.52 | 1.15 | 2.01 |
| Missing data | 2.87 | 1.61 | 5.13 | 0.69 | 0.33 | 1.44 | 0.43 | 0.20 | 0.94 | 0.48 | 0.12 | 1.99 |
| (b) | ||||||||||||
| Decrease Category (n = 3336, 53.9%) | Increase Category (n = 983, 15.9%) | Stable Category (n = 1395, 22.5%) | Other Category (n = 480, 7.7%) | |||||||||
| OR | 95% CI | OR | 95% CI | OR | 95% CI | OR | 95% CI | |||||
| Age (years) | ||||||||||||
| 18–35 | 0.72 | 0.53 | 0.97 | 1.09 | 0.76 | 1.57 | 1.36 | 0.88 | 2.1 | 1.19 | 0.8 | 1.75 |
| 36–50 | 1 | Ref | 1 | Ref | 1 | Ref | 1 | Ref | ||||
| 51–65 | 1.21 | 1 | 1.48 | 0.9 | 0.71 | 1.15 | 1.23 | 0.93 | 1.63 | 0.64 | 0.48 | 0.87 |
| >65 | 1.49 | 1.19 | 1.87 | 0.61 | 0.46 | 0.82 | 1.35 | 0.99 | 1.85 | 0.5 | 0.34 | 0.72 |
| Educational level | ||||||||||||
| <High-school degree | 0.94 | 0.77 | 1.14 | 0.94 | 0.71 | 1.24 | 1.43 | 1.13 | 1.81 | 0.45 | 0.3 | 0.68 |
| High-school degree | 1 | Ref | 1 | Ref | 1 | Ref | 1 | Ref | ||||
| Undergraduate degree | 0.98 | 0.81 | 1.19 | 1.04 | 0.8 | 1.35 | 1.13 | 0.89 | 1.44 | 0.77 | 0.56 | 1.08 |
| Graduate degree | 0.92 | 0.76 | 1.11 | 1.05 | 0.81 | 1.35 | 1.2 | 0.94 | 1.52 | 0.86 | 0.63 | 1.19 |
| Unknown | 1.16 | 0.6 | 2.24 | 0.56 | 0.2 | 1.59 | 1.54 | 0.72 | 3.32 | 0.78 | 0.23 | 2.64 |
| Monthly income (€ per household) | ||||||||||||
| <1430 | 1 | Ref | 1 | Ref | 1 | Ref | 1 | Ref | ||||
| 1430 to 2700 | 1.01 | 0.73 | 1.38 | 1.06 | 0.68 | 1.65 | 0.79 | 0.54 | 1.16 | 1.38 | 0.75 | 2.54 |
| 2700 to 4800 | 1.06 | 0.77 | 1.45 | 1.03 | 0.67 | 1.6 | 0.73 | 0.5 | 1.07 | 1.58 | 0.86 | 2.88 |
| >=4800 | 0.89 | 0.64 | 1.25 | 1.49 | 0.94 | 2.35 | 0.63 | 0.42 | 0.95 | 1.57 | 0.84 | 2.95 |
| Unknown | 0.91 | 0.5 | 1.66 | 1.88 | 0.9 | 3.9 | 0.75 | 0.36 | 1.58 | 0.58 | 0.16 | 2.1 |
| Did not wish to answer | 1.09 | 0.76 | 1.55 | 0.88 | 0.54 | 1.45 | 0.8 | 0.52 | 1.22 | 1.5 | 0.76 | 2.96 |
| Reside with partner during the lockdown | ||||||||||||
| Yes | 0.9 | 0.67 | 1.2 | 0.97 | 0.67 | 1.41 | 1.28 | 0.84 | 1.95 | 1 | 0.63 | 1.56 |
| No | 1 | Ref | 1 | Ref | 1 | Ref | 1 | Ref | ||||
| No partner | 0.83 | 0.61 | 1.13 | 0.87 | 0.59 | 1.3 | 1.6 | 1.03 | 2.47 | 0.95 | 0.59 | 1.54 |
| Children or grandchildren at home during the lockdown | ||||||||||||
| Yes | 1 | Ref | 1 | Ref | Ref | 1 | Ref | |||||
| No | 0.92 | 0.77 | 1.11 | 0.98 | 0.78 | 1.24 | 1.07 | 0.83 | 1.38 | 1.12 | 0.84 | 1.51 |
| Professional activity changes during the lockdown | ||||||||||||
| No professional activity (unemployed, retired, homemaker, maternity leave) or no professional activity during the last seven days (short-term leave). | 1 | Ref | 1 | Ref | Ref | 1 | Ref | |||||
| No change | 1.1 | 0.83 | 1.45 | 0.64 | 0.44 | 0.93 | 1.15 | 0.81 | 1.65 | 1.09 | 0.7 | 1.71 |
| Yes. change (working from home. new job) | 1.08 | 0.89 | 1.31 | 0.94 | 0.74 | 1.19 | 0.87 | 0.66 | 1.14 | 0.95 | 0.71 | 1.29 |
| Other | 0.7 | 0.4 | 1.2 | 1.2 | 0.63 | 2.3 | 1.21 | 0.61 | 2.4 | 1.29 | 0.56 | 2.95 |
| Essential providers or workers during lockdown | ||||||||||||
| Yes | 1.02 | 0.8 | 1.3 | 2.65 | 1.92 | 3.64 | 1.25 | 0.9 | 1.72 | 0.87 | 0.59 | 1.28 |
| No | 1 | Ref | 1 | Ref | Ref | 1 | Ref | |||||
| Don’t know | 1.05 | 0.75 | 1.47 | 0.86 | 0.55 | 1.33 | 1.68 | 1.08 | 2.62 | 0.62 | 0.34 | 1.11 |
| Residential area during the lockdown (number of inhabitants) | ||||||||||||
| Urban area >100.000 | 1.58 | 1.34 | 1.85 | 0.84 | 0.68 | 1.03 | 0.55 | 0.44 | 0.68 | 1.21 | 0.91 | 1.61 |
| Urban area >=20.000 to 100.000 | 1.55 | 1.33 | 1.79 | 0.74 | 0.6 | 0.91 | 0.64 | 0.53 | 0.77 | 1.22 | 0.92 | 1.61 |
| Urban area <20.000 | 1.31 | 1.14 | 1.51 | 0.94 | 0.78 | 1.13 | 0.68 | 0.58 | 0.8 | 1.25 | 0.96 | 1.64 |
| Rural area | 1 | Ref | 1 | Ref | Ref | 1 | Ref | |||||
| Smoking status | ||||||||||||
| Never smoker | 1 | Ref | 1 | Ref | 1 | Ref | 1 | Ref | ||||
| Occasionally smoker | 1.16 | 0.76 | 1.76 | 0.9 | 0.53 | 1.53 | 1.03 | 0.61 | 1.75 | 0.76 | 0.36 | 1.6 |
| Current smoker | 0.84 | 0.65 | 1.1 | 1.01 | 0.72 | 1.43 | 1.46 | 1.07 | 1.99 | 0.68 | 0.4 | 1.16 |
| Current weight status | ||||||||||||
| Normal | 1 | Ref | 1 | Ref | 1 | Ref | 1 | Ref | ||||
| Overweight | 0.91 | 0.81 | 1.01 | 1.07 | 0.92 | 1.25 | 1.18 | 1.03 | 1.35 | 0.91 | 0.38 | 2.2 |
| Unknown | 0.53 | 0.22 | 1.29 | 1.38 | 0.47 | 4.06 | 1.32 | 0.48 | 3.64 | 2.13 | 0.57 | 7.99 |
| Chronic disease | ||||||||||||
| Yes | 0.98 | 0.87 | 1.09 | 1.1 | 0.94 | 1.28 | 1.06 | 0.93 | 1.22 | 0.81 | 0.66 | 1.01 |
| No | 1 | Ref | 1 | Ref | 1 | Ref | 1 | Ref | ||||
| Don’t know | 0.84 | 0.46 | 1.54 | 1.65 | 0.78 | 3.47 | 0.85 | 0.39 | 1.82 | 1 | 0.34 | 2.88 |
| PHQ-9 (depressive symptoms) | ||||||||||||
| Mild | 0.95 | 0.79 | 1.14 | 0.89 | 0.7 | 1.14 | 1.02 | 0.81 | 1.3 | 1.27 | 0.95 | 1.69 |
| Minimal | 1 | Ref | 1 | Ref | 1 | Ref | 1 | Ref | ||||
| Moderate | 0.93 | 0.63 | 1.36 | 1.06 | 0.64 | 1.76 | 0.65 | 0.35 | 1.21 | 1.6 | 0.93 | 2.74 |
| Moderately severe to severe | 1.2 | 0.69 | 2.1 | 0.7 | 0.31 | 1.59 | 1 | 0.47 | 2.15 | 0.91 | 0.38 | 2.2 |
| GAD-7 (anxiety disorders) | ||||||||||||
| Mild | 1 | Ref | 1 | Ref | Ref | 1 | Ref | |||||
| Minimal | 0.88 | 0.73 | 1.06 | 1.02 | 0.8 | 1.31 | 1.18 | 0.92 | 1.51 | 1.05 | 0.77 | 1.43 |
| Moderate | 0.81 | 0.54 | 1.21 | 1.42 | 0.86 | 2.35 | 0.98 | 0.56 | 1.73 | 1.13 | 0.6 | 2.11 |
| Severe | 1.06 | 0.58 | 1.93 | 0.44 | 0.16 | 1.24 | 1.74 | 0.81 | 3.75 | 1.08 | 0.43 | 2.74 |
| Sedentary time change | ||||||||||||
| Decrease | 0.72 | 0.52 | 1.01 | 2.65 | 1.92 | 3.64 | 0.42 | 0.28 | 0.62 | 1.98 | 1.18 | 3.32 |
| Increase | 3.1 | 2.75 | 3.49 | 0.63 | 0.53 | 0.74 | 0.24 | 0.21 | 0.28 | 2.04 | 1.57 | 2.66 |
| No change | 1 | Ref | 1 | Ref | Ref | 1 | Ref | |||||
| Don't know | 1.86 | 1.31 | 2.64 | 0.78 | 0.48 | 1.28 | 0.56 | 0.38 | 0.82 | 1.38 | 0.64 | 2.99 |
| Missing data | 1.04 | 0.46 | 2.34 | 0.51 | 0.15 | 1.77 | 0.87 | 0.37 | 2.02 | / | / | / |
Publisher’s Note: MDPI stays neutral with regard to jurisdictional claims in published maps and institutional affiliations. |
© 2022 by the authors. Licensee MDPI, Basel, Switzerland. This article is an open access article distributed under the terms and conditions of the Creative Commons Attribution (CC BY) license (https://creativecommons.org/licenses/by/4.0/).
Share and Cite
Charreire, H.; Verdot, C.; Szabo de Edelenyi, F.; Deschasaux-Tanguy, M.; Srour, B.; Druesne-Pecollo, N.; Esseddik, Y.; Allès, B.; Baudry, J.; Deschamps, V.; et al. Correlates of Changes in Physical Activity and Sedentary Behaviors during the COVID-19 Lockdown in France: The NutriNet-Santé Cohort Study. Int. J. Environ. Res. Public Health 2022, 19, 12370. https://doi.org/10.3390/ijerph191912370
Charreire H, Verdot C, Szabo de Edelenyi F, Deschasaux-Tanguy M, Srour B, Druesne-Pecollo N, Esseddik Y, Allès B, Baudry J, Deschamps V, et al. Correlates of Changes in Physical Activity and Sedentary Behaviors during the COVID-19 Lockdown in France: The NutriNet-Santé Cohort Study. International Journal of Environmental Research and Public Health. 2022; 19(19):12370. https://doi.org/10.3390/ijerph191912370
Chicago/Turabian StyleCharreire, Hélène, Charlotte Verdot, Fabien Szabo de Edelenyi, Mélanie Deschasaux-Tanguy, Bernard Srour, Nathalie Druesne-Pecollo, Younes Esseddik, Benjamin Allès, Julia Baudry, Valérie Deschamps, and et al. 2022. "Correlates of Changes in Physical Activity and Sedentary Behaviors during the COVID-19 Lockdown in France: The NutriNet-Santé Cohort Study" International Journal of Environmental Research and Public Health 19, no. 19: 12370. https://doi.org/10.3390/ijerph191912370