COVID-19-Related Changes in NO2 and O3 Concentrations and Associated Health Effects in Malta
 Sara Fenech
 Noel J. Aquilina
 Ryan Vella
- 1Faculty of Science, University of Malta, Msida, Malta
- 2Department of Chemistry, University of Malta, Msida, Malta
- 3European Space Agency (ESA), ESRIN, Frascati, Italy
The start of 2020 has been characterized by emission reductions in various countries across the globe following the implementation of different lock-down measures to control the transmission of the SARS-CoV-2 (COVID-19). Consequently, these reductions influenced the air quality globally. In this study, we focus on daily nitrogen dioxide (NO2) as well as ozone (O3) concentrations measured across the Maltese Islands between January and mid-October 2020. Changes in air quality are generally difficult to detect due to the complex composition and interactions occurring within the atmosphere. To quantify changes in NO2 and O3 concentrations during the COVID-19 period, we use a random forest machine learning algorithm to determine a business as usual counterfactual scenario. Results highlight a decrease in monthly mean NO2 concentrations by up to 54% in the traffic site of Msida (~21 μg m−3). In contrast, the monthly mean O3 concentrations during the COVID-19 months are up to 61% higher compared to a business as usual scenario in Msida (~28 μg m−3). In this study, we also estimate the differences in attributable fraction (AF) associated with short-term exposure to NO2 and O3 concentrations. In Msida, the AF is up to 0.9% lower and 0.8% higher for measured NO2 and O3 concentrations, respectively. Our results highlight the favorable effects of decreasing traffic-related emissions on NO2 concentrations however, we also note increases in other pollutants for example O3 concentrations which especially in the short-term can lead to various adverse health effects.
Introduction
The start of 2020 has presented the world with an unforeseen real case scenario which limited the movement of people within countries and across the globe as a result of the COVID-19 restrictions. In an attempt to minimize the spread of the SARS-CoV-2 (COVID-19) virus, governments around the world have enforced various restrictions ranging from the implementation of social distancing policies to complete lockdown.
Although Malta has not gone into complete lockdown, several restrictive measures started to be implemented at the start of March 2020. The first case in Malta (patient 0) was reported on the 7th March which subsequently led to various travel bans and mandatory quarantine of 14 days for passengers arriving from a list of countries on the 11th March (Public Health Act, 2020a). Legal Notices were then issued on the 12th March for the closure of schools, childcare centers as well as universities and other educational establishments (Public Health Act, 2020b). Non-essential retail outlets as well as outlets providing non-essential services were also closed on 23rd March including the suspension of organized events (Public Health Act, 2020c). Restrictive measures started to be lifted off in the beginning of May leading to the removal of flight restrictions and the end of the public health emergency state on the 15th June and the reopening of schools on the 7th October.
As the intensity of the COVID-19-related restrictions increased and population mobility decreased, a subsequent reduction in emissions related to for example road and air traffic is expected, however the extent of such an impact is uncertain. In addition, a sudden change in emissions of one pollutant will inevitably alter the atmospheric chemical balance. Various methods are used in literature to quantify changes in different air pollutants pertaining to the implementation of COVID-19-related restrictions. Chemical transport models are used to simulate a business as usual scenario (e.g., Keller et al., 2020; Menut et al., 2020) while satellite data and in situ measurements are used to represent air pollutant levels during lockdown periods (e.g., Sicard et al., 2020; Tobías et al., 2020). In addition, machine learning (ML) tools are used to isolate the COVID-19 related impact from meteorologically driven changes by estimating the change in air pollutant concentrations for average weather conditions (e.g., Petetin et al., 2020). At a large temporal scale which incorporates all the entire lockdown period (41 days) and across all Spanish provinces considered, Petetin et al. (2020) have shown similar mean business as usual NO2 (nitrogen dioxide) mixing ratios between methods using ML models and those implementing mean NO2 concentrations between 2017 and 2019 during the same period. However, large difference are reported amongst the different provinces and at shorter temporal scales which highlights the importance of considering meteorological variability to adequately represent baseline air pollution levels.
Globally, studies have shown reductions in NO2 levels as a result of NOx (oxides of nitrogen) emission reductions mostly from reductions in traffic-related emissions (e.g., Collivignarelli et al., 2020; Kanniah et al., 2020; Petetin et al., 2020; Sicard et al., 2020; Siciliano et al., 2020). Using a machine learning algorithm fed by information from the NASA GEOS-CF model at 5,756 observations sites and 46 countries, Keller et al. (2020) find average reductions of 18% in NO2 concentrations from February 2020 onward compared to the business as usual scenario. In contrast, the overall net effect on daily mean O3 (ozone) increases is small but reaches up to 50% in some locations due to influences related to non-linear atmospheric chemistry. Several studies have focused on different world regions as well as specific countries with focus on multiple air pollutant levels during the lockdown period. For example, Sicard et al. (2020) focus on observations from four European cities and one Chinese city in 2020 compared to air pollutant levels for the same period between 2017 and 2019. Their results suggest a decrease in NO2 and PM (particulate matter) levels of up to 56 and 8%, respectively. In addition, Sicard et al. (2020) show increase in O3 production by up to 17% in Europe due to NOx reductions. Similar findings are reported by Tobías et al. (2020) in Barcelona, Spain with traffic-related emission reductions resulting in a decrease of NO2 levels of up to 51% and an increase of 50% in O3 concentrations likely due to a reduction in the O3 titration by NO. In contrast, additional home activities are found to offset PM reductions (Sicard et al., 2020). Conducting simulations using the WRF-CHIMERE model for the month of March 2020, Menut et al. (2020) show similar decreases in NO2 and increases in O3 due to non-linear chemical effects particularly in urban areas. Stronger changes in pollutant concentrations in traffic as opposed to urban background sites are also reported by Petetin et al. (2020).
In this study, we focus on changes in daily NO2 and O3 concentrations across the Maltese Islands in 2020 using three observation sites and a machine learning model (Grange et al., 2018; Grange and Carslaw, 2020) to predict the counterfactual business as usual scenario (i.e., the air pollutant concentrations in the absence of any COVID-19-related measures). In addition, we estimate changes in the attributable fraction associated with short-term exposure to NO2 and O3 driven by the COVID-19-related measures.
Data and Methods
NO2 and O3 Concentrations
The ground-based air pollution measurements for the Maltese Islands used in this study are obtained from the Air Quality Monitoring Station network managed by the Environment and Resources Authority (ERA). This network consists of four sites in Malta which lie within the Western (Attard), Northern Harbor (Msida), Southern Harbor (Kordin), and South Eastern (Żejtun) districts and one in the Gozo and Comino district (Għarb) (Figure 1). In this study, we focus on daily averaged NO2 and O3 concentrations measured at the traffic site of Msida, the urban background site of Żejtun, and the background site of Għarb for two time periods: (i) 2008–2017 and (ii) 1st January to 15th October 2020. The Msida station is located at an altitude of 2 m and surrounded by major roads. The Żejtun station is placed in a playground and surrounded by houses at an altitude of 56 m. The Għarb station is found at an altitude of 114 m and away from any emission sources. Further details on the locations of these stations and how they were chosen, can be found in Stacey and Bush (2002).
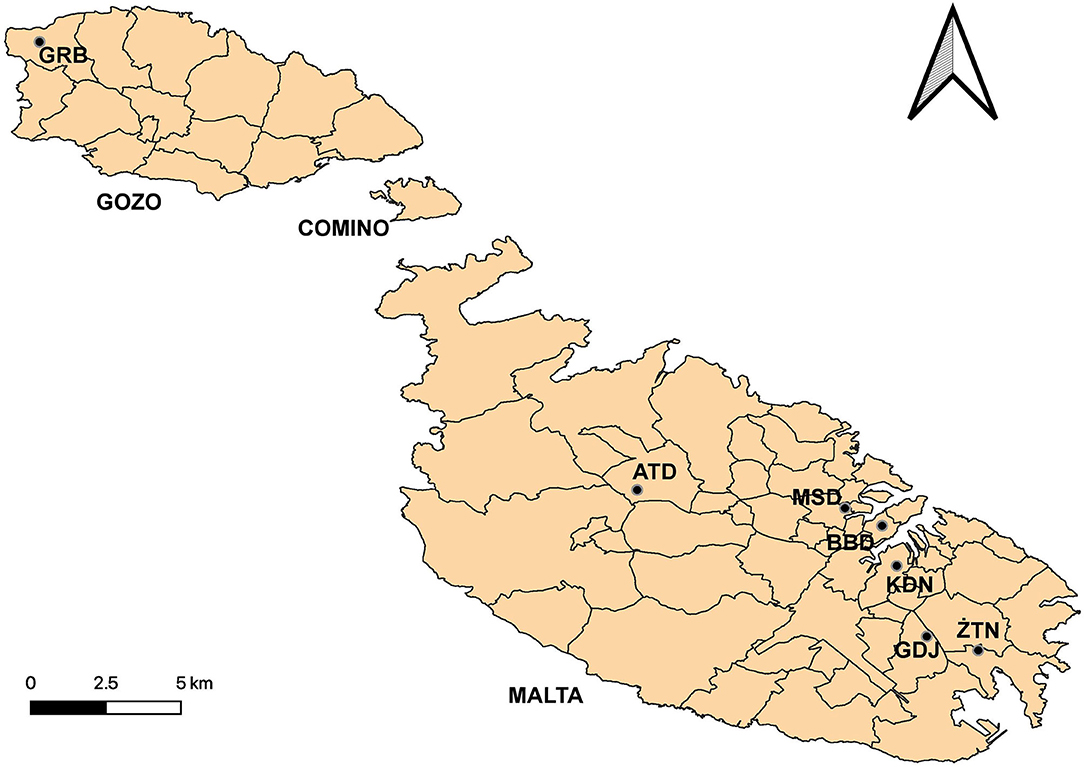
Figure 1. Air quality monitoring stations in Malta: Attard (ATD), Msida (MSD), Kordin (KDN) and Żejtun (ZTN) and in Gozo: Għarb (GRB). Traffic count sensors in Blata L-Bajda (BBD) and Gudja (GDJ).
To assess the spatial variability of NO2 background concentrations, satellite NO2 concentrations measured by the Copernicus Sentinel-5 Precursor Tropospheric Monitoring Instrument (S5p/TOPOMI) are downloaded from the Copernicus S5P Pre-Operations Data Hub (https://s5phub.copernicus.eu; last accessed 10th November 2020) at a resolution of 7 × 3.5 km2 (https://earth.esa.int/web/guestmissions/esa-eo-mission/sentinel-5p; last accessed 10th November 2020).
Traffic Data
The limited population mobility due to the restrictive COVID-19 measures resulted in less traffic and thus, less traffic-related emissions. To quantify the reductions in vehicles on the road, we use daily traffic counts from two locations in Malta close to the Msida and Żejtun air quality stations (Figure 1). Traffic count sensors are permanently installed in Blata L-Bajda (~2 km from Msida) and Tal-Barrani Road (~2.5 km from Żejtun) in Gudja (BBD and GDJ; Figure 1). For each location, traffic counts in both directions of traffic (northbound and southbound in Blata L-Bajda and westbound and eastbound in Tal-Barrani Road, respectively) are recorded. Data from these locations is routinely collected by Transport Malta from which data between the 1st January and the 20th September for 2019 and 2020 will be presented in this study. Due to road works in the area, traffic counts in Blata l-Bajda for the first few weeks of 2019 are missing. Primarily, these sensors are used for signal optimization of smart traffic lights in these areas and therefore no information is collected on vehicle types.
Meteorological Data
All the meteorological data presented in this study is obtained from the official meteorological site in Malta, the Luqa Met Office at the Malta International Airport as no meteorological data is recorded at the air pollution stations described in Section “NO2 and O3 Concentrations.” The daily averaged meteorological parameters used in this study include air temperature, relative humidity, precipitation and wind speed. Wind direction for 2020 was not available at the time of writing this paper and therefore, this parameter is not included in this study.
Machine Learning (ML) Model
In literature, various methods exist to isolate the COVID-19-related effects on air pollution levels across different countries each with its own associated uncertainties (Petetin et al., 2020). In this study, for each station, we first train a random forest (decision-tree forest) model as described by Grange et al. (2018) on meteorological and air pollution data between 2008 and 2017 using the rmweather R package (more information on the model used can be found in Grange et al., 2018). The number of trees is set to 300 (n_trees) with a minimal node size of five (min_node_size). The independent variables used consist of the following meteorological parameters (described in Section “Meteorological Data”): Unix date, Julian day, which represent the trend term and the seasonal term, respectively as well as weekday. The trained model is then used to predict the pollutant concentrations between 1st January 2020 and 15th October 2020 based on the measured meteorological data for the same period. The model's pollutant predictions represent the business as usual scenario as they are based on past air pollution relationships and the recorded weather conditions for 2020 therefore, excluding the COVID-19-related impact. Thus, observed concentrations can be compared to the counterfactual predicted concentrations. This method for determining the counterfactual is more robust than methods which use the average pollutant concentrations across a few years as this method uses weather data for 2020 which is not used in the model training.
The statistics showing model performance for each of the models grown for this study are listed in Table 1. Amongst all models grown, the R2 is highest for the traffic site of Msida (for both pollutants; 0.62 and 0.69, respectively) followed by the urban background site of Żejtun and ending with background site of Għarb. RMSE values range between 1.57 (Għarb) and 9.07 μg m−3 (Msida) for NO2 and between 9.05 (Għarb) and 10.82 μg m−3 (Żejtun) for O3 (Table 1). A caveat of this study is that for all models trained, the meteorological data is obtained from the Luqa station. Thus, no information on the meteorological parameters at the air pollution stations is used in the ML modeling. This impact may be amplified for Għarb as it is the location furthest away from Luqa.
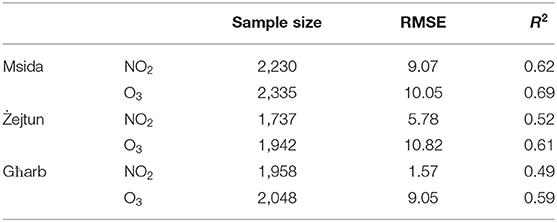
Table 1. Statistics showing model performance for each of the model grown between 2008 and 2017.
Health Effects
In this study, we present estimates of the changes in attributable fraction (AF; expressed as a percentage of daily all-cause mortality) associated with short-term exposure to NO2 and O3 concentrations in Msida due to the COVID-19-related air pollution changes. We only estimate the health effects in Msida as this location lies within the most densely populated region in Malta and it is the location where we note the highest changes in air pollution concentrations.
The AF associated with short-term exposure to NO2 and O3 is estimated for Msida as follows:
where
In Equation 1, AF is the attributable fraction and RR is the daily relative risk associated with short-term exposure to daily 1-h maximum NO2 and daily maximum 8-h running mean (MDA8) O3. In Equations 1 and 2, CRF is the concentration-response function coefficient and x is the daily pollutant concentrations. The CRFs used in this study for the AF associated with NO2 and O3 exposure are obtained from Health Risks of Air Pollution in Europe (HRAPIE) project (WHO, 2013) and from the Committee on the Medical Effect of Air Pollutants suggestions (COMEAP, 2015), respectively.
For short-term NO2-related health impacts, we use a CRF of 0.27% (95% confidence interval (CI: 0.16%, 0.38%) per 10 μg m−3 increase in daily 1 h maximum NO2 concentration. The AF associated with short-term exposure to O3 is estimated using a CRF of 0.34% (CI: 0.12%, 0.56%) per 10 μg m−3 increase in MDA8 O3. As limited evidence is available for a threshold below which no adverse effects for short-term exposure to daily maximum NO2 and MDA8 O3 exist, all the range of pollutant concentrations is used and no threshold is applied (WHO, 2013; COMEAP, 2015).
Results
Changes in Traffic Counts
In this section, we present daily traffic counts between the 1st January and the 20th September for 2019 and 2020 at two locations in Malta; Gudja and Blata L-Bajda (Figure 2, respectively). These two locations are close to the Żejtun and Msida air quality stations, thus, any changes in traffic around these areas should be reflected in measured air pollutant concentrations presented in Sections “The COVID-19-Related Changes in NO2 Concentrations” and “The COVID-19-Related Changes in O3 Concentrations.” In 2019, traffic counts at Gudja are between 8,447 and 26,922 with the westbound sensors recording marginally higher totals as compared to the eastbound direction (Figure 2, top panel). In Gudja, traffic counts in 2020 are largely similar for the first 2 months. However, different to 2019, a large dip in traffic counts is observed in mid-March 2020 with levels ranging between 7,121 and 15,451 until mid-April for both directions (Figure 2, top panel). Traffic counts in the westbound direction show a rapid increase between mid-April and June reaching February levels from June onwards. The increase in traffic counts in the eastbound direction for 2020 is smaller in Gudja with levels ranging from 8,611 to 17,137 from June onwards. Similarities are noted in Blata l-Bajda albeit lower traffic counts for 2019 especially in the southbound direction toward Marsa as compared to measured totals in Gudja (Figure 2, bottom panel). For both directions, in Blata l-Bajda traffic counts also drop in mid-March and reach 2019 totals from July onwards. In terms of percentages, traffic counts in 2020, for both locations, are up to ~50% less in April compared to the 2019 counts. Our results confirm a direct link between the timing of various measures related to the COVID-19 partial lockdown and differences in traffic counts for 2020 in Gudja and Blata l-Bajda; starting off with the closure of schools in mid-March and the end of the public health emergency state and the reopening of schools on the 15th June and 7th October, respectively.
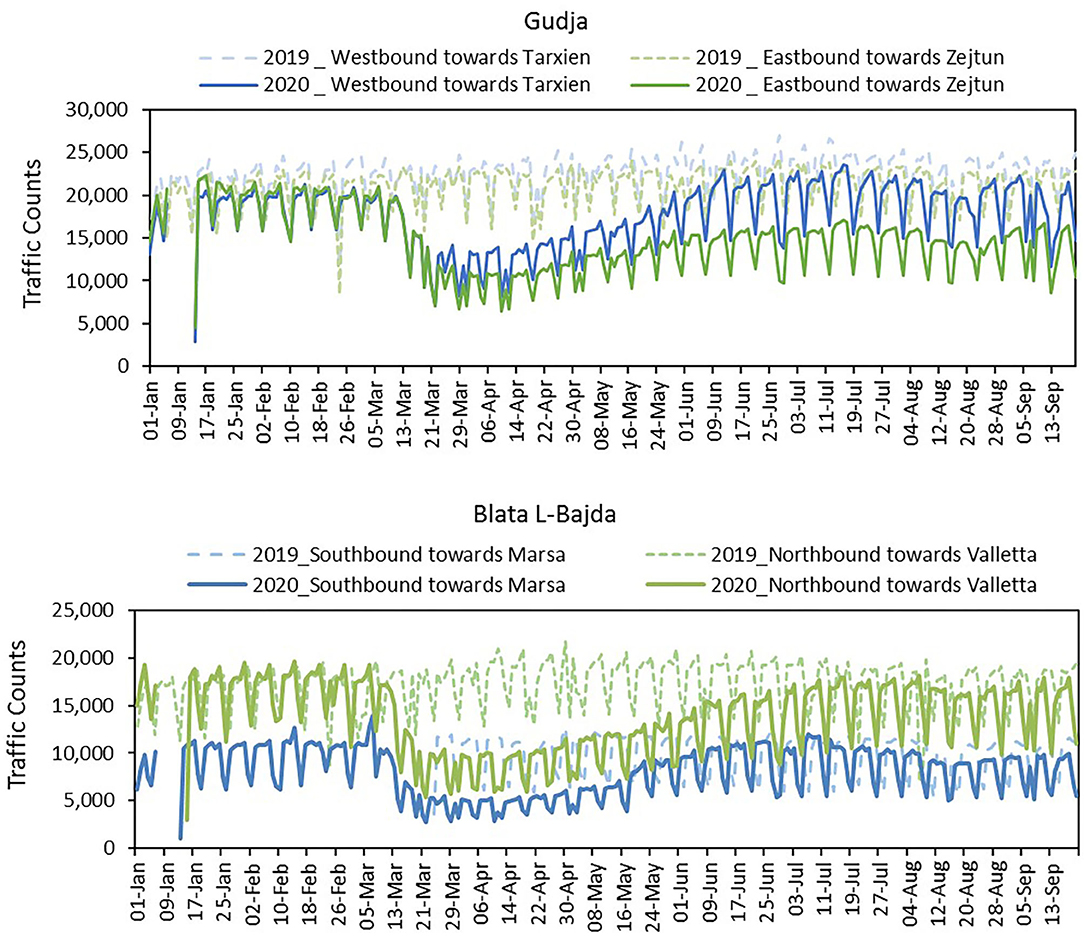
Figure 2. Traffic counts measured by Transport Malta in (top panel) Gudja and (bottom panel) Blata L-Bajda between 1st January and 20th September 2019 (dashed lines) and 2020 (solid lines). Blue and green colors show different traffic directions.
The COVID-19-Related Changes in NO2 Concentrations
In this section, we present the measured NO2 concentrations from the 1st January to the 15th October 2020 as well as the predicted NO2 concentrations for the same time period using a random forest model trained on data between 2008 and 2017 as described in Section “Machine Learning (ML) Model” (Figure 3). The random forest NO2 model predictions for 2020 represent a business as usual scenario whereby NO2 levels are determined based on the independent time and meteorological parameters which drive the ML model. As no NO2 concentrations from the COVID-19 period are used to train the ML model, the NO2 predictions exclude any COVID-related effect.
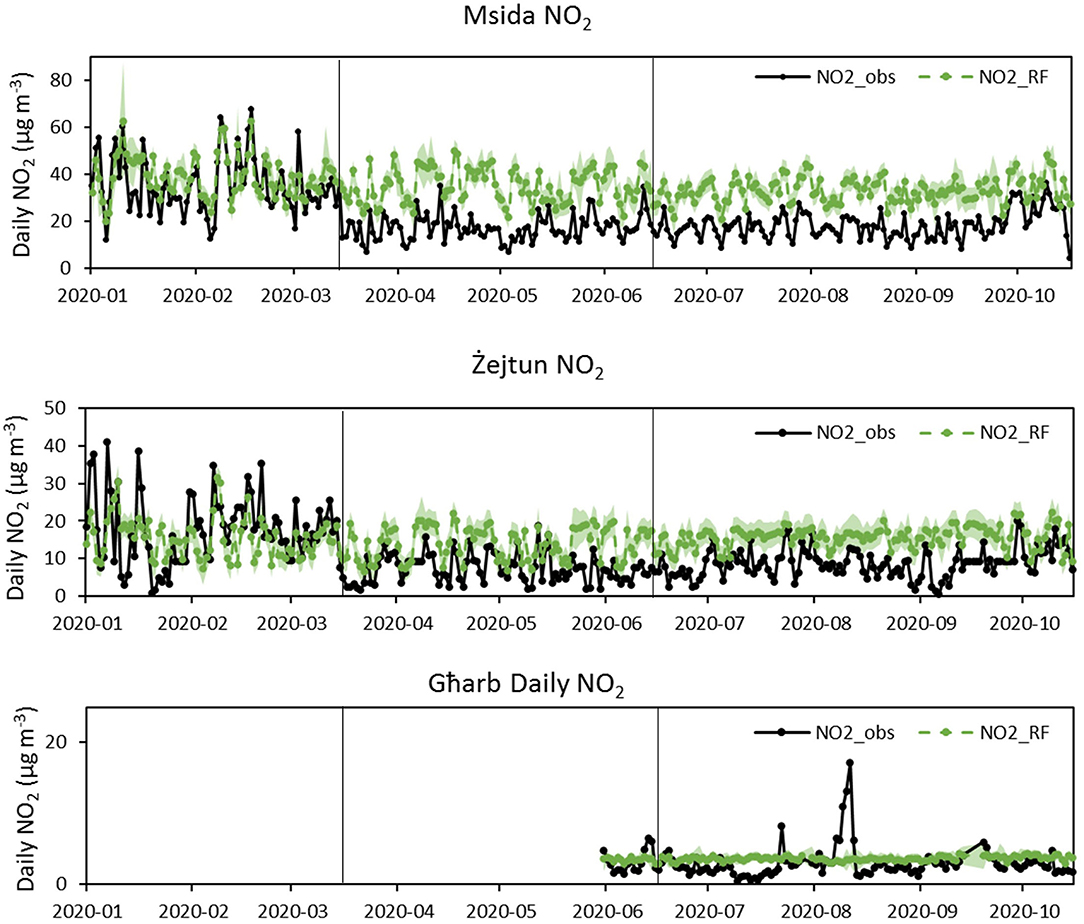
Figure 3. Daily predicted (green) and measured (black) NO2 concentrations at Msida, Żejtun and Għarb between the 1st January and 15th October 2020. Shaded green area indicates the 95% confidence interval of the NO2 predictions. N.B. the y-axis scale differs between the three panels. Vertical lines indicate the closure of schools on the 11th March and the end of the public health emergency on the 15th June 2020.
The monthly mean differences between the predicted and measured NO2 concentrations are listed in Table 2 together with the corresponding p-values. In January and February, the daily measured NO2 concentrations at the traffic site of Msida mostly lie within the 95% CI of the predicted NO2 concentrations with values ranging from approximately 15 to 70 μg m−3 corresponding to a decrease of −12 and −5%, respectively compared to the predicted concentrations (Figure 3 and Table 2). The overlap of the confidence interval for January and February as well as a high p-values (>0.05; Table 2) suggest that differences between the measured and predicted datasets are not significant. In contrast, measured NO2 concentrations between March and September range between approximately 5 and 30 μg m−3 which corresponds to a decrease of up to 54% (in April) compared to the predicted NO2 levels. Daily measured NO2 concentrations from mid-March to the start of October lie outside the 95% C.I. of the predicted NO2 concentrations during the same period. In addition, the p-value for these months is low (<0.05) thus indicating a significant difference between the measured and the predicted NO2 concentrations. These differences diminish greatly during the first 2 weeks of October with measured concentrations within the 95% CI of the predicted ones as well as an increase in the p-value. Less of a clear pattern can be noted for NO2 concentrations at the urban background station of Żejtun. However, measured NO2 concentrations are generally statistically significantly lower compared to the predicted concentrations especially between April and September by up to −57% in June (p-value <0.001). In the background station of Għarb, measured NO2 concentrations from June to October range between approximately 2 and 10 μg m−3 with small daily variations albeit a peak reaching 20 μg m−3 in August.
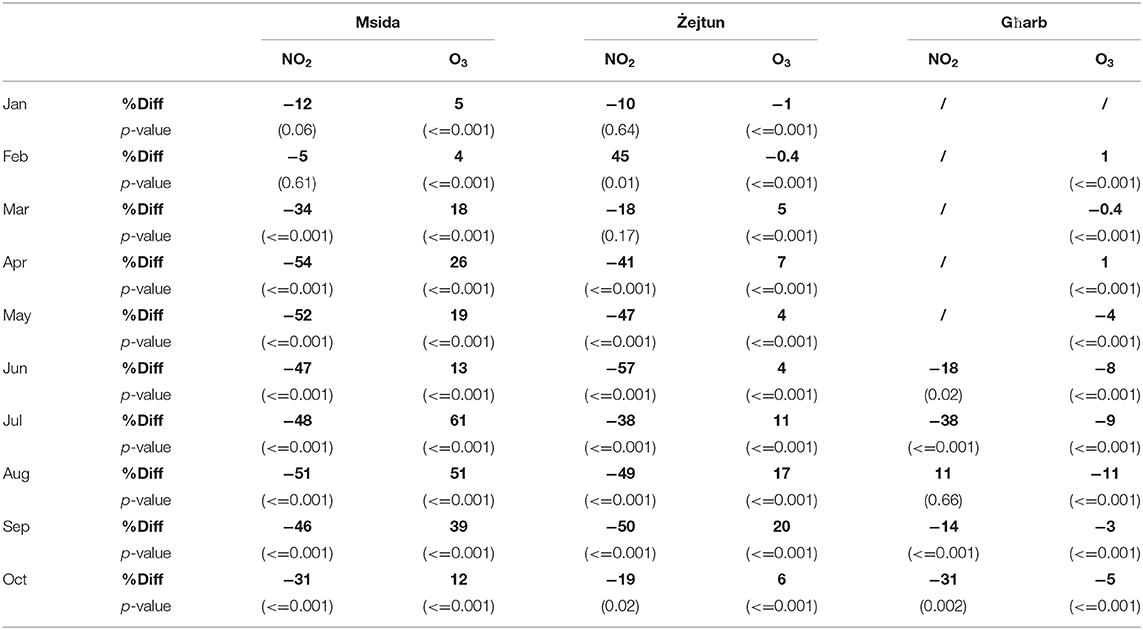
Table 2. Monthly mean percentage differences between predicted and measured pollutant concentrations as well as p-values for all three sites.
The large reduction in NO2 concentrations across the Maltese Islands are also observed from satellite measurements of monthly average NO2 vertical column densities (Figure 4, bottom panel). Over the Maltese Islands, we estimate a reduction of 24% (0.32 PMolec cm−2) in March 2020 compared to March 2019. We note that a direct comparison of satellite measurements to ground-based measurements is impossible and beyond the scope of this paper however, the monthly mean NO2 satellite data suggests a widespread reduction for 2020 compared to 2019 across the Maltese Islands. In addition, the meteorological variability between 2019 and 2020 is not accounted for in the comparison of the satellite data. Nonetheless, satellite NO2 data aids the representation of spatially varying NO2 changes in 2020 as compared to 2019 which is difficult to determine when using a limited number of ground-based stations.
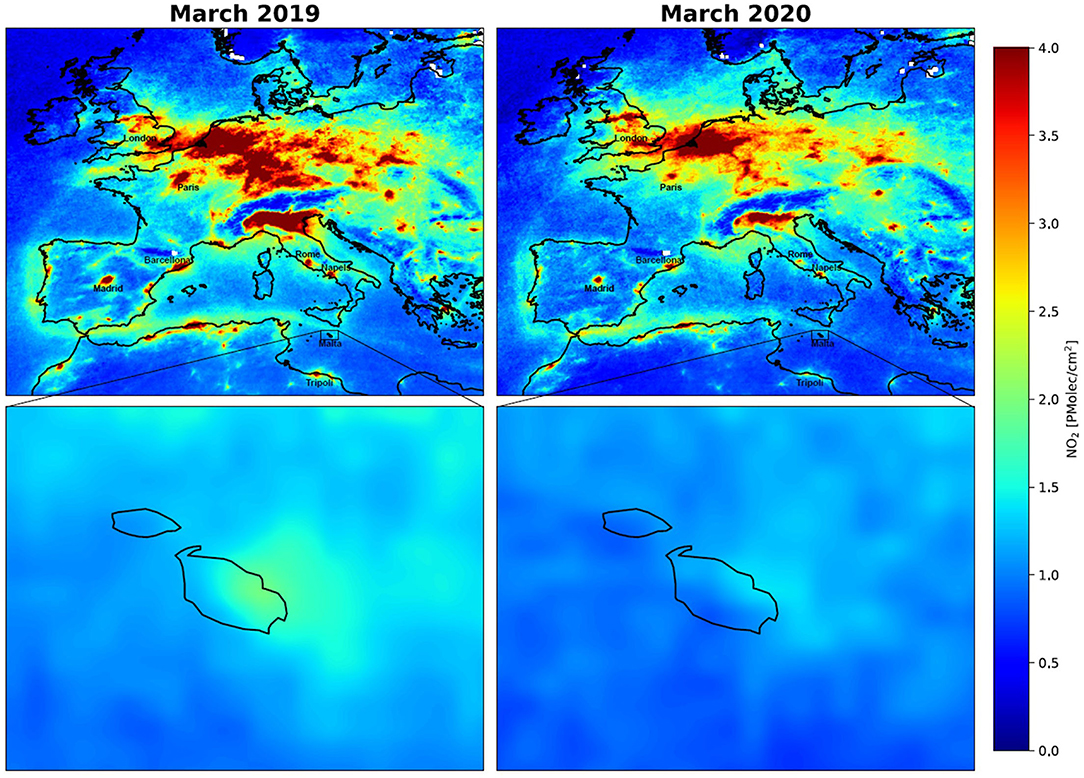
Figure 4. NO2 vertical column density over Europe (top panel) and the Mediterranean Sea (bottom panel) for March 2019 (Left) and 2020 (Right).
The COVID-19-Related Changes in O3 Concentrations
The measured and predicted daily O3 concentrations at Msida, Żejtun, and Għarb between 1st January and 15th October 2020 are presented in Figure 5. At Msida, measured O3 concentrations from mid-March to the end of September range between ~ 50 and 100 μg m−3 while predicted O3 concentrations representing a business as usual scenario range between ~ 25 and 75 μg m−3 in the same period. In terms of percentage differences, measured O3 concentrations from mid-March to September are between 13 and 61% higher compared to the predicted concentrations at Msida.
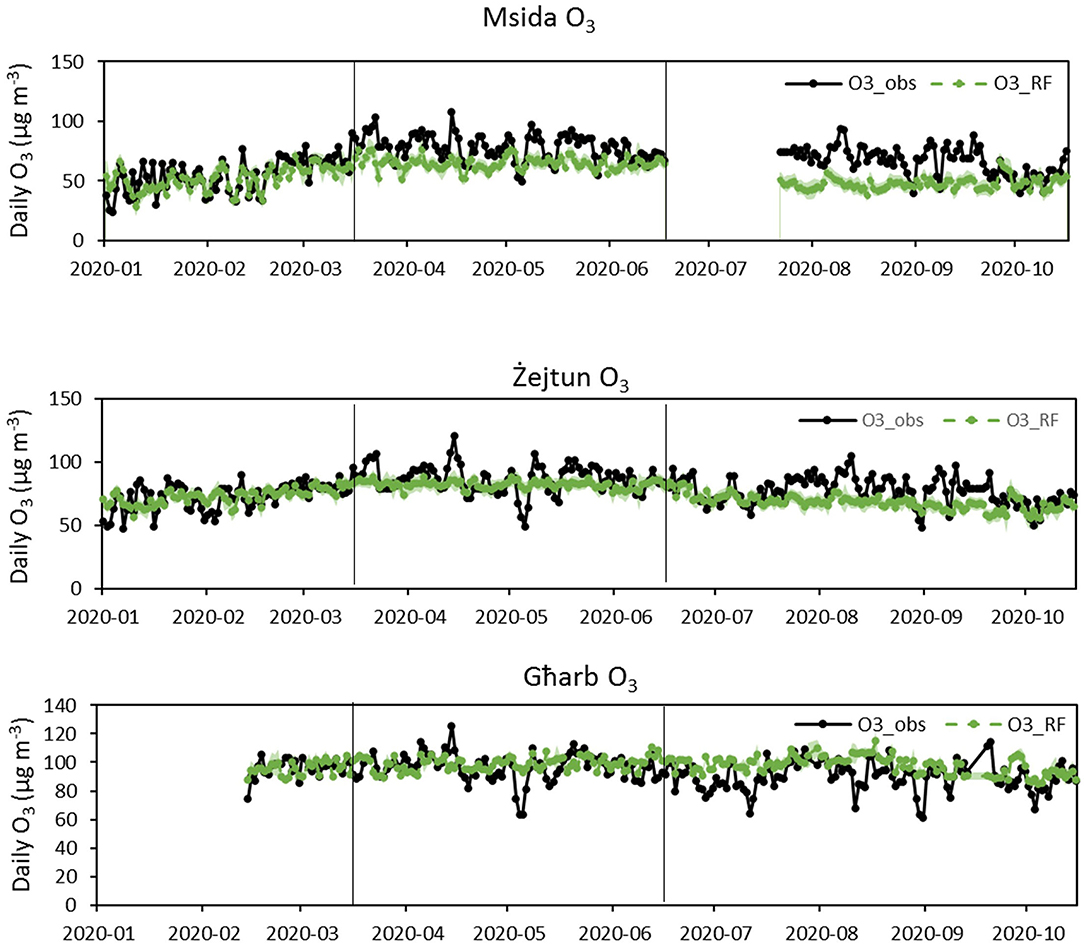
Figure 5. Daily predicted (green) and measured (black) O3 concentrations at Msida, Żejtun and Għarb between the 1st January and 15th October 2020. Shaded green area indicates the 95% confidence interval of the O3 predictions. Vertical lines indicate the closure of schools on the 11th March and the end of the public health emergency on the 15th June 2020.
The differences between measured and predicted O3 concentrations are lower for Żejtun and range between an increase of 4 and 20% for June and September, respectively. In contrast, measured O3 concentrations at Għarb are generally lower than those predicted by up to 11% in August. Being a secondary pollutant, O3 production and balance depends on various factors such as time of day which impacts the photolysis production of O3 as well as availability of precursor emissions. In our results we note that as the NO2 concentrations decrease during the restrictive period, the O3 concentrations increased as compared to a business as usual scenarios. This is linked to a reduced titration effect of O3 by NO thus, resulting in higher O3 concentrations. Therefore, suggesting a larger contribution from local chemistry as opposed to long-range transport as Ox (O3 + NO2) levels are largely unaltered following the COVID-19 restrictions (not shown). In contrast, as the relationship between O3 and NOx is non-linear, in locations with low levels of NOx such as the background site of Għarb, as NO2 levels decrease so do the O3 levels (NOx-limited environment; refer to Section “Discussion”).
Changes in the Attributable Fraction Associated With Short-Term Exposure to Daily Maximum NO2 and MDA8 O3
In this section, we present the calculated monthly mean attributable fraction (AF) associated with short-term exposure to daily 1 h maximum NO2 concentrations and daily maximum 8-h running mean (MDA8) O3 concentrations in Msida following the method described in Section 2.5 (Figure 6). The AF associated with short-term exposure to measured NO2 concentrations in Msida, ranges between 0.9 (CI: 0.54%, 1.27%) and 2.2% (CI: 1.32%, 3.10%) of all-cause mortality (Figure 6, left). In contrast, we note a smaller range for the estimated AF based on predicted NO2 concentrations ranging between 1.7 (CI: 1.01%, 2.39%) and 2.4% (CI: 3.38%, 1.44%). As the AF mostly depends on the pollutant concentrations (Equations 1 and 2), the difference between the two estimates increases as the COVID-19 measures became more stringent (March–April) with a maximum AF difference of −0.9% of all-cause mortality in April and May. This is directly linked to lower measured NO2 concentrations following lower traffic counts and emissions from other sources brought about by the respective COVID-19 regulatory measures. The AF estimated from the measured NO2 concentrations in Msida, lie outside the 95% CI for the AF estimated using the predicted concentrations between April and September (Figure 6, left). Thus, suggesting a greater confidence in the differences observed.
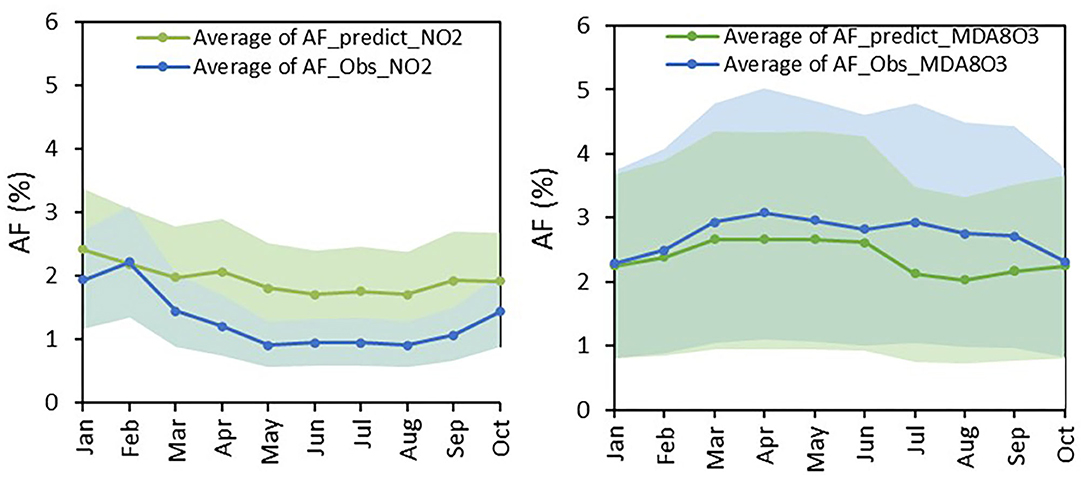
Figure 6. Monthly mean Attributable Fraction (AF; expressed as a percentage of daily all-cause mortality) associated with short-term exposure to (Left) daily mean 1 h maximum NO2 and (Right) MDA8 O3 concentrations in Msida between January and October 2020 using both measured (blue) and predicted (green) concentrations. Shaded areas represent the 95% confidence interval of the respective CRF used.
The AF associated with short-term exposure to MDA8 O3 in Msida ranges from 2.29 (CI: 0.81%, 3.75%) to 3.08% (CI: 1.10%, 5.03%), and from 2.03 (CI: 0.72%, 3.32%) to 2.67% (CI: 0.95%, 4.35%) when using the measured and predicted MDA8 O3 concentrations, respectively. The higher AF for both predicted and measured MDA8 O3 concentrations as compared to the NO2-related estimates is partly due to a higher CRF used to calculate the MDA8 O3-related health impact (Section 2.6). As discussed in Section “Changes in the Attributable Fraction Associated With Short-term Exposure to Daily Maximum NO2 and MDA8 O3,” measured MDA8 O3 concentrations are generally higher compared to the predicted concentrations with small differences between the two datasets. This results in higher AF estimates for measured MDA8 O3 concentrations with a maximum of 0.8% in July as compared to the AF in the absence of COVID-19 measures. The 95% CI for both estimates largely overlap, which suggests a lower confidence in the differences observed as compared to the NO2-related health impacts. Although the AF, expressed as a percentage may seem small, this represents the percentage of all-cause daily mortality associated with short-term air pollution exposure. A direct comparison is not possible however, the AF associated with long-term exposure to NO2 in Msida, is estimated at 4.38% (CI: 1.78%, 6.92%) for 2015 (Fenech and Aquilina, 2020). However, it is important to note that the latter estimate represents a percentage of annual (not daily) all-cause mortality and with a different CRF (corresponding to long-term and not short-term effects).
Discussion
Results presented in this study have quantified the impact of the COVID-19 restrictions on NO2 and O3 concentrations in three stations in the Maltese Islands. By using a random forest ML model trained on NO2 concentrations, meteorological parameters and other time variables between 2008 and 2017, we predict a counterfactual business as usual scenario between January and October 2020 to represent NO2 concentrations in the absence of any COVID measures. In general, our results suggest lower NO2 concentrations in all stations due to the restrictive COVID-19 measures by up to 54% at the traffic site of Msida (~21μg m−3). However, the reductions are lower at the background site of Għarb. Conversely, we note increases in O3 concentrations in Msida and Żejtun following the closure of schools and other restrictive measures reaching a maximum increase of 61% in Msida (~28 μg m−3). However, measured O3 concentrations in the background site of Għarb are generally lower during the COVID-19 period by up to 11% (~ 11 μg m−3) in August. In this study we also estimate the differences in attributable fraction associated with short-term exposure to daily maximum NO2 and MDA8 O3 concentrations. In Msida, the AF is up to 0.9% lower and 0.8% higher for measured NO2 and MDA8 O3 concentrations, respectively. While these values appear to be small, they represent the percentage of the daily all-cause mortality.
Our results are in agreement with recent literature suggesting a decrease in NO2 concentrations correlating with the timing of various COVID-19 restrictive measures across the globe (Keller et al., 2020; Menut et al., 2020; Petetin et al., 2020; Putaud et al., 2020; Sicard et al., 2020; Siciliano et al., 2020; Tobías et al., 2020). The methods used to determine the COVID-19 impact on NO2 concentrations differ between the different studies, with decreases in NO2 concentrations ranging between −9.7% in rural areas in Western Europe (Menut et al., 2020) and −65% in traffic stations across four European cities (Sicard et al., 2020). Similarly to what we note for the Msida station, the amplified reductions in NO2 concentrations at traffic stations, are also outlined by a number of European studies (e.g., Petetin et al., 2020). The O3 response to changes in NOx emissions is a complex one due to competing effects of non-linear chemistry. Increases in O3 concentrations is reported in literature reaching up to 50% in Barcelona likely due to a reduction in O3 titration by NO (Tobías et al., 2020). However, using the NASA GEOS-CF model across 46 countries, Keller et al. (2020) find the overall impact on daily mean O3 concentrations between February and June 2020 to be small. Additionally, using the WRF-CHIMERE model in Western Europe, Menut et al. (2020) suggest differences in O3 concentrations ranging from −2.45% to +6.7% across rural and urban areas. While our results show increases in O3 concentrations in the traffic and urban background site of Msida and Żejtun, we note decreases in O3 concentrations in the background site of Għarb. O3 concentrations depend on a number of factors which include the availability of precursor emissions, season, surrounding environment as well as meteorological conditions (Seinfeld and Pandis, 2016). The difference in the O3 response at urban vs. rural regions is driven by changes in the ratio of VOC (volatile organic compounds) to NOx concentrations which determine the chemical regime. Put simply, following large reductions in NOx emissions, O3 concentrations are expected to increase in urban areas (VOC-limited regime) but decrease in rural areas (NOx-limited regime) (Monks et al., 2015). In addition, increases in O3 concentrations can be linked to an increase in temperatures and insolation between February and April (Tobias et al., 2020).
Limitations
One main caveat of the method presented in this study is the use of meteorological data from one station in Luqa, to present the meteorological conditions at all the air pollution stations as this is the only one available. Given the small size of the Maltese Islands, we do not expect the meteorology to vary greatly between the Luqa stations and the air pollution stations in Malta (Msida and Żejtun). However, larger differences may exist between Luqa and the Għarb station situated in Gozo, as this station is furthest away and in a background environment. In our method we do not take into consideration the feedback driven by the COVID-19-related changes in air pollutants on the local weather conditions during the study period (e.g., through cloud interactions and radiative fluxes). Thus, our method uses the unaltered weather conditions for the business as usual scenario and does not account for business as usual weather conditions which would nonetheless be problematic to determine given the complex nature of the atmosphere. In addition, the use of daily data instead of hourly data to train the models, does not account for diurnal variability such as for example sea breeze effects which could have an impact on model performance especially given the nature of the Maltese Islands.
In our estimation to determine the COVID-19-related changes in AF associated with short-term exposure to NO2 and O3 due to changes in air pollution levels, we only estimate exposure to outdoor air pollution levels and neglect indoor exposure. Thus, our results do not represent the total exposure, which during the COVID-19 restrictions occurred mostly in the home environment. Lastly, in our AF calculations we use CRFs which are not based on local data, but which are widely used in literature and are derived from studies with similar air pollution ranges, as such local data is unavailable.
Conclusion
In this study we used a machine learning approach to predict the NO2 and O3 concentrations under a business as usual scenario driven by measured meteorological data as independent parameters. The COVID-19 impact on air pollution concentrations is then determined by subtracting the measured concentrations from those predicted. Our results suggest statistically significant reductions in NO2 concentrations for all three stations considered with larger reductions in the traffic site of Msida. In contrast, we note increases in O3 concentrations in Msida and Żejtun but decreases in Għarb. Consequently, in Msida the AF associated with short-term exposure to daily 1-h maximum NO2 concentrations is lower during the COVID-19 restrictions while the O3-related AF is higher.
Results presented in this study further confirm what is noted in literature with regards to the impact of the COVID-19 measures on air pollutant concentrations. This study is the first to quantify these impacts in Malta together with an estimate of the associated changes in AF. Our results also highlight that while policies to reduce one pollutant such as NO2 could be beneficial, this will inevitable alter the atmospheric chemical balance and may lead to increases in other pollutants such as O3. Thus, in a future where NO2 emissions are targeted to decrease by similar levels to those observed during the pandemic, the burden to control O3 levels will be enhanced. Therefore, policies should focus on limiting O3 precursors such as VOCs which are very limited and not routinely measured across Europe.
Data Availability Statement
The data analyzed in this study is subject to the following licenses/restrictions: All datasets can be made available upon request from the respective entities listed in the acknowledgments section. Requests to access these datasets should be directed to Sara Fenech, sara.fenech@um.edu.mt.
Author Contributions
SF and NA conceptualized and designed this study. RV contributed to data analysis of satellite data while SF prepared data and analysis of surface measurements and health calculations. SF drafted the manuscript. NA and RV performed the quality assessment and revised the manuscript. All authors have read and approved the submitted version.
Conflict of Interest
The authors declare that the research was conducted in the absence of any commercial or financial relationships that could be construed as a potential conflict of interest.
Acknowledgments
The authors would like to thank Nadine Mercieca and Michael Nolle from the Environment and Resource Authority for the provision of all the monitoring data used in this study and Joseph Schiavone and Lianne Rapinett from the Luqa Met Office at the Malta International Airport for the provision of all the meteorological data. We would also like to thank Patrick Cachia for the long-term traffic counts provided, courtesy of Transport Malta, in particular the transport strategy team of the Integrated Transport Strategy Directorate. RV is sponsored by the Malta Council for Science and Technology (MCST), within the Parliamentary Secretariat for Financial Services and Digital Economy, through an agreement between MCST and the European Space Agency.
References
Collivignarelli, M. C., Abbà, A., Bertanza, G., Pedrazzani, R., Ricciardi, P., and Carnevale, M. (2020). Lockdown for CoViD-2019 in Milan : what are the effects on air quality? Sci. Total Environ. 732, 1–9. doi: 10.1016/j.scitotenv.2020.139280
COMEAP (2015). Quantification of Mortality and Hospital Admissions Associated With Ground-Level Ozone.
Fenech, S., and Aquilina, N. J. (2020). Trends in ambient ozone, nitrogen dioxide, and particulate matter concentrations over the Maltese Islands and the corresponding health impacts. Sci. Total Environ. 700:134527. doi: 10.1016/j.scitotenv.2019.134527
Grange, S. K., and Carslaw, D. C. (2020). Using meteorological normalisation to detect interventions in air quality time series. Sci. Total Environ. 653, 578–588. doi: 10.1016/j.scitotenv.2018.10.344
Grange, S. K., Carslaw, D. C., Lewis, A. C., Boleti, E., and Hueglin, C. (2018). Random forest meteorological normalisation models for Swiss PM 10 trend analysis. Atmos. Chem. Phys. 18, 6223–6239. doi: 10.5194/acp-18-6223-2018
Kanniah, K. D., Zaman, N. A. F. K. Z., Kaskaoutis, D. G., and Talib Latif, M. (2020). COVID-19's impact on the atmospheric environment in the Southeast Asia region. Sci. Total Environ. 745:142200. doi: 10.1016/j.scitotenv.2020.142200
Keller, C. A., Evans, M. J., Knowland, K. E., Hasenkopf, C. A., Lucchesi, R. A., Oda, T., et al. (2020). Global impact of COVID-19 restrictions on the surface concentrations of nitrogen dioxide and ozone. Atmos. Chem. Phys. Discuss. [Preprint]. doi: 10.5194/acp-2020-685
Menut, L., Bessagnet, B., Siour, G., Mailler, S., Pennel, R., and Cholakian, A. (2020). Impact of lockdown measures to combat Covid-19 on air quality over western Europe. Sci. Total Environ. 741:140426. doi: 10.1016/j.scitotenv.2020.140426
Monks, P. S., Archibald, A. T., Colette, A., Cooper, O., Coyle, M., Derwent, R., et al. (2015). Tropospheric ozone and its precursors from the urban to the global scale from air quality to short-lived climate forcer. Atmos. Chem. Phys. 15, 8889–8973. doi: 10.5194/acp-15-8889-2015
Petetin, H., Bowdalo, D., Soret, A., Guevara, M., Jorba, O., and Serradell, K. (2020). Meteorology-normalized impact of the COVID-19 lockdown upon NO2 pollution in Spain. Atmos. Chem. Phys. 20, 11119–11141. doi: 10.5194/acp-20-11119-2020
Public Health Act (2020a). L.N. 40 of 2020: Period of Quarantine Order, 2020. [online] Available online at: https://legislation.mt/LegalNotices (accessed January 11, 2021).
Public Health Act (2020b). L.N. 41 of 2020: Closure of Schools Order, 2020. [online] Available online at: https://legislation.mt/LegalNotices (accessed January 11, 2021).
Public Health Act (2020c). L.N. 95 of 2020: Closure of Non-Essential Retail Outlets and Outlets Providing Non-Essential Services Order, 2020. [online] Available online at: https://legislation.mt/LegalNotices (accessed January 11, 2021).
Putaud, J.-P., Pozzoli, L., Pisoni, E., Santos, S. M., Dos, L.agler, F., Lanzani, G., et al. (2020). Impacts of the COVID-19 lockdown on air pollution at regional and urban background sites in northern Italy. Atmos. Chem. Phys. Discuss. [Preprint]. 1–18. doi: 10.5194/acp-2020-755-supplement
Seinfeld, J. H., and Pandis, S. N. (2016). Atmospheric Chemistry and Physics: From Air Pollution to Climate Change, 3rd Edn. John Wiley and Sons, Inc. [online] Available online at: https://books.google.com.mt/books?id=n_RmCgAAQBAJ&printsec=frontcover&dq=Seinfeld+and+pandis+2016&hl=en&sa=X&ved=2ahUKEwjojLPWlpTuAhUDiIsKHULEARQQ6AEwAHoECAAQAg#v=onepage&q=Seinfeld%20and%20pandis%202016&f=false (accessed January 11, 2021).
Sicard, P., Marco, A., De, A.gathokleous, E., Feng, Z., Xu, X., Paoletti, E., et al. (2020). Amplified ozone pollution in cities during the COVID-19 lockdown. Sci. Total Environ. 735:139542. doi: 10.1016/j.scitotenv.2020.139542
Siciliano, B., Dantas, G., Cleyton, M., and Arbilla, G. (2020). Increased ozone levels during the COVID-19 lockdown : analysis for the city of Rio de Janeiro, Brazil. Sci. Total Environ. 737:39765. doi: 10.1016/j.scitotenv.2020.139765
Stacey, B., and Bush, T. (2002). Preliminary Assessment of Air Quality in Malta. Culham: AEA Technology Environment Culham Science Centre.
Tobías, A., Carnerero, C., Reche, C., Massagué, J., Via, M., Minguillón, M. C., et al. (2020). Changes in air quality during the lockdown in Barcelona (Spain) one month into the SARS-CoV-2 epidemic. Sci. Total Environ. 726:138540. doi: 10.1016/j.scitotenv.2020.138540
WHO (2013). Health Risks of Air Pollution in Europe—HRAPIE Project: Recommendations for Concentration-Response Functions for Cost-Benefit Analysis of Particulate Matter, Ozone and Nitrogen Dioxide. [online] Available online at: http://www.euro.who.int/__data/assets/pdf_file/0006/238956/Health_risks_air_pollution_HRAPIE_project.pdf?ua=1 (accessed January 11, 2021).
Keywords: COVID-19, health effects, nitrogen dioxide, ozone, machine learning, counterfactual
Citation: Fenech S, Aquilina NJ and Vella R (2021) COVID-19-Related Changes in NO2 and O3 Concentrations and Associated Health Effects in Malta. Front. Sustain. Cities 3:631280. doi: 10.3389/frsc.2021.631280
Received: 19 November 2020; Accepted: 05 January 2021;
Published: 28 January 2021.
Edited by:
Jennifer Ann Salmond, The University of Auckland, New ZealandReviewed by:
Stuart Grange, Swiss Federal Laboratories for Materials Science and Technology, SwitzerlandNick Talbot, Auckland Council, New Zealand
Perry Davy, GNS Science, New Zealand
Copyright © 2021 Fenech, Aquilina and Vella. This is an open-access article distributed under the terms of the Creative Commons Attribution License (CC BY). The use, distribution or reproduction in other forums is permitted, provided the original author(s) and the copyright owner(s) are credited and that the original publication in this journal is cited, in accordance with accepted academic practice. No use, distribution or reproduction is permitted which does not comply with these terms.
*Correspondence: Sara Fenech, sara.fenech@um.edu.mt