Article

Resilience of Smart Cities to the Consequences of the COVID-19 Pandemic in the Context of Sustainable Development

1
Department of Applied Social Sciences, Faculty of Organization and Management, Silesian University of Technology, 41-800 Zabrze, Poland
2
JSofteris, 41-219 Sosnowiec, Poland
3
Department of Financial Technologies and Entrepreneurship, Sumy State University, 40000 Sumy, Ukraine
4
The London Academy of Science and Business, London W1U 6TU, UK
5
Economic Cybernetics Department, Sumy State University, 40000 Sumy, Ukraine
*
Author to whom correspondence should be addressed.
Sustainability 2022, 14(19), 12645; https://doi.org/10.3390/su141912645
Submission received: 9 September 2022 / Revised: 30 September 2022 / Accepted: 1 October 2022 / Published: 5 October 2022
(This article belongs to the Special Issue COVID-19 and Urban Inequalities: Spatial and Digital Dimensions)

Abstract

:
The development of digital technologies is one of the factors influencing the cities’ readiness for the COVID-19 breakout. The purpose of this article is to assess cities’ resilience to the COVID-19 pandemic depending on the “smart” level criteria. The article uses the following research methods: (1) bibliometric analysis to identify the main directions of scientific research regarding “COVID-19” and “smart city” in Scopus publications for 2019–2022; (2) k-means clustering method to identify common patterns among smart cities regarding their readiness and responsiveness to COVID-19; (3) correlation analysis to identify the relationships between smart city performance indicators and COVID-19 severity in these cities. The Smart City Index 2021 was a key criterion for classifying a city as smart for this study. The correlation analysis included two stages: (1) correlation analysis of the Smart City Rank and indicators of COVID-19 readiness and responsiveness; (2) correlation analysis of the Smart City Rank and its health care components and COVID-19 severity indicators. According to the study results, smart cities demonstrated higher COVID-19 readiness and lower COVID-19 fatality rates. However, they lag behind in terms of resilience and sustainability of their health care systems.

1. Introduction

Digital technologies make an integral part of the information society and modern digital transformation to improve and optimize processes in modern cities [1,2,3,4,5,6,7]. The COVID-19 pandemic has become an impetus for a more intensive and widespread implementation of digital technologies in the economy and society. Digital technologies have become a means of adapting people, businesses and authorities to new living and working conditions during the lockdown [8,9,10,11,12]. They are also considered as tools for achieving macroeconomic stability and sustainability in pandemic and post pandemic periods [13,14,15,16]. On the other hand, the level and nature of digital technologies implemented in cities and communities was one of the factors of their resilience to the negative consequences of the COVID-19 pandemic. The main types of such digital technologies are artificial intelligence, the Internet of Things, Big Data, etc. [17,18,19,20,21,22,23,24].
The COVID-19 spread and response at the city level is receiving considerable attention from the world community. There are several reasons: firstly, the growing share of the urban population, which already makes up more than half of the global population; higher population density in urban areas, which increases the risk of spreading viral diseases due to a greater number of social contacts; higher vulnerability to the economic consequences of the pandemic, etc.
On the one hand, the increase in the general level of digitalization, and on the other hand, the increase in the urbanization level, formed a scientific interest in how these two significant trends of modern development have played during COVID-19 outbreak. Thus, the purpose of the article is to assess the resilience of cities to the COVID-19 pandemic depending on the “smart” level criteria. The hypothesis of the study is that smart cities have higher resilience to COVID-19 compared to conventional cities; thus, the higher the rating of a city according to the “smart city” criteria, the lower its COVID-19 severity indicators.
While investigating the impact of COVID-19 on smart cities, one should note that the pandemic affected all spheres of human life and all economic sectors. Certainly, this impact manifested itself in different ways. Some areas were affected more than others, and some, in contrast, received an impetus for development (such as e-commerce, telemedicine, online educational platforms and almost everything that works online).
The studies of Organization for Economic Co-operation and Development (OECD) highlighted the economic, social and environmental impacts of COVID-19 on cities [25]. Smiianov V. A. and others (2020) analyze the impact of COVID-19 in terms of three components: environmental factor, health and population, economic factor [26].
A significant amount of research is devoted to the specific consequences of the COVID-19 pandemic, such as pandemic impact on the supply chains [27], anti-money laundering scenarios [28], small and medium-sized enterprises (SMEs) and corporate governance [29], migrants’ remittances [30], green bond market [31], etc. Another direction of scientific research consists of works that analyze the issues of COVID-19 response [32,33], post-COVID-19 recovery [34] and vaccination [35].
Considerable attention is paid to the study of the economic consequences of COVID-19 and its impact on the economic sectors, especially those most affected by the pandemic. Thus, a significant number of scientific works are devoted to the impact of the COVID-19 on the transport industry, and in particular, public transport [36,37,38,39], retail trade and services in general [40], etc.
Given the objectives of this research, studies devoted to the pandemic impact on the implementation of digital technologies in smart cities are of great interest. Firstly, COVID-19 breakout led to a change in priorities in the implementation of smart city projects [41,42]; secondly, it created a demand for faster implementation and active use of smart technologies in work processes and everyday life [43,44]; thirdly, smart city projects were applied to combat COVID-19 [45].
Using the method of regression analysis, Yang S. and Chong Z. (2021) empirically confirmed that the implementation of smart city projects in China decreased the number of COVID-19 confirmed cases [45]. In the analysis of the Indian cities response to the pandemic, the researchers came to the opposite conclusion: smart cities in India demonstrated high COVID-19 morbidity and mortality rates. The authors justified this by the lack of initiatives to link marginalized citizens with information technologies and the strengthening of the digital divide during the pandemic [46]. Li F. arguing that there is a connection between digital exclusion and the pandemic outcomes (such as COVID-19 incidence, mortality and vaccination) based on county-level analysis in the United States [47].
Thus, currently there are studies on the dependence of the performance and resilience of smart cities in the conditions of the COVID-19 pandemic on smart technology indicators. However, these studies are limited to certain regions or countries. At the same time, global studies of the impact of COVID-19 on smart cities mostly focus on certain industries or spheres of activity. Thus, there is a research gap in studies of the pandemic impact on smart cities and their resilience to COVID-19 depending on the smart city rating, which determined the relevance and scientific significance of this study.

2. Materials and Methods

2.1. Bibliometric Analysis

The methodology of bibliometric analysis includes two stages: (1) data collection and preparation; (2) data visualization. The Scopus database was chosen as the data source for the first stage of bibliometric analysis as one of the most prestigious databases of scientific journals. The publications in the Scopus database were selected in the field “Title, abstract, keywords”, according to the following search queries: “smart city” and “COVID-19”. The obtained results were filtered by language: only English was selected, and by publication type: articles, conference papers, books and book chapters were included. The period of publications for analysis is 2019–2022. The second stage of bibliometric analysis was implemented using VOSviewer v.1.6.18 software (Van Eck and Waltman, Univeristeit Leiden, Leiden, The Netherlands). Visualization map of scientific publications was formed based on selected Scopus publications.

2.2. Databases and Index Calculation

Existing measurement frameworks of smart cities usually include several dimensions and some indicators. Since different lists of indicators are formed and different weights are applied to them, the results of evaluating the smart cities’ performance can differ significantly across the studies. Table 1 presents the results of evaluating smart cities according to some of the existing approaches, which focus on sustainability, living quality, innovation and smart government.
According to Table 1, some of the cities are in the top 10 of different rankings, although in different positions. However, according to the considered approaches, the results of smart cities’ evaluating significantly differ.
Having analyzed the methodology, components and indicators used to evaluate smart cities performance in various frameworks, the Smart City Index 2021 was chosen as the key criterion for classifying a city as smart for this study.
The Smart City Index (SCI) is calculated based on survey data in terms of two pillars: structure and technology. Each of the pillars includes a set of indicators in five key areas. The number of indicators in each group is different, the general scheme of the formation of the SCI by pillars and key areas is shown in Figure 1.
Each indicator included in SCI is measured on a scale from 0 to 100. The same scale is used for key areas and pillars, their scores are determined by calculating the average values of the indicators. The final value of the SCI is a weighted average, which, in addition to the results of the current year, considers the values of the two previous years in a ratio of 3:2:1. The Smart City Rank is formed based on the comparison of SCI results, the city with the highest SCI score is assigned 1st position in the ranking [48].
The main motives for using the Smart City Index as the main indicator of a smart city in this research are:
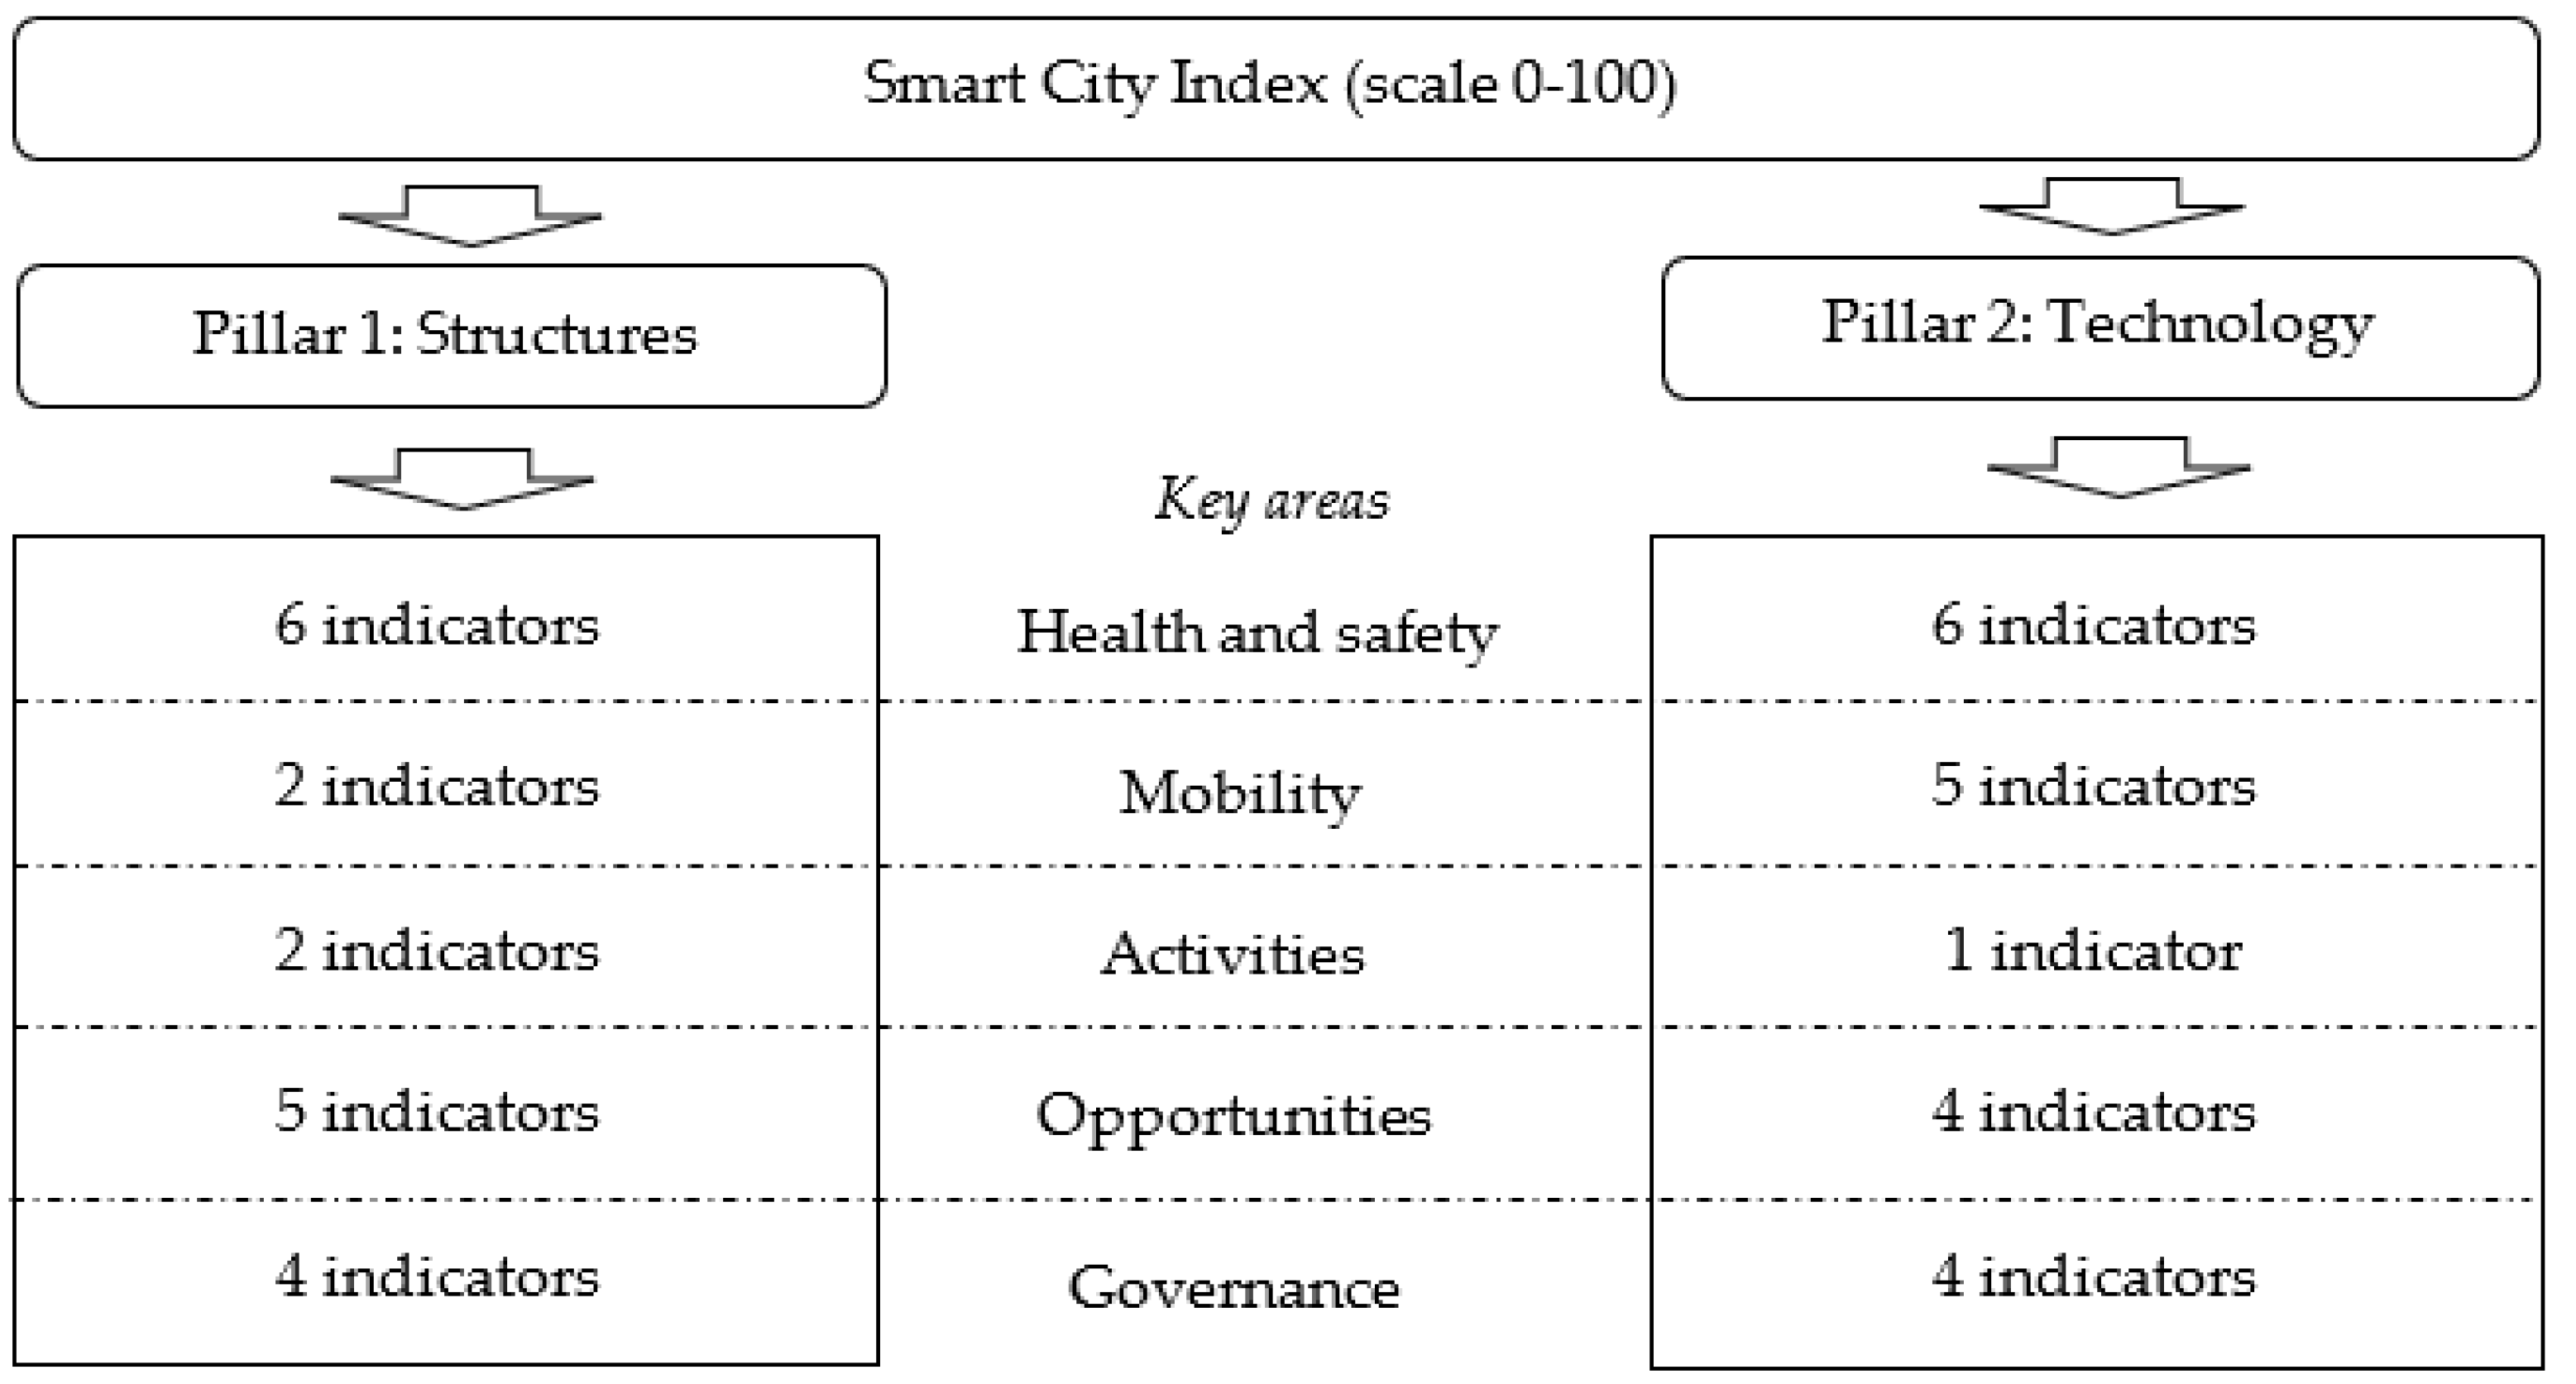
  • The purpose of the Smart City Index is to evaluate and rank cities based on the assessment of structures and technology applications available to the city residents in different areas, unlike other indices, in which the priority is sustainability, prosperity, governance, etc.
  • The Index is calculated annually; the 2021-report is based on the data of 2019–2021 (survey results for these years are used in the calculation of the final score with the weight of 3:2:1 for 2021:2020:2019), corresponding to the period selected in the study of the smart cities’ resilience to COVID-19;
  • The Smart City Index provides a comprehensive assessment of cities, including various aspects of their functioning, such as health and safety, mobility, activities, opportunities and governance. It is important to have scores for the health and safety component, allowing a detailed analysis to be carried out in this direction in terms of COVID-19;
  • Publicly available data for all cities regarding Smart City Rank indicators and their scores by specific areas;
  • The report on the Smart City Index 2021 includes 118 cities, which ensures the sufficiency of the sample for the analysis.
The COVID-19 pandemic made it necessary to review the indicators used to describe the development and performance of smart cities. In response to the need to track the current situation with COVID-19 in the largest cities and administrative centers, The United Nations Human Settlements Programme (UN habitat) in cooperation with CitiiQ developed the COVID-19 city tracker [54]. The tracker allows cumulative and average coronavirus cases to be tracked. In addition, the platform provides integral indicators of the COVID-19 Readiness Score and a COVID-19 Responsiveness Score on a scale of 0–100 for more than 1000 cities.
The Readiness Score is calculated based on five indicators: public health capacity, societal strength, economic ability, infrastructure and national collaborative will. In turn, the calculation of the Responsiveness Score includes assessments in four directions: spread response, treatment response, economic response and supply chain response. In this study, the above nine indicators were used to analyze the COVID-19 readiness and responsiveness specifically for smart cities.
In addition, the number of coronavirus cases and number of coronavirus deaths cases were used to characterize the severity of COVID-19. The statistical base was made up of data from open sources, including the COVID-19 Data Repository by the Center for Systems Science and Engineering (CSSE) at Johns Hopkins University [55] and the COVID-19 Cities Readiness and Response Tracker [54]. To ensure data comparability, the number of coronavirus diseases and deaths cases per 100,000 inhabitants were used.
The cumulative number of coronavirus cases and number of coronavirus deaths were taken on two dates: 1 January 2021, and 1 January 2022. The first period best reflects the first shocks from the COVID-19 breakout and the response of smart cities to the pandemic. The second period considers the ability of smart cities to adapt and resist, to ensure better comparability of smart cities, considering the regional unevenness of the spread of pandemic waves in 2020. In addition, the second period already includes the first stage of vaccination of the population.

2.3. Cluster Analysis

Several methods, namely correlation and cluster analysis, were used to reveal the regularities of the relationship between smart city indicators and COVID-19 indicators. The authors used cluster analysis methods, namely the k-means clustering, to compare smart cities with each other and group them according to indicators of COVID-19 readiness and responsiveness, as well as to identify the criteria by which smart cities can be grouped into clusters. Cluster analysis allows the studied objects (cities) to be divided into homogeneous groups or clusters, taking into account several parameters at the same time. In cluster analysis, the similarity between the studied objects is determined based on the calculation of distances between points, considering that each clustering object is represented by a point in an n-dimensional space (where n is the number of object parameters). Accordingly, the smaller the calculated value of the distance between the points, the more similar (homogeneous) the studied objects are [56]. The results of cluster analysis depend on the chosen method of calculating the distance between points. In this study, one of the most common and universal approaches to distance metrics is used—Euclidean distances.
Cluster analysis was implemented using Statistica version 10 software (Stat Soft, Inc., Tulsa, OK, USA). The analysis was carried out based on the values of nine indicators of COVID-19 cities’ readiness and responsiveness according to the UN Habitat methodology. Since all variables have the same measurement scale of 0–100 and are comparable, there was no need to normalize the indicators.
Cluster analysis can be implemented using different methods. The k-means clustering method was chosen for this study. The advantages of the k-means clustering method for the purposes of this study are the ability to adjust the number of clusters; an accurate distribution of smart cities by clusters and the ability to obtain the average values of the variables for the cluster as a whole and the deviation of the indicators of each smart city from the cluster average; and the ability to identify the key parameters by which smart cities were combined into a cluster. In this study, the number of clusters equal to four was established based on a gradual increase in the number of clusters, starting with two, and the analysis of the average values of the variables in the clusters and the Euclidean distances of the studied objects.
The distribution of cities by clusters in such a way that the cluster includes cities with the same level of smart technology implementation (neighbouring positions in the Smart City Rank) will be a confirmation of the proposed research hypothesis. The absence of a relationship between belonging to a cluster and the Smart City Rank is a refutation of the hypothesis.

2.4. Correlation Analysis

Correlation analysis was used to identify the presence of relationships between smart city performance indicators and COVID-19 severity in these cities. Correlation analysis included two stages. At the first stage, the correlations between Smart City Rank in 2021 and nine indicators of COVID-19 Cities Readiness and Responsiveness were investigated. At the second stage, the correlations between the Smart City Rank and the components characterizing the health care system in smart cities on the one hand, and COVID-19 severity indicators (coronavirus cases, coronavirus deaths and coronavirus fatality rate) on the other hand, were analysed.
In both cases, Pearson correlation coefficients were calculated for each pair of indicators. The Pearson correlation coefficient is used to determine the direction and strength of the linear relationship between variables. The correlation direction is determined by the sign of the correlation coefficient: a negative value of the coefficient indicates an inverse relationship between the variables (when one variable decreases, the other increases and vice versa); a positive value of the correlation coefficient indicates that the studied variables change unidirectionally.
The correlation coefficient can take values from −1 to 1. The closer the value of the coefficient is to 1 or to −1, the stronger the relationship between the studied variables. On the other hand, the correlation coefficient close to zero indicates a negligible correlation between the variables. The statistical significance of correlation coefficients was checked based on t-values and p-values. T-test allows us to find out if the sample correlation between variables is repeatable for the entire population. In turn, p-value is the probability that the correlation between variables in the sample data occurred by chance. The study used three levels of significance for the p-value: 0.01; 0.05 and 0.1). The correlation analysis method was implemented using Statistica 10 software.

3. Results

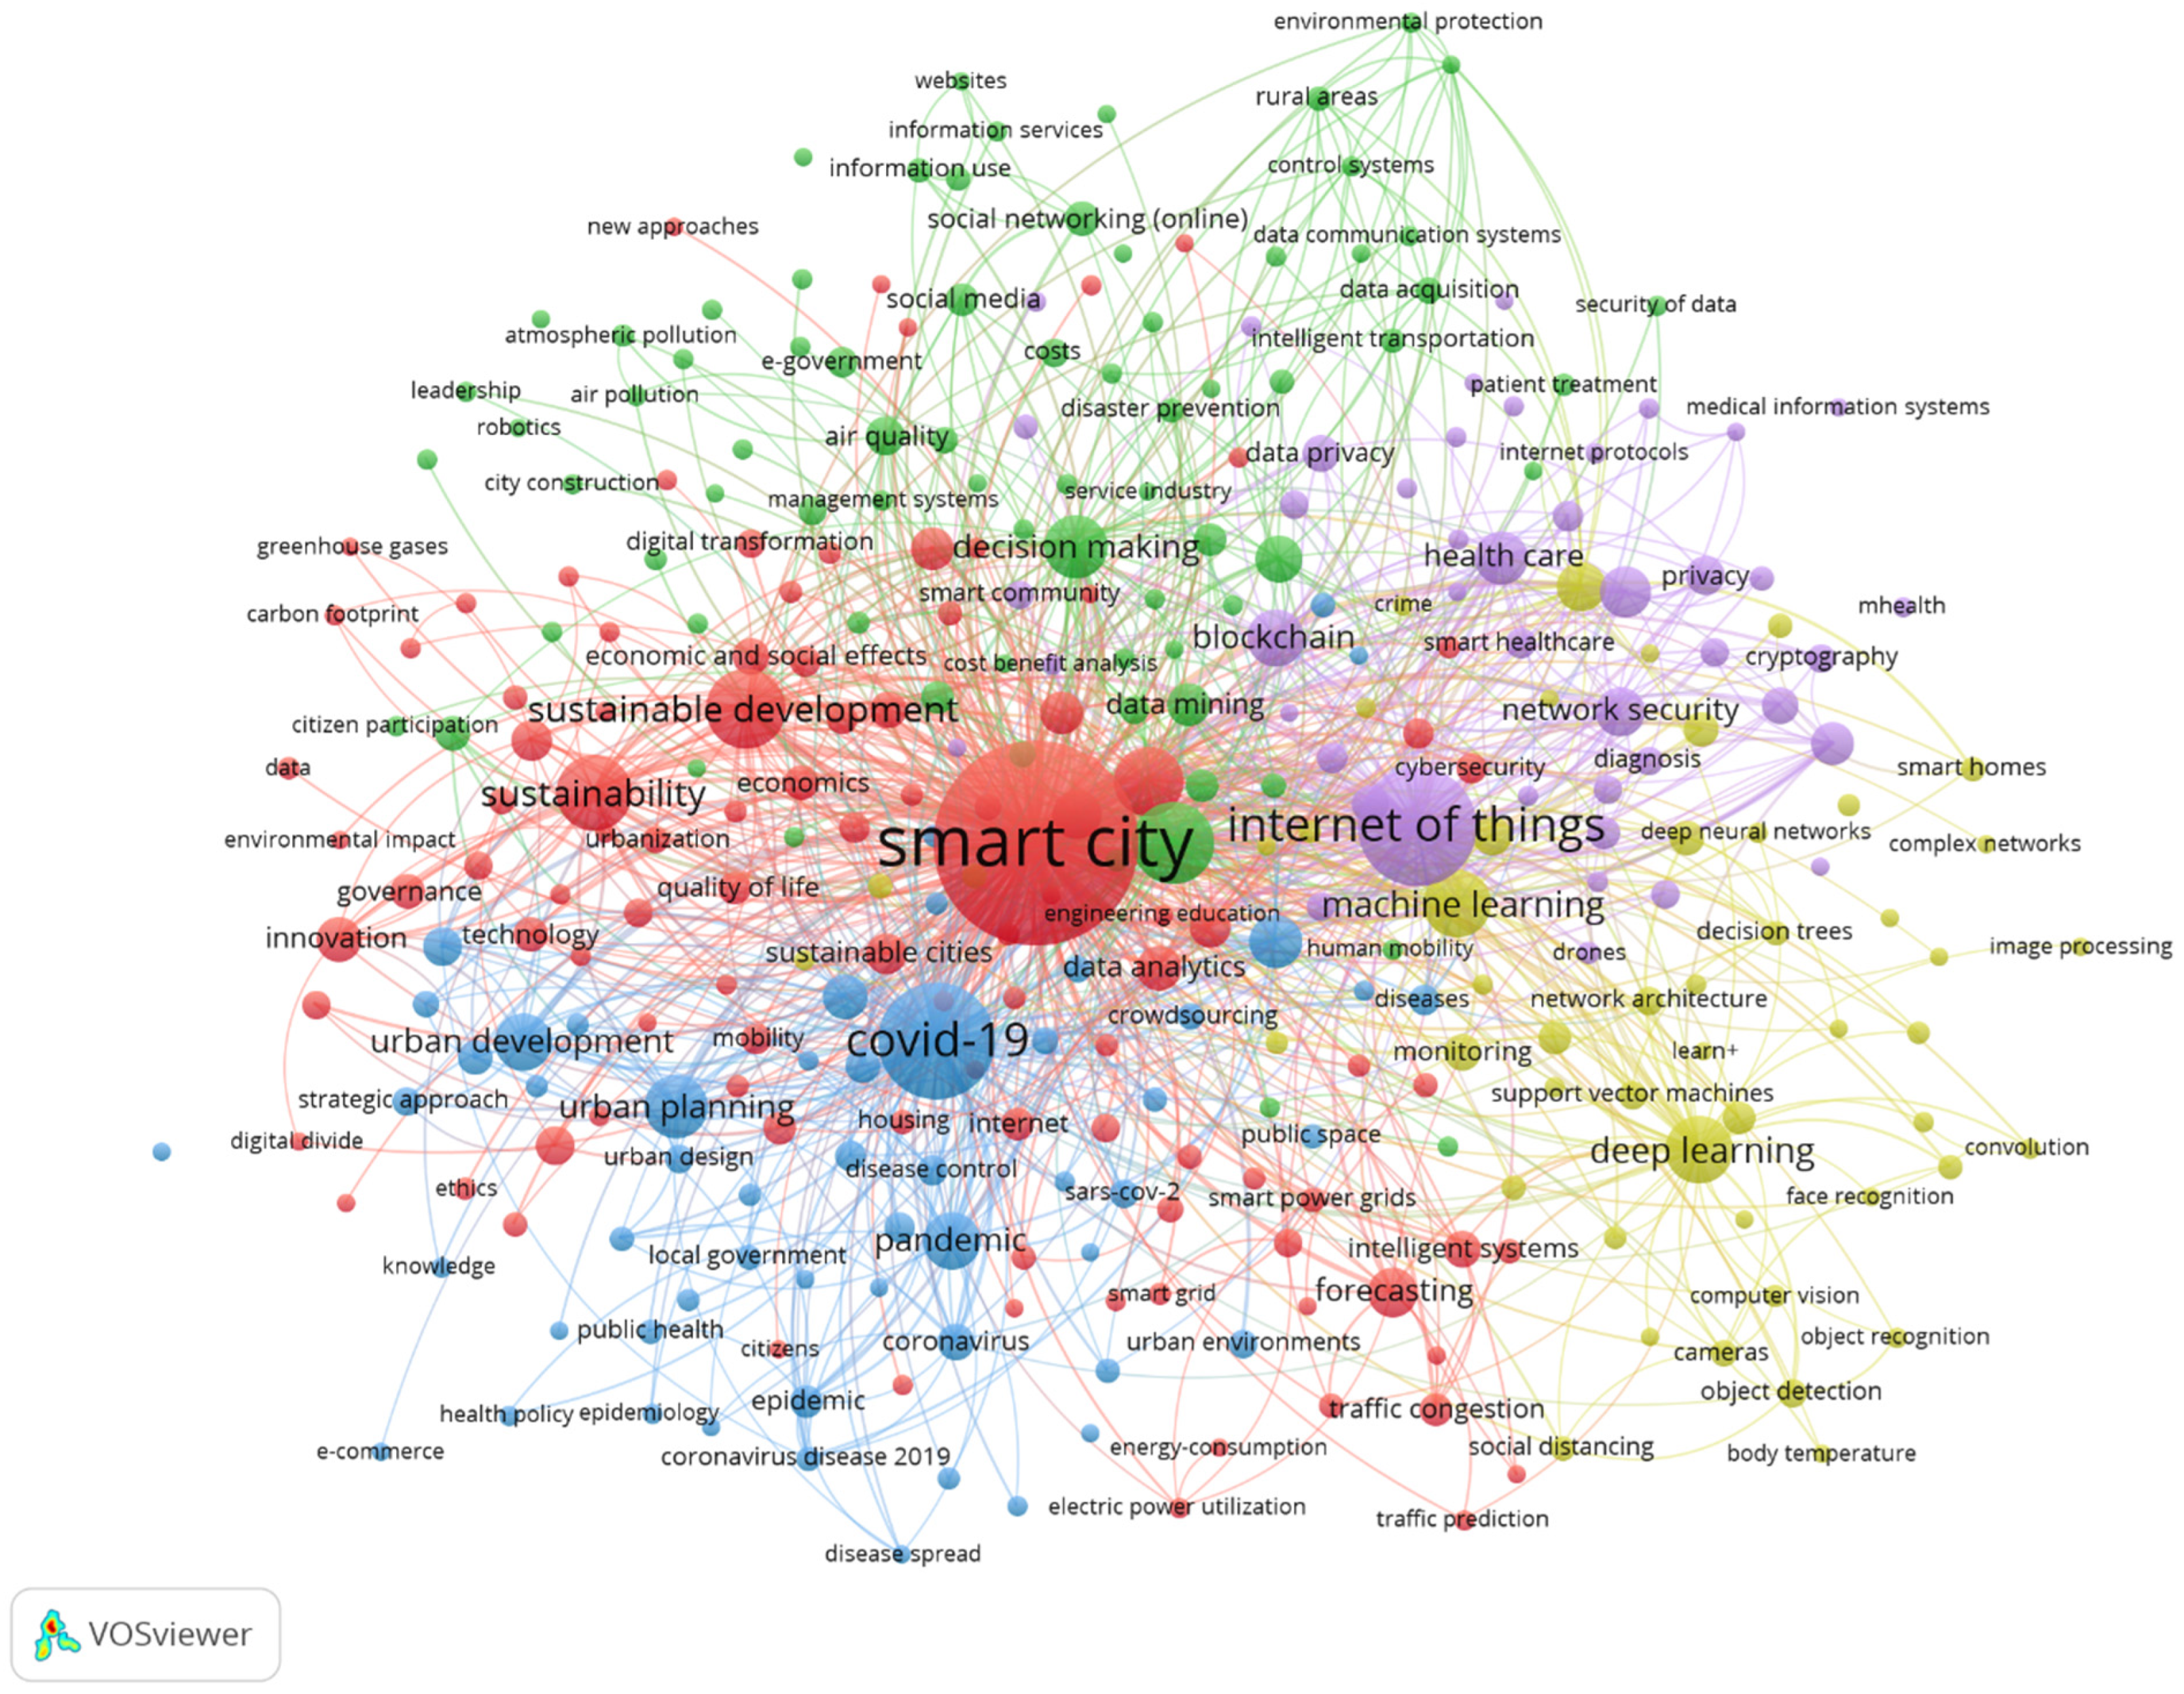
3.1. Bibliometric Analysis Results

The topic, which combines scientific research on COVID-19 and smart cities, has attracted considerable interest of scientists. Analytics of the Scopus database shows more than 1000 English-language articles simultaneously in these two directions during 2019–2022. There is a trend towards an increase in the number of such scientific publications; there are already 376 such articles in the Scopus database in the incomplete year of 2022. Considering the new waves of COVID-19 on the one hand, and the deepening of digitalization processes in society on the other hand, we can assume that this scientific direction will remain relevant in the following periods.
Moreover, one should note that scientific research of both smart cities and COVID-19 includes many scientific studies in different subject areas—computer science, social sciences, engineering, energy and others (according to Scopus analytics).
A bibliometric analysis based on the co-occurrence of the keywords was carried out using VOSviewer v.1.6.18 (Figure 2) to identify the key contextual directions of scientific research, which include the study of smart cities and COVID-19, and to clarify the points of intersection of research.
A bibliographic analysis conducted based on 1042 articles in Scopus during 2019–2022, using the co-occurrence criterion of all keywords that appeared in the publications at least five times, made it possible to identify five contextual clusters:
(1)
Smart city and sustainable development (red cluster);
(2)
Decision making (green cluster);
(3)
COVID-19 (blue cluster);
(4)
Machine learning (yellow cluster);
(5)
Internet of things (violet cluster).
Thus, scientists consider smart cities most often in the context of sustainable development, sustainable cities and innovation. At the same time, studies, where COVID-19 is one of the key aspects, form a separate cluster. In addition to publications directly about the pandemic and COVID-19, this cluster also includes those related to health policy, public health, urban planning and development. Given the significant share of publications related to COVID-19 and smart cities within computer science and engineering, several clusters have formed around the main types of digital technologies and innovations, namely the Internet of Things and machine learning. In addition, a significant share of publications on smart cities and COVID-19 is devoted to decision making, city management and data mining.
In more detail, the thematic orientation of publications on smart cities and COVID-19 is considered on the example of the most cited publications in Scopus for the period 2019–2022 (Table 2).
In most of works listed in Table 2, the authors focus their attention on the use of smart city technologies in the fight against the COVID-19 pandemic, as well as the problems and features of using these technologies during pandemic.
For example, Allam Z. and Jones D.S. (2020) [57] focused on the lack of standardization between smart city technology suppliers, which in the case of a pandemic makes productive communication between cities and data platforms impossible. The authors proposed to improve enhance standardization protocols for increased data sharing for a better understanding and controlling disease outbreaks and disasters.
Shorfuzzaman M., Hossain M.S. and Alhamid M.F. (2021) [62] revealed the limitations of video surveillance systems implemented in smart cities, which do not create sufficient opportunities to control the spread of the disease and monitor compliance with social distancing through mass video surveillance. Therefore, the authors developed a data-driven deep learning-based framework for a timely response to combat the COVID-19 pandemic through mass video surveillance.
The application of deep learning technology for monitoring through video surveillance and limiting the COVID-19 spread is also proposed in the study by Rahman M.M. and others (2020) [63]. However, the authors drew attention to the control over wearing masks in public places, which are monitored with Closed-Circuit Television (CCTV) cameras.
Yigitcanlar, T. and Cugurullo, F. (2020) [65] discuss in their study the directions of using artificial intelligence technologies in smart cities from the standpoint of ensuring their sustainability. In their work, the authors also drew attention to those areas of artificial intelligence technology that have become relevant in the conditions of COVID-19. This applies directly to health care (medical imaging analytics in public health diagnoses, community health monitoring using built-in sensors), as well as education (autonomous tutoring systems and personalized learning options).
In another work, Yigitcanlar T. and others (2020) [60] analyzed the opportunities and obstacles for the application of artificial intelligence for addressing planetary challenges, its use in healthcare practice and in the development of smart cities.
In some works, researchers place greater emphasis on the technological component of the efficiency of smart cities. For example, Tan L. and others (2021) [59] focused on the use of 5G technology (5th generation mobile networks), which is an integral component of the information model of service provision in modern cities. In the article, the authors discuss the risks of crowdsourcing and propose a blockchain-empowered and decentralized trusted service mechanism for improving the crowdsourcing system in 5G-enabled smart cities.
The use of technologies in increasing the efficiency and safety of smart cities is also studied in the work of Outay F., Mengash H.A. and Adnan M. (2020) [61]. The authors focused on such a variety of technologies as UAV (unmanned aerial vehicle) and analyzed the possibilities and barriers of their application in such three key areas as road safety, traffic monitoring and highway infrastructure management.
Another direction of research in the context of smart cities and COVID-19 is the analysis of the future post-pandemic development of smart cities. The authors of this group draw attention to the need to build resilience, inclusiveness and sustainability of smart cities.
Pineda V.S. and Corburn J. (2020) [66] discuss such an aspect as the inclusiveness of smart cities and emphasize the need for urban health reforms. Researchers analyze this issue from the point of view of the medical service availability for persons with disabilities and state that the higher mortality from COVID-19 of this category of people is due to a higher risk and imperfections in the health care systems.
Moreno C. and others (2021) [58] develop the “15-min city” concept. According to it, for the highest quality of life of city residents, the time for their essentials (places of residence and work, commerce, healthcare, education and entertainment) should not take more than 15 min on foot or by bike. New temporary infrastructural forms that arose in response to quarantine restrictions (bicycle paths, hyperlocal micro-markets, shipping container hospital, pop-up stores) simultaneously became an example of the “15-min city” concept.
Allam Z. and Jones D.S. (2020) [57] also say that approaches to urban planning should be revised to ensure resilience and sustainability of smart cities in case of natural and man-made disasters, climate change and such risks as a pandemic. The architects and urban planners should be involved in disaster management. Thus, another important direction of scientific research is the inclusion of COVID-19 as one of the threats to the sustainable development of smart cities.

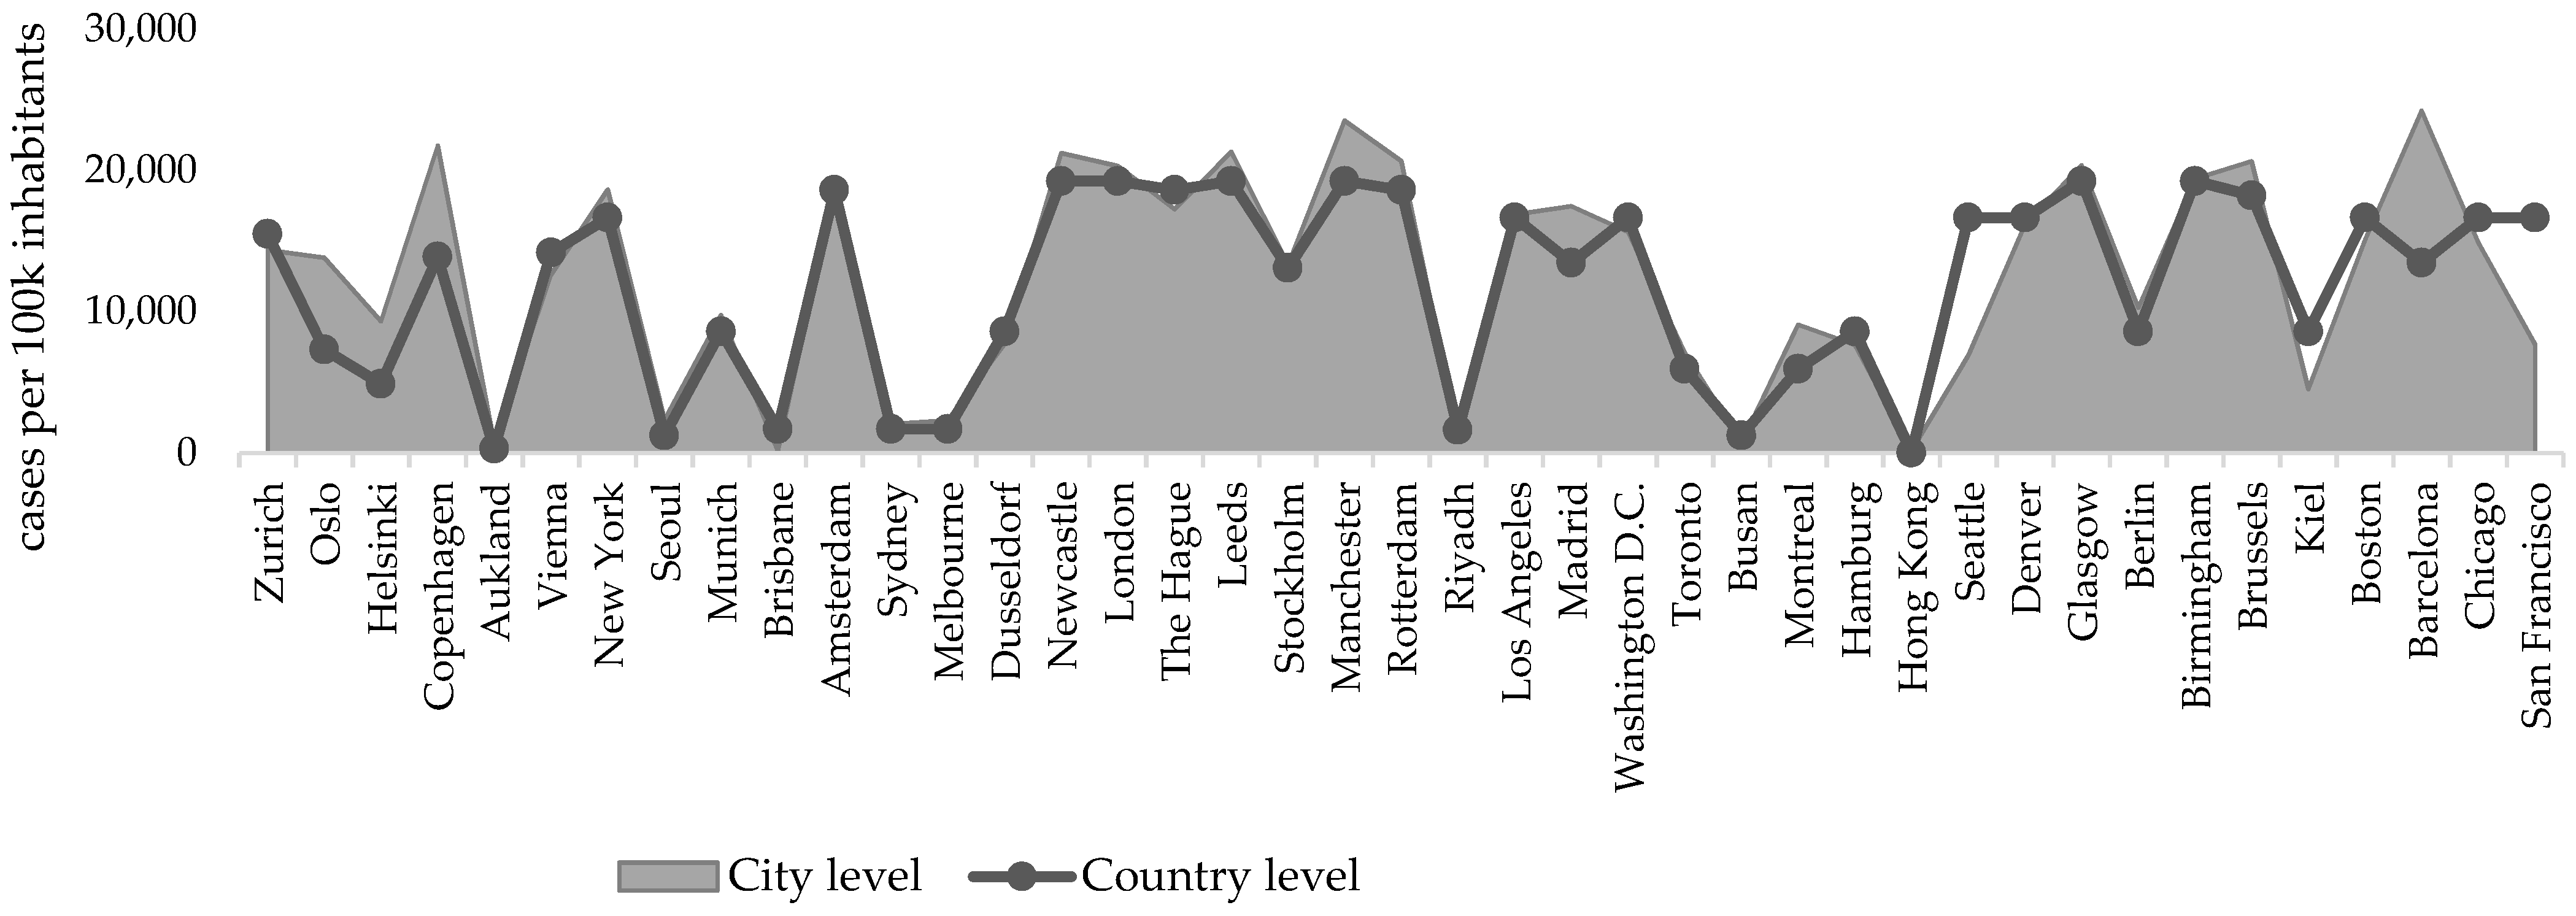
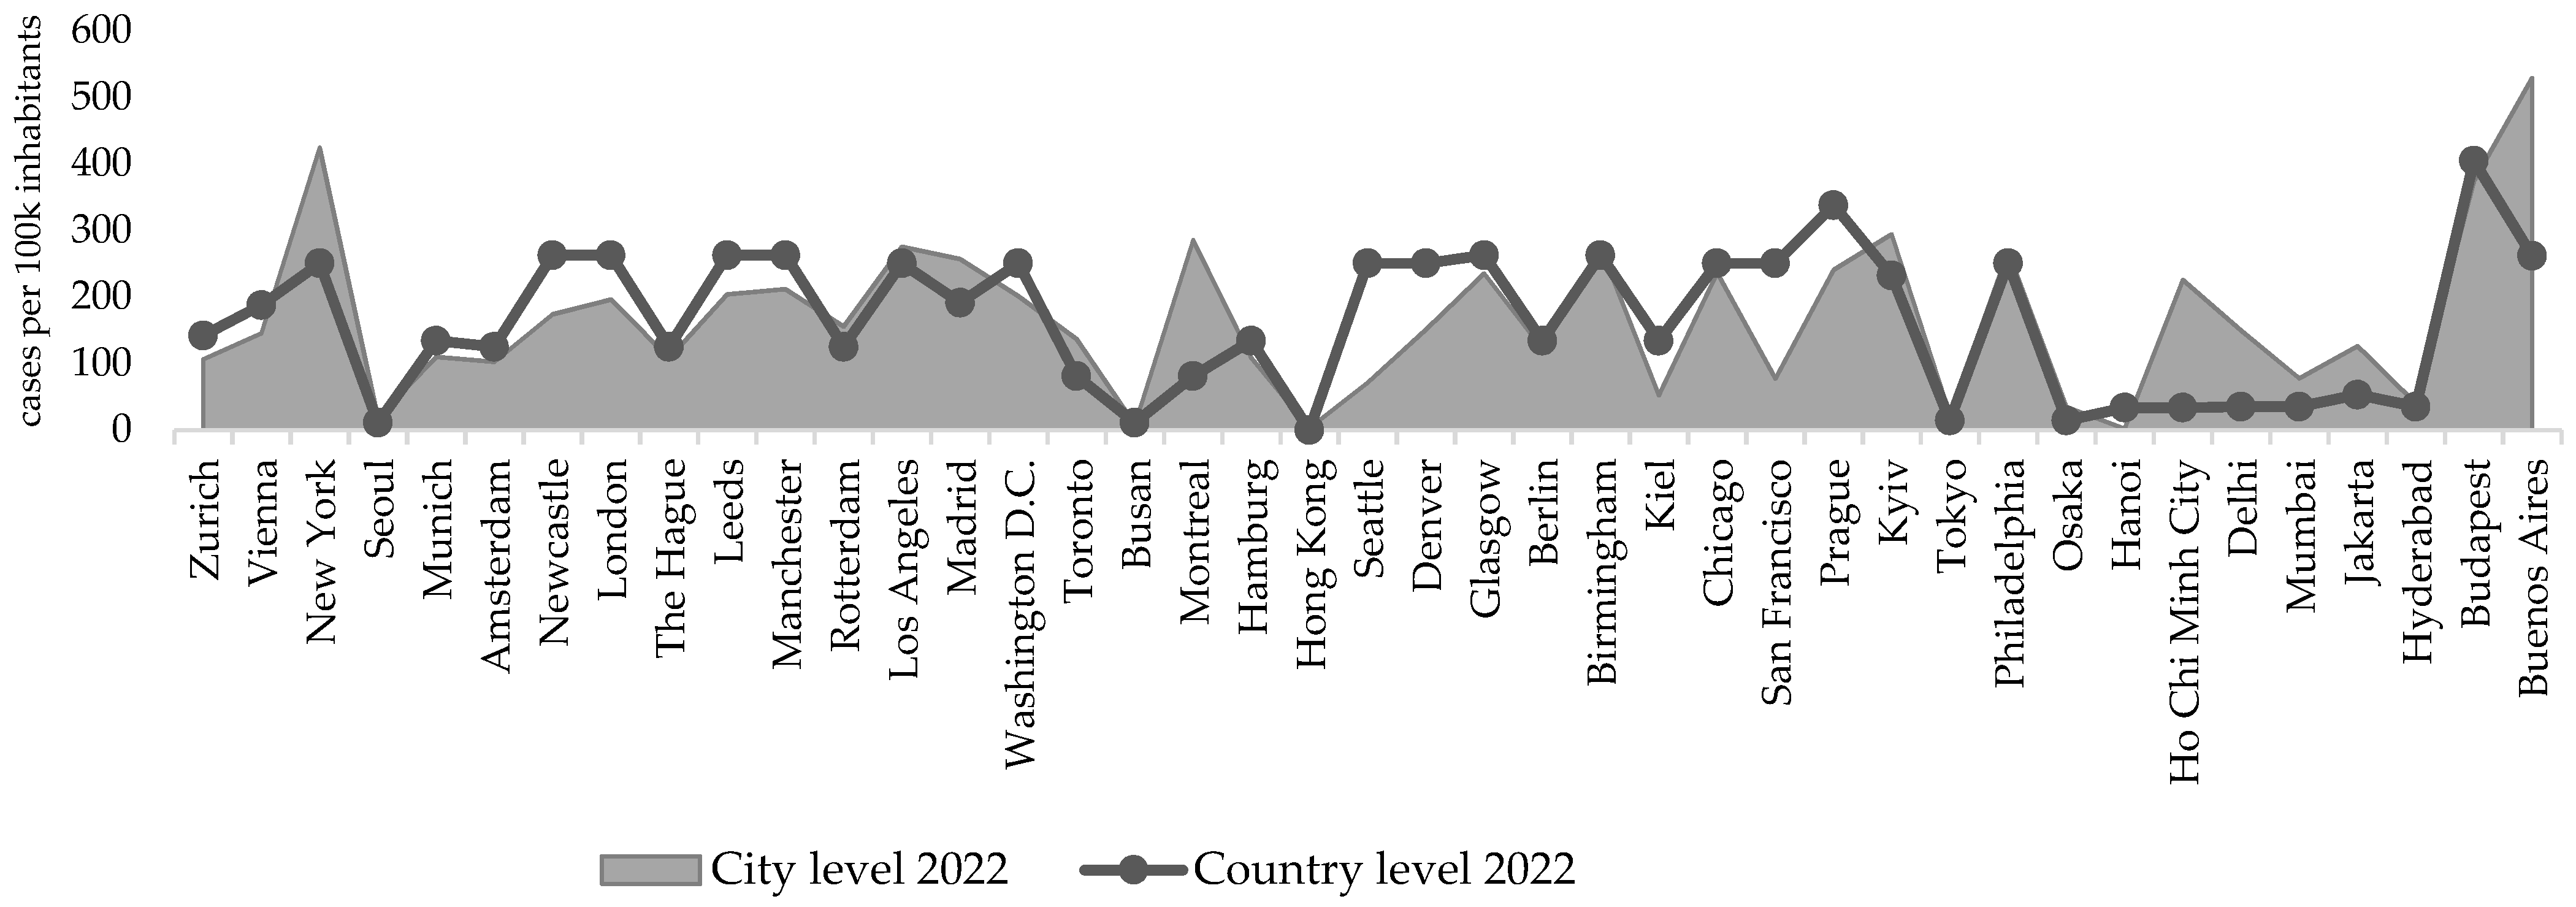
3.2. COVID-19 Severity on City/Country Levels

The methodological complexity of assessing the resilience of smart cities to the consequences of the COVID-19 lies in the diversity of the smart city category and its multicriteria. In this study, we support the OECD approach to defining a smart city as a “city that leverage digitalization and engage stakeholders to improve people’s well-being and build more inclusive, sustainable and resilient societies” [67]. According to the OECD, the level of digitization is not the only and sufficient criterion for assigning a city to the “smart” category. Digital technologies, in turn, are a means of achieving the goals of improving people’s well-being and building more inclusive, sustainable and resilient societies.
Analyzing the functioning of smart cities in the conditions of a pandemic, it is worth distinguishing two groups of factors: first, factors of resilience that allow smart cities to adapt better and withstand new challenges, particularly, pandemic; and secondly, factors of vulnerability that, in contrast, cause a higher exposure of smart cities to such risks.
Smart cities clearly have better opportunities for monitoring and organizing urban life in such a way as to keep essential public services running, minimize large gatherings of people, ensure compliance with social distancing, requirements for wearing masks, etc.
For example, artificial intelligence and IoT technologies are used in smart cities to optimize the operation of the transport system, which during a pandemic means minimizing crowding, as stated in Section 3.1 [60,63,65].
Modern smart cities should be primarily sustainable cities focused on people, providing a high quality of life and maximum convenience for residents. It includes the presence of shops, pharmacies and other necessary infrastructure in a close location, which would minimize the need to move around the city and reduce the number of contacts. Moreover, during the lockdown period, the system of online orders and door-to-door delivery worked in most smart cities.
Other examples of the use of smart technologies in cities to combat the spread of the coronavirus are video surveillance to control compliance with the mask regime, social distancing and tracking contacts between sick persons.
The use of digital technologies in smart cities is not limited to these examples. Hassankhani M. and others [68] consider the deployment of technology in smart cities during the pandemic according to the following functional directions: participation, transparency and social connectedness; physical and mental health of residents; education and employment.
On the other hand, smart cities are mostly large or megacities, developed industrial, financial and/or administrative centers. Such cities attract a larger number of residents due to better employment opportunities and a higher income. Accordingly, the total number of population and its density in smart cities, as a rule, is higher than in other settlements.
Therefore, although smart cities are the most technologically advanced, they are also the most densely populated settlements, so it is quite difficult to achieve a cardinal positive effect in the fight against the pandemic through smart technologies. In such cities, there may be a problem of overloading the health care system—the availability of a sufficient number of doctors, health care facilities, etc.
In addition, the implementation of digital initiatives in smart cities as a COVID-19 response had adverse effects such as social exclusion, digital divide, privacy and confidentiality violation, political bias and misinformation dissemination and inefficient remote working and education [68].
The beginning of the pandemic had an element of surprise and unpredictability of its scale, accompanied by the unpreparedness of society for it in many aspects. Therefore, even with the presence of technologies that could potentially be used to fight the pandemic, they were not implemented in the first stages, as a result of which the virus spread rapidly in many regions and smart cities.
To date, with a large volume of research on COVID-19 and smart cities and developed and adapted technologies, it has become possible to ensure the use of smart technologies to form the future resilience of smart cities.
Thus, smart cities are characterized simultaneously by the presence of prerequisites for a higher level of their resilience to various threats, but also by additional obstacles to effectively combat the pandemic. That is why the question of resilience of smart cities to the consequences of the COVID-19 pandemic cannot have an unequivocal answer and requires in-depth research.
Analyzing the resilience of smart cities to the COVID-19 pandemic, it is also necessary to consider the different time frames of the pandemic waves and the spread of virus strains in different countries, which is primarily due to the feature of geographical location. In addition, the response of smart cities to the pandemic significantly depended on the national context—the presence and nature of national measures to combat COVID, the timing of the lockdown, the list of restrictions, vaccination rates, etc. With this in mind, it is appropriate to compare the severity of COVID-19 (in particular, the number of coronavirus cases and deaths per 100,000 inhabitants) for a smart city and the country in which it is located. The cumulative indicators of the number of coronavirus cases at the city and country levels as of 1 January 2022, are presented in Figure 3.
According to the Smart City Index 2021, the cities in Figure 3 are arranged in descending order of their ranks. Those smart cities for which there are no statistical data on the coronavirus cases on the analyzed date were excluded from the study. Singapore, the leader of the rating, was also excluded, since it is a city-state and it is impossible to separate the city and country indicators for it.
According to the obtained results, there is no regularity in the number of coronavirus cases in smart cities compared to the national level. Some cities really had a significantly lower number of coronavirus cases per 100,000 inhabitants than the country as a whole (for example, San Francisco, Seattle, Kiel), and some, in contrast, significantly exceeded the national level (for example, Barcelona, Copenhagen, Oslo). Therefore, the factors of digitalization and sustainable development did not have an unequivocal impact on the reduction of the incidence of coronavirus in smart cities compared to national indicators.
Similar results can be expressed by comparing the number of coronavirus deaths cases in smart cities and in the countries where they are located (Figure 4).
Figure 4 shows a significant excess of the number of coronavirus deaths cases compared to the national rate in such cities as Buenos Aires, Montreal, Ho Chi Minh City, New York. In contrast, in Seattle, San Francisco, Denver, Prague this indicator is significantly lower than in the country.

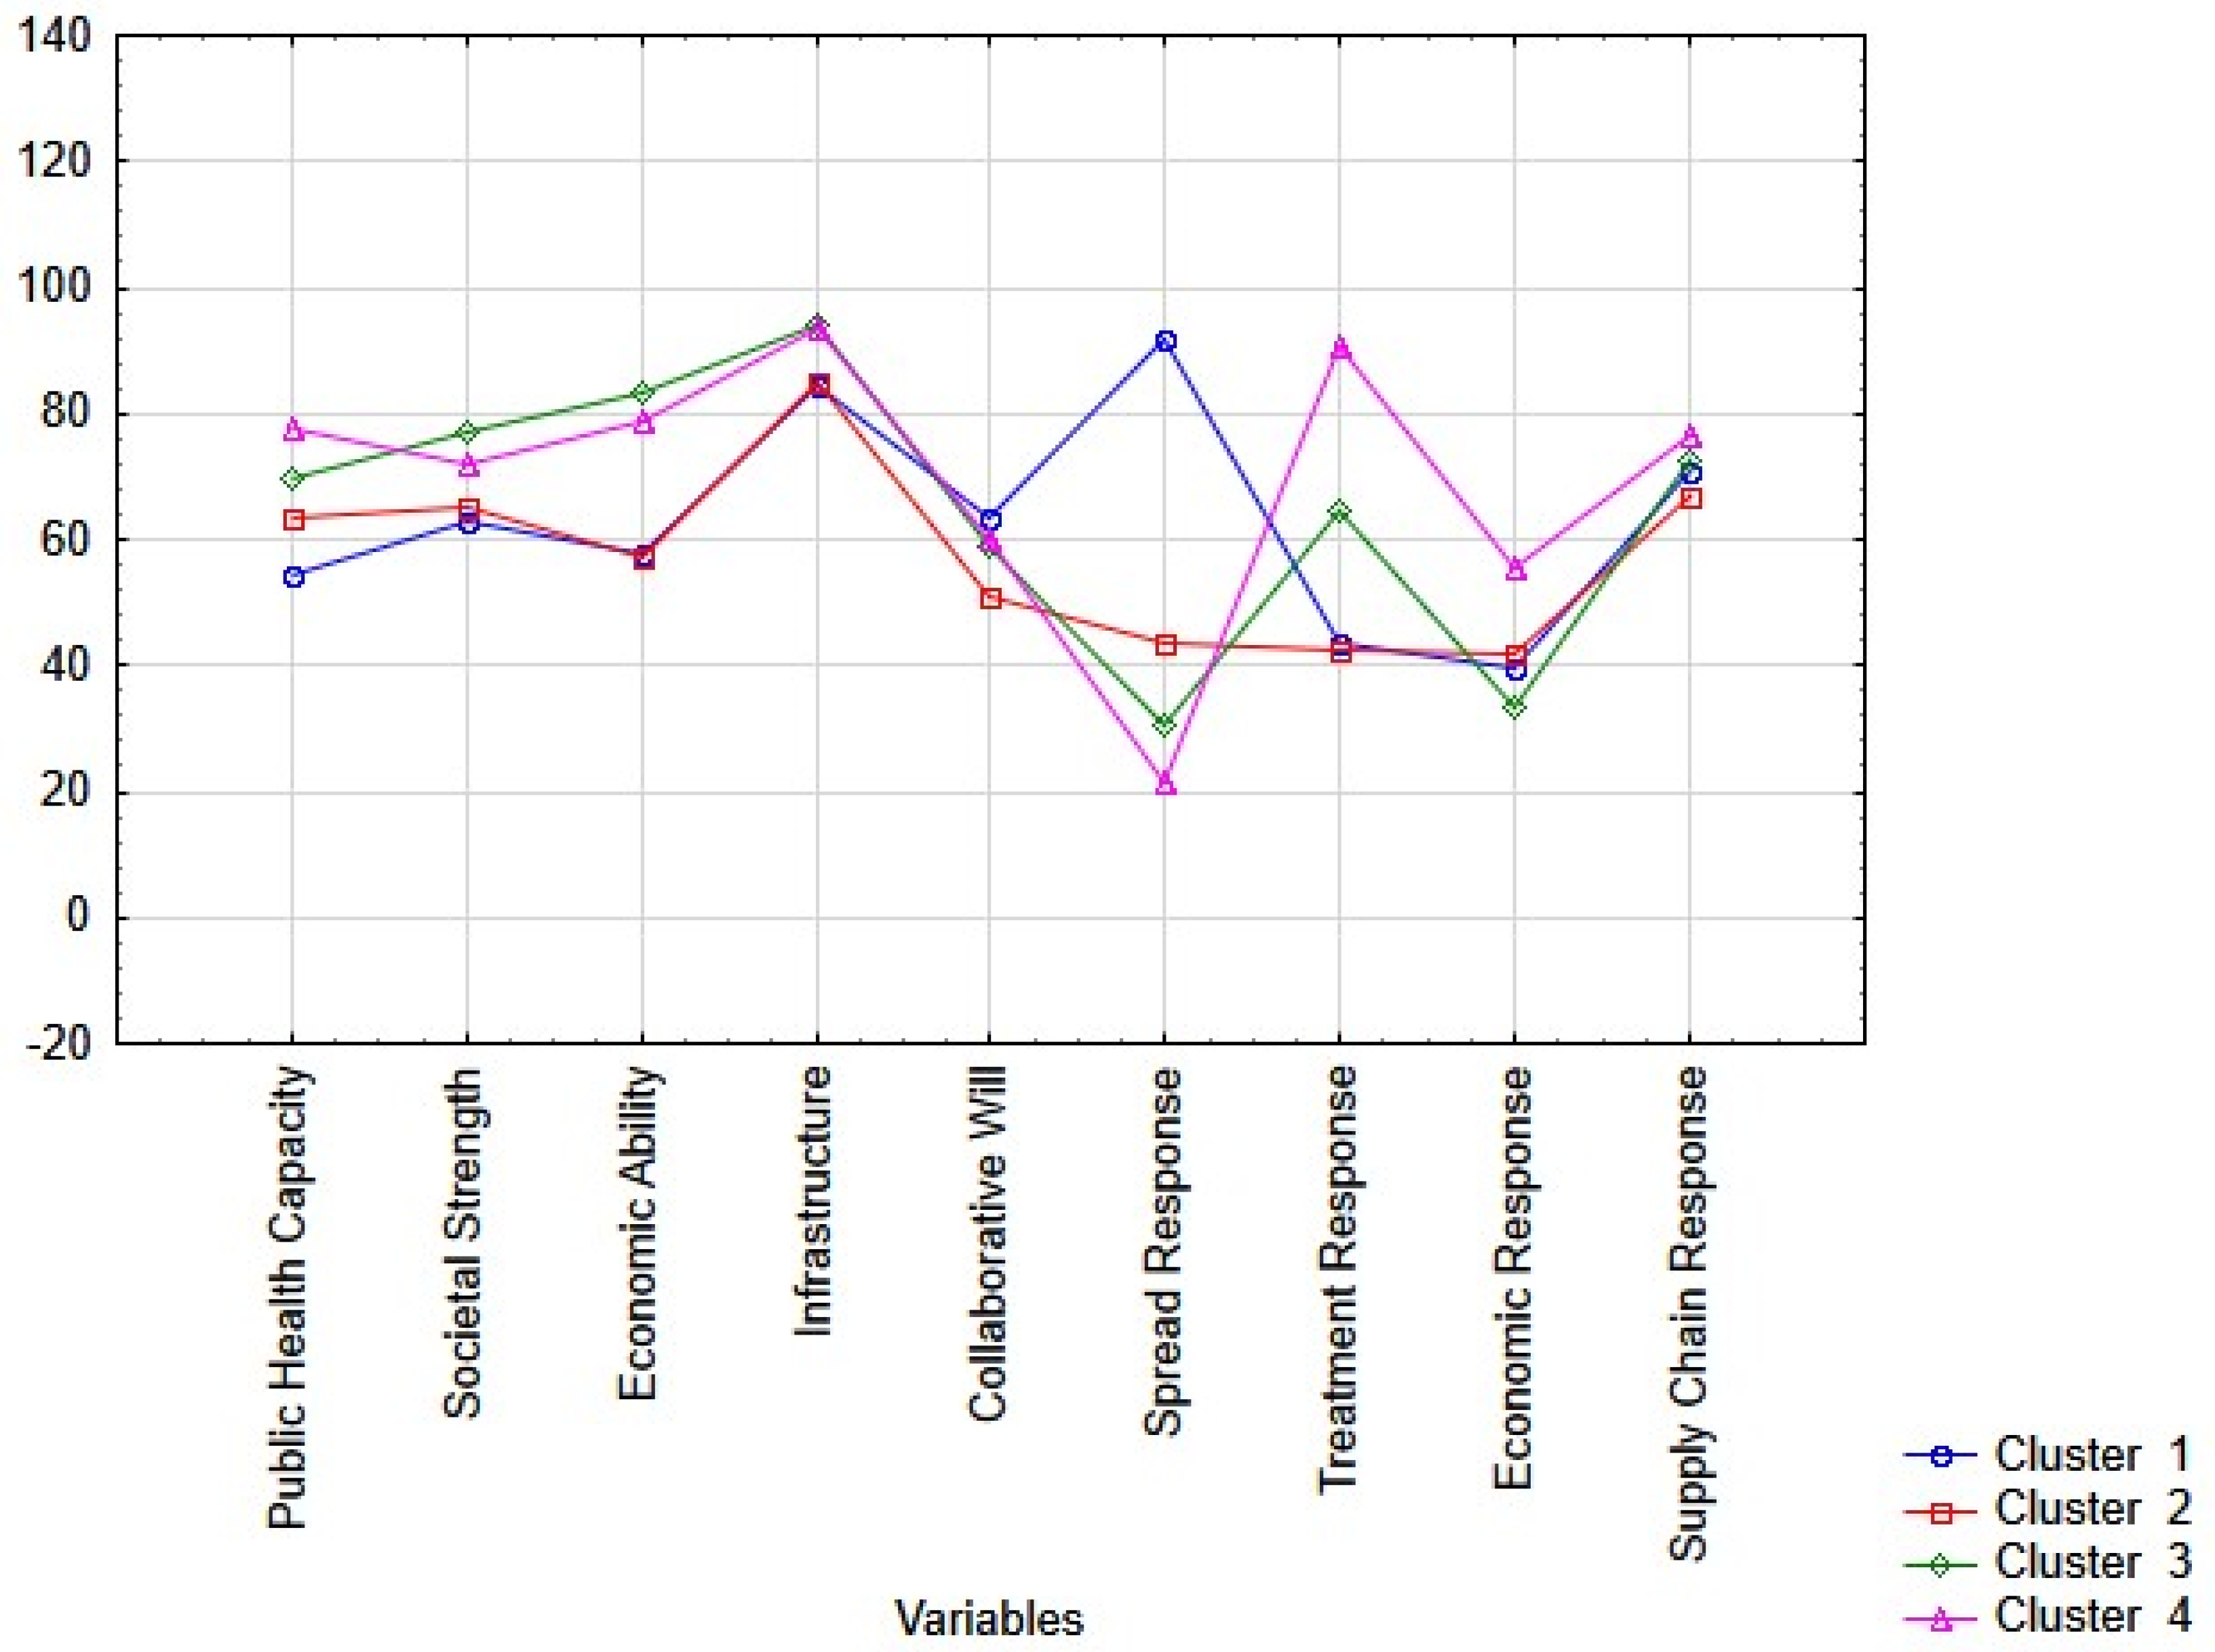
3.3. Cluster Analysis Results

At the next stage, we examine indicators of COVID-19 readiness and responsiveness of smart cities using the cluster analysis method. The input data base for cluster analysis is formed from nine variables that characterize COVID-19 readiness and responsiveness according to the methodology of UN-Habitat. The objects of analysis are smart cities included in the Smart City Index in 2021. Considering the availability of statistical data on all nine variables, the number of cases (the list of smart cities) was reduced to 48.
Based on the results of the cluster analysis using the k-means clustering method, four clusters were formed. The cities included in the same cluster are characterized by close values of nine variables used in the analysis (namely, COVID-19 readiness and response indicators) The means of nine variables for each cluster are presented in Figure 5. The results were obtained using Statistica 10 software.
The analysis of the average variables for each cluster (Figure 5) confirms the adequacy of the cluster analysis results and the validity of the four clusters, because the graph clearly shows specific differences in the average values for each cluster. For example, the cities included in clusters 1 and 2 have the same mean values for almost all variables, but there is a significant gap between them according to the Spread Response indicator. Similarly, cities included in clusters 3 and 4 are characterized by similar values of seven variables, but they have large gaps in the values of Treatment Response and Economic Response.
The k-means method makes it possible to clearly divide research objects between clusters. The list of cities included in each of the clusters and generalized characteristics of each cluster are presented in Table 3.
Geographical location of the city, the position of the city in the Smart City Rating, and the average values of the variables in comparison with other clusters were studied to analyze the composition of each cluster and develop their general characteristics.
Thus, the first-cluster-cities included in represent different geographical regions (Europe, Asia, Africa, North America) and occupy different positions in the Smart City Ranking (from 33 to 115 out of 118), but all of them have an extremely high level of the Spread Response indicator.
The second cluster, in contrast, includes cities similar in terms of geography (South America) and positions in the Smart City Ranking (lower than average). It differs from the first cluster in Spread Response and Collaborative Will indicators.
The cities of the third cluster also have a common geographical feature (North America) and a position in the Ranking (average or higher). According to the values of most variables, the cities of the third cluster differ significantly from the first and second clusters and have significantly lower Treatment and Economic Response indicators compared to the fourth cluster.
Finally, the fourth cluster includes cities from different regions and with different positions in the Ranking (although the European region and the highest positions in the Ranking are predominant). As for the variables, the fourth cluster is characterized by the highest indicators of Treatment and Economic Response, but the lowest Spread Response.
Summarizing the results of the cluster analysis of smart cities by indicators of readiness and responsiveness to the COVID-19 pandemic, the following conclusions can be drawn:
  • The countries were fairly evenly distributed among the clusters: there is the largest cluster, which includes 15 countries, the number of countries in the other clusters is 10, 11 and 12;
  • According to the plot of means, Spread Response is the main variable for clustering the countries. The cluster 1 was formed by the largest values of this variable;
  • Cluster analysis confirmed the importance of the geographical factor. Except for the cluster 1, a clear geographical division can be seen in the distribution of cities by other clusters. All North American cities (except Vancouver, which is in cluster 1) formed the third cluster; all South American cities are included in the second cluster, most European cities are in the 4th cluster;
  • The relationship between the distribution of cities and their Smart City Rank (SCR) can be traced in clusters 2 and 3: cities in cluster 2 have lower-than-average SCR (min 91, max 118), and in cluster 3, average and higher-than-average SCR (min 12, max 85). Clusters 1 and 4 formed of cities with a large difference in SCR: cluster 1—min 33, max 115; cluster 4—min 1, max 112. However, in cluster 1, most cities have lower-than-average SCR, and in cluster 4, two thirds of cities are cities with higher-than-average SCR.

3.4. Correlation Analysis Results

From the obtained results of the cluster analysis, it is impossible to draw an unequivocal conclusion about the importance of the smart city rating in its readiness and responsiveness to the pandemic. Therefore, an addition to the cluster analysis is a correlation analysis between nine indicators of COVID-19 readiness and responsiveness used in the cluster analysis, on the one hand, and the rating of smart cities according to the Smart City Index, on the other hand. Given that the correlation is calculated between pairs of indicators, it is possible to increase the number of observations (analyzed cities) for some of the variables, which will increase the reliability of the calculations. The results of the correlation analysis of Smart City Rank 2021 and COVID-19 Cities Readiness and Response Indicators are presented in Table 4.
Based on the calculations, statistically significant correlation coefficients were obtained for all analyzed pairs of indicators. All indicators of COVID-19 cities’ readiness and responsiveness have a negative correlation with Smart City Rank, except for Spread Response. The COVID-19 Cities Readiness and Responsiveness indicators are measured from 0 to 100, where 0 is the minimum and 100 is the maximum value, while the Smart City Rank 2021 is measured from 1 to 118, where 1 is the highest rank position. Therefore, negative values of correlation coefficients indicate a higher level of COVID-19 Readiness and COVID-19 Responsiveness in those smart cities that occupy higher positions in the rating. Conversely, positive values of the correlation coefficient in this case indicate that smart cities that occupy higher positions in the Smart City Ranking demonstrate worse COVID-19 readiness and responsiveness.
Based on the obtained results, it can be determined that, all indicators of COVID-19 readiness and responsiveness are better for smart cities with higher positions in the Smart City Rank with the exception of Spread Response. Regarding the strength of the relationship between indicators, most of the COVID-19 Readiness indicators, namely Societal Strength, Economic Ability and Infrastructure have a moderate correlation with Smart City Rank. The rest of the COVID-19 Readiness indicators (Public Health Capacity and Collaborative Will), as well as most of the COVID-19 Response indicators, have a low correlation with the Smart City Rank. The correlation coefficient value of 0.23 indicates a negligible correlation between the Spread Response and Smart City Rank indicators.
It is worth paying attention to the fact that the top smart cities were generally better prepared for risks, including pandemics, that is, they had a higher level of resilience due to their high level of economic development, developed infrastructure and social strength. However, indicators of the health care system before the start of the pandemic in such cities were not the highest, which was confirmed by the corresponding correlation coefficient equal to 0.42.
In addition to generalizing indicators of cities’ readiness and responsiveness, it is advisable to analyze correlations between Smart City Rank and direct indicators of COVID-19 severity, namely coronavirus cases, coronavirus deaths and coronavirus fatality rate.
The value of Smart City Rank is a generalized assessment of five key areas: health and safety, mobility, activities, opportunities and governance [48]. Not all the mentioned areas are directly related to countering COVID-19. However, a synergistic effect and the importance of the general development of smart cities in shaping their resilience to the pandemic cannot be excluded. Therefore, Smart City Rank was used as one of the variables for correlation analysis. Along with that, the following components of the Smart City Index that directly reflect the state of health care in cities were included in the correlation analysis: basic sanitation meets the needs of the poorest areas; provision of medical services is satisfactory; and arranging medical appointments online has improved access. The results of the correlation analysis of smart city and COVID-19 indicators are presented in Table 5.
Based on the results of the correlation analysis, it can be concluded that there are no statistically significant relationships between the indicators of COVID-19 severity (coronavirus cases, coronavirus deaths and coronavirus fatality rate) and Smart City Rank 2021, except for the coronavirus fatality rate according to data on 1 January 2022. The correlation coefficient for this pair of indicators was 0.46. Therefore, cities with better positions in the smart city rating are characterized by a lower coronavirus fatality rate, but the strength of the relationship between the indicators is low.
Cumulative number of coronavirus cases per 100k inhabitants has a low negative correlation with indicators “Basic sanitation meets the needs of the poorest areas”, “Medical services provision is satisfactory” and “Arranging medical appointments online has improved access in both studied periods” (the exception is a pair of indicators “Cumulative number of coronavirus cases per 100k inhabitants” and “Medical services provision is satisfactory” as of 1 January 2022, the significance of the relationship between which is not statistically confirmed). A negative correlation indicates a lower number of COVID-19 cases in cities with better health care scores (these indicators are evaluated on a scale of 0–100).
Cumulative number of coronavirus deaths cases per 100k inhabitants shows a moderate negative correlation with the indicators “Basic sanitation meets the needs of the poorest areas” and “Medical services provision is satisfactory” and a low negative correlation with the indicator “Arranging medical appointments online has improved access” according to both analyzed periods. So, cities with higher indicators of the health care system have lower numbers of coronavirus deaths cases.
The analysis of the relationships between the coronavirus fatality rate and health care indicators in smart cities showed different results regarding the strength of the relationship for different periods of the study. As of 1 January 2021, all health care indicators showed a low negative correlation with the coronavirus fatality rate. As of 1 January 2022, the coronavirus fatality rate had a low negative correlation with “Arranging medical appointments online has improved access”, a moderate negative correlation with “Basic sanitation meets the needs of the poorest areas”, and a high negative correlation with “Medical services provision is satisfactory”.
Thus, the dynamics of COVID-19 in smart cities do not have significant differences from cities with a lower level of smart technology development. At the same time, the indicators of the number of deaths per 100,000 inhabitants and the fatality rate are lower in cities that have higher indicators “Basic sanitation meets the needs of the poorest areas” and “Medical services provision is satisfactory”.

4. Discussion

The hypothesis put forward in the study that smart cities have higher resilience to COVID-19 was not confirmed. Although obtained results show a positive relationship between the Smart City Rank and the indicators of COVID-19 severity, the strength of this relationship is insufficient for an unequivocal conclusion. Moreover, there is empirical evidence that, in contrast, cities with lower positions in the Smart City Rank showed better indicators of the health care system, greater readiness, and better response to COVID-19 than the top smart cities in the overall ranking.
On the one hand, this conclusion is justified and describes the real situation. After all, as was determined at the beginning of the research, a smart city must simultaneously ensure the achievement of four goals: improve people’s well-being, build more inclusive, sustainable and resilient societies. Achieving these four goals involves working in many directions—in the field of health care, education, transportation, other services provision, business support, governance, etc. The degree of digitalization, the achieved level of inclusivity, convenience for residents, etc. in each direction will differ in smart cities. It was precisely the health care system that was not given the key or the leading place in terms of the smart technology implementation, at least at the beginning of the pandemic. Therefore, comparing health care systems in smart cities, they turned out to be weaker and more vulnerable to risks in top smart cities than in some less rated smart cities.
On the other hand, such results highlighted the limitations of this study and the shortcomings of the chosen research method. Since the Smart City Index was chosen as the base indicator, it may not be sensitive to the very characteristics of the smart city that were decisive in the formation of its resilience to COVID-19. In addition, the Index provides averaged data and does not reflect inequalities (including digital inequality) within the city. An example is Singapore—the leader of the Smart City Index 2021. Compared to other studied cities, Singapore has significantly lower numbers of coronavirus cases and deaths. However, this situation was not common to the entire population. Among migrant workers who lived in overcrowded and poorly equipped dormitories, the morbidity rate was several times higher. Studies show that by the end of 2020 more than 90% of all positive COVID-19 tests in Singapore were among migrant workers [69]. A distinctive feature of the COVID-19 pandemic is the importance of digital technologies, in particular the Internet, in the organization of everyday life—work, study, social communication, etc. The availability of computers, smartphones or other devices for some people and their absence for others has increased the digital divide both globally and within smart cities between more affluent and poorer residents.
In addition, the study may have an input error, as the data was accumulated separately for different cities and may have inaccuracies and inconsistencies. The availability of data on the number of COVID-19 cases and deaths is another limitation of this study. Due to the lack of data, some smart cities were excluded from the analysis, including those that were among the top smart cities according to the Smart City Index 2021. Due to differences in the availability of data on the number of COVID-19 cases and deaths, the number of observations in the correlation analysis varied from 55 cities (for the number of COVID-19 deaths and fatality rate in 2022) to 91 cities (for the number of COVID-19 cases in 2021). Therefore, the quality of statistical data on the number of COVID-19 cases is higher than on the number of COVID-19 deaths, and accordingly the fatality rate. Although the statistical significance of the correlation coefficients was confirmed using the t-test and p-value, a larger number of observations in the input data set would have provided higher reliability of the results of the correlation analysis.
The value of this study is that it gave a general picture and showed the presence of weak points in smart cities, which would seem to have the highest rating and should have reacted best to such a shock as a pandemic, but this did not happen.
Smart technologies should be aimed at ensuring the sustainability, inclusiveness and resilience of cities and the well-being of their residents. However, the pandemic has shown that technological projects in the health care have received insufficient attention. As a result, at the beginning of the pandemic, the top smart cities had a lower readiness score in terms of health care system than cities with lower ranking positions for the development of smart technologies.
Thus, there is a problem of insufficient attention to the development of smart technologies specifically in health care and social security. Therefore, this direction should become one of the priorities in the future development of smart cities and increasing their resilience to health threats.
The results are consistent with the findings of several studies on the response to COVID-19 and the post-COVID recovery of smart cities and health care systems. According to the OECD report “Cities Policy Responses” dated 23 July 2020, the crisis caused by the COVID-19 pandemic requires a greater focus on ensuring the resilience of cities. The same report states that the problems identified in the health care system in large cities are not actually a problem of urban density, but evidence of structural inequalities and poor quality of urbanization [25].
Kotenko N. and Bohnhardt V. concluded that one of the main problems in the development of digital health projects is the lack of sustainable funding [70]. Another study draws attention to the insufficient financial support of the health care system. Its authors suggest cooperation with humanitarian organizations and private sponsors to obtain additional financial support in order to strengthen the material and technical base of health care institutions as measures of anti-crisis management in conditions of COVID-19 [71]. In addition to financial support, the problem of introducing innovations and health technologies may lie in the legislative plane, as noted in the work of Shipko A. and others (2020) [72].
Analysis of the consequences of the COVID-19 pandemic for smart cities led to a shift in the focus of the application of digital technologies. A significant number of experts emphasize that technologies themselves are not the key, it is important how they are used and how they ensure the well-being of city residents. Experts of the International Institute for Management Development rankings (IMD) say that smart cities in the post-pandemic period should become human-centric [73]. UN-Habitat even launched a flagship program “People-Centered Smart Cities” in 2020, aimed at ensuring sustainability, inclusivity, prosperity and human rights in cities.
So, in general, the hypothesis about the higher resilience of smart cities to COVID-19 was not confirmed, and it was found that there are other factors that affected the readiness and responsiveness of smart cities.
Future research should be aimed at studying certain aspects of the smart cities’ functioning and the formation of their resilience to COVID-19 in the relevant areas (health care, transport system, education, small and medium-sized businesses and others), with a system of indicators that would clearly reflect COVID-19 readiness and responsiveness in these particular areas.

5. Conclusions

Summarizing the results of the conducted comparative, cluster and correlation analysis of the resilience of smart cities to the COVID-19 pandemic, we can draw the following conclusions.
The dynamics of the number of COVID-19 cases in smart cities had a low correlation with the level of adoption of smart technologies and was more subject to the spread of waves and strains of the virus according to geographical location. Moreover, the number of cases of the disease in smart cities often exceeded their number at the national level.
Other indicators of the COVID-19 severity (the fatality rate and the number of deaths cases) have a significant correlation with the indicators of the health care system in cities. However, according to the Smart City Index, the cities with the highest overall rank do not have the highest indicators in terms of the health care system. Instead, cities that are lower in the overall smart city ranking have better positions in the health care system and have demonstrated a better response to COVID-19. This was confirmed by the results of the cluster analysis, according to which the first cluster was formed from the cities with the highest Spread Response indicator, but almost all these cities have lower-than-average positions in the smart city rating.
The analysis of the readiness and responsiveness of smart cities to the pandemic showed that smart cities really had higher COVID-19 readiness scores in terms of economic development, infrastructure and social strength, but this cannot be said about the COVID-19 Responsiveness indicators.
The results of the study prove that smart cities have the potential to form high resilience to risks, including those of a nature such as the COVID-19 pandemic, thanks to a wider and targeted application of innovative digital technologies, including artificial intelligence, IoT technologies, Big Data, blockchain, etc. However, it is necessary to review the priorities regarding the financing and development of smart city projects in the direction of people-centeredness, increasing the inclusiveness of the city and its residents’ well-being, bringing the structural indicators and material and technical support of health care institutions to a level that meets the needs of the city.

Author Contributions

Conceptualization, A.K. and T.V.; methodology, O.P. and S.L.; software, P.B. and O.P.; validation, A.K. and D.K.; formal analysis, O.P. and T.V.; investigation, A.K. and O.P.; resources, D.K. and P.B.; data curation, P.B. and O.P.; writing—original draft preparation, O.P. and S.L.; writing—review and editing, A.K. and T.V.; visualization, P.B. and O.P.; supervision, A.K., D.K. and T.V.; project administration, T.V. and A.K.; funding acquisition, A.K. and O.P. All authors have read and agreed to the published version of the manuscript.

Funding

This research was funded by Ministry of Education and Science of Ukraine within the framework of state budget research № 0122U000778 “Socio-economic recovery after COVID-19: modelling the implications for macroeconomic stability, national security and local community resilience” and state budget research № 0122U000781 “The impact of COVID-19 on the transformation of the medical and social security system: economic, financial and budgetary, institutional and politi-cal determinants”. The research received funding under the research subsidy of the Department of Applied Social Sciences of the Faculty of Organization and Management of the Silesian University of Technology for the year 2022 (13/020/BK_22/0072).

Institutional Review Board Statement

Not applicable.

Informed Consent Statement

Not applicable.

Data Availability Statement

Not applicable.

Conflicts of Interest

The authors declare no conflict of interest.

References

  1. Yarovenko, H.; Kuzmenko, O.; Stumpo, M. DEA-Analysis of the Effectiveness of the Country’s Information Security System. SocioEcon. Chall. 2020, 4, 142–153. [Google Scholar] [CrossRef]
  2. Kuzmenko, O.; Cyburt, A.; Yarovenko, H.; Yersh, V.; Humenna, Y. Modeling of “information bubble” in the global information space. J. Int. Stud. 2021, 14, 270–285. [Google Scholar] [CrossRef]
  3. Polyakov, M.; Bilozubenko, V.; Korneyev, M.; Shevchenko, G. Selection of parameters for multifactor model in the knowledge economy marketing (country level). Innov. Mark. 2019, 15, 89–99. [Google Scholar] [CrossRef]
  4. Khanin, I.; Shevchenko, G.; Bilozubenko, V.; Korneyev, M. A cognitive model for managing the national innovation system parameters based on international comparisons (the case of the EU countries). Probl. Perspect. Manag. 2019, 17, 153–162. [Google Scholar] [CrossRef] [Green Version]
  5. Yarovenko, H.; Bilan, Y.; Lyeonov, S.; Mentel, G. Methodology for assessing the risk associated with information and knowledge loss management. J. Bus. Econ. Manag. 2021, 22, 369–387. [Google Scholar] [CrossRef]
  6. Mańka-Szulik, M.; Krawczyk, D. Optimizing the Provision of Public Services by Local Administration as a Component of the Smart City Concept on the Example of Zabrze. Manag. Syst. Prod. Eng. 2022, 30, 192–199. [Google Scholar] [CrossRef]
  7. Kinelski, G.; Stechły, J.; Bartkowiak, P. Various Facets of Sustainable Smart City Management: Selected Examples from Polish Metropolitan Areas. Energies 2022, 15, 2980. [Google Scholar] [CrossRef]
  8. Fila, M.; Levicky, M.; Mura, L.; Maros, M.; Korenkova, M. Innovations for business management: Motivation and barriers. Mark. Manag. Innov. 2020, 4, 266–278. [Google Scholar] [CrossRef]
  9. Wang, Q.; Chen, Y.; Guan, H.; Lyulyov, O.; Pimonenko, T. Technological innovation efficiency in China: Dynamic evaluation and driving factors. Sustainability 2022, 14, 8321. [Google Scholar] [CrossRef]
  10. Melnyk, L.; Matsenko, O.; Kubatko, O.; Korneyev, M.; Tulyakov, O. Additive economy and new horizons of innovative business development. Probl. Perspect. Manag. 2022, 20, 175–185. [Google Scholar] [CrossRef]
  11. Kuzior, A.; Mańka-Szulik, M.; Krawczyk, D. Changes in the management of electronic public services in the metropolis during the covid-19 pandemic. Pol. J. Manag. Stud. 2021, 24, 261–275. [Google Scholar] [CrossRef]
  12. Kuzior, A.; Kettler, K.; Rąb, Ł. Digitalization of Work and Human Resources Processes as a Way to Create a Sustainable and Ethical Organization. Energies 2022, 15, 172. [Google Scholar] [CrossRef]
  13. Tiutiunyk, I.; Drabek, J.; Antoniuk, N.; Navickas, V.; Rubanov, P. The impact of digital transformation on macroeconomic stability: Evidence from EU countries. J. Int. Stud. 2021, 14, 220–234. [Google Scholar] [CrossRef]
  14. El Amri, A.; Boutti, R.; Rodhain, F. Sustainable Finance at the time of Institutions: Performativity through the lens of Responsible Management in Morocco. Financ. Mark. Inst. Risks 2020, 4, 52–64. [Google Scholar] [CrossRef]
  15. Lyulyov, O.; Chygryn, O.; Pimonenko, T. National brand as a marketing determinant of macroeconomic stability. Mark. Manag. Innov. 2018, 3, 142–152. [Google Scholar] [CrossRef]
  16. Weder, F.; Mertl, S.; Hübner, R.; Elmenreich, W.; Sposato, R. Re-Framing Sustainability in a Pandemic. Understanding Sustainability Attitudes, Behaviors, Visions and Responsibilities for a Post-Covid Future. J. Sustain. Res. 2022, 4, e220006. [Google Scholar] [CrossRef]
  17. Karaoulanis, A. Big Data, What Is It, Its Limits and Implications in Contemporary Life. Bus. Ethics Leadersh. 2018, 2, 108–114. [Google Scholar] [CrossRef]
  18. Beyi, W.A. The Trilogy of a Digital Communication between the Real Man, His Digital Individual and the Market of the Digital Economy. SocioEcon. Chall. 2018, 2, 66–74. [Google Scholar] [CrossRef]
  19. Miskiewicz, R. Internet of things in marketing: Bibliometric analysis. Mark. Manag. Innov. 2020, 3, 371–381. [Google Scholar] [CrossRef]
  20. Kuzior, A.; Kwilinski, A. Cognitive Technologies and Artificial Intelligence in Social Perception. Manag. Syst. Prod. Eng. 2022, 30, 109–115. [Google Scholar] [CrossRef]
  21. Chen, X.; Wu, S.; Shi, C.; Huang, Y.; Yang, Y.; Ke, R.; Zhao, J. Sensing Data Supported Traffic Flow Prediction via Denoising Schemes and ANN: A Comparison. IEEE Sens. J. 2020, 20, 14317–14328. [Google Scholar] [CrossRef]
  22. Degas, A.; Islam, M.R.; Hurter, C.; Barua, S.; Rahman, H.; Poudel, M.; Ruscio, D.; Ahmed, M.U.; Begum, S.; Rahman, M.A.; et al. A Survey on Artificial Intelligence (AI) and eXplainable AI in Air Traffic Management: Current Trends and Development with Future Research Trajectory. Appl. Sci. 2022, 12, 1295. [Google Scholar] [CrossRef]
  23. Kwilinski, A.; Tkachenko, V.; Kuzior, A. Transparent cognitive technologies to ensure sustainable society development. J. Secur. Sustain. Issues 2019, 9, 561–570. [Google Scholar] [CrossRef]
  24. Billedeau, D.B.; Wilson, J.; Samuel, N. From Responsibility to Requirement: COVID, Cars, and the Future of Corporate Social Responsibility in Canada. Sustainability 2022, 14, 6658. [Google Scholar] [CrossRef]
  25. OECD Policy Responses to Coronavirus (COVID-19). Available online: https://www.oecd.org/coronavirus/policy-responses/cities-policy-responses-fd1053ff/ (accessed on 1 August 2022).
  26. Smiianov, V.A.; Lyulyov, O.V.; Pimonenko, T.V.; Andrushchenko, T.A.; Sova, S.; Grechkovskaya, N.V. The impact of the pandemic lockdown on air pollution, health and economic growth: System dynamics analysis. Wiad. Lek. 2020, 73, 2332–2338. Available online: https://wiadlek.pl/wp-content/uploads/archive/2020/WLek202011102.pdf (accessed on 1 August 2022). [CrossRef]
  27. Hasan, F.; Islam, M.R.; Ishrat, F. COVID-19 Pandemic Impact on the Supply Chains of UK-Based Multinational Manufacturing Companies. Bus. Ethics Leadersh. 2022, 6, 44–67. [Google Scholar] [CrossRef]
  28. Vasilyeva, T.; Ziółko, A.; Kuzmenko, O.; Kapinos, A.; Humenna, Y. Impact of digitalization and the Covid-19 pandemic on the aml scenario: Data mining analysis for good governance. Econ. Sociol. 2021, 14, 326–354. [Google Scholar] [CrossRef]
  29. Tommaso, F.D. The New Italian Legislation on Corporate Governance and Business Crisis. The Impact of COVID-19 on SMEs and the Recent Rules to Mitigate the Effects. Financ. Mark. Inst. Risks 2020, 4, 91–108. [Google Scholar] [CrossRef]
  30. Zhang, L.; Chen, Y.; Lyulyov, O.; Pimonenko, T. Forecasting the effect of migrants’ remittances on household expenditure: COVID-19 impact. Sustainability 2022, 14, 4361. [Google Scholar] [CrossRef]
  31. Keliuotytė-Staniulėnienė, G.; Daunaravičiūtė, K. The Global Green Bond Market in the Face of the COVID-19 Pandemic. Financ. Mark. Inst. Risks 2021, 5, 50–60. [Google Scholar] [CrossRef]
  32. Tovmasyan, G.; Minasyan, D. The Impact of Motivation on Work Efficiency for Both Employers and Employees also during COVID-19 Pandemic: Case Study from Armenia. Bus. Ethics Leadersh. 2020, 4, 25–35. [Google Scholar] [CrossRef]
  33. Dutta, P.; Dutta, U.; Hasan, S.; Sarkar, S.; Sana, T. Educate, Empower and Protect People Through Timely Authentic Information: Explore How Bangladeshi Newspapers Response To COVID-19 Pandemic. SocioEcon. Chall. 2020, 4, 93–103. [Google Scholar] [CrossRef]
  34. Makarenko, I.; Plastun, A.; Petrushenko, Y.; Vorontsova, A.; Alwasiak, S. SDG 4 and SDG 8 in the knowledge economy: A meta-analysis in the context of post-COVID-19 recovery. Knowl. Perform. Manag. 2021, 5, 50–67. [Google Scholar] [CrossRef]
  35. Kuzmenko, O.V.; Smiianov, V.A.; Rudenko, L.A.; Kashcha, M.O.; Vasilyeva, T.A.; Kolomiiets, S.V.; Antoniuk, N.A. Impact of vaccination on the Covid-19 pandemic: Bibliometric analysis and cross country forecasting by Fourier series. Wiad. Lek. 2021, 74, 2359–2367. [Google Scholar] [CrossRef] [PubMed]
  36. Abdullah, M.; Ali, N.; Dias, C.; Campisi, T.; Javid, M.A. Exploring the Traveler’s Intentions to Use Public Transport during the COVID-19 Pandemic While Complying with Precautionary Measures. Appl. Sci. 2021, 11, 3630. [Google Scholar] [CrossRef]
  37. Javid, M.A.; Abdullah, M.; Ali, N.; Dias, C. Structural equation modeling of public transport use with COVID-19 precautions: An extension of the norm activation model. Transp. Res. Interdiscip. Perspect. 2021, 12, 100474. [Google Scholar] [CrossRef]
  38. Gkiotsalitis, K.; Cats, O. Public transport planning adaption under the COVID-19 pandemic crisis: Literature review of research needs and directions. Transp. Rev. 2021, 41, 374–392. [Google Scholar] [CrossRef]
  39. Shen, J.; Duan, H.; Zhang, B.; Wang, J.; Ji, J.; Wang, J.; Pan, L.; Wang, X.; Zhao, K.; Ying, B.; et al. Prevention and control of COVID-19 in public transportation: Experience from China. Environ. Pollut. 2020, 266, 115291. [Google Scholar] [CrossRef]
  40. Lashgari, Y.S.; Shahab, S. The Impact of the COVID-19 Pandemic on Retail in City Centres. Sustainability 2022, 14, 11463. [Google Scholar] [CrossRef]
  41. Gade, D.S.; Aithal, P.S. Smart Cities Development During and Post COVID-19 Pandemic—A Predictive Analysis. Int. J. Manag. Technol. Soc. Sci. (IJMTS) 2021, 6, 189–202. [Google Scholar] [CrossRef]
  42. Umair, M.; Cheema, M.A.; Cheema, O.; Li, H.; Lu, H. Impact of COVID-19 on IoT Adoption in Healthcare, Smart Homes, Smart Buildings, Smart Cities, Transportation and Industrial IoT. Sensors 2021, 21, 3838. [Google Scholar] [CrossRef] [PubMed]
  43. Kunzmann, K.R. Smart Cities After Covid-19: Ten Narratives. disP—Plan. Rev. 2020, 56, 20–31. [Google Scholar] [CrossRef]
  44. Troisi, O.; Fenza, G.; Grimaldi, M.; Loia, F. Covid-19 sentiments in smart cities: The role of technology anxiety before and during the pandemic. Comput. Hum. Behav. 2022, 126, 106986. [Google Scholar] [CrossRef] [PubMed]
  45. Yang, S.; Chong, Z. Smart city projects against COVID-19: Quantitative evidence from China. Sustain. Cities Soc. 2021, 70, 102897. [Google Scholar] [CrossRef] [PubMed]
  46. Mullick, M.; Patnaik, A. Pandemic management, citizens and the Indian Smart cities: Reflections from the right to the smart city and the digital divide. City Cult. Soc. 2022, 30, 100474. [Google Scholar] [CrossRef]
  47. Li, F. Disconnected in a pandemic: COVID-19 outcomes and the digital divide in the United States. Health Place 2022, 77, 102867. [Google Scholar] [CrossRef]
  48. Smart City Index 2021; The Institute for Management Development; Singapore University for Technology and Design (SUTD): Singapore; Available online: https://www.imd.org/smart-city-observatory/home/#_smartCity (accessed on 1 August 2022).
  49. Top 50 Smart City Governments 2020/21; Eden Strategy Institute: Singapore; Available online: https://www.smartcitygovt.com/top50-smartcitygovernments (accessed on 1 August 2022).
  50. Hamza, M. These are the Top 20 Sustainable Smart Cities in the World; Disruptive Technologies: Bergen, Norway; Available online: https://www.disruptive-technologies.com/blog/the-top-20-sustainable-smart-cities-in-the-world (accessed on 1 August 2022).
  51. Citizen Centric Cities: The Sustainable Cities Index 2018; Arcadis: Amsterdam, The Netherlands; Available online: https://www.arcadis.com/campaigns/citizencentriccities/images/%7B1d5ae7e2-a348-4b6e-b1d7-6d94fa7d7567%7Dsustainable_cities_index_2018_arcadis.pdf (accessed on 1 August 2022).
  52. Quality of Living City Ranking; Mercer: New York, NY, USA; Available online: https://mobilityexchange.mercer.com/Insights/quality-of-living-rankings (accessed on 1 August 2022).
  53. City Rankings—Innovation Cities™ Index 2021; Innovation Cities™ Program: Melbourne, Australia; Available online: https://www.innovation-cities.com/city-rankings-2021/ (accessed on 1 August 2022).
  54. COVID-19 Cities Readiness and Response Tracker. Available online: https://unhabitat.citiiq.com/ (accessed on 1 August 2022).
  55. COVID-19 Data Repository by the Center for Systems Science and Engineering (CSSE) at Johns Hopkins University. Available online: https://github.com/CSSEGISandData/COVID-19 (accessed on 1 August 2022).
  56. Everitt, B.; Landau, S.; Leese, M.; Stahl, D. Cluster Analysis, 5th ed.; Wiley Series in Probability and Statistics; Wiley: Hoboken, NJ, USA, 2011; Available online: https://cicerocq.files.wordpress.com/2019/05/cluster-analysis_5ed_everitt.pdf (accessed on 1 August 2022).
  57. Allam, Z.; Jones, D.S. On the coronavirus (covid-19) outbreak and the smart city network: Universal data sharing standards coupled with artificial intelligence (ai) to benefit urban health monitoring and management. Healthcare 2020, 8, 46. [Google Scholar] [CrossRef] [Green Version]
  58. Moreno, C.; Allam, Z.; Chabaud, D.; Gall, C.; Pratlong, F. Introducing the “15-minute city”: Sustainability, resilience and place identity in future post-pandemic cities. Smart Cities 2021, 4, 93–111. [Google Scholar] [CrossRef]
  59. Tan, L.; Xiao, H.; Yu, K.; Aloqaily, M.; Jararweh, Y. A blockchain-empowered crowdsourcing system for 5G-enabled smart cities. Comput. Stand. Interfaces 2021, 76, 103517. [Google Scholar] [CrossRef]
  60. Yigitcanlar, T.; Butler, L.; Windle, E.; Desouza, K.C.; Mehmood, R.; Corchado, J.M. Can building “artificially intelligent cities” safeguard humanity from natural disasters, pandemics, and other catastrophes? an urban scholar’s perspective. Sensors 2020, 20, 2988. [Google Scholar] [CrossRef]
  61. Outay, F.; Mengash, H.A.; Adnan, M. Applications of unmanned aerial vehicle (UAV) in road safety, traffic and highway infrastructure management: Recent advances and challenges. Transp. Res. Part A Policy Pract. 2020, 141, 116–129. [Google Scholar] [CrossRef] [PubMed]
  62. Shorfuzzaman, M.; Hossain, M.S.; Alhamid, M.F. Towards the sustainable development of smart cities through mass video surveillance: A response to the COVID-19 pandemic. Sustain. Cities Soc. 2021, 64, 102582. [Google Scholar] [CrossRef] [PubMed]
  63. Rahman, M.M.; Manik, M.M.H.; Islam, M.M.; Mahmud, S.; Kim, J. An automated system to limit COVID-19 using facial mask detection in smart city network. In Proceedings of the IEMTRONICS 2020—International IOT, Electronics and Mechatronics Conference, Vancouver, CB, Canada, 9–12 September 2020. [Google Scholar] [CrossRef]
  64. Allam, Z.; Jones, D.S. Pandemic stricken cities on lockdown. where are our planning and design professionals [now, then and into the future]? Land Use Policy 2020, 97, 104805. [Google Scholar] [CrossRef] [PubMed]
  65. Yigitcanlar, T.; Cugurullo, F. The sustainability of artificial intelligence: An urbanistic viewpoint from the lens of smart and sustainable cities. Sustainability 2020, 12, 8548. [Google Scholar] [CrossRef]
  66. Pineda, V.S.; Corburn, J. Disability, urban health equity, and the coronavirus pandemic: Promoting cities for all. J. Urban Health 2020, 97, 336–341. [Google Scholar] [CrossRef] [Green Version]
  67. OECD. Measuring smart cities’ performance: Do smart cities benefit everyone? In Scoping Note: 2nd OECD Roundtable on Smart Cities and Inclusive Growth; OECD: Paris, France, 2020; Available online: https://www.oecd.org/cfe/cities/Smart-cities-measurement-framework-scoping.pdf (accessed on 1 August 2022).
  68. Hassankhani, M.; Alidadi, M.; Sharifi, A.; Azhdari, A. Smart City and Crisis Management: Lessons for the COVID-19 Pandemic. Int. J. Environ. Res. Public Health 2021, 18, 7736. [Google Scholar] [CrossRef]
  69. Cities and Pandemics: Towards a More Just, Green and Healthy Future; United Nations Human Settlements Programme: Nairobi, Kenya, 2021; Available online: https://unhabitat.org/cities-and-pandemics-towards-a-more-just-green-and-healthy-future-0 (accessed on 1 August 2022).
  70. Kotenko, N.; Bohnhardt, V. Digital health projects financing: Challenges and opportunities. Health Econ. Manag. Rev. 2021, 2, 100–107. [Google Scholar] [CrossRef]
  71. Prokopenko, O.; Shcherbachenko, V.; Kulibaba, V. Health care anti-crisis management issues in the reality of the covid-19 pandemic. Health Econ. Manag. Rev. 2020, 1, 16–23. [Google Scholar] [CrossRef]
  72. Shipko, A.; Demikhova, N.; Pajak, K.; Motrechko, V. Health management at the regional level: Multivariable performance assessment. Health Econ. Manag. Rev. 2020, 1, 8–15. [Google Scholar] [CrossRef]
  73. Smart Cities Need to Be Heading in a Human-Centric, Digitally Inclusive Direction or the Tech Won’t Pay Off, Panelists Agree. IMD. Available online: https://www.imd.org/research-knowledge/videos/smart-cities-need-to-be-human-centric-and-digitally-inclusive/ (accessed on 1 August 2022).
Figure 1. The structure of the Smart City Index. Source: developed by the authors based on [48].
Sustainability 14 12645 g001
Figure 2. Results of bibliometric analysis of scientific research on ‘smart city’ and ‘COVID-19’ for the period 2019–2022. Sources: developed by the authors based on Scopus publications using VOSviewer 1.6.18.
Sustainability 14 12645 g002
Figure 3. Cumulative number of coronavirus cases per 100k inhabitants as of 1 January 2022. Sources: developed by the authors based on [54,55].
Sustainability 14 12645 g003
Figure 4. Cumulative number of coronavirus deaths cases per 100k inhabitants as of 1 January 2022. Sources: developed by the authors based on [54,55].
Sustainability 14 12645 g004
Figure 5. Plot of means for each cluster. Source: developed by the authors using Statistica 10.
Sustainability 14 12645 g005
Table 1. Top 10 smart cities according to different ratings.
RankSmart City Index 2021Smart City Governments 2020/21Sustainable Smart Cities 2021Sustainable Cities Index 2018Quality of Living City Ranking 2019Innovation Cities Index 2021
1SingaporeSingaporeCopenhagenLondonViennaTokyo
2ZurichSeoulOsloStockholmZurichBoston
3OsloLondonZurichEdinburghVancouverNew York
4Taipei CityBarcelonaLondonSingaporeMunichSydney
5LausanneHelsinkiStockholmViennaAucklandSingapore
6HelsinkiNew YorkSingaporeZurichDusseldorfDallas-Fort Worth
7CopenhagenMontrealAmsterdamMunichFrankfurtSeoul
8GenevaShanghaiSydneyOsloCopenhagenHouston
9AucklandViennaNew YorkHong KongGenevaChicago
10BilbaoAmsterdamMunichFrankfurtBaselParis
Source: compiled by the authors based on [48,49,50,51,52,53].
Table 2. Ten most cited Scopus publication on intercept of «smart city» and «COVID-19» for the period 2019–2022.
AuthorsTitleYearSource TitleCited by
Allam Z., Jones D.S. [57]On the coronavirus (COVID-19) outbreak and the smart city network: Universal data sharing standards coupled with artificial intelligence (ai) to benefit urban health monitoring and management2020Healthcare (Switzerland)189
Moreno C., Allam Z., Chabaud D., Gall C., Pratlong F. [58]Introducing the “15-minute city”: Sustainability, resilience and place identity in future post-pandemic cities2021Smart Cities109
Tan L., Xiao H., Yu K., Aloqaily M., Jararweh Y. [59]A blockchain-empowered crowdsourcing system for 5G-enabled smart cities2021Computer Standards and Interfaces69
Yigitcanlar T., Butler L., Windle E., Desouza K.C., Mehmood R., Corchado J.M. [60]Can building “artificially intelligent cities” safeguard humanity from natural disasters, pandemics and other catastrophes? An urban scholar’s perspective2020Sensors (Switzerland)69
Outay F., Mengash H.A., Adnan M. [61]Applications of unmanned aerial vehicle (UAV) in road safety, traffic and highway infrastructure management: Recent advances and challenges2020Transportation Research Part A: Policy and Practice65
Shorfuzzaman M., Hossain M.S., Alhamid M.F. [62]Towards the sustainable development of smart cities through mass video surveillance: A response to the COVID-19 pandemic2021Sustainable Cities and Society59
Rahman M.M., Manik M.M.H., Islam M.M., Mahmud S., Kim J.-H. [63]An automated system to limit COVID-19 using facial mask detection in smart city network2020IEMTRONICS 2020—International IOT, Electronics and Mechatronics Conference, Proceedings58
Allam Z., Jones D.S. [64]Pandemic stricken cities on lockdown. Where are our planning and design professionals [now, then and into the future]?2020Land Use Policy55
Yigitcanlar T., Cugurullo F. [65]The sustainability of artificial intelligence: an urbanistic viewpoint from the lens of smart and sustainable cities2020Sustainability (Switzerland)52
Pineda V.S., Corburn J. [66]Disability, Urban Health Equity, and the Coronavirus Pandemic: Promoting Cities for All2020Journal of Urban Health51
Source: compiled by the authors based on Scopus data as of 1 August 2022.
Table 3. Composition of the clusters.
ClustersComposition of the Cluster (City, Country—SCR *)Cluster Characteristics
Cluster 1 (11 cities)Ankara, Turkey—55, Athens, Greece—111, Bangkok, Thailand—76, Ho Chi Minh City, Vietnam—88, Hong Kong, China—41, Istanbul, Turkey—94, Lagos, Nigeria—115, Makassar, Indonesia—100, Manila, Philippines—102, Medan, Indonesia—99, Vancouver, Canada—33No rule for geography
No rule for SCR
The main criterion is the highest mean for Spread Response
Cluster 2 (10 cities)Bogota, Colombia—116, Budapest, Hungary—97, Buenos Aires, Argentina—98, Jakarta, Indonesia—91, Lisbon, Portugal—95, Medellin, Colombia—101, Mexico City, Mexico—108, Rio de Janeiro, Brazil—118, San Jose, Costa Rica—109, Sao Paulo, Brazil—117Predominantly South America
Lower-than-average SCR
Cluster 3 (12 cities)Boston, United States—57, Chicago, United States—59, Denver, United States—45, Los Angeles, United States—31, Montreal, Canada—38, New York, United States—12, Philadelphia, United States—85, Phoenix, United States—62, San Francisco, United States—60, Seattle, United States—43, Toronto, Canada—36, Washington, United States—35North America
Average and higher SCR
Average mean for Treatment response
Cluster 4 (15 cities)Brisbane, Australia—16, Busan, South Korea—37, Dusseldorf, Germany—20, Hamburg, Germany—40, Hannover, Germany—47, Hanoi, Vietnam—87, Melbourne, Australia—19, Munich, Germany—14, Osaka, Japan—86, Prague, Czech Republic—78, Rome, Italy—112, Seoul, South Korea—13, Singapore, Singapore—1, Tokyo, Japan—84, Vienna, Austria—11Europe + Asia, Australia
Predominantly higher-than-average SCR
Highest mean for Treatment Response and Economic Response
Lowest mean for Spread Response
* SCR—Smart City Rank. Source: developed by the authors using Statistica 10.
Table 4. Correlation analysis results of Smart City Rank 2021 and COVID-19 Cities Readiness and Responsiveness Indicators.
COVID-19 Cities’ Readiness and Responsiveness IndicatorsSmart City Rank 2021 Correlation Coef.t-Valuep-ValueNSig.
Public Health Capacity−0.4242−4.91300.0000112***
Societal Strength−0.5383−6.69830.0000112***
Economic Ability−0.6460−8.87510.0000112***
Infrastructure−0.6039−7.76340.0000107***
Collaborative Will−0.3374−3.75960.0003112***
Spread Response0.22842.16330.033387**
Treatment Response−0.4933−3.88800.000349***
Economic Response−0.3710−4.18950.0001112***
Supply Chain Response−0.3337−3.71290.0003112***
***—significance at 1% level, **—significance at 5% level. Source: developed by the authors.
Table 5. Correlation analysis results of Smart City Ranking and COVID-19 Severity Indicators.
Smart City Indicators1 January 20211 January 2022
Coef.t-Valuep-ValueSig.Coef.t-Valuep-ValueSig.
Cumulative number of coronavirus cases per 100k inhabitants
Smart City Rank 2021−0.0439−0.41490.6792 −0.1656−1.45400.1501
Basic sanitation meets the needs of the poorest areas−0.3344−3.34740.0012***−0.2047−1.81130.0741*
Medical services provision is satisfactory−0.2843−2.79770.0063***−0.1611−1.41390.1615
Arranging medical appointments online has improved access−0.3326−3.32710.0013***−0.3020−2.74300.0076***
Cumulative number of coronavirus deaths cases per 100k inhabitants
Smart City Rank 2021−0.0578−0.45230.6527 0.16351.20650.2330
Basic sanitation meets the needs of the poorest areas−0.5027−4.54200.0000***−0.5738−5.10090.0000***
Medical services provision is satisfactory−0.5189−4.74040.0000***−0.6381−6.03300.0000***
Arranging medical appointments online has improved access−0.4040−3.44910.0010***−0.3950−3.13010.0028***
Coronavirus fatality rate
Smart City Rank 20210.09760.75940.4506 0.45743.74460.0004***
Basic sanitation meets the needs of the poorest areas−0.4536−3.94300.0002***−0.6121−5.63550.0000***
Medical services provision is satisfactory−0.4037−3.41840.0011***−0.7136−7.41580.0000***
Arranging medical appointments online has improved access−0.2717−2.18690.0327**−0.4338−3.50480.0009***
***—significance at 1% level, **—significance at 5% level, *—significance at 10% level. Source: developed by the authors.
Publisher’s Note: MDPI stays neutral with regard to jurisdictional claims in published maps and institutional affiliations.

