
Testing the Resilience of CSR Stocks during the COVID-19 Crisis: A Transcontinental Analysis


Department of Economics and Business, University of Almería, La Cañada de San Urbano, 04120 Almería, Spain
*
Author to whom correspondence should be addressed.
†
These authors contributed equally to this work.
Mathematics 2021, 9(5), 514; https://doi.org/10.3390/math9050514
Submission received: 30 December 2020
/
Revised: 29 January 2021
/
Accepted: 22 February 2021
/
Published: 2 March 2021
(This article belongs to the Special Issue Application of Mathematical Methods to Economics, Management, Finance and Social Problems)
Abstract
:Investors and practitioners are increasingly concerned with financial assets within the scope of corporate social responsibility (CSR) meaning that, in recent times, such assets have become enshrined in the preferences of the new generations of investors and consumers. Just when the interest of investors was at its highest, SARS-CoV-2 (COVID-19) affected all international financial markets, so that, at first sight, it might seem that the financial assets assigned to CSR should have suffered collapses that were identical to the rest; however, our work shows the opposite, providing a comparative analysis of how the pandemic has affected the financial markets of each continent to demonstrate its outstanding resilience through the use of the Wavelets methodology. We analyzed the global impact of the registered cases of COVID-19 on the Dow Jones Sustainability World Index (DJSWI), the world’s leading indicator of sustainable companies, in addition to six other financial indices selected from each continent. The empirical results of this research show that the worldwide repercussions of the sudden outbreak of SARS-CoV-2 has had a substantially smaller effect on sustainability-related indices compared to the other considered indices. Similarly, the methodology employed allowed the establishment of a chronogram with details of the dating of COVID-19 expansion through the considered countries, a certain gradation in terms of the impact of the pandemic on these stock indices, and certain common guidelines describing their devastating effects on each of the financial markets represented by the indices in this research.
Keywords:
Wavelets analysis; Morlet wavelet; frequency-domain; comovements; decomposition; COVID-19; 2020 stock market crash; CSR; international financial marketsMSC:
65T60; 91-05; 91G15; 62P05JEL Classification:
C49; C58; G01; G15; G171. Introduction
The rapid spread of COVID-19 in the economies of the world has led to the proliferation of a large number of studies that have analyzed it from many different points of view. In this sense, the construction of a multidisciplinary framework by Goodell [1] has served as the basis for the development of studies expressly focused on the impact of the pandemic on international financial markets [2,3,4], which were used as models for this research. More specifically, in our work, we applied the wavelet methodology in the analysis of the 2020 financial crisis, demonstrating that the actions taken by companies oriented toward the principles of corporate social responsibility (CSR), i.e., those companies that most respect the environmental, social, and governance (ESG) scores, have been able to withstand the severe impacts of the pandemic with some strength. The Wavelets econometric approach, whose applicability has been demonstrated in a heterogeneous number of scientific disciplines, including human sciences [5], has created a wide field of knowledge in the economic and financial areas [6,7,8,9,10,11,12,13,14]. Effectively, the economic–financial time series are characterized by non-stationarity, noise, and chaotic determinism, as their distributions continuously change over time [15]; hence, wavelet transformations are used to study time series with non-stationary power at various time frequencies [16].
Metaphorically, a wavelet can be considered to be a small wave packet that rises and falls over a period of time [17], which enables the analysis of the cyclical behavior of financial markets [18] or the evolution of economic cycles [19] and the discovery of common patterns of behavior among the variables analyzed as well as the plausible presence of hidden information [17,20,21] that could not be detected by conventional spectral analysis [22], i.e., Fourier analysis. Like this methodology, the Wavelets analysis is defined by assuming that the baseline functions are discrete or continuous throughout the time considered (discrete wavelet transformation (DWT) or continuous wavelet transformation (CWT) see, e.g., Aguiar-Conraria and Soares [20]). It features significant enhancements. Although the Fourier transform facilitates the analysis of the cyclical nature of time series in the frequency domain [20], its implementation systematically leads to the loss of relevant information [18] as it rejects the time information for any arbitrary data set, being only appropriate for strictly stationary time series [17]. Conversely, wavelets analysis is not only restricted to the local analysis [20], since it applies a global approach when assessing the cyclical evolution of the periodic components of time series. Therefore, it is especially suitable in the context of time–frequency variance decomposition [18,23,24] and, in general, in the study of cases defined by time series whose nature is non-homogeneous and locally non-stationary [18].
These econometric procedures have been widely used to analyze the financial crisis of 2008 [25,26,27,28,29] and have begun to be used to analyze the financial crisis resulting from the sudden appearance of COVID-19 [30,31,32,33,34,35,36,37]. However, to the best of our knowledge, it has not yet been applied to explain its impact on the CSR stocks, a crucial sector of the contemporary international finance guided by sustainability parameters on which the weight of the reconstruction of the world’s economies and financial systems will most likely fall once the crisis is finished [38,39].
The resilience of CSR stocks to the pandemic was previously highlighted by Albuquerque et al. [40], who restricted their analysis to the behavior of the U.S. stocks during the first quarter of 2020. In this work, in contrast, the time horizon is significantly extended using both aggregate stock market (index) data and total COVID-19 cases through the period 23 January–31 July 2020. In addition, given the global scope of the pandemic, a transcontinental comparison was performed by taking a representative stock exchange from each continent and attaching it to the SARS-CoV-2 cases reported in each of the countries corresponding to each particular index. In this manner, the following pairs were constructed: ASX 200 (Australia), NIKKEI 225 (Japan), DAX (Germany), JSE TOP-40 USD (South Africa), IBOVESPA (Brazil), and NYSE (United States). The Dow Jones Sustainability World Index (DJSWI) was linked to the total number of global cases of COVID-19 to test the resilience of the CSR stocks globally throughout the pandemic.
The empirical results from this research showed that COVID-19 had significantly less of an overall impact on the volatility of the CSR stocks. Similarly, the joint comparison based on the wavelet methodology (cross-wave power levels) enabled the establishment of an order od the destructive effects of COVID-19 on the major global financial markets, ranging from an evident strong effect on the United States financial markets (NYSE) to an extremely high impact on the Brazilian financial markets (IBOVESPA). The remaining part of this paper is organized as follows: Section 2 provides a review of the literature, summarizing several of the economic areas where the pandemic has had the greatest impact (e.g., international financial markets, labor markets, commodity and energy markets, crypto-currencies, etc.) Section 3 defines the basis of the Wavelets methodology, describing the sources and composition of the database implemented. This is followed by Section 4, which details the empirical results obtained from the application of the wavelets in the previously defined database and, finally, Section 5 presents the main conclusions of this study.
2. State of the Art
In this section, the literature review is subdivided into two parts: the background of the theory of wavelets is summarized, as well as its implications in the analysis of the financial-economic phenomena; then a broad review of the predominant literature that addresses the impact of COVID-19 on the world economies is presented, indicating the main studies that have also used this methodological corpus in other areas.
2.1. Wavelets Literature
The pioneering works on wavelet theory can be traced back to the beginning of the 20th century with the Haar wavelet [41], although it took more than 70 years until Meyer formally defined the second orthogonal wavelet [42]. During that time, the term wavelets was habitually used in different areas such as geophysics [43] or electrical engineering; however, modern wavelet theory [44] appeared toward the middle of the 1980s from the close collaboration between Grossman and Morlet [45], who coined the concept ondelette (wavelets denomination in French, see, e.g., Morlet et al. [46] and Morlet [47]) to design a new theoretical-empirical framework in which the principles of geophysics in conjunction with mathematics could be extrapolated to other scientific fields [44]. This mutual cooperation would mark the beginning of a fertile relationship between mathematics and various disciplines of knowledge such as agriculture [48,49], astronomy [50], biology [51,52,53], electromagnetism [54,55], forestry [56,57], genetics [15], geophysics [46,58,59], hydrology [60,61], meteorology [62,63,64,65,66], oceanography [63], and seismology [43,67].
In subsequent works, Daubechies and Mallat [16,68,69,70] established the building blocks of the orthogonal wavelets, of special significance when defining new wavelets (or mother wavelets). As stated by Torrence Torrence and Compo [64], Farge Farge [71] was essential in the conceptualization of the wavelets using a simple and seminal distinction: whereas the term wavelet function is usually associated with orthogonal as well as non-orthogonal wavelets, the concept of wavelet basis is used to delimitate a group of orthogonal functions in particular. Thus, using an orthogonal basis implies the use of the DWT, whereas a nonorthogonal wavelet function can be used with either the CWT or the DWT. According to Aguiar-Conraria and Soares [20], during the first stages of wavelets research, the lines of investigation were mainly focused on the DWT [6,7,23,24], whereas the papers focused on the application of the CWT represented a clear minority [10,19,20,72,73,74,75,76,77].
This tendency was evident until the present, although the CWT has been employed with some profusion during the last few years in the economic-financial field [17]. In this specific area, for practical purposes, it is usually applied a transformation that could be described as a hybrid between the discrete and the continuous transformations, the maximum overlap discrete wavelet transform (MODWT), see, e.g., Gencay et al. [78]). The initial preeminence in the literature of DWT over CWTwasis explained by Aguiar-Conraria and Soares [20] based on the practicality exhibited by both transformations. The simplicity, ease of implementation, as well as its lower computational requirement of DWT made it prevail over CWT. Depending on the objectives established by each study, one of the two transformations may be specifically foreseeable; therefore, the DWT is usually employed in issues related to noise reduction, data compression, and signal or image processing [20,59], whereas the CWT finds more applicability in other tasks such as feature extraction Grinsted et al. [59]. Many other wavelets have been introduced into the literature, such as Daubechies, Paul, Ricker (or Mexican hat), Shannon, Hermitian hat, or Shannon complex (see, e.g., Machado et al. [64,79] or Ferrer et al. [17]), but the Morlet wavelet [80] has been the one that has had the greatest effects in the field of economy, mainly as a result of its parsimonious character as well as its capacity to outline the concentration of space–time frequencies in an optimal shape [11].
However, the main feature of the Morlet wavelet, its parsimonious nature, is also its main weakness, since, by depending only on a single parameter, its use is not entirely adequate for obtaining an optimal location in time or frequency. Similarly, its results do not always or necessarily have to be robust [77]. Therefore, current lines of research [20,67,81] have focused on the further development and empirical implementation of the generalized Morse wavelets (GMWs), a family of wavelets that can be characterized based on two parameters and that overcome the main restrictions of Morse wavelets. In addition, they allow efficiently subsuming other kinds of wavelets such as Cauchi, Kauder, or derivative of Gaussian (DOG) [77]. Unlike the Morlet wavelet, it is not feasible to univocally convert scales into frequencies, which represents an intrinsic limitation to its application in economic-financial research. In this specific field of knowledge, wavelets have enormous applicability in the analysis of market anomalies and, according to Schmidbauer et al. [18], mainly to the study of the effects of the U.S. presidential cycle, January, or Halloween, which have been extensively reviewed in the literature (see, e.g., Martín Cervantes and Cruz Rambaud [82], Moller and Zilca [83] or Jacobsen and Nuttawat [84]) and have served to refute the paradigmatic efficient-markets hypothesis (EMH) [85].
A viable alternative to the empirical inconsistency of the EMH is the fractal-markets gypothesis (FMH), originally developed by Peters [86], which is based on the assumption that financial markets in general, and stock markets in particular, describe a series of cyclical, iterative, and repetitive patterns that, to a certain extent, can be considered predictable. This hypothesis has been endorsed in conjunction with the theory of wavelets in several financial markets, such as the Asian forex markets [12] or globally in the U.S., European, and Asian financial markets, to quantify the impact of the Global Financial Crisis of 2007 [87]. Following the same philosophy, wavelets have been often employed to study the cyclical behavior of the main world economies [72,73,75,77] to address two complementary perspectives: the consideration of the co-movements of the analyzed time series, whether positive or negative [88,89], and the decomposition, i.e., the ability of wavelets to decompose, or to deconstruct, the variance in time series into an infinite sum of waves of different frequencies or scales [19], which has been applied in the evaluation of monetary policies [24,74], the dissection of the pre-existing relationship between expenditure and income [23], and the evaluation of the effects of oil prices on several key macroeconomic variables such as inflation and industrial output growth rates [76].
The versatility of wavelets is equally reflected in other works such as Fernández [9], in which a new reformulation of the capital asset pricing model (CAPM) methodology is derived for risk evaluation at an international level, by differentiating the risks per se inherent to the markets and to international exchange rates in this new version of the original model Sharpe [90]. Others Machado et al. [79] found strong similarities between the dynamics of the complex physical systems and the financial systems in an empirical analysis conducted on 33 stock market indices (SMIs) distributed throughout the world using six different continuous wavelets.
2.2. Implementations of Wavelets in the Analysis of the Impact of COVID-19
A first defining characteristic of the impact of the COVID-19 crisis on world economies is its enormous global impact, especially in emerging and developing markets. In this regard, the amount initially estimated by the International Monetary Fund and other multilateral institutions to cover the transitional financing deficits of these countries is was USD 2.5 trillion [91]. The impacts of this crisis have differed from the previous economic crisis of 2008, affecting all echelons of the labor market; hence, Merkl and Weber [92] suggested the emergence of a next COVID-19 generation of graduates without the possibility of access to a job, so that employment subsidies are one of the few appropriate measures for the stabilization of the labor factor. Pak et al. [93] indicated the need to establish international measures that can be considered proactive to guarantee the survival of both humans and the economic prosperity that existed before the appearance of COVID-19.
Given the very high degree of uncertainty, the insurance markets have been assessed, fundamentally considering the insurability of the risks derived from the pandemic and the establishment of coordinated contingency plans for the different scenarios in which a crisis may arise [94]. In relation to the construction of a priori predictable scenarios, Esin [95] employed the Kermack–M Kendrick’s epidemiological model [96,97,98] to delimit the consequences of COVID-19 on world markets (based on economic, analytical, empirical, and systemic approaches), as well as the different transmission channels from which the virus spread.
The fever curve for the Swiss economy’ by Burri and Kaufmann [99] is another of the multiple indicators ad hoc constructed to evaluate the performance of an economy in the age of COVID-19. This measure evaluates the conjuncture of the Helvetic economy with a single day’s delay, generating a series of signals that inform investors and public opinion as to whether this economy is improving or worsening. Based on a similar philosophy, Iqbal et al. [32] analyzed the level of relationship between three variables through the Wavelets methodology: the climate, the outbreaks of COVID-19, and the growth or decrease of the Chinese economy. Among their findings, the irrelevance of temperature increased as a determining factor in the elimination or containment of new infections.
Grigoryev et al. [100] reflected on the backdrop of the recession by inferring that it was not a direct consequence of the collapse of the financial sector but it was rather due to the restrictions imposed on consumers. Consequently, the uncertainty in oil prices has impacted world energy markets and all the world economies where employment has been massively destroyed. In this context, the most disadvantaged social classes have been most affected by the parallel decline in consumption and employment, so that the tertiary sector, mainly the hospitality industry and tourism, have seen their growth potential diminished by the population confinements whenever the public authorities have frequently declared the state of alarm in an attempt to limit the daily contingent of the affected inhabitants.
The COVID-19 crisis has been peculiarly felt in the economies of India and Iran, two of the most heavily affected countries. In India, COVID-19 has negatively influenced several key macroeconomic factors such as consumption, supply–demand of goods, unemployment, purchasing power, and markets [101]. The pandemic has drastically worsened the performance of the financial markets in Iran, which has already been experiencing severe burdens since 2018 when sanctions were imposed by the U.S. [30]. COVID-19 has exacerbated the effects of the restrictions to this nation, limiting its productive sectors and inhibiting the growth of startups [102]. Other authors Kamdem et al. [31] detected a strong causal relationship between COVID-19 (measured by the number of confirmed positive cases) and the behavior of commodity prices that can be extrapolated when explaining the continuous declines in oil prices.
Following Connolly et al. [103], the shock in oil prices in the Russian Federation occurred due to the traditional exposure of the economy of this country to the prices of the main energy sources in the face of the lax attitude of the Russian authorities, completely unaware of the gravity of COVID-19 and the emergence of a new world energy order. Despite not having the same level of dependence on oil prices as the Russian economy, the situation was not much different in the U.S. according to the analysis by Sharif et al. [34], who jointly analyzed the degree of diffusion of COVID-19, the volatility in oil prices, the stock market, the geopolitical risk, and the uncertainty derived from the current U.S. economic policies, verifying the enormous impact of the pandemic on the economy of this country. Stifanic et al. [35] analyzed the repercussions of COVID-19 on the evolution of oil prices, extending their research to three representative American index stocks: the NASDAQ Composite, S&P500, and DJI. Using two different networks, the bidirectional long short-term memory (BDLSTM) and stationary wavelet transform(SWT), they obtained a fairly accurate estimate of oil prices on a 5-day time horizon.
Another specific characteristic of the COVID-19 crisis is its synchronous nature, which is different from previous stock market crises such as the 1929 crash or the recent mortgage crisis of 2008. Effectively, although previous crises did not erupt in unison in the world’s financial markets, the 2020 pandemic has entailed practically simultaneous falls in the main international financial markets, with the collapses that occurred from 9–16 March 2020 being especially noteworthy, during which there were successive declines known as Black Monday I, Black Thursday, and Black Monday II [4].
Gherghina et al. [104] examined the relationship between the pandemic and the average daily performance of stock markets in eight countries (Romania, China, the United Kingdom, Germany, France, Italy, the United States, and Spain) from 31 December 2019 to 20 April 2020 applying the Granger’s causality test and the autoregressive distributed lag model (ARDL), focusing their analysis on the impact of COVID-19 on the Romanian financial markets. They empirically discarded a negative short- or long-term impact of this disease in these markets. However, they found negative effects between new deaths in Italy and the Romanian government 10-year bond yield (short- and long-term). Similarly, they found that this bond is allegedly more sensitive to COVID-19-related news than the Bucharest Stock Exchange index (BVB). The impact of COVID-19 on the crypto-currency markets has also been explored using the Wavelets methodology: Habib et al. [36] used the Morlet wavelet to determine a markedly asymmetric relationship between COVID-19, oil prices, and CO2 emission levels; Demir et al. [37] studied the link between two different crypto-currencies (Ethereum (ETH) and Ripple (XRP)) and the level of cases and deaths as a consequence of the pandemic, inferring, among other points, the role of this kind of asset in the face of the uncertainty caused by COVID-19. According to this research, a negative relationship exists between the crypto-currencies and the number of cases and deaths registered, even though this relationship became positive in the period immediately after.
The application of wavelets in the analysis of COVID-19 has not focused solely on the economic-financial domain as it has been adopted in other works focused on the modeling and prediction of the pandemic [105,106,107], the analysis of its main transmission channels [108], the evaluation of climatic impacts on this disease [109], or the implication of polluting factors [110].
3. Materials and Methods
3.1. Wavelets Methodology
Any wavelet can be assigned to a real-value or complex-value function defined on the real axis, assuming that the wavelet is a square integrable function, i.e., [77,79,89]. The minimum conditions required for to be considered as admissible are that the analyzing or mother wavelet has the following assumption, called the condition of admissibility [70]:
where represents the constant of admissibility. Derived from the condition (1), we obtain:
and
i.e., (1) guarantees that any movement of the function is always oscillating around the horizontal axis, hence the name wavelet (or ondelette). Once the mother wavelet is defined, the family of daughter wavelets can be generated by scaling and translating the original mother wavelet [77]:
The width of the wavelet is controlled by s, a dilation or scaling parameter, while its location depends on the parameter . Therefore, both parameters define the dyadic dilation (s) and the dyadic position () Machado et al. [79]. The CWT of the time series in relation to the mother wavelet is the bivariate function:
where and s denote the position of the wavelet in the time and frequency domains, respectively. The wave specifically used in this research, the Morlet wavelet [80], widely used in the economic-financial literature, is generically defined as:
where represents a central frequency of the wavelet and i is the imaginary part of this complex and analytic wavelet, which is relatively centered at the point in the time–frequency domain [89], so the frequency center is restricted to approximately [20]; thus, the relationship between frequency and scale is given by:
For illustrative purposes, Figure 1 traces an arbitrary Morlet wave that has been elaborated using 1000 sample points within the range [, 7].
The CWT of two time series x and y is defined by the equality [62]:
where and represent the corresponding wavelets transformations of the analyzed pair of time series . Wavelet coherence analysis is a measure of the local correlation of two time series as a function of time and scale used, derived from (8) and defined as [64,89]:
where S is a smoothing operator set up to prevent the wavelet coherence from being iteratively equal to one at all scales [89]. values range from 0 to 1: values close to 0 reflect a residual correlation; values close to 1 reflect a strong correlation. The use of the wavelet coherence phase differences serves to determine the probable delays in the oscillation of those time series that tend to describe cyclical movements. According to [64,89], it is defined as:
Therefore, the analysis of the cyclical behavior of the time series x and y can be completely subsumed in the determination of , which is summarized as shown in Figure 2:
The theoretical background of the adopted wavelet approach implemented in the empirical part of this study can be summarized from Addo et al. [21]: Effectively, the Morlet wavelet is the most widely used complex wavelet in the literature, with special profusion in economics and finance. Equation (6) can be redefined as:
where analogous to Equation (5), the parameters and represent the width and a wavelet center, respectively, in the joint analysis of the time series variation in COVID-19 cases vs. variation in stock indexes (Table 1). In this case, the Morlet wavelet that best fits both time series is denoted by the parameters = 1 and = 0.5, respectively. Therefore, Equation (11) can be consequently simplified into Equation (12):
The plots of the wavelet power spectra derived from this equation were elaborated according to Gallegati et al. [11], i.e., with the idea of locating changes in the potential structures of the analyzed time series, mainly, dominant scales of variation in the employed dataset. Similarly, time (t) is represented on the horizontal axis, (X) and the vertical axis (Y) shows the different periods used (daily) together with the equivalent scales of the applied wavelet transforms.
3.2. Data Description
To accomplish this research, we followed a scheme similar to Machado et al. [79] by collecting two types of data: data related to the evolution of the total registered cases of COVID-19 (Table 1), obtained from the Novel Coronavirus (COVID-19) Cases Data from Johns Hopkins University [111], which has become a standard data source in the multidisciplinary analysis of the pandemic. More specifically, data were selected from around the world, as well as from six countries located on each of the five continents: Australia, Brazil, Germany, Japan, South Africa, and the United States. We also used daily adjusted values of seven stock market indices (SMIs) obtained from the databases Bloomberg [112] and S&P Global [113], which are indicative of financial market performance in each of the countries analyzed. Concerning the formal structure of the dataset used, all data were adequately consolidated and tabulated in a common spreadsheet, taking advantage of the analytic potential and flexibility of these nonuniform computation models [114].
Based on this preliminary disposition, two variables were similarly defined: Variable I, which represents the conjuncture of the financial markets analyzed (SMIs), and Variable II, which denotes total registered cases of the pandemic per country. Therefore, wavelets analysis is described in Section 4 for Variables I and II of each country, except for the total number of registered cases of COVID-19 worldwide, which is contrasted with the DJSWI, considering this stock index a proxy of the global investment in assets that meet the fundamental criteria of CSR.
Please note that one of the main issues faced by any investigation focused on SARS-CoV-2 is the quantity, quality, and homogeneity of the available data [33,115], hence the justification for using the Novel Coronavirus (COVID-19) Cases Data. Consequently, the time horizon established was subject to the availability of the data in this source, which ranges from 22 January 2020 onward. For this reason, the joint analysis through wavelets of the expansion of COVID-19 vs. the performance of the main global financial markets was limited to the period of 22 January to 31 July 2020. In all cases, the daily increases in each of the specified variables were calculated (natural logarithm, ), by obtaining a total of 137 observations per variable. For completeness, Figure 3 contextualizes both variables analyzed: Figure 3a displays the countries included in this research and the level of the impact of COVID-19 measured in terms of their daily growth rates. Figure 3b illustrates the excellent performance of the DJSWI, given that its daily growth rate over the time span was significantly higher than the rest of the examined financial markets.
The main descriptive statistics of the analyzed data are listed in Table 2. In accordance with Panel I, only two countries presented an average growth in the number of cases of COVID-19 below the worldwide total (Australia and Japan); the greater variance of two other countries with respect to the rest is noteworthy (Germany and Brazil), which indicates that the growth in the number of cases presented a greater relative variability or this impact was somewhat more sudden in these countries.
Analogously, the exploratory analysis of the considered financial markets Panel II) showed a series of common guidelines that can be deemed similar across all the indices. In effect, in all cases, the volatility exhibited very close values and the mean showed negative values, which is a consequence of the global impact of the pandemic on the international markets. However, the stock index linked to the CSR (DJSWI) exhibited the least decline over the analyzed time horizon. Figure 4 reflects the evolution of each financial market throughout the early stages of the pandemic from two different perspectives: Figure 4a is a violins plot [116] of the probability densities of each SMI, corroborating the best performance of the DJSWI with respect to the rest as it is the first in terms of the average value of its returns and the second in terms of the least volatility (after the NIKKEI 225 index). Figure 4b presents the joint performance of the SMIs analyzed. This chart was drawn taking the projection of the values of each index in base 100 on 31 December 2019 as the reference point, the date on which the first case of COVID-19 was officially registered in Wuhan [117], until 31 July 2020. Prior to the global spread of COVID-19, from the beginning of 2020 to March 2020, three indices showed a fairly positive evolution: ASX 200, DAX, and the DJSWI. Despite the consecutive falls in the value of all indices as a result of the irruption due to COVID-19 (Black Monday I, Black Thursday, and Black Monday II) [4], the strength of the DJSWI can be noted in this figure since it is the only stock index that was able to return to its original values at the beginning of 2020 on 31 July 2020.
4. Empirical Results
The Wavelets methodology was applied to obtain the individual wavelets power spectra (WPS) and their corresponding average cross-wavelet spectra (ACPS) for each analyzed country (Table 1). The pairs of time series analyzed were formed by: (a) the variation in the registered cases of COVID-19 in each nation over (b) the variation in a stock index representative of each particular country (i.e., the returns). In all cases, the increases in the time series corresponded to daily frequencies. In addition, since the global total reported COVID-19 cases was considered, another pair of series was built (variation in global cases of the pandemic vs. DJSWI variation) to monitor the international impact of the pandemic and, especially, to find whether the financial assets within the scope of CSR were resilient to the ripple effects of this financial crisis. Derived from the application of wavelets to this study, the wavelet coherency (WC) and the phase-differences analyses were assessed for each pair of considered time series.
Following the literature (see, e.g., Kumar et al. [12,18,20,89] or Ferrer et al. [17]), a contour map (more specifically, a heat map) was first constructed to visualize adequately each WPS and ACPS (Figure 5 and Figure 6). According to both figures, the color shades assigned in each figure denote the power of the phase difference, with intensity varying between minimum values (dark blue) and maximum values (dark red). Likewise, the frequency was transformed into time units using a daily periodification consistent with the increases depicted by the pairs of indicative time series of each country, spanning periods of only one day (1 ds, bottom part of the charts) to periods of 32 days (32 ds, top part of the charts). The x-axis determines the holding period analyzed (22 January–31 July 2020) which, to obtain a greater detail, has been divided into six consecutive monthly subperiods (from 19 February to 8 July). The most relevant subperiods for the effects of our analysis are 19 February and 18 March: between them, the greatest variations occurred in the analyzed indices and there was an alarming increase in the registered cases of COVID-19 at the global level as well as in each one of the six countries. The direction of the superimposed black arrows represents the phase difference analysis (left part of each figure), where a zero phase difference implies that the underlying pair of time series shifted together on a specific time scale [17].
Using Figure 2 as a reference, when arrows are pointing to the right, the time series are in phase (pro-cyclical or positively correlated; i.e., or ), whereas arrows pointing to the left denote that the series are out of phase (anti-cyclical or negatively correlated; i.e., or ). The ACPS available on the right of each figure (also known as the global wavelet power spectrum, see Kumar et al. [12]) is a useful measure for statistically verifying the occurrence of possible disparities or similarities between the pairs of series analyzed according to the defined time scale (daily, in this case). The ACPS is also an accurate indicator of probable common co-movements or interdependences between variations of registered cases of COVID-19 and the evolution of the considered SMIs. Figure 5 depicts the variation in DJSWI versus the variation in the reported worldwide cases of COVID-19 versus, i.e., TCC(WV) over DJSWI. As expected, the intensity of the contour plots of the reviewed pairs of time series was not constant over time [17], which is also reflected in Figure 6.
As shown in Figure 5, the global impact of COVID-19 on the index that includes the most important international companies in compliance with the sustainability parameters (DJSWI) was considerably less than on the other analyzed indices (Figure 6), with a maximum wavelets frequency of 0.6. Similarly, Figure 5 shows that there was no significant turbulence during practically any subperiod or that the turbulence was much lower than in the rest of the indices analyzed, as shown in Figure 6. The greatest increases in volatility occurred around the 18 March subperiod, after the continual increases in COVID-19 cases that occurred worldwide during the first half of March 2020 and the consecutive drops in the main world financial markets on 9, 12, and 16 March. Figure 5 also depicts the impact of the initial phases of the pandemic on the DJSWI index, considering that the 2020 financial crisis began on 20 February [118]; in the 19 February subperiod is when high levels of volatility were observed (with approximately 10 days’ lead time). This behavior can be considered in phase or pro-cyclical according to the direction indicated by the black arrows superimposed on the plot. Figure 6 depicts the same analysis for the pair of daily series corresponding to each country, i.e., United States (NYSE over TCC(US) (Figure 6a), Germany (DAX over TCC(GER) (Figure 6b), Japan (NIKKEI 225 over TCC(JAP) (Figure 6c), South Africa (JSE TOP-40 USD over TCC(SA) (Figure 6d), Australia (ASX 200 over TCC(AUS) (Figure 6e), and Brazil (IBOVESPA over TCC(BRA) (Figure 6f). Note the splitting of Figure 6 into consecutive subfigures to facilitate the visualization of the possible presence of comovements between the pairs of series.
The application of the Wavelets methodology in Figure 5 and Figure 6 enabled the detection of a series of common guidelines regarding the incidence of COVID-19 in the six analyzed financial markets and the stock market index representative of the sustainability, characterized by the ESG scores (DJSWI). In all cases, the blue horizontal stripes of the contour plots almost iteratively denoted the existence of minimum volumes of volatility around 1.5 days. The ACPS revealed the presence of common comovements given a frequency of 32 days (at the 1% level) between the variation in cases of COVID-19 and the returns of the SMIs, with the only exception being Germany (Figure 6b). The case of Brazil is particularly remarkable (Figure 6f): in addition to 32-day comovements, joint movements were also detected at a much lower daily frequency, practically between 2 and 2.5 days.
This phenomenon is congruent with the observed bagging process of the volatility in the contour plot for Brazil on a low daily scale (between 2 and 4 days). Being less accentuated, this volatility conglomeration was similar in Japan (Figure 6c), South Africa (Figure 6d), and Australia (Figure 6e). However, the effects of volatility in the Asian country at 32 days were practically non-existent, while they were fully perceptible in Germany (Figure 6b). The United States (Figure 6a) was the most stable nation throughout the pandemic in terms of the series pairs analyzed, although the wavelet analysis conducted among the registered global cases of COVID-19 and the DJSWI returns showed that this relationship was by far the most stable among the pairs of series considered (Figure 5), underlining the global resilience of the financial assets assigned to CSR given the sudden irruption due to COVID-19 in the international financial scenario.
Figure 7 exhibits a comparative summary of the different repercussions of COVID-19 on the seven indices through the use of a radar chart [119] by exhibiting their effects based on the maximum wavelet-level daily frequencies reached in each SMI during the established time period.
From Figure 7, the different effects of COVID-19 on the main international markets of each continent can be synthesized. Again, noting that the DJSWI was the SMI that was least impacted considering the total number of the worldwide registered cases of COVID-19, the following order was established in relation to the impact of COVID-19 on the stocks indices analyzed: (1) U.S., (2) Germany, (3) Japan, (4) South Africa, (5) Australia, and, (6) Brazil. Table 3 depicts a brief chronogram of the wavelet coherence analysis of the detected phase differences. Please note that the analysis performed for the series of (WV) over DJSWI was the only one that was in phase at 32 days for all subperiodays In subperiod 8 July, four months after the WHO declared the pandemic status [120], none of the time series appeared to be in phase or out of phase. At 32 days, only Australia was in phase (10 June subperiod), but in the immediately preceding subperiod (13 May) Australia and Brazil were out of phase. On 15 April, when the pandemic had already impacted all countries around the world, all the financial markets analyzed (excluding DJSWI and Japan) displayed clearly anti-cyclical behavior.
Observing the first stages of the established time horizon, we confirmed that the effects of COVID-19 on the main world financial markets started to be felt on 20 February [118]: in the 19 February subperiod, all the SMIs were out of phase at 32 days (except the DJSWI) and even at 16 days in the case of Japan. The 18 March subperiod was the most relevant, since it clearly reflected the effects of the pandemic on each financial market, as well as the patterns described by each, following the successive falls of March 2020 (Black Monday I (9 March), Black Thursday (12 March), and Black Monday II (16 March)) in which the virulence of the pandemic caused the transitory collapse of the world’s economies. In this subperiod, the U.S. and Germany followed relatively close patterns, i.e., in phase, during all established daily frequencies, except for 32 days. In Australia, the behavior was somewhat similar; however, at 16 days, it was not possible to determine whether the trend was purely pro-cyclical or anti-cyclical. On the contrary, South Africa was out of phase for all daily frequencies, while Japan remained in the same state only for the highest daily frequencies (16 and 32 days). Finally, Brazil demonstrated a mixed’ pattern in the 18 March subperiod: in phase given the frequencies of 1, 2, and 4 days and out of phase at 16 and 32 days.
5. Conclusions
In this work, the impact of COVID-19 on several of the most pre-eminent global financial markets was analyzed, linking the evolution of the registered cases of COVID-19 to the performance of six financial indexes located on each of the five continents. Similarly, we emphasized analyzing the repercussions of COVID-19 on the financial assets included within the scope of CSR (DJSWI). In this respect, the application of the Wavelets methodology led to various conclusions: the stocks related to sustainability were substantially less impacted by SARS-CoV-2, an element that reinforces the hypothesis of Albuquerque et al. [40], who justified such resilience with the loyalty of the new generations of consumers and investors in the social image projected by sustainable companies as a whole. Our findings confirm the conclusions drawn by Dynkin and Telegina [38]: the pandemic has led to a reorientation of the demand of consumers toward specific areas other than the traditional ones, heralding the advent of post-crisis economies focused on alternative or renewable energies (moving away CO2) to achieve sustainable and responsible development. In this sense, our findings anticipate the sustainable energy transition announced by Kuzemko et al. [39].
In general, the application of wavelets to the study of the influence of COVID-19 on the different financial markets revealed, as stated by Kumar et al. [12], that the observed unexpected changes in the structure of the variability of returns were due to the variable structure of investors’ activities in a context of complete uncertainty, as the outcome of COVID-19 was catastrophic in international finance as a whole, being more detrimental than the Spanish flu Ceylan et al. [121].
The analysis of the coherence of the waves allowed us to map the impact of COVID-19, finding some stylized facts characterizing its repercussions. For example, the ACPS detected co-movements between the variation in cases of COVID-19 and the returns of the stock indices (except for Germany) given a daily frequency of 32 days, from which a gradual decrease in volatility was also perceptible from the 18 March subperiod onward. Relatively specific or differentiated relationships were also found in each country: the financial crisis resulting from COVID-19 was more intense in the financial markets of South Africa (mainly), Brazil, and Australia than in the United States, Japan, and Germany. The coherence of the waves enabled the establishment of a chronogram in which the corresponding movements in or out of phase with the financial markets analyzed were described. The analysis at the global level on the financial assets included in CSR showed that in each sub-period, these were in phase, with the United States showing a fairly similar trend. The persistence of volatility in Brazil and Australia was notable, also from the 13 May subperiod onwards, which was not appreciable in the rest.
The main contributions of this paper to the literature should be highlighted: we summarized an extraordinarily complex phenomenon, the global repercussions of COVID-19, on the main international financial markets, providing an overall view and detailing its unequal evolution in each of the five continents through the wavelets methodology. To the best of our knowledge, this transcontinental analytical perspective represents a completely innovative approach that may lead to future lines of research that adhere to this framework. One of the crucial aspects in the investigation of the most recent financial crises, whether systemic or non-systemic (such as the emergence of COVID-19) is accurately determining the key dates during which the market crashes occurred (see, e.g., Martín Cervantes and Cruz Rambaud [122]). This timing was extensively described in this paper, with specific reference to the different levels of volatility emanating from these markets at different time frequencies in each of the financial markets examined.
As stated by Ramsey [7], wavelets must be “treated as a ’lens’ that enables the researcher to explore relationships that previously were unobservable”; hence, future lines of research can be derived from this work considering the versatility of the wavelets methodology, which is especially suitable for analyzing contexts with extreme volatility in detail, like the one presented here. For example, another line of research would be using high-frequency data [89] expressly focused on analyzing the impact of COVID-19.
A factor that can enrich the transnational studies of SARS-CoV-2 is the analysis of big data from all social aspects involved, directly or indirectly, in the evolution of the main economic variables [123]: the implications were multiple during the course of the pandemic, with its impact collected in real time in the most widespread social networks, so the categorization of different types of online content (i.e, something, news, topics, and events, see Thai et al. [123]) enables the extension of research toward other methodological approaches, such as sentiment analysis [124], in which the evolution of the mood of the whole community or, at least, a large part of it, can be describe.
Finally, two important observations need to be addressed. The main limitation of this work, like any other that analyzes statistical data related to COVID-19, is the lack of standardized and harmonized data at the international level, which would allow for the establishment of inferences about the evolution of the pandemic from reliable, homogeneous, and contrasted international databases, as previously stated by Mustafa et al. [33], Makhortykh et al. [115], and Vázquez Lázara et al. [125]. It is also necessary to consider the real meaning of this crisis: according to Roberts [126], the previous financial crises (the 9/11 attacks or the subprime mortgage crisis of 2008) were limited to an iron paradigm in which crises were considered abnormal events. However, the COVID-19 crisis has triggered a revision of this paradigm and everything that seemed abnormal before may be completely normal in the near future, so policy makers have had to reconsider their position on the current conceptualization and future impact of the pandemic.
Author Contributions
Investigation, data curation, supervision, funding acquisition, M.d.C.V.M.; Conceptualization, methodology, software, writing—original draft preparation, P.A.M.C. All authors have read and agreed to the published version of the manuscript.
Funding
This research received no external funding.
Institutional Review Board Statement
Not applicable.
Informed Consent Statement
Not applicable.
Data Availability Statement
Data have been retrieved from the publicly archived datasets: “Novel Coronavirus (COVID-19) Cases Data from Johns Hopkins University” (https://coronavirus.jhu.edu/data), “Bloomberg” (https://www.bloomberg.com/professional/solution/financial-data-management/) and “S&PG Global” (https://www.spglobal.com/spdji/en/indices/esg/dow-jones-sustainability-world-enlarged-index-ex-alcohol-tobacco-gambling-armaments-firearms-and-adult-entertainment/#overview), accessed in all cases on 29 September 2020.
Acknowledgments
The authors would like to thank Jose A. Tenreiro Machado (Polytechnic of Porto) for the encouragement to make this manuscript a reality. We express our sincere gratitude.
Conflicts of Interest
The authors declare no conflict of interest.
Abbreviations
The following abbreviations are used in this manuscript:
| ACPS | Average Cross-Wavelet Spectrum |
| CAPM | Capital Asset Pricing Model |
| COVID-19 | 2019-nCoV acute respiratory disease/Novel coronavirus pneumonia |
| CWT | Continuous Wavelet Transformation |
| DWT | Discrete Wavelet Transformation |
| EMH | Efficient-Markets Hypothesis |
| FMH | Fractal-Markets Hypothesis |
| GMWs | Generalized Morse Wavelets |
| MODWT | Maximum Overlap Discrete Wavelet Transform |
| SMIs | Stock market indices |
| WPS | Wavelets Power Spectrum |
| WC | Wavelet Coherency |
References
- Goodell, J.W. COVID-19 and finance: Agendas for future research. Financ. Res. Lett. 2020, 35, 101512. [Google Scholar] [CrossRef] [PubMed]
- Akhtaruzzaman, M.; Boubaker, S.; Sensoy, A. Financial contagion during COVID-19 crisis. Financ. Res. Lett. 2020, 38, 101604. [Google Scholar] [CrossRef]
- Gharib, C.; Mefteh-Wali, S.; Ben Jabeur, S. The bubble contagion effect of COVID-19 outbreak: Evidence from crude oil and gold markets. Financ. Res. Lett. 2020, 38, 101703. [Google Scholar] [CrossRef]
- Mazur, M.; Dang, M.; Vega, M. COVID-19 and the march 2020 stock market crash. Evidence from S&P1500. Financ. Res. Lett. 2020, 38, 101690. [Google Scholar] [PubMed]
- Aguiar-Conraria, L.F.; Magalhães, P.C.; Soares, M.J. Application of wavelets to the study of political history. In Encyclopedia of Complexity and Systems Science; Meyers, R.A., Ed.; Springer: Berlin/Heidelberg, Germany, 2015. [Google Scholar]
- Ramsey, J.B. The contribution of wavelets to the analysis of economic and financial data. Philos. Trans. Math. Phys. Eng. Sci. 1999, 357, 2593–2606. [Google Scholar] [CrossRef]
- Ramsey, J.B. Wavelets in Economics and Finance: Past and Future. Stud. Nonlinear Dyn. Econom. 2002, 6, 1. [Google Scholar] [CrossRef] [Green Version]
- Schleicher, C. An Introduction to Wavelets for Economists; Technical Report 2002-32, Working Papers; Monetary and Financial Analysis Department, Bank of Canada: Ottawa, ON, Canada, 2002. [Google Scholar]
- Fernández, V. The international CAPM and a wavelet-based decomposition of value at risk. Stud. Nonlinear Dyn. Econom. 2005, 9, 1328. [Google Scholar]
- Crowley, P.M. A guide to wavelets for economists. J. Econ. Surv. 2008, 21, 207–267. [Google Scholar] [CrossRef]
- Gallegati, M.; Gallegati, M.; Rammsey, J.B.; Semmler, W. Does productivity affect unemployment? A time-frequency analysis for the US. In Wavelet Applications in Economics and Finance; Dynamic Modeling and Econometrics in Economics and Finance; Gallegati, M., Semmler, W., Eds.; Springer International Publishing: Cham, Switzerland, 2014; Volume 20, pp. 23–46. [Google Scholar]
- Kumar, A.S.; Jayakumar, C.; Kamaiah, B. Fractal market hypothesis: Evidence for nine Asian forex markets. Indian Econ. Rev. 2017, 52, 181–192. [Google Scholar] [CrossRef]
- Tiwari, A.; Cunado, J.; Gupta, R.; Wohar, M. Are stock returns an inflation hedge for the UK? Evidence from a wavelet analysis using over three centuries of data. Stud. Nonlinear Dyn. Econom. 2018, 23, 20170049. [Google Scholar] [CrossRef] [Green Version]
- Owusu Junior, P.; Kwaku Boafo, B.; Awuye, B.K.; Bonsu, K.; Obeng-Tawiah, H. Co-movement of stock exchange indices and exchange rates in Ghana: A wavelet coherence analysis. Cogent Bus. Manag. 2018, 5, 1481559. [Google Scholar] [CrossRef]
- Tenreiro Machado, J.A.; Costa, A.C.; Quelhas, M.D. Wavelet analysis of human DNA. Genomics 2011, 98, 155–163. [Google Scholar] [CrossRef] [Green Version]
- Daubechies, I. The wavelet transform, time-frequency localization and signal analysis. IEEE Trans. Inf. Theory 1990, 36, 961–1005. [Google Scholar] [CrossRef] [Green Version]
- Ferrer, R.; Jammazi, R.; Bolós, V.J.; Benítez, R. Interactions between financial stress and economic activity for the U.S.: A time- and frequency-varying analysis using wavelets. Phys. A Stat. Mech. Appl. 2018, 492, 446–462. [Google Scholar] [CrossRef]
- Schmidbauer, H.; Röosch, A.; Uluceviz, E.; Erkol, N. Are American and European equity markets in phase?—Frequency aspects of return and volatility spillovers. In Proceedings of the Conference EcoMod 2016, Lisbon, Portugal, 6–8 July 2016. [Google Scholar]
- Crowley, P.M. Long cycles in growth: Explorations using new frequency domain techniques with US data. In Bank of Finland Research Discussion Papers; Bank of Finland: Helsinki, Finland, 2010. [Google Scholar]
- Aguiar-Conraria, L.F.; Soares, M.J. The Continuous Wavelet Transform: A Primer; NIPE Working Papers; Universidade de Minho, Núcleo de Investigação em Políticas Económica: Braga, Portugal, 2011. [Google Scholar]
- Addo, P.M.; Billio, M.; Guégan, D. Nonlinear dynamics and wavelets for business cycle analysis. In Wavelet Applications in Economics and Finance; Dynamic Modeling and Econometrics in Economics and Finance; Gallegati, M., Semmler, W., Eds.; Springer International Publishing: Cham, Switzerland, 2014; Volume 20, pp. 73–100. [Google Scholar]
- Priestley, M. Spectral Analysis and Time Series, 7th ed.; Academic Press: San Diego, CA, USA, 1992. [Google Scholar]
- Ramsey, J.B.; Lampart, C. The Decomposition of Economic Relationships by Time Scale Using Wavelets: Expenditure and Income. Stud. Nonlinear Dyn. Econom. 1998, 3, 23–42. [Google Scholar] [CrossRef]
- Ramsey, J.B.; Lampart, C. Decomposition of economic relationships by time scale using wavelets: Money and income. Macroecon. Dyn. 1998, 2, 49–71. [Google Scholar] [CrossRef]
- Baruník, J.; Vácha, L. Contagion among Central and Eastern European Stock Markets during the Financial Crisis. Czech J. Econ. Financ. Aúvěr 2013, 63, 443–453. [Google Scholar]
- Reboredo, J.C.; Rivera-Castro, M.A. Wavelet-based evidence of the impact of oil prices on stock returns. Int. Rev. Econ. Financ. 2014, 29, 145–176. [Google Scholar] [CrossRef]
- Ivanov, I.; Kabaivanov, S.; Bogdanova, B. Stock market recovery from the 2008 financial crisis: The differences across Europe. Res. Int. Bus. Financ. 2016, 37, 360–374. [Google Scholar] [CrossRef]
- Poměnková, J.; Klejmová, E.; Kučerová, Z. Cyclicality in lending activity of Euro area in pre- and post- 2008 crisis: A local-adaptive-based testing of wavelets. Balt. J. Econ. 2019, 19, 155–175. [Google Scholar] [CrossRef]
- Polanco-Martínez, J.; Fernández-Macho, J.; Neumann, M.; Faria, S. A pre-crisis vs. crisis analysis of peripheral EU stock markets by means of wavelet transform and a nonlinear causality test. Phys. A Stat. Mech. Appl. 2018, 490, 1211–1227. [Google Scholar] [CrossRef]
- Samadi, A.; Owjimehr, S.; Nezhad Halafi, Z. The cross-impact between financial markets, Covid-19 pandemic, and economic sanctions: The case of Iran. J. Policy Model. 2020. [Google Scholar] [CrossRef]
- Sadefo Kamdem, J.; Bandolo Essomba, R.; Njong Berinyuy, J. Deep learning models for forecasting and analyzing the implications of COVID-19 spread on some commodities markets volatilities. Chaos Solitons Fractals 2020, 140, 110215. [Google Scholar] [CrossRef] [PubMed]
- Iqbal, N.; Fareed, Z.; Shahzad, F.; He, X.; Shahzad, U.; Lina, M. The nexus between COVID-19, temperature and exchange rate in Wuhan city: New findings from partial and multiple wavelet coherence. Sci. Total Environ. 2020, 729, 138916. [Google Scholar] [CrossRef] [PubMed]
- Mustafa, S.; Ayaz Ahmad, M.; Baranova, V.; Deineko, Z.; Lyashenko, V.; Oyouni, A. Using wavelet analysis to assess the impact of COVID-19 on changes in the price of basic energy resources. Int. J. Emerg. Trends Eng. Res. 2020, 8, 2907–2912. [Google Scholar] [CrossRef]
- Sharif, A.; Aloui, C.; Yarovaya, L. COVID-19 pandemic, oil prices, stock market, geopolitical risk and policy uncertainty nexus in the US economy: Fresh evidence from the wavelet-based approach. Int. Rev. Financ. Anal. 2020, 70, 101496. [Google Scholar] [CrossRef]
- Štifanić, D.; Musulin, J.; Miočević, A.; Baressi Šegota, S.; Šubić, R.; Car, Z. Impact of COVID-19 on Forecasting Stock Prices: An Integration of Stationary Wavelet Transform and Bidirectional Long Short-Term Memory. Complexity 2020, 2020, 1–12. [Google Scholar] [CrossRef]
- Habib, Y.; Xia, E.; Fareed, Z.; Hashmi, S. Time-frequency co-movement between COVID-19, crude oil prices, and atmospheric CO2 emissions: Fresh global insights from partial and multiple coherence approach. Environ. Dev. Sustain. 2020. [Google Scholar] [CrossRef]
- Demir, E.; Bilgin, M.; Karabulut, G.; Doker, A. The relationship between cryptocurrencies and COVID-19 pandemic. Eurasian Econ. Rev. 2020, 10, 349–360. [Google Scholar] [CrossRef]
- Dynkin, A.; Telegina, E. Pandemic shock and the world after crisis. World Econ. Int. Relat. 2020, 64, 5–16. [Google Scholar] [CrossRef]
- Kuzemko, C.; Bradshaw, M.; Bridge, G.; Goldthau, A.; Jewell, J.; Overland, I.; Scholten, D.; Van de Graaf, T.; Westphal, K. Covid-19 and the politics of sustainable energy transitions. Energy Res. Soc. Sci. 2020, 68, 101685. [Google Scholar] [CrossRef]
- Albuquerque, R.A.; Koskinen, Y.J.; Yang, S.; Zhang, C. Resiliency of Environmental and Social Stocks: An Analysis of the Exogenous COVID-19 Market Crash, 2020; Finance Working Paper No. 676/2020; European Corporate Governance Institute: mboxBrussels, Belgium, 2020; Available online: https://ssrn.com/abstract=3583611 (accessed on 29 September 2020).
- Haar, A. Zur Theorie der orthogonalen Funktionensysteme. Math. Ann. 1910, 69, 331–371. [Google Scholar] [CrossRef]
- Meyer, Y. Principe d’incertitude, bases hilbertiennes et algèbres d’opérateurs. In Séminaire Bourbaki; Astérisque; Société Mathématique de France: Paris, France, 1987; Volume 1985–1986, pp. 651–668. [Google Scholar]
- Ricker, N.H. Wavelet Contraction, Wavelet Expansion, and the Control of Seismic Resolution. Geophysics 1953, 18, 769–792. [Google Scholar] [CrossRef]
- Gasquet, C.; Witomski, P. Fourier analysis and applications: Filtering, numerical computation, wavelets. In Texts in Applied Mathematics; Springer Science & Business Media: New York, NY, USA, 1998; Volume 30. [Google Scholar]
- Grossmann, A.; Morlet, J. Decomposition of Hardy functions into square integrable wavelets of constant shape. SIAM J. Math. Anal. 1984, 15, 723–736. [Google Scholar] [CrossRef]
- Morlet, J.; Arens, G.; Fourgeau, E.; Giard, D. Wave Propagation and Sampling Theory (Parts I and II). Geophysics 1982, 47, 203–236. [Google Scholar] [CrossRef] [Green Version]
- Morlet, J. Sampling theory and wave propagation. In Issues in Acoustic Signal—Image Processing and Recognition. NATO ASI Series; Chen, C., Ed.; Series F: Computer and System Sciences; Springer: Berlin/Heidelberg, Germany, 1983; Volume 1, pp. 233–261. [Google Scholar]
- Dong, X.; Nyren, P.; Patton, B.; Nyren, A.; Richardson, J.; Maresca, T. Wavelets for Agriculture and Biology: A Tutorial with Applications and Outlook. BioScience 2008, 58, 445–453. [Google Scholar] [CrossRef] [Green Version]
- Singh, C.B.; Choudhary, R.; Jayas, D.S.; Paliwal, J. Wavelet Analysis of Signals in Agriculture and Food Quality Inspection. Food Bioprocess Technol. 2010, 3, 2–12. [Google Scholar] [CrossRef]
- Scargle, J.D. Astronomical time series analysis. In Astronomical Time Series; Astrophysics and Space Science Library; Maoz, D., Sternberg, A., Leibowitz, E.M., Eds.; Springer: Dordrecht, The Netherlands, 1997; Volume 28. [Google Scholar]
- Unser, M.; Aldroubi, A. A review of wavelets in biomedical applications. Proc. IEEE 1996, 84, 626–638. [Google Scholar] [CrossRef]
- Aldroubi, A.; Unser, M. Wavelets in Medicine and Biology; CRC Press: Boca Ratón, FL, USA, 1996. [Google Scholar]
- Liò, P. Wavelets in bioinformatics and computational biology: State of art and perspectives. Bioinformatics 2003, 19, 2–9. [Google Scholar] [CrossRef] [PubMed]
- Rickard, Y. An efficient wavelet-based solution of electromagnetic field problems. Appl. Numer. Math. 1996, 58, 472–485. [Google Scholar] [CrossRef]
- Pan, G.W. Wavelets in electromagnetics and device modeling. In Wiley Series in Microwave and Optical Engineering; John Wiley & Sons: Hoboken, NJ, USA, 2003; Volume 159. [Google Scholar]
- Yuanhu, D. Wavelet analysis and its application in forestry. J. Northeast For. Univ. 1996, 7, 81–84. [Google Scholar]
- James, P.M.A.; Sturtevant, B.R.; Townsend, P.; Wolter, P.; Fortin, M.J. Two-dimensional wavelet analysis of spruce budworm host basal area in the Border Lakes landscape. Ecol. Appl. 2011, 21, 2197–2209. [Google Scholar] [CrossRef]
- Foufoula-Georgiou, E.; Kumar, P. Wavelet analysis in geophysics: An introduction. In Wavelet Analysis and Its Applications; Foufoula-Georgiou, E., Kumar, P., Eds.; Academic Press: London, UK, 1994; Volume 4, pp. 1–43. [Google Scholar]
- Grinsted, A.; Moore, J.C.; Jevrejeva, S. Application of the cross wavelet transform and wavelet coherence to geophysical time series. Nonlinear Process. Geophys. 2004, 11, 561–566. [Google Scholar] [CrossRef]
- Brillinger, D.R. Some uses if cumulants in wavelet analysis. J. Nonparametr. Stat. 1996, 6, 93–114. [Google Scholar] [CrossRef]
- Brillinger, D.R. A note on river wavelets. Environmetrics 1994, 5, 211–220. [Google Scholar] [CrossRef]
- Hudgins, L.; Friehe, C.A.; Mayer, M.E. Wavelet transforms and atmopsheric turbulence. Phys. Rev. Lett. 1993, 71, 3279–3282. [Google Scholar] [CrossRef] [PubMed]
- Meyers, S.D.; Kelly, B.G.; O’Brien, J.J. An Introduction to Wavelet Analysis in Oceanography and Meteorology: With Application to the Dispersion of Yanai Waves. Mon. Weather Rev. 1993, 121, 2858–2866. [Google Scholar] [CrossRef] [Green Version]
- Torrence, C.; Compo, G.P. A Practical Guide to Wavelet Analysis. Bull. Am. Meteorol. Soc. 1998, 79, 61–78. [Google Scholar] [CrossRef] [Green Version]
- Torrence, C.; Webster, P.J. Interdecadal Changes in the ENSO-Monsoon System. J. Clim. 1999, 12, 2679–2690. [Google Scholar] [CrossRef] [Green Version]
- Nazari-Sharabian, M.; Karakouzian, M. Relationship between Sunspot Numbers and Mean Annual Precipitation: Application of Cross-Wavelet Transform—A Case Study. J. Multidiscip. Sci. J. 2020, 3, 67–78. [Google Scholar] [CrossRef] [Green Version]
- Whitney, R. Quantifying near fault pulses using generalized Morse wavelets. J. Seismol. 2019, 23, 1115–1140. [Google Scholar] [CrossRef]
- Daubechies, I. Orthonormal bases of compactly supported wavelets. Commun. Pure Appl. Math. 1988, 41, 909–996. [Google Scholar] [CrossRef] [Green Version]
- Mallat, S.G. A theory for multiresolution signal decomposition: The wavelet representation. IEEE Trans. Pattern Anal. Mach. Intell. 1989, 7, 674–693. [Google Scholar] [CrossRef] [Green Version]
- Daubechies, I. Ten Lectures on Wavelets; SIAM Press: Philadelphia, PA, USA, 1992. [Google Scholar]
- Farge, M. Wavelet transforms and their applications to turbulence. Annu. Rev. Fluid Mech. 1992, 24, 395–457. [Google Scholar] [CrossRef]
- Jagrič, T.; Ovin, R. Method of analyzing business cycles in a transition economy: The case of Slovenia. Dev. Econ. 2004, 42, 42–62. [Google Scholar] [CrossRef]
- Crowley, P.M.; Mayes, D.G. How fused is the Euro area core?: An evaluation of growth cycle co-movement and synchronization using wavelet analysis. J. Bus. Cycle Meas. Anal. 2008, 4, 63–95. [Google Scholar] [CrossRef]
- Aguiar-Conraria, L.F.; Azevedo, N.; Soares, M.J. Using wavelets to decompose the time-frequency effects of monetary policy. Phys. A Stat. Mech. Appl. 2008, 387, 2863–2878. [Google Scholar] [CrossRef] [Green Version]
- Baubeau, P.; Cazelles, B. French Economic Cycles: A Wavelet Analysis of French Retrospective GNP Series. Cliometrica 2009, 3, 275–300. [Google Scholar] [CrossRef]
- Aguiar-Conraria, L.F.; Soares, M.J. Oil and the macroeconomy: Using wavelets to analyze old issues. Empir. Econ. 2011, 40, 645–655. [Google Scholar] [CrossRef]
- Aguiar-Conraria, L.F.; Soares, M.J. Business cycle synchronization and the Euro: A wavelet analysis. J. Macroecon. 2011, 33, 477–489. [Google Scholar] [CrossRef]
- Gençay, R.; Selçuk, F.; Whitcher, B. An Introduction to Wavelets and Other Filtering Methods in Finance and Economics; Academic Press: San Diego, CA, USA, 2002. [Google Scholar]
- Tenreiro Machado, J.A.; Duarte, F.B.; Monteiro Duarte, G. Analysis of Stock Market Indices with Multidimensional Scaling and Wavelets. Math. Probl. Eng. 2012, 2012, 1–14. [Google Scholar] [CrossRef]
- Goupillaud, P.; Grossmann, A.; Morlet, J. Cycle-octave and related transforms in seismic signal analysis. Geoexploration 1984, 23, 85–102. [Google Scholar] [CrossRef]
- Lilly, J.M.; Olhede, S.C. Generalized Morse Wavelets as a Superfamily of Analytic Wavelets. IEEE Trans. Signal Process. 2012, 60, 6036–6041. [Google Scholar] [CrossRef] [Green Version]
- Martín Cervantes, P.A.; Cruz Rambaud, S. An empirical approach to the “Trump Effect” on US financial markets with causal-impact Bayesian analysis. Heliyon 2020, 6, e04760. [Google Scholar] [CrossRef] [PubMed]
- Moller, N.; Zilca, S. The evolution of the January effect. J. Bank. Financ. 2008, 32, 447–457. [Google Scholar] [CrossRef]
- Jacobsen, B.; Nuttawat, V. The Halloween Effect in U.S. Sectors. Financ. Rev. 2009, 44, 437–459. [Google Scholar] [CrossRef]
- Fama, E.F. Efficient Capital Markets: A Review of Theory and Empirical Work. J. Financ. 1970, 25, 383–417. [Google Scholar] [CrossRef]
- Peters, E.E. Fractal Market Analysis: Applying Chaos Theory to Investment and Economics; Wiley Finance; John Wiley & Sons: New York, NY, USA, 1994; Volume 24. [Google Scholar]
- Kristoufek, L. Fractal Markets Hypothesis and the Global Financial Crisis: Wavelet Power Evidence. Sci. Rep. 2013, 3, 2857. [Google Scholar] [CrossRef] [PubMed] [Green Version]
- Forbes, K.J.; Rigobon, R. No contagion, only interdependence: Measuring stock market co-movements. J. Financ. 2002, 57, 2223–2261. [Google Scholar] [CrossRef]
- Baruník, J.; Vácha, L.; Krištoufek, L. Comovement of Central European Stock Markets Using Wavelet Coherence: Evidence from High-Frequency Data; IES Working Papers; Charles University, Institute of Economic Studies (IES): Prague, Czech Republic, 2011. [Google Scholar]
- Sharpe, W.F. Capital asset prices: A theory of market equilibrium under conditions of risk. J. Financ. 1964, 19, 425–442. [Google Scholar]
- Stubbs, T.; Kring, W.; Laskaridis, C.; Kentikelenis, A.; Gallagher, K. Whatever it takes? The global financial safety net, Covid-19, and developing countries. World Dev. 2021, 137, 105171. [Google Scholar] [CrossRef] [PubMed]
- Merkl, C.; Weber, E. End the Recruitment Crisis! [Raus aus der Neueinstellungskrise!]. Wirtschaftsdienst 2020, 100, 507–509. [Google Scholar] [CrossRef] [PubMed]
- Pak, A.; Adegboye, O.; Adekunle, A.; Rahman, K.; McBryde, E.; Eisen, D. Economic Consequences of the COVID-19 Outbreak: The Need for Epidemic Preparedness. Front. Public Health 2020, 8, 241. [Google Scholar] [CrossRef]
- Richter, A.; Wilson, T. Covid-19: Implications for insurer risk management and the insurability of pandemic risk. Geneva Risk Insur. Rev. 2020, 45, 171–199. [Google Scholar] [CrossRef]
- Esin, P. World market development scenario in the context of the coronavirus crisis. Izv. Vyss. Uchebnykh Zavedeniy. Prikl. Nelineynaya Din. 2020, 28, 158–167. [Google Scholar]
- Kermack, W.O.; McKendrick, A.G. Contributions to the mathematical theory of epidemics I. Bull. Math. Biol. 1991, 53, 33–55. [Google Scholar] [PubMed]
- Kermack, W.O.; McKendrick, A.G. Contributions to the mathematical theory of epidemics II–The problem of endemicity. Bull. Math. Biol. 1991, 53, 57–87. [Google Scholar] [PubMed]
- Kermack, W.O.; McKendrick, A.G. Contributions to the mathematical theory of epidemics III–Further studies of the problem of endemicity. Bull. Math. Biol. 1991, 53, 89–118. [Google Scholar]
- Burri, M.; Kaufmann, D. A daily fever curve for the Swiss economy. Swiss J. Econ. Stat. 2020, 156, 6. [Google Scholar] [CrossRef]
- Grigoryev, L.; Pavlyushina, V.; Muzychenko, E. The fall into 2020 recession. Vopr. Ekon. 2020, 2020, 5–24. [Google Scholar] [CrossRef]
- Joshi, A.; Bhaskar, P.; Gupta, P. Indian economy amid COVID-19 lockdown: A prespective. J. Pure Appl. Microbiol. 2020, 14, 957–961. [Google Scholar] [CrossRef]
- Salamzadeh, A.; Dana, L. The coronavirus (COVID-19) pandemic: Challenges among Iranian startups. J. Small Bus. Entrep. 2020. [Google Scholar] [CrossRef]
- Connolly, R.; Hanson, P.; Bradshaw, M. It’s déjà vu all over again: COVID-19, the global energy market, and the Russian economy. Eurasian Geogr. Econ. 2020, 61, 511–531. [Google Scholar] [CrossRef]
- Gherghina, S.C.; Armeanu, D.S.; Joldeş, C.C. Stock market reactions to COVID-19 pandemic outbreak: Quantitative evidence from ARDL bounds tests and granger causality analysis. Int. J. Environ. Res. Public Health 2020, 17, 6729. [Google Scholar] [CrossRef] [PubMed]
- Chakraborty, T.; Ghosh, I. Real-time forecasts and risk assessment of novel coronavirus (COVID-19) cases: A data-driven analysis. Chaos Solitons Fractals 2020, 135, 109850. [Google Scholar] [CrossRef] [PubMed]
- Hazarika, B.; Gupta, D. Modelling and forecasting of COVID-19 spread using wavelet-coupled random vector functional link networks. Appl. Soft Comput. J. 2020, 96, 106626. [Google Scholar] [CrossRef] [PubMed]
- Singh, S.; Parmar, K.; Kumar, J.; Makkhan, S. Development of new hybrid model of discrete wavelet decomposition and autoregressive integrated moving average (ARIMA) models in application to one month forecast the casualties cases of COVID-19. Chaos Solitons Fractals 2020, 135, 109866. [Google Scholar] [CrossRef] [PubMed]
- Shah, K.; Khan, Z.; Ali, A.; Amin, R.; Khan, H.; Khan, A. Haar wavelet collocation approach for the solution of fractional order COVID-19 model using Caputo derivative. Alex. Eng. J. 2020, 59, 3221–3231. [Google Scholar] [CrossRef]
- Fareed, Z.; Iqbal, N.; Shahzad, F.; Shah, S.; Zulfiqar, B.; Shahzad, K.; Hashmi, S.; Shahzad, U. Co-variance nexus between COVID-19 mortality, humidity, and air quality index in Wuhan, China: New insights from partial and multiple wavelet coherence. Air Qual. Atmos. Health 2020, 13, 673–682. [Google Scholar] [CrossRef]
- Bilal; Bashir, M.F.; Benghoul, M.; Numan, U.; Shakoor, A.; Komal, B.; Bashir, M.A.; Bashir, M.; Tan, D. Environmental pollution and COVID-19 outbreak: Insights from Germany. Air Qual. Atmos. Health 2020, 13, 1385–1394. [Google Scholar] [CrossRef]
- Dong, E.; Du, H.; Gardner, L. An interactive web-based dashboard to track COVID-19 in real time. Lancet Infect. Dis. 2020, 5, 533–534. [Google Scholar] [CrossRef]
- Bloomberg. Bloomberg Professional Services. 2020. Available online: https://www.bloomberg.com/professional/solution/financial-data-management/ (accessed on 29 September 2020).
- S&P Global. Dow Jones Sustainability World Enlarged Index ex Alcohol, Tobacco, Gambling, Armaments & Firearms and Adult Entertainment. 2020. Available online: https://www.spglobal.com/spdji/en/indices/esg/dow-jones-sustainability-world-enlarged-index-ex-alcohol-tobacco-gambling-armaments-firearms-and-adult-entertainment/#overview (accessed on 29 September 2020).
- Tyszkiewicz, J. The Power of Spreadsheet Computations. In Fields of Logic and Computation III Essays: Dedicated to Yuri Gurevich on the Occasion of His 80th Birthday; Blass, A., Cégielski, P., Dershowitz, N., Droste, M., Finkbeiner, B., Eds.; Lecture Notes in Computer Science; Springer Nature: Cham, Switzerland, 2020; Volume 12180, pp. 305–323. [Google Scholar]
- Makhortykh, M.; Urman, A.; Ulloa, R. How search engines disseminate information about COVID19 and why they should do better. Special Issue on COVID-19 and Misinformation. Harv. Kennedy Sch. Misinf. Rev. 2020, 1. [Google Scholar] [CrossRef]
- Hintze, J.L.; Nelson, R.D. Violin Plots: A Box Plot-Density Trace Synergism. Am. Stat. 1998, 52, 181–184. [Google Scholar]
- WHO. Novel Coronavirus (2019-nCoV) Situation Report—1. 21 January 2020. World Health Organization. Available online: https://www.who.int/docs/default-source/coronaviruse/situation-reports/20200121-sitrep-1-2019-ncov.pdf?sfvrsn=20a99c10_4 (accessed on 29 September 2020).
- Imbert, F. Dow Falls More Than 100 Points after Suffering a Sudden Midday Sell-Off That Confused Traders. 2020. CNBC. Available online: https://www.cnbc.com/2020/02/20/us-futures-point-to-slightly-lower-open-after-new-highs-on-wall-street.html (accessed on 29 September 2020).
- von Mayr, G. Die gesetzmäßigkeit im gesellschaftsleben. In Die Naturkräfte. Eine Naturwissenschaftliche Volksbibliothek; Walter de Gruyter GmbH: Berlin, Germany, 1877; Volume 23. [Google Scholar]
- WHO. WHO Director-General’s Opening Remarks at the Media Briefing on COVID-19. 11 March 2020. World Health Organization. Available online: https://www.who.int/director-general/speeches/detail/who-director-general-s-opening-remarks-at-the-media-briefing-on-covid-19---11-march-2020 (accessed on 29 September 2020).
- Ceylan, R.F.; Ozkan, B.; Mulazimogullari, E. Historical evidence for economic effects of COVID-19. Eur. J. Health Econ. 2020, 21, 817–823. [Google Scholar] [CrossRef] [PubMed]
- Martín Cervantes, P.A.; Cruz Rambaud, S. Date-stamping the Tadawul bubble through the SADF and GSADF econometric approaches. Econ. Bull. 2020, 40, 1475–1485. [Google Scholar]
- Thai, M.; Wu, W.; Xiong, H. Big Data in Complex and Social Networks; Chapman & Hall/CRC Big Data Series; CRC Press: Boca Raton, FL, USA, 2016. [Google Scholar]
- Stone, P.J.; Dunphy, D.C.S.; Smith, M. The General Inquirer: A Computer Approach to Content Analysis; MIT Press: Cambridge, MA, USA, 1966. [Google Scholar]
- Vázquez Lázara, A. Homogenisation of COVID-19-Related Data, 2020. Parliamentary Questions: Question for Written Answer E-002553/2020 to the Commission, Rule 138. European Parliament Publising Services, Brussels. Available online: https://www.europarl.europa.eu/doceo/document/E-9-2020-002553_EN.html (accessed on 29 September 2020).
- Roberts, A. The Third and Fatal Shock: How Pandemic Killed the Millennial Paradigm. Public Adm. Rev. 2020, 80, 603–609. [Google Scholar] [CrossRef] [PubMed]
Figure 1.
Prototypical example of a Morlet wavelet.

Figure 2.
Interpretative diagram of the different phase differences. Source: Own elaboration from Schmidbauer et al. [18] and Aguiar-Conraria and Soares [76].

Figure 3.
Overview of the stock market indexes and the financial markets analyzed: (a) Growth in the number of cases in each country surveyed, (b) benchmark of the behavior of the DJSWI index against the other stock market indices reviewed.
Figure 3.
Overview of the stock market indexes and the financial markets analyzed: (a) Growth in the number of cases in each country surveyed, (b) benchmark of the behavior of the DJSWI index against the other stock market indices reviewed.

Figure 4.
Joint comparison of the seven SMIs evaluated: (a) Probability densities of the analyzed stock indices returns (1 January–31 July 2020), (b) performance of the analyzed stock market indices (SMIs) over the time horizon 31 December 2019–31 July 2020.
Figure 4.
Joint comparison of the seven SMIs evaluated: (a) Probability densities of the analyzed stock indices returns (1 January–31 July 2020), (b) performance of the analyzed stock market indices (SMIs) over the time horizon 31 December 2019–31 July 2020.

Figure 5.
Wavelet coherence: DJSWI returns vs. increase in worldwide COVID-19 cases. Average cross-wavelet power. Source: Own elaboration.
Figure 5.
Wavelet coherence: DJSWI returns vs. increase in worldwide COVID-19 cases. Average cross-wavelet power. Source: Own elaboration.

Figure 6.
Contour plots of the wavelet coherence among the six stock indices analyzed and the cases of COVID-19 registered in the respective countries. Corresponding average cross-wavelet powers. (a) Wavelet coherence: NYSE returns vs. increase in COVID-19 cases in the U.S. Average cross-wavelet power, (b) Wavelet coherence: DAX returns vs. increase in COVID-19 cases in Germany. Average cross-wavelet power, (c) Wavelet coherence: NIKKEI 225 returns vs. increase in COVID-19 cases in Japan. Average cross-wavelet power, (d) Wavelet coherence: JSE TOP-40 USD returns vs. increase in COVID-19 cases in South Africa. Average cross-wavelet power, (e) Wavelet coherence: ASX 200 returns vs. increase in COVID-19 cases in Australia. Average cross-wavelet power and, (f) Wavelet coherence: IBOVESPA returns vs. increase in COVID-19 cases in Brazil. Average cross-wavelet power.


Figure 7.
Radar chart of the highest-frequency wavelets levels registered in each financial market (COVID-19 vs. SMIs)
Figure 7.
Radar chart of the highest-frequency wavelets levels registered in each financial market (COVID-19 vs. SMIs)


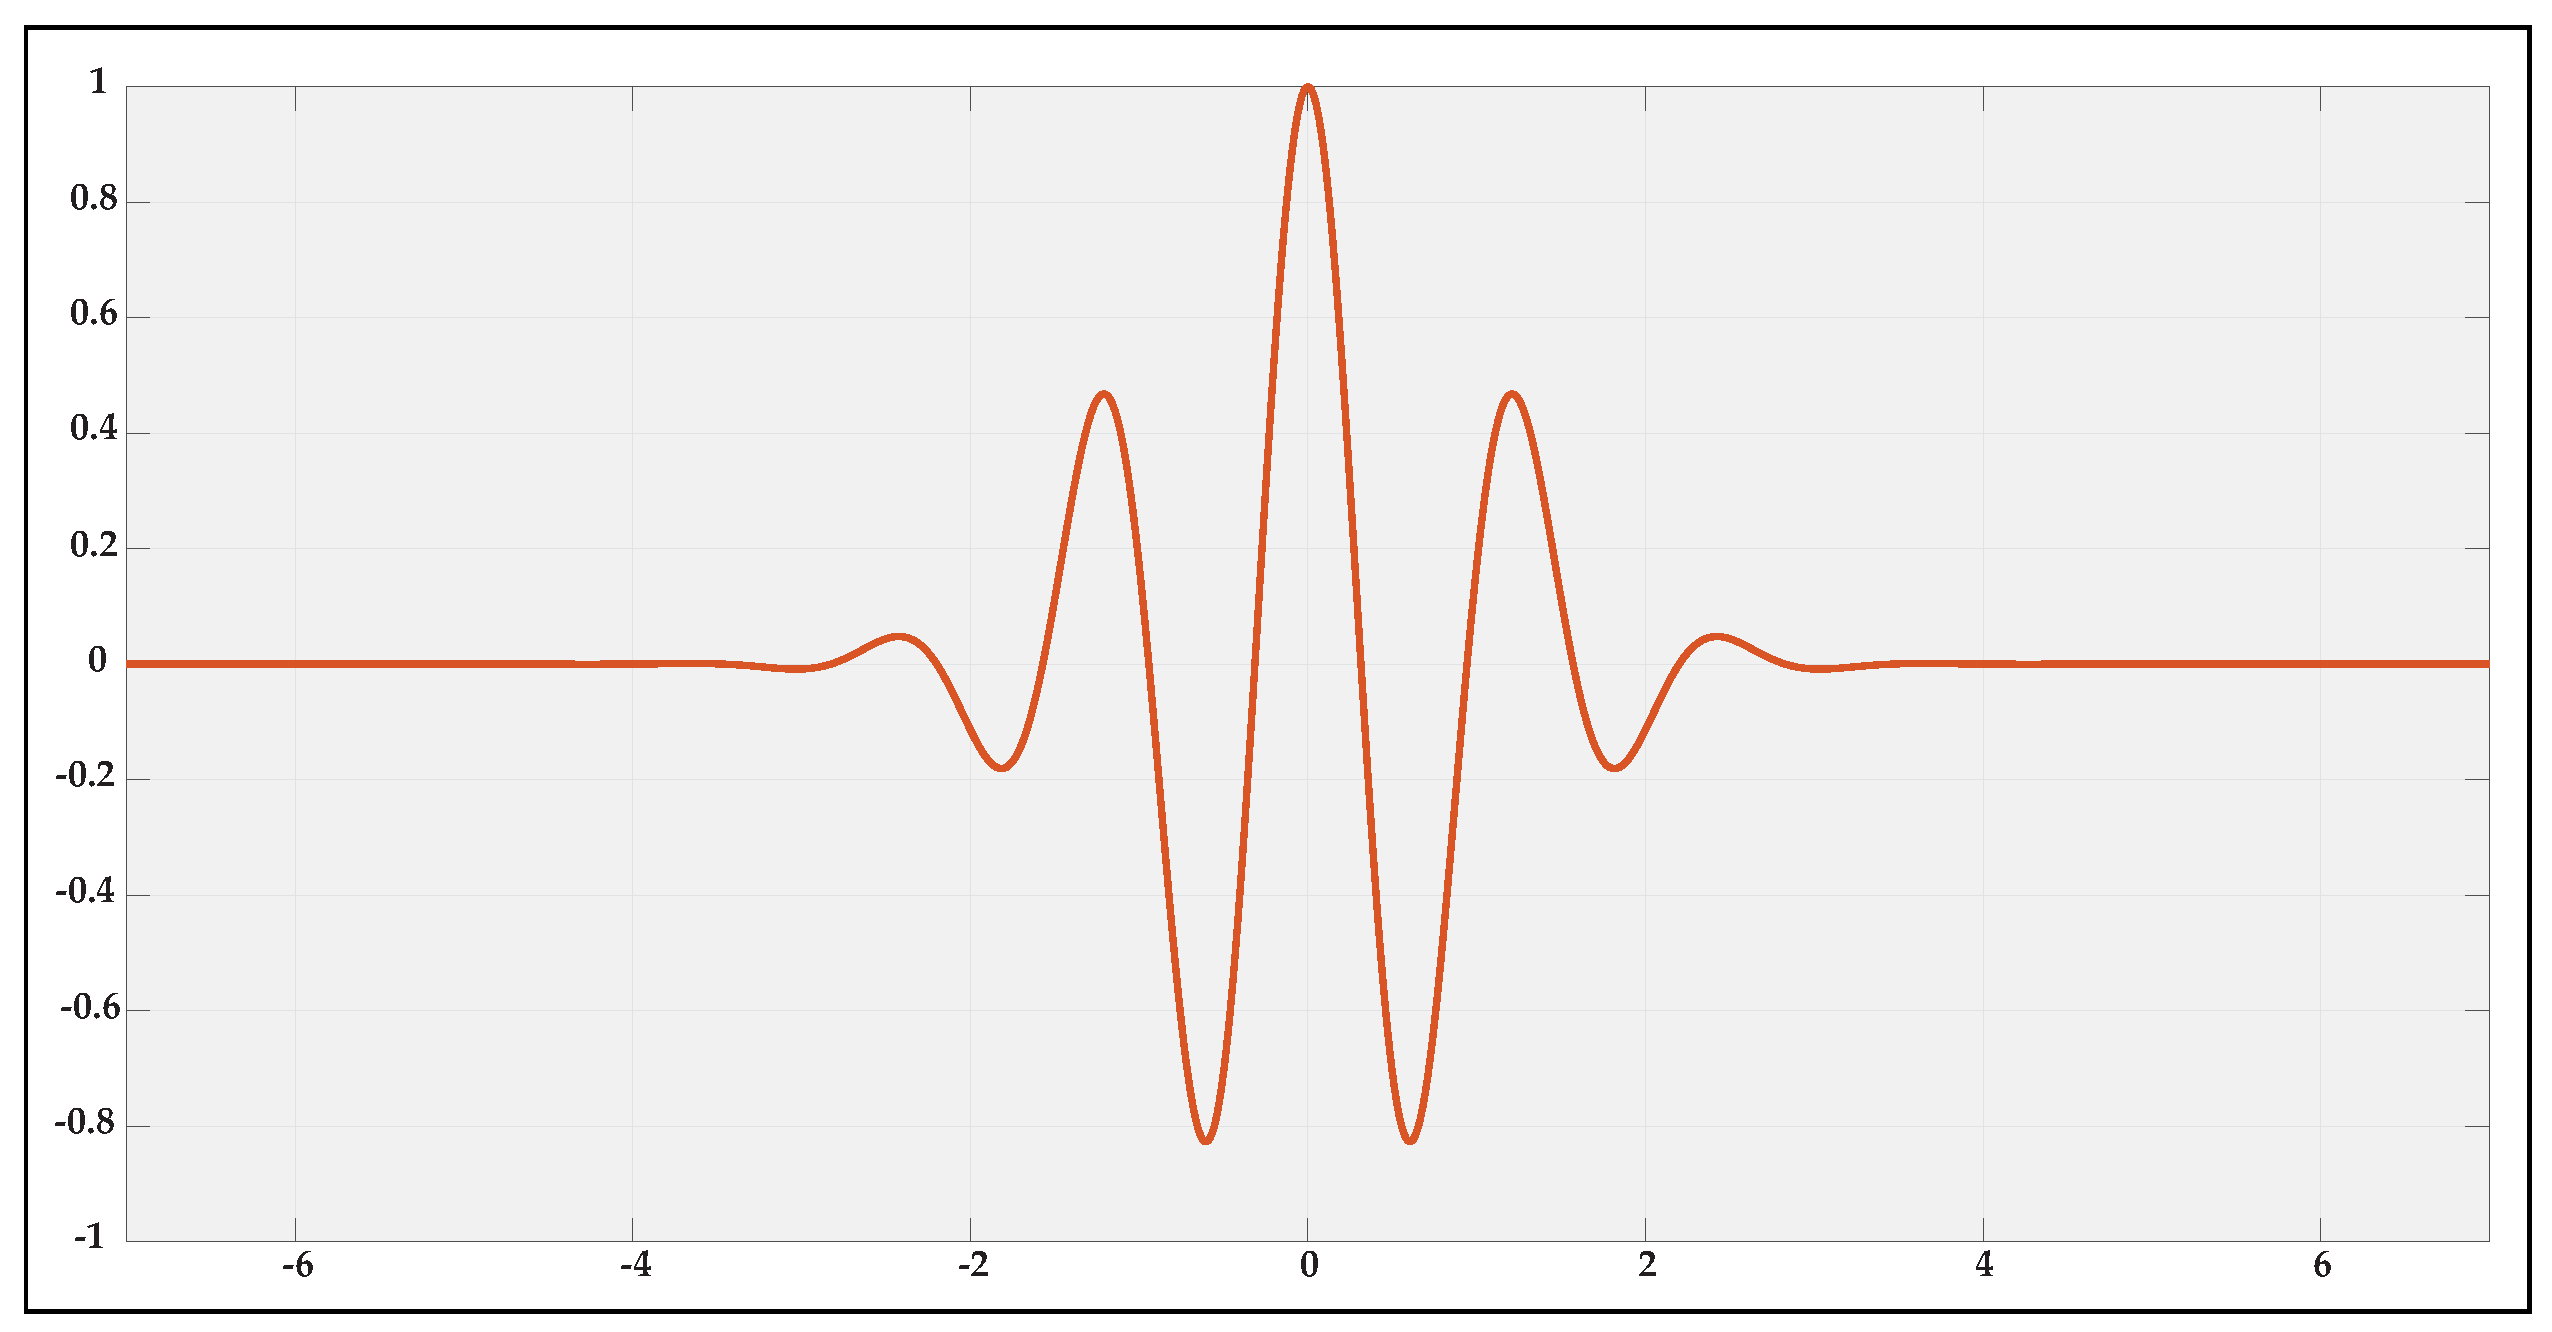
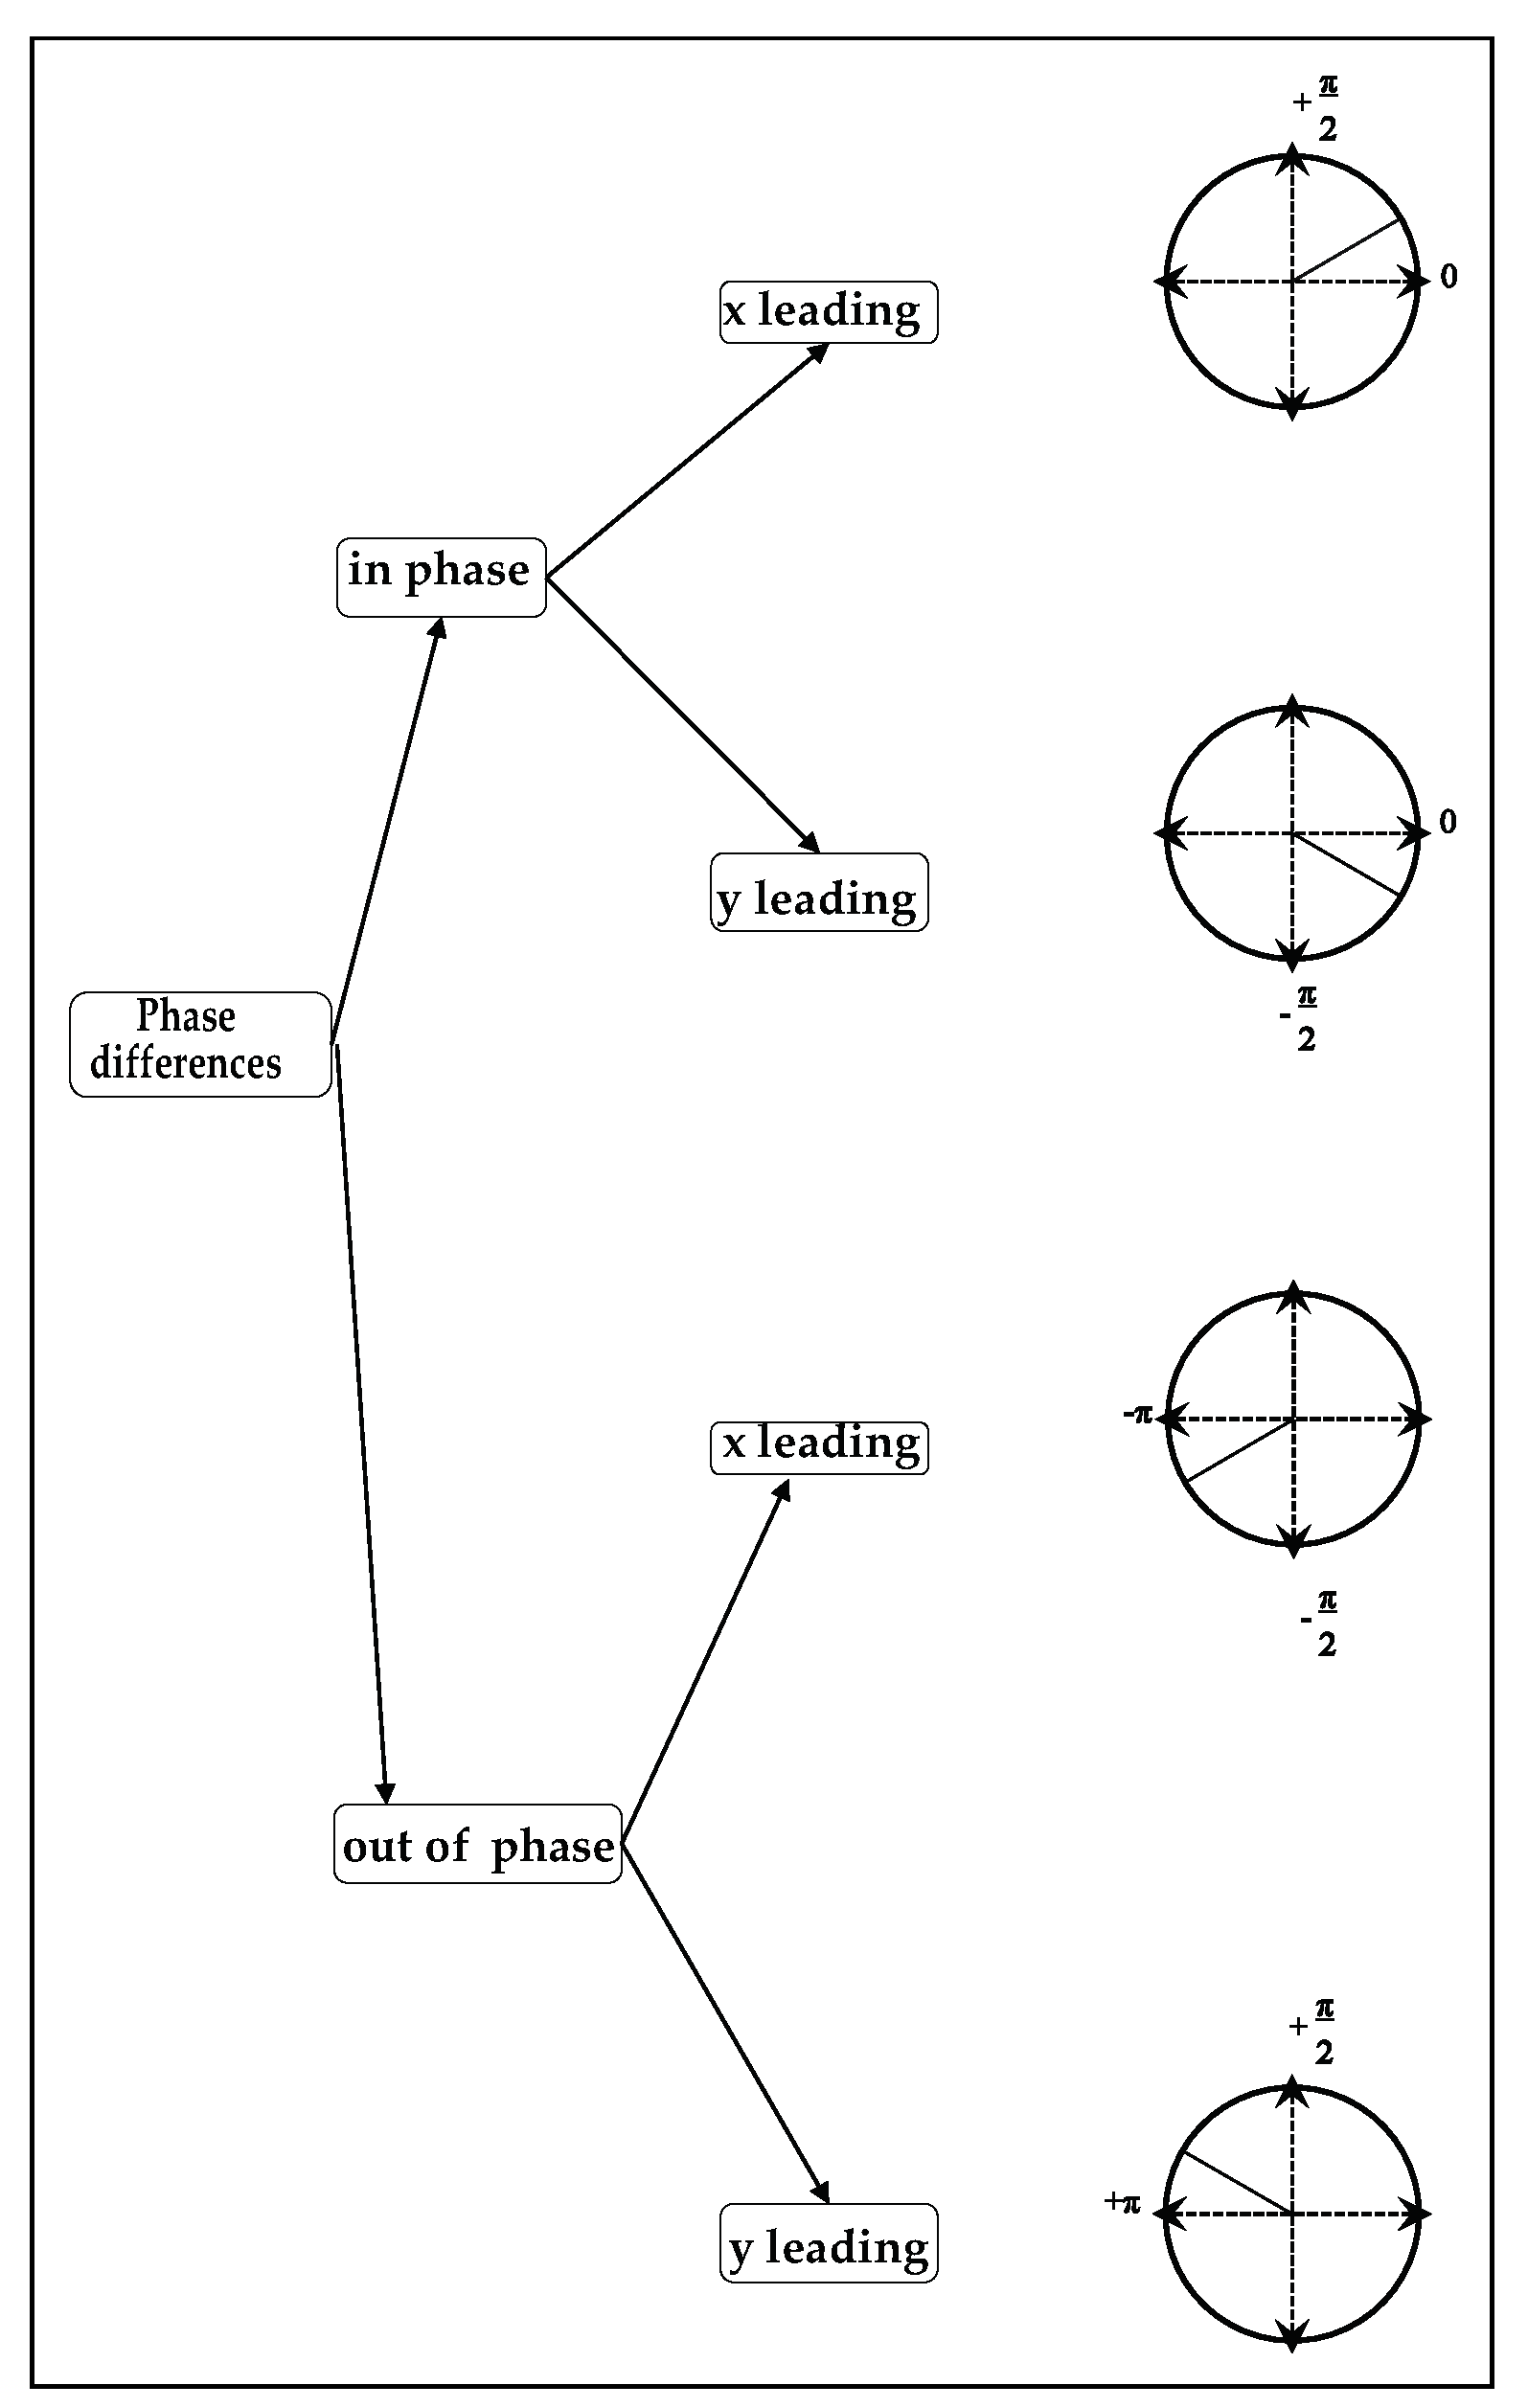
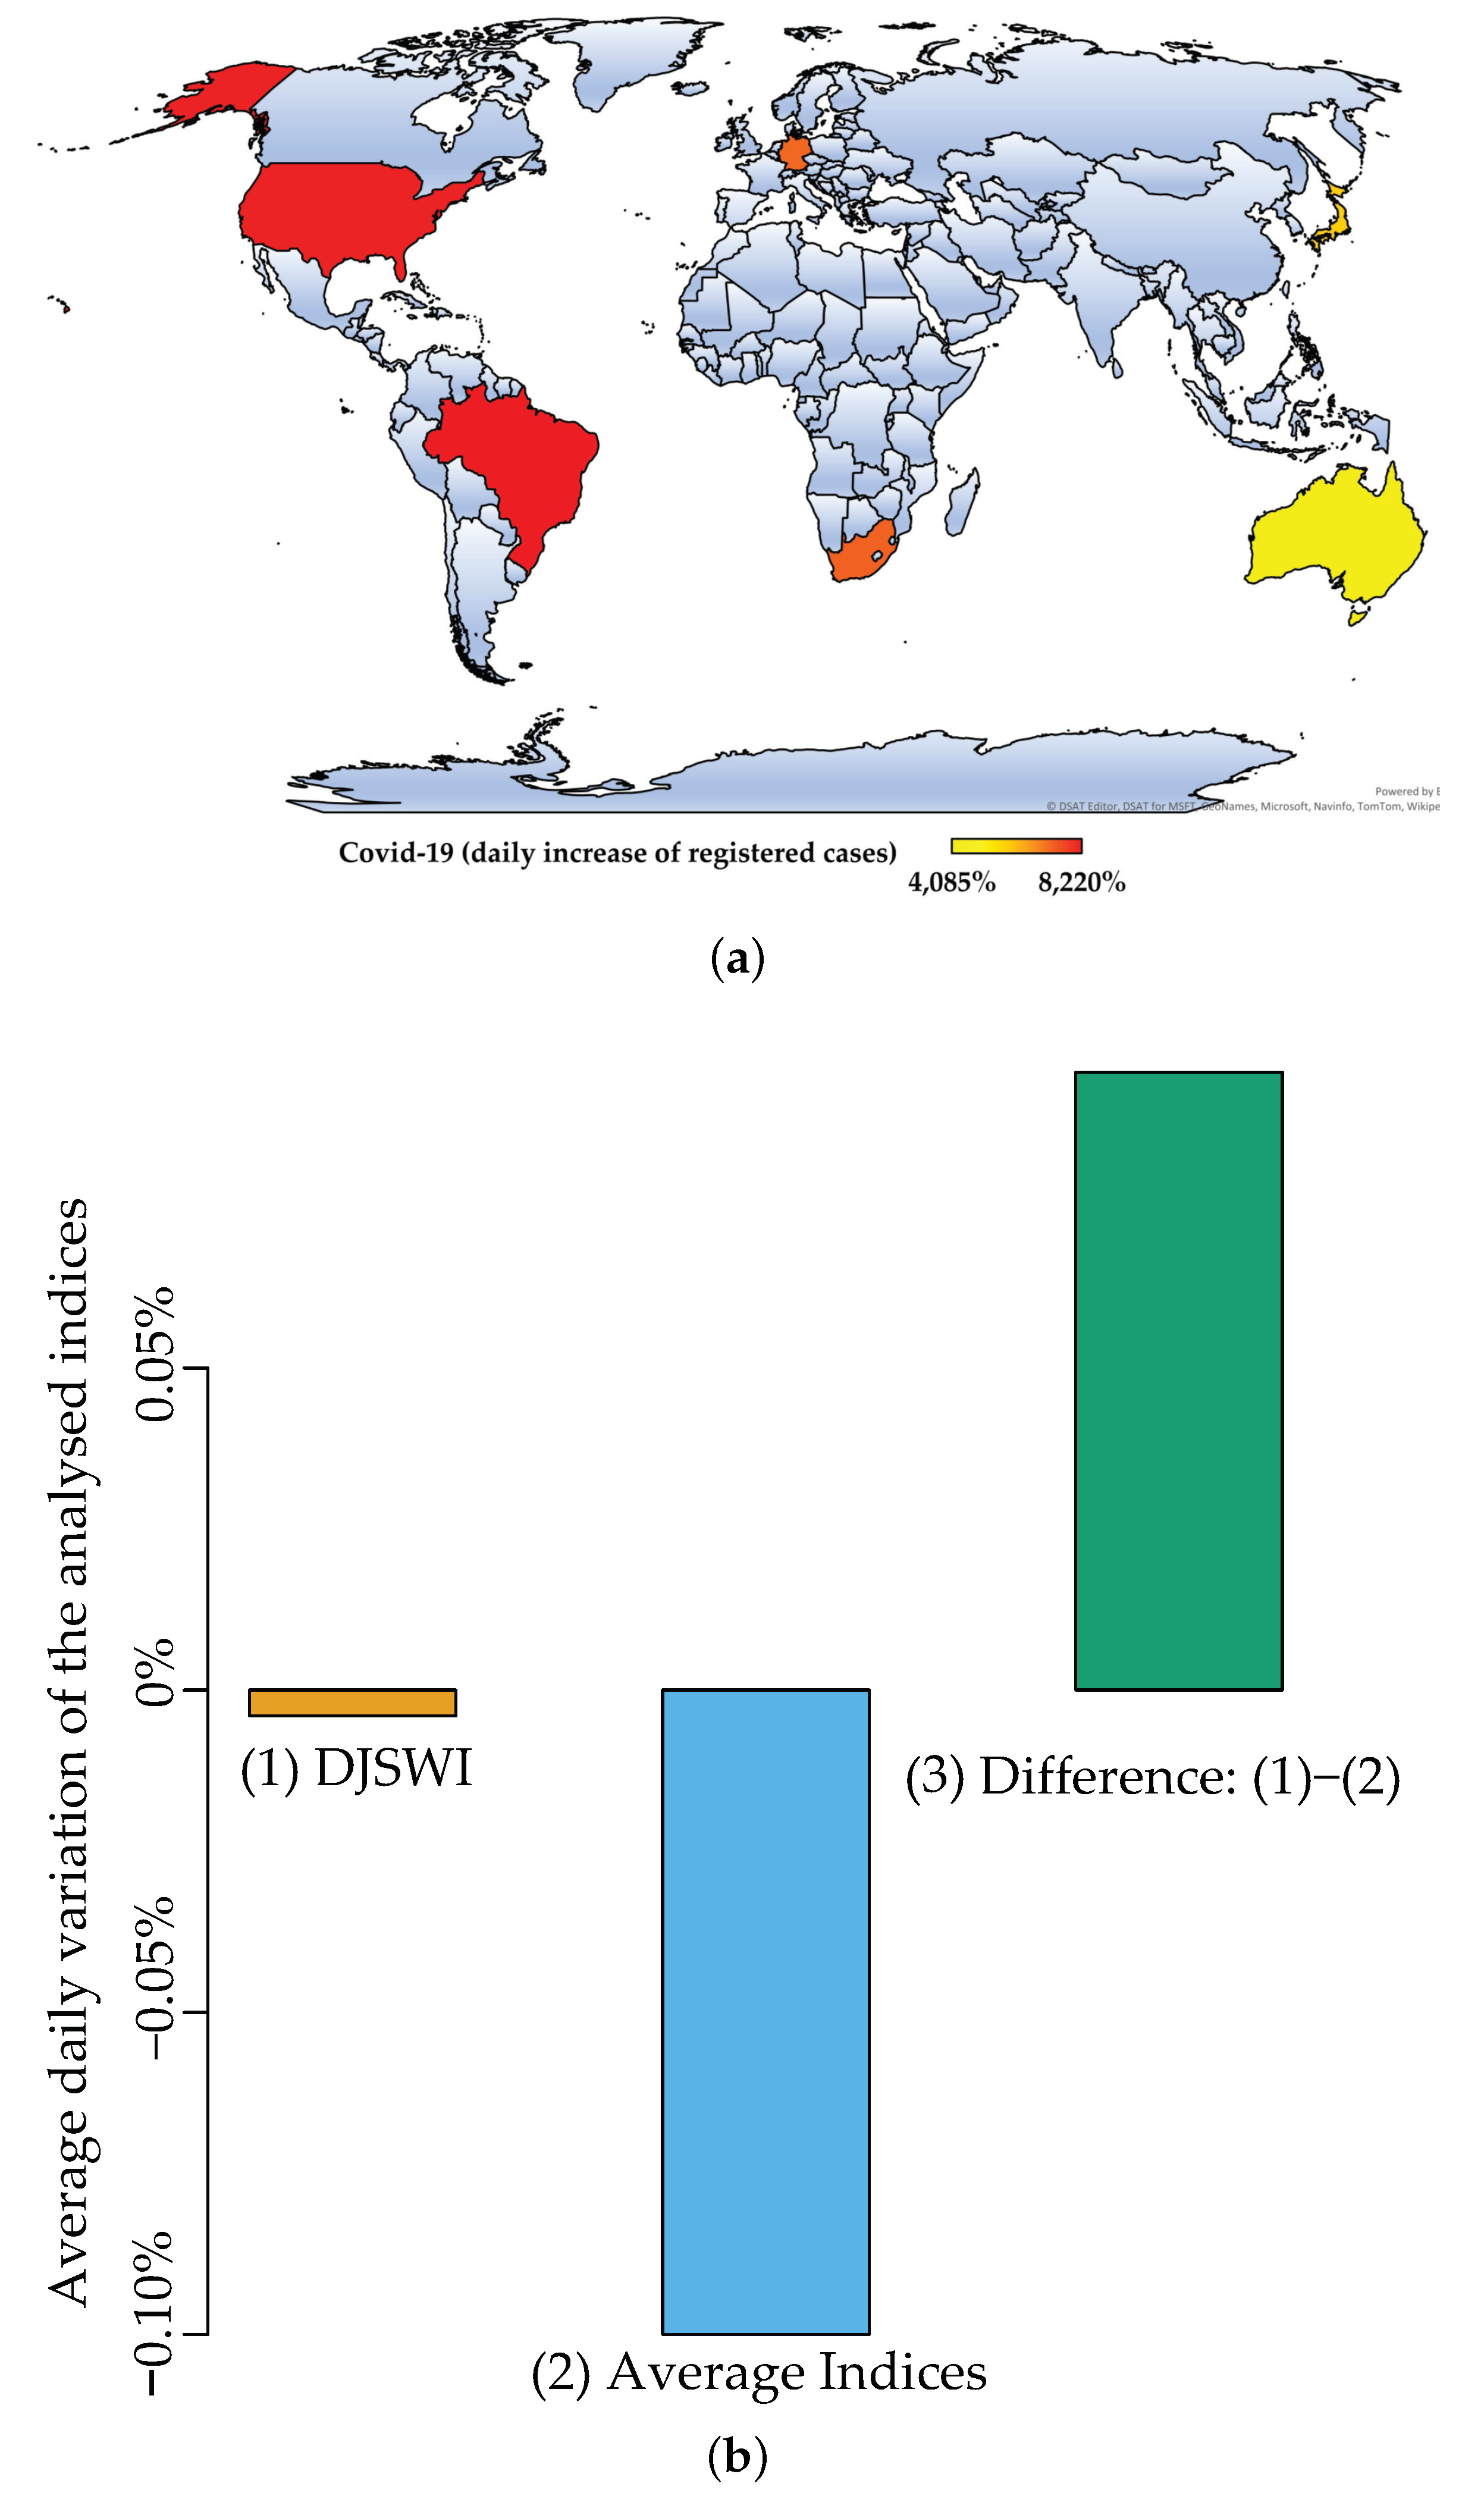
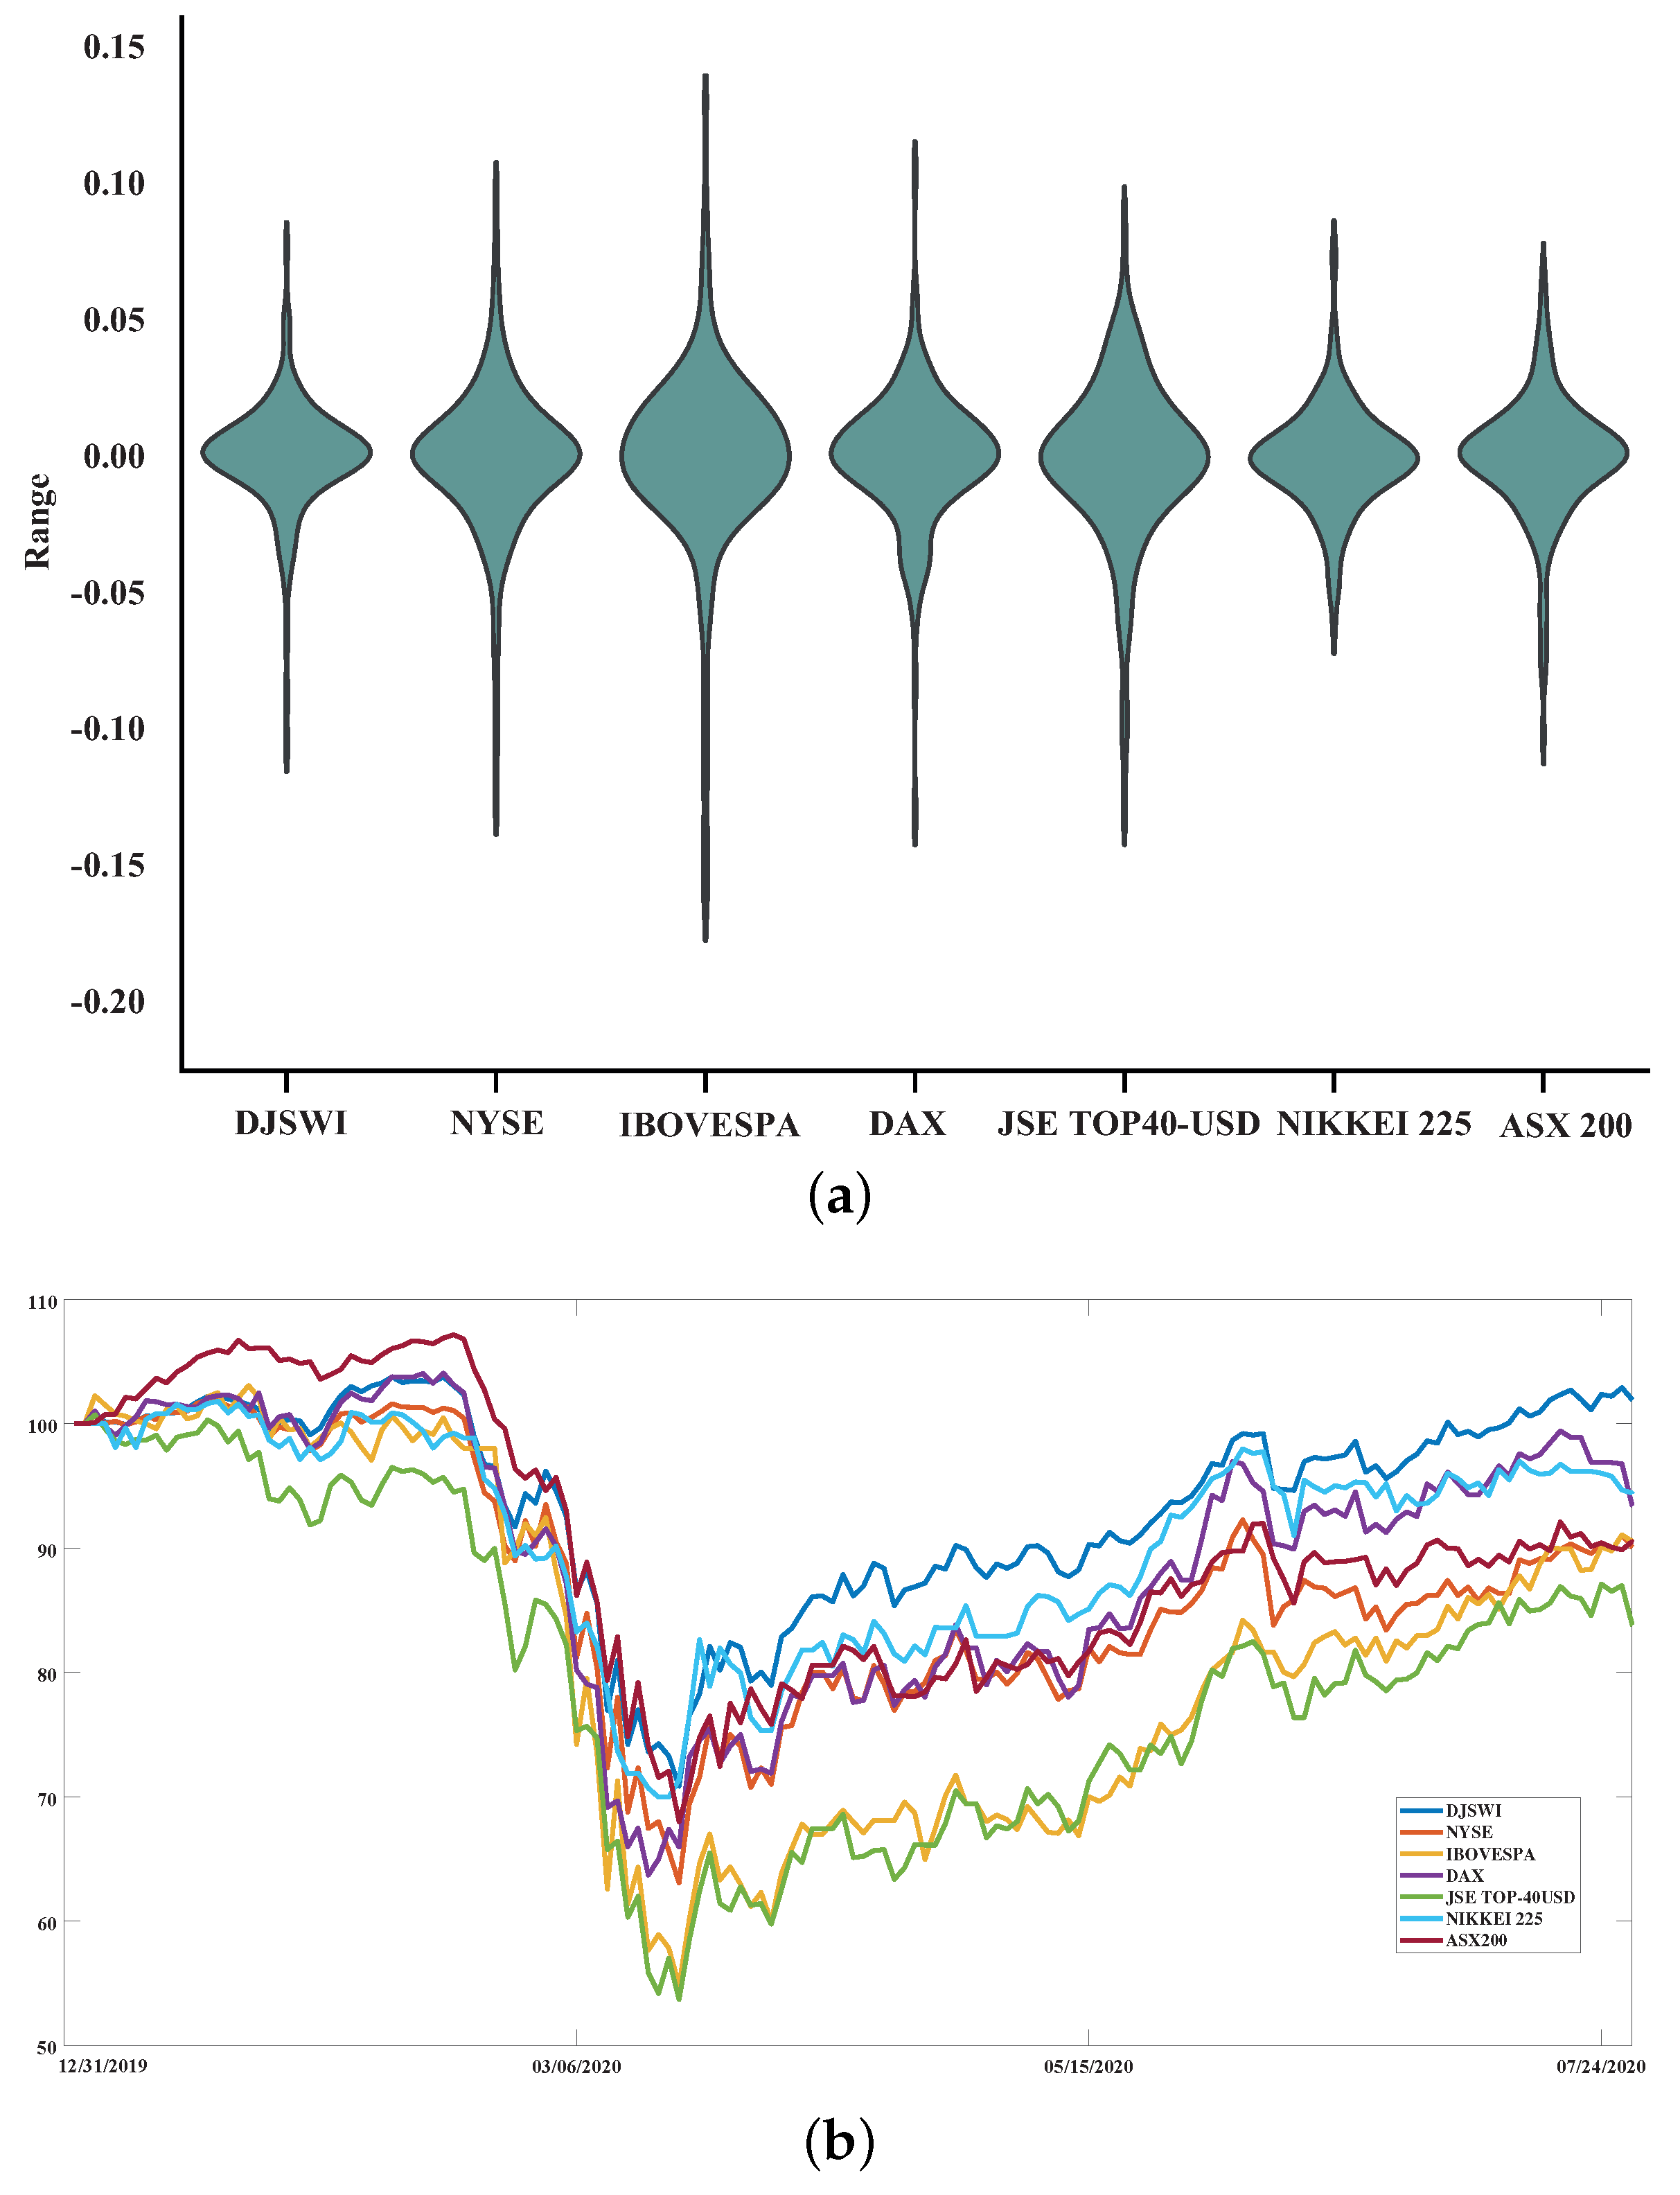
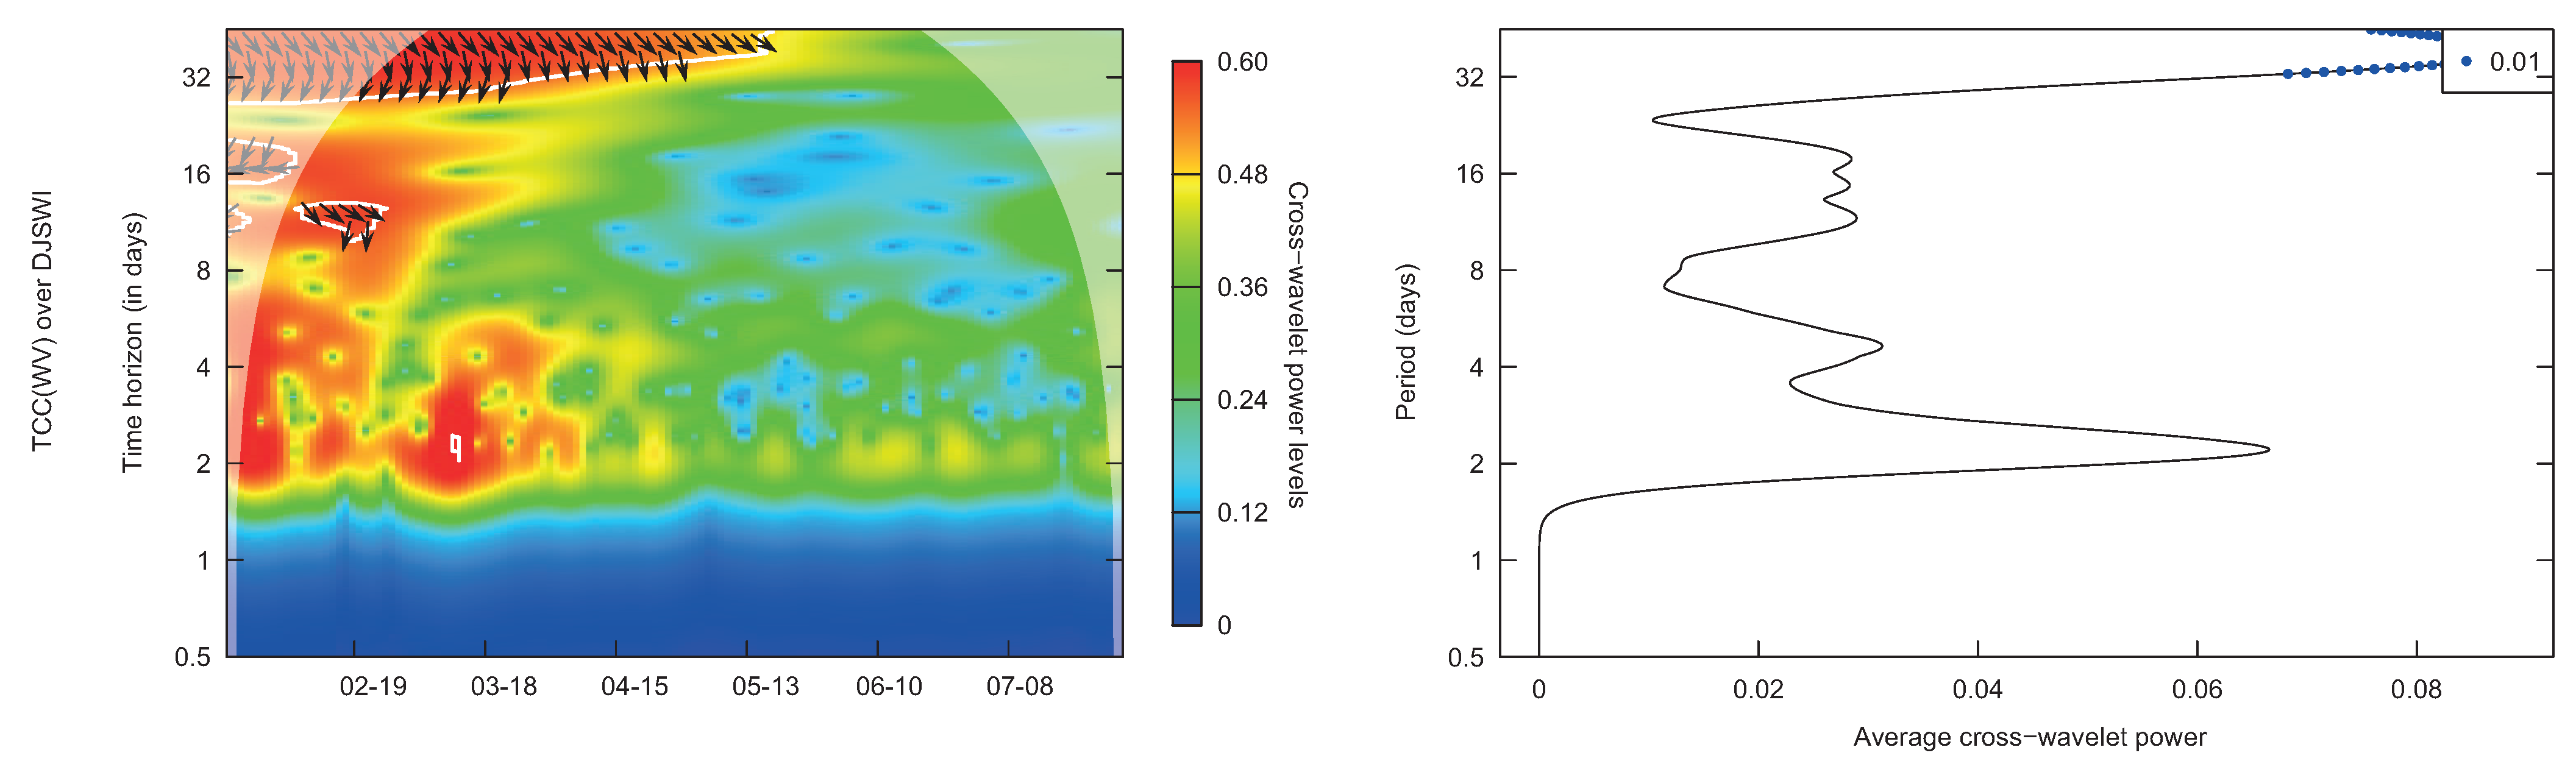
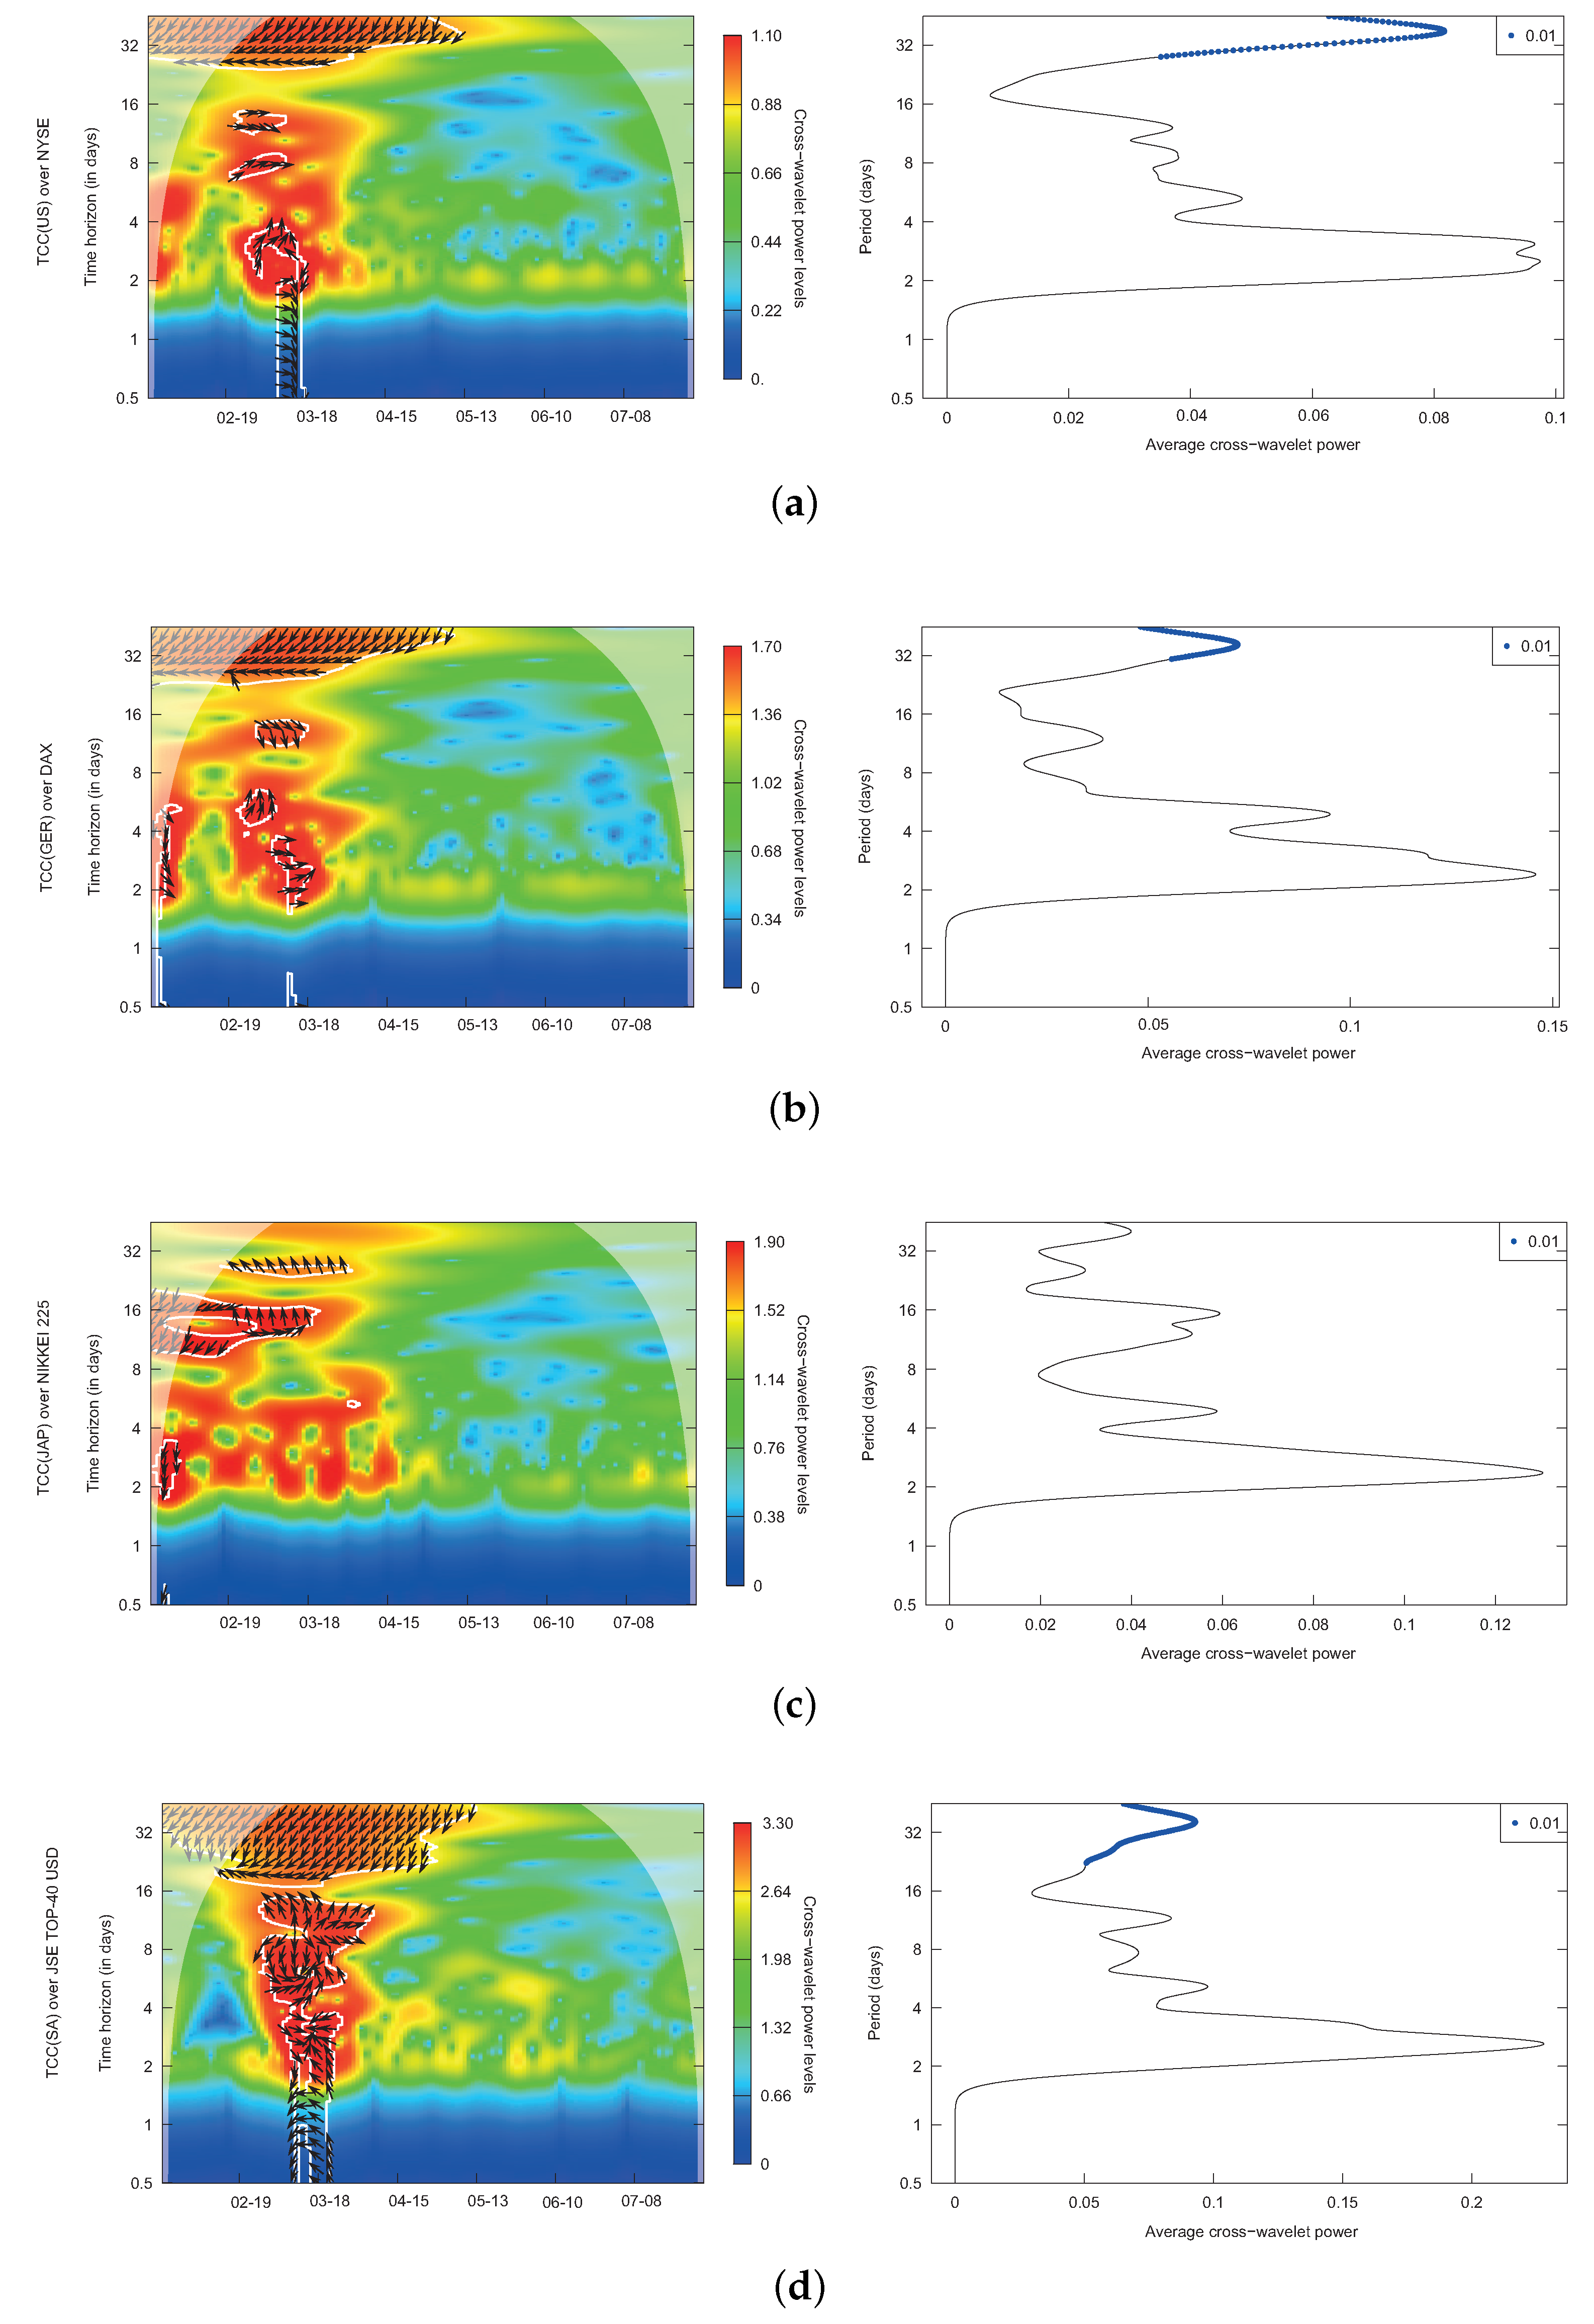
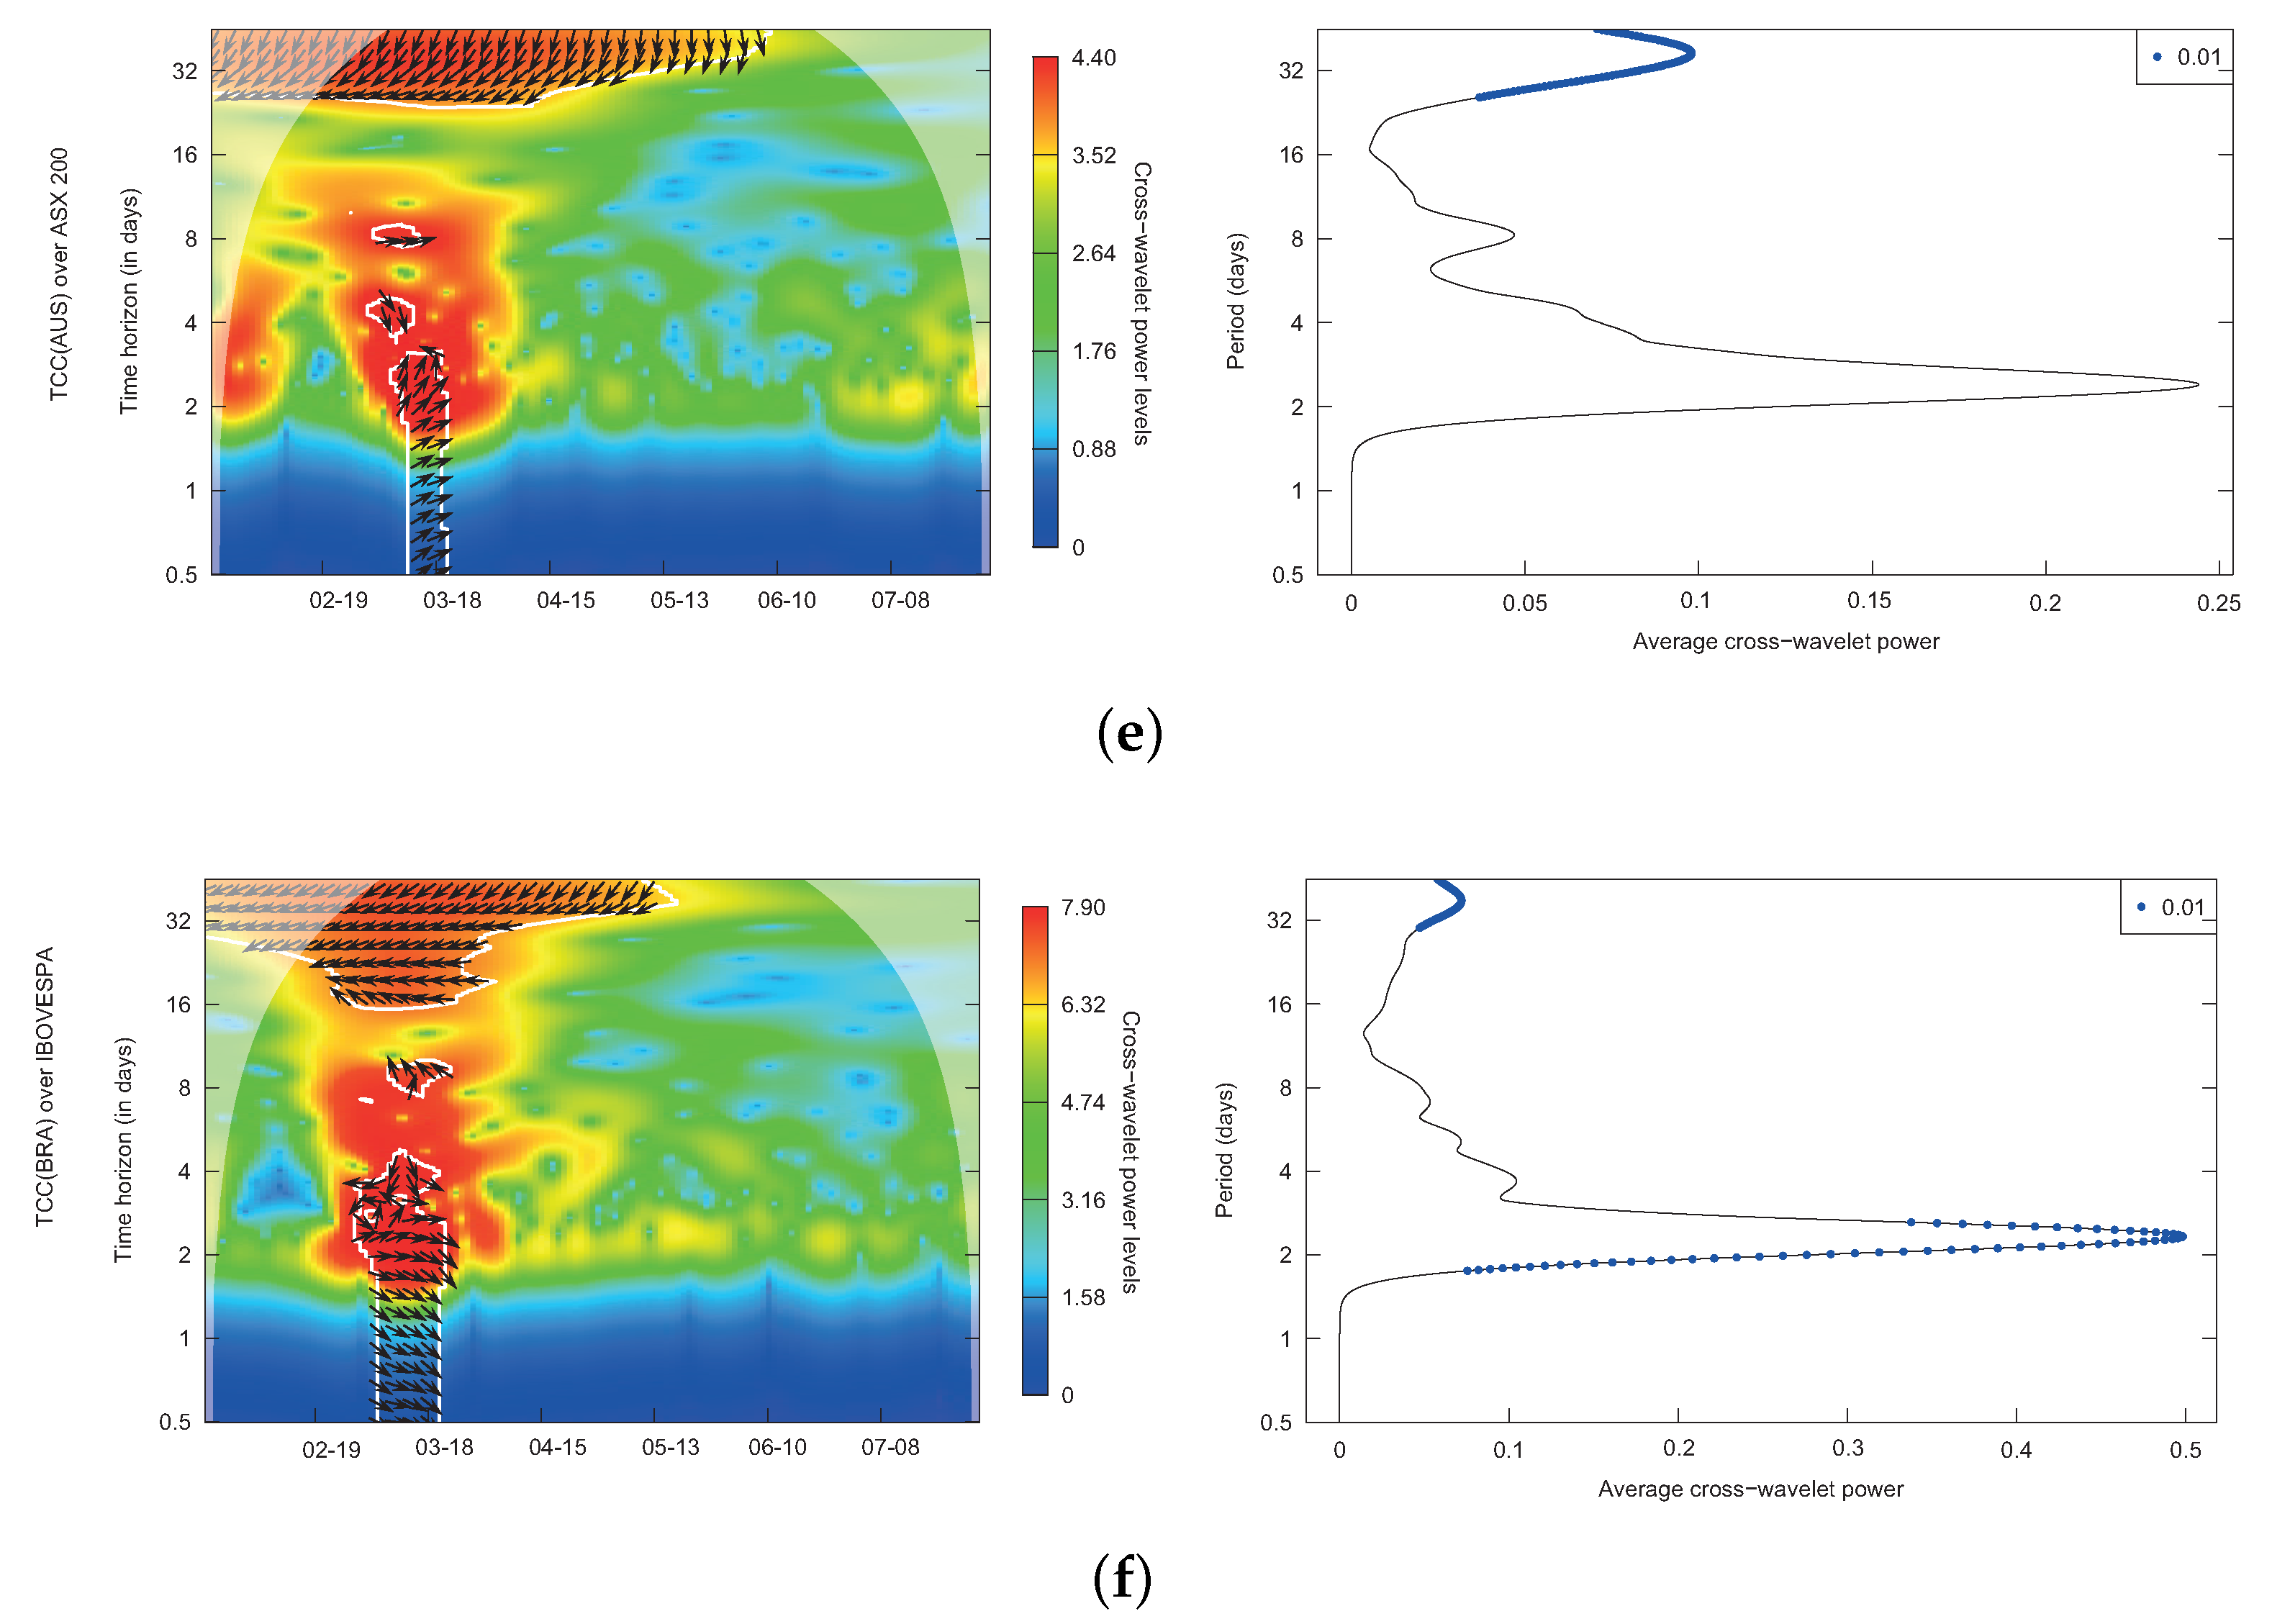
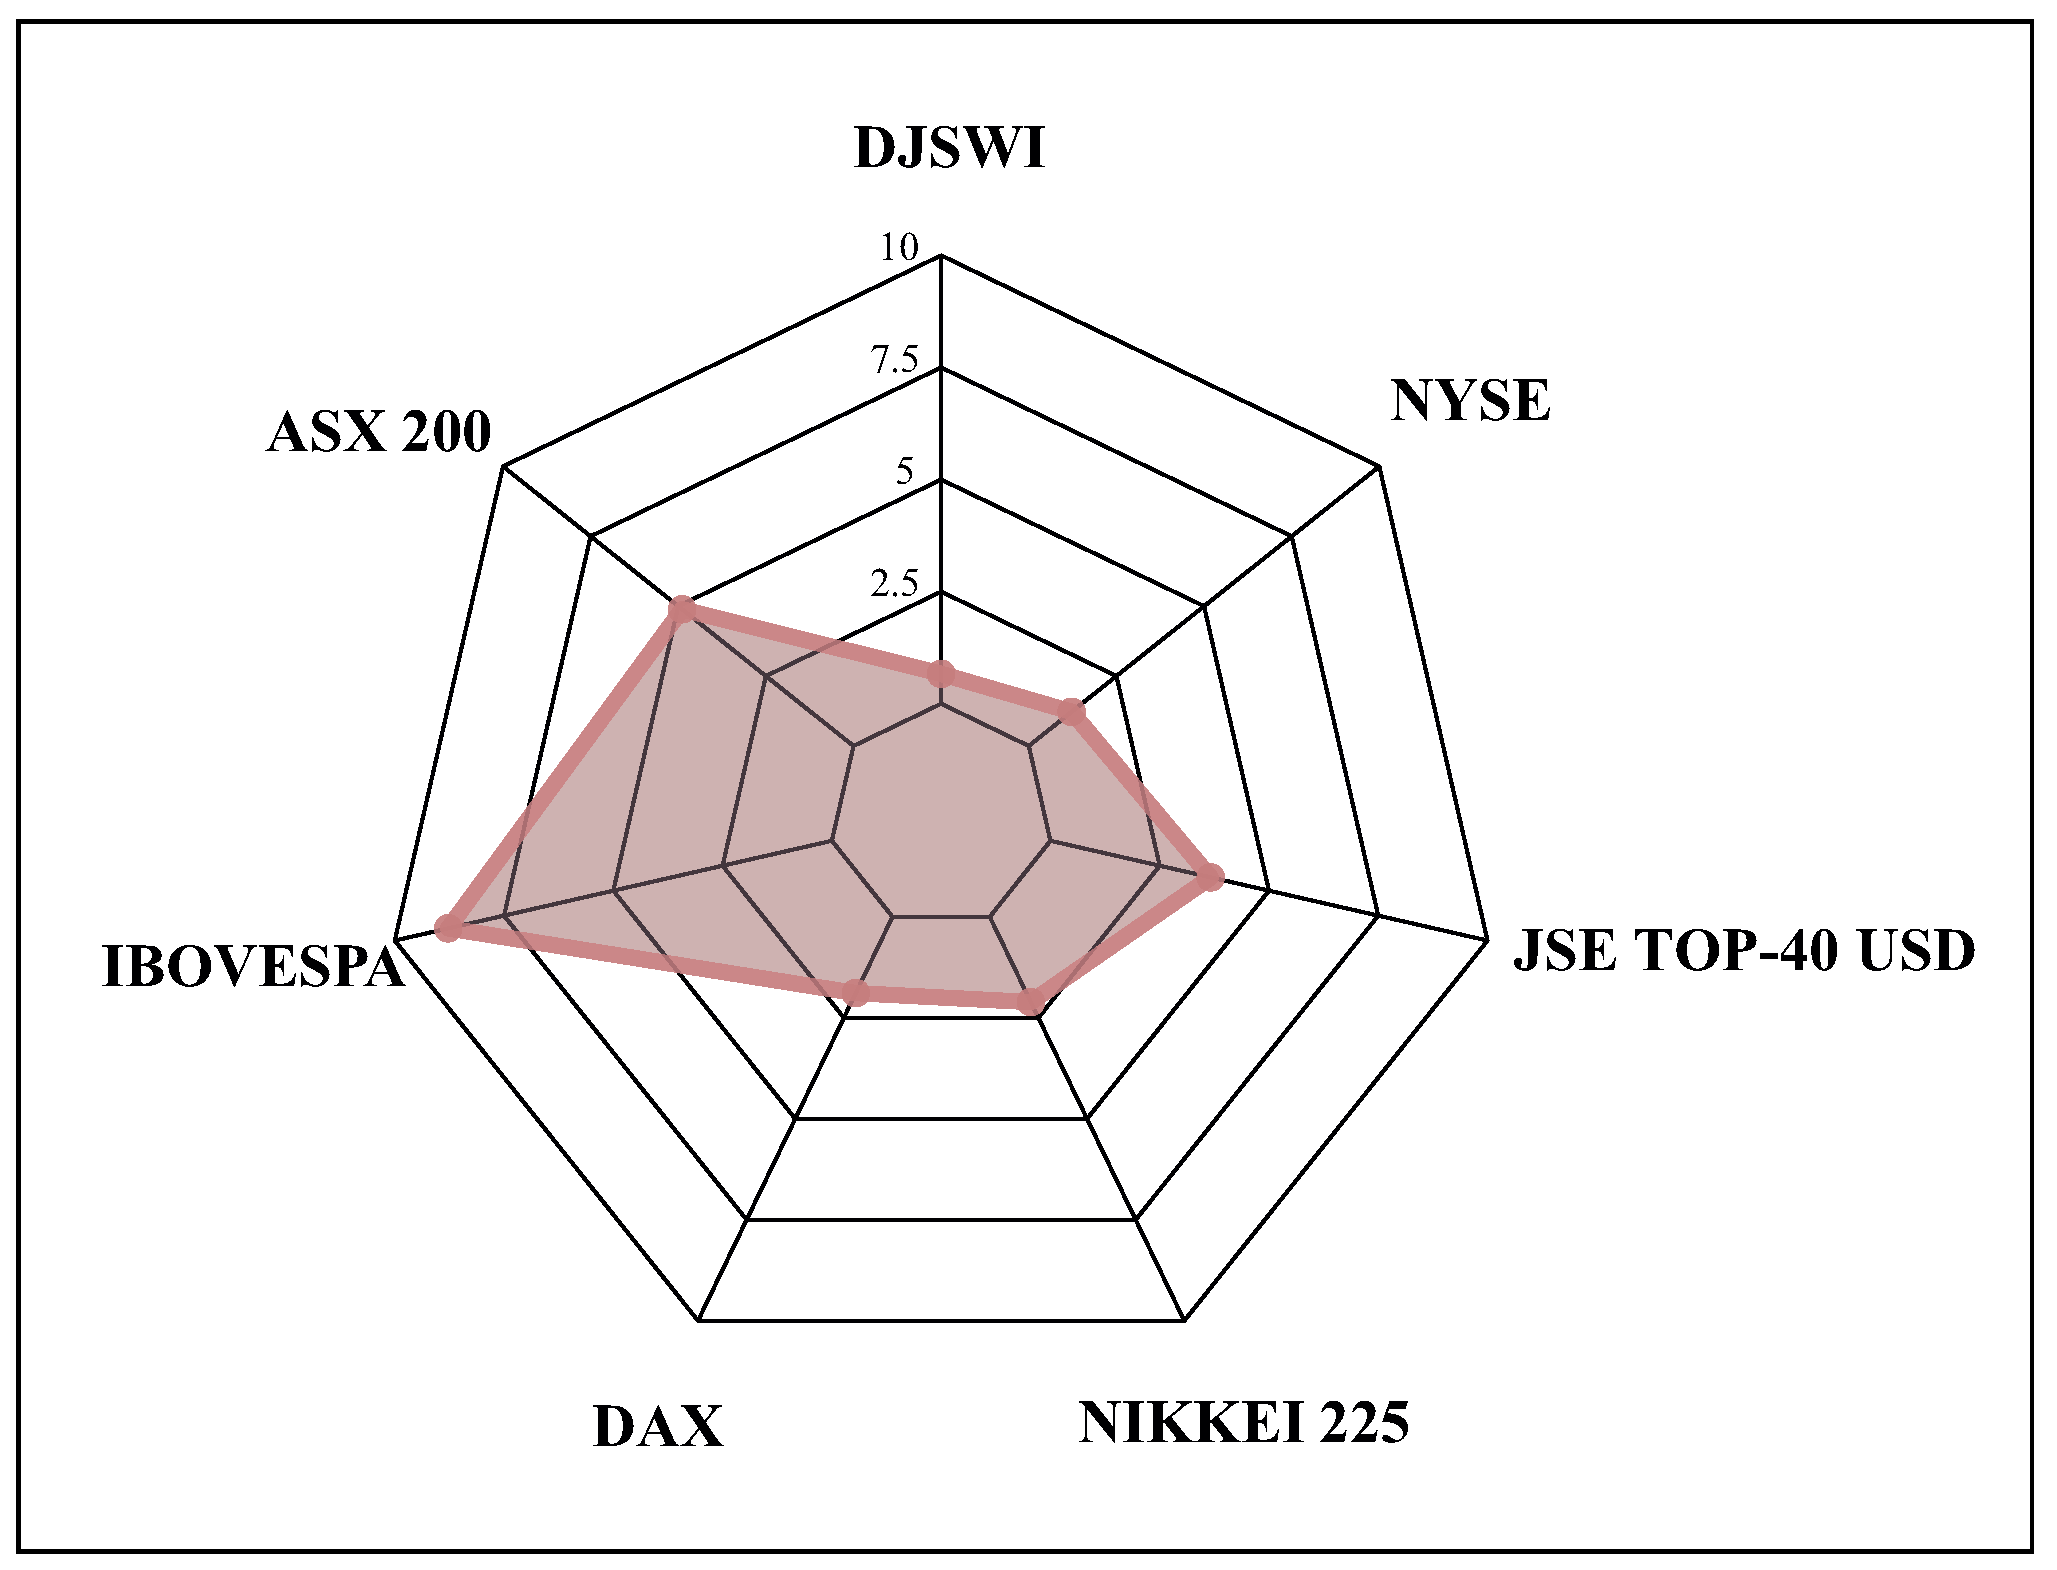
Table 1.
Description of the variables.
| Continent | Country | Variable I: Financial Markets | Variable II: COVID-19 Cases | |
|---|---|---|---|---|
| Stock Market Index | Abbreviation | Abbreviation | ||
| Americas | Brazil | Bovespa Index | IBOVESPA | TCC (BRA) |
| United States | NYSE Composite Index | NYSE | TCC (US) | |
| Africa | South Africa | JSE Top 40 Companies Index | JSE TOP-40 USD | TCC (SA) |
| Asia | Japan | Nikkei 225 Index | NIKKEI 225 | TCC (JAP) |
| Europe | Germany | DAX Xetra Index | DAX | TCC (GER) |
| Oceania | Australia | S&P/ASX 200 Index | ASX 200 | TCC (AUS) |
| Worldwide | Dow Jones Sustainability World Index | DJSWI | TCC (WV) | |
Table 2.
Main univariate descriptive statistics.
| Panel I: Descriptive Statistics. COVID-19 Cases *. | ||||||||||
|---|---|---|---|---|---|---|---|---|---|---|
| Variable | N | Mean | SD | Variance | Min. | Q1 | Median | Q3 | Max. | Range |
| Total worldwide | 137 | 0.05327 | 0.07940 | 0.00630 | 0.00663 | 0.01759 | 0.02144 | 0.05605 | 0.64485 | 0.63822 |
| Australia | 137 | 0.04085 | 0.07867 | 0.00619 | 0 | 0.00105 | 0.00386 | 0.03548 | 0.44629 | 0.44629 |
| Brazil | 137 | 0.08220 | 0.15970 | 0.02550 | 0 | 0.01460 | 0.03860 | 0.07980 | 1.17870 | 1.17870 |
| Germany | 137 | 0.06520 | 0.16080 | 0.02590 | 0 | 0.00180 | 0.00380 | 0.04680 | 1.38630 | 1.38630 |
| Japan | 137 | 0.04891 | 0.07603 | 0.00578 | 0 | 0.00400 | 0.02495 | 0.07101 | 0.55962 | 0.55962 |
| South Africa | 137 | 0.06640 | 0.11890 | 0.01410 | 0 | 0.00790 | 0.04350 | 0.05550 | 0.84730 | 0.84730 |
| U.S. | 137 | 0.07960 | 0.13300 | 0.01770 | 0 | 0.01220 | 0.01920 | 0.07720 | 0.69310 | 0.69310 |
| Panel II: Descriptive Statistics. World Stock Indices *. | ||||||||||
| Variable | N | Mean | St. dev. | Variance | Min | Q1 | Median | Q3 | Max | Range |
| DJSWI | 137 | −0.00004 | 0.02176 | 0.00047 | −0.10602 | −0.00690 | 0.00159 | 0.00976 | 0.07695 | 0.18297 |
| ASX 200 | 137 | −0.00135 | 0.02400 | 0.00058 | −0.00958 | 0.00032 | 0.01034 | 0.06766 | 0.16970 | |
| IBOVESPA | 137 | −0.00102 | 0.03681 | 0.00136 | −0.15993 | −0.01253 | 0 | 0.01662 | 0.13022 | 0.29015 |
| DAX | 137 | −0.00068 | 0.02582 | 0.00067 | −0.13055 | −0.00933 | 0 | 0.01252 | 0.10414 | 0.23469 |
| NIKKEI 225 | 137 | −0.00074 | 0.01991 | 0.00040 | −0.06274 | −0.00935 | −0.00039 | 0.00845 | 0.07731 | 0.14005 |
| JSE TOP-40 USD | 137 | −0.00131 | 0.03106 | 0.00097 | −0.12801 | −0.01313 | 0.00059 | 0.01608 | 0.08502 | 0.21303 |
| NYSE | 137 | −0.00090 | 0.02864 | 0.00082 | −0.12595 | −0.01324 | 0 | 0.01223 | 0.09564 | 0.22159 |
* Elaborated through the daily increases in the original time series (natural logarithmic basis).
Table 3.
Summary of the different phase differences detected from the wavelet coherence analysis. Source: Own elaboration.
Table 3.
Summary of the different phase differences detected from the wavelet coherence analysis. Source: Own elaboration.
| 02-19 | 03-18 | 04-15 | ||||||||||||||||||
|---|---|---|---|---|---|---|---|---|---|---|---|---|---|---|---|---|---|---|---|---|
| 1 Day | 2 Days | 4 Days | 8 Days | 16 Days | 32 Days | 1 Day | 2 Days | 4 Days | 8 Days | 16 Days | 32 Days | 1 Day | 2 Days | 4 Days | 8 Days | 16 Days | 32 Days | |||
| TCC(WV) over DJSWI | — | — | — | — | — | In phase | — | — | — | — | — | In phase | — | — | — | — | — | In phase | ||
| TCC(US) over NYSE | — | — | — | — | — | Out of phase | In phase | In phase | In phase | In phase | In phase | Out of phase | — | — | — | — | — | Out of phase | ||
| TCC(GER) over DAX | — | — | — | — | — | Out of phase | In phase | In phase | In phase | In phase | In phase | Out of phase | — | — | — | — | — | Out of phase | ||
| TCC(JAP) over NIKKEI 225 | — | — | — | — | Out of phase | Out of phase | — | — | — | — | Out of phase | Out of phase | — | — | — | — | — | — | ||
| TCC(SA) over JSE TOP-40 USD | — | — | — | — | — | Out of phase | Out of phase | Out of phase | Out of phase | Out of phase | Out of phase | Out of phase | — | — | — | — | — | Out of phase | ||
| TCC(AUS) over ASX 200 | — | — | — | — | — | Out of phase | In phase | In phase | In phase | In phase | — | Out of phase | — | — | — | — | — | Out of phase | ||
| TCC(BRA) over IBOVESPA | — | — | — | — | — | Out of phase | In phase | In phase | In phase | Out of phase | Out of phase | Out of phase | — | — | — | — | — | Out of phase | ||
| 05-13 | 06-10 | 07-08 | ||||||||||||||||||
| 1 Day | 2 Days | 4 Days | 8 Days | 16 Days | 32 Days | 1 Day | 2 Days | 4 Days | 8 Days | 16 Days | 32 Days | 1 Day | 2 Days | 4 Days | 8 Days | 16 Days | 32 Days | |||
| TCC(WV) over DJSWI | — | — | — | — | — | In phase | — | — | — | — | — | — | — | — | — | — | — | — | ||
| TCC(US) over NYSE | — | — | — | — | — | — | — | — | — | — | — | — | — | — | — | — | — | — | ||
| TCC(GER) over DAX | — | — | — | — | — | — | — | — | — | — | — | — | — | — | — | — | — | — | ||
| 02-19 | 03-18 | 04-15 | ||||||||||||||||||
| 1 Day | 2 Days | 4 Days | 8 Days | 16 Days | 32 Days | 1 Day | 2 Days | 4 Days | 8 Days | 16 Days | 32 Days | 1 Day | 2 Days | 4 Days | 8 Days | 16 Days | 32 Days | |||
| TCC(JAP) over NIKKEI 225 | — | — | — | — | — | — | — | — | — | — | — | — | — | — | — | — | — | — | ||
| TCC(SA) over JSE TOP-40 USD | — | — | — | — | — | — | — | — | — | — | — | — | — | — | — | — | — | — | ||
| TCC(AUS) over ASX 200 | — | — | — | — | — | Out of phase | — | — | — | — | — | In phase | — | — | — | — | — | — | ||
| TCC(BRA) over IBOVESPA | — | — | — | — | — | Out of phase | — | — | — | — | — | — | — | — | — | — | — | — | ||
Publisher’s Note: MDPI stays neutral with regard to jurisdictional claims in published maps and institutional affiliations. |
© 2021 by the authors. Licensee MDPI, Basel, Switzerland. This article is an open access article distributed under the terms and conditions of the Creative Commons Attribution (CC BY) license (http://creativecommons.org/licenses/by/4.0/).
Share and Cite
MDPI and ACS Style
Valls Martínez, M.d.C.; Martín Cervantes, P.A. Testing the Resilience of CSR Stocks during the COVID-19 Crisis: A Transcontinental Analysis. Mathematics 2021, 9, 514. https://doi.org/10.3390/math9050514
AMA Style
Valls Martínez MdC, Martín Cervantes PA. Testing the Resilience of CSR Stocks during the COVID-19 Crisis: A Transcontinental Analysis. Mathematics. 2021; 9(5):514. https://doi.org/10.3390/math9050514
Chicago/Turabian StyleValls Martínez, María del Carmen, and Pedro Antonio Martín Cervantes. 2021. "Testing the Resilience of CSR Stocks during the COVID-19 Crisis: A Transcontinental Analysis" Mathematics 9, no. 5: 514. https://doi.org/10.3390/math9050514
Note that from the first issue of 2016, this journal uses article numbers instead of page numbers. See further details here.