Article

Uses and Resources of Technologies by Mathematics Students Prior to COVID-19

by
Hassan Hossein-Mohand
1,*,
Melchor Gómez-García
1,
Juan-Manuel Trujillo-Torres
2,
Hossein Hossein-Mohand
1 and
Moussa Boumadan-Hamed
1
1
Department of Pedagogy, Faculty of Teacher Training and Education, Universidad Autónoma de Madrid (UAM), 28049 Madrid, Spain
2
Department of Didactics and School Organization, Faculty of Educational Sciences, Universidad de Granada (UGR), 18071 Granada, Spain
*
Author to whom correspondence should be addressed.
Sustainability 2021, 13(4), 1630; https://doi.org/10.3390/su13041630
Submission received: 14 January 2021 / Revised: 30 January 2021 / Accepted: 31 January 2021 / Published: 4 February 2021
(This article belongs to the Special Issue Sustainable Assessment in the Education System in the Age of COVID-19)

Abstract

:
Digital competence in education includes, amongst other things, the ability to create and manage content and information, mastery of communication tools, and solving technological problems. The access to information and communication technologies (ICT) for educational purposes could have affected the academic performance of mathematics students prior to COVID-19. The objectives were to (1) analyze family and economic factors that could influence the use of ICT for educational purposes, and (2) determine what attributes of Melilla’s mathematics students could explain an additional variation in the use of ICT for academic purposes before COVID-19. A total of 2018 students at secondary schools in Melilla were included in this cross-sectional study. A validated questionnaire with 14 questions regarding ICT and its uses and resources in mathematics learning was administered to students. Statistical analysis revealed that 63.81% of students used ICT to study mathematics and 36.19% did not. Of this percentage, 30.22% failed mathematics and 68.43% reported that ICT does not help them improve their grades. The use of ICT to study mathematics was influenced by students’ perceptions of its usefulness for their academic performance and learning. We also found an association with educational level and time spent on the Internet.

1. Introduction

The World Health Organization (WHO) declared the health crisis caused by COVID-19 an international pandemic on 11 March 2020. Spain applied the Royal Decree 463/2020 on 14 March to control the spread of the disease and protect the health and safety of citizens. The adopted containment measures affected all socioeconomic sectors in the country.
In the area of education, all on-site training activities were suspended, and teaching was adapted to the online model. All guidelines for the continuity of the academic year are contained in Orden EFP/365/2020, 22 April. Among them, the necessary adaptation of contents and methodologies is established, considering the characteristics of each student, especially those at risk of vulnerability. This exceptional situation demanded an effort from the entire educational community to adapt to the online modality. In addition, teachers are expected to have a broad vision of teaching that includes self-evaluation and co-evaluation to assess student learning through qualitative and quantitative data (Orden EFP/365/2020, 22 April). The lack of experience of regulated education with the online modality posed a challenge for the adaptation of teachers and students to the new educational reality. Technological use and resources have been key to the continued monitoring of the students’ learning.
As a result of these events, this study was proposed to determine the profile of mathematics students according to the use of information and communication technologies (ICT) for educational purposes before the pandemic and to predict the general behavior during the confinement under the state of alarm. We also aimed to analyze the incidence of factors such as age and gender, as well as academic, personal, and social variables, that could affect the use of ICT for educational purposes by students.

1.1. Technology in Education

The evolution of technology in education has different rhythms inside and outside the classroom. In education in formal schools, this evolution is conditioned by traditional approaches and limited uses by mathematics teachers [1,2]. Outside the classroom, advances in technological innovation are produced by a large demand for flexible training, adjusted to the students’ needs [3]. The relationship between technology use in education and academic performance is unclear [4]. Some authors argued that the use of technology for educational purposes is associated with improved academic performance [5,6]. However, its excessive use, even in educational settings, negatively impacts students’ academic performance [4]. Another study revealed that low grades are significantly affected by inappropriate use of ICT [7]. In contrast, other authors argued that higher grades are not affected by different uses of ICT [8].
Technology in education, in general, reduces gender differences [9], favors motivating attitudes in teenagers, and facilitates a positive perception of learning mathematics [10,11]. In addition, technology is associated with resilience, adaptability, and technological problem-solving capacity, and favors increased self-efficacy to meet future challenges and development [12]. In addition, inclusive technology training allows for the reduction in social inequalities [13].
Therefore, some authors argued that with adequate resources and continuous training, the use of ICT by teachers and students would be favorable [14]. In this sense, adequate training for teachers that complements technology with pedagogical tools is necessary [15,16], which promotes inclusive classrooms for students with disabilities [17] and encourages social justice [18,19].

1.2. Students’ Digital Competences

Several authors considered digital competence as a broad concept that covers different areas from personal and professional viewpoints [20]. In education, digital competence includes, among other things, the ability to create and manage content and information, the control of communication tools, and the resolution of technological problems [21,22,23]. Eger et al. [23] identified four groups of ICT users, differentiated according to their levels of technological abilities. The basic level is formed by those who use ICT for online social interactions and are unable to handle academic information. The intermediate level is formed of those with the ability to manage and edit basic documents, tables, and presentations. The advanced level is formed by those students who are also able to handle applications and consider the importance to computer security. The fourth group masters the above tasks and has the ability to program and self-educate despite not participating in specific ICT training programs [23].
However, most students do not have a high level of digital competence, which creates challenges for learning mathematics with educational software [16]. Therefore, training actions that improve these competences in the educational environment must be promoted [24]. The main use of ICT for educational purposes is focused on the creation and editing of documents, tables, and presentations, and the copying of folders and files. In addition, significant differences exist between the time spent and the uses of ICT for educational and social networking purposes (RRSS) [23]. Mastery of online digital resources and their use for educational purposes enables the strengthening of digital skills that will benefit future professional profiles [25].
Regarding the teaching of mathematics, the use of applications has evolved considerably since their introduction, including tools such as MATLAB or DERIVE [26]. Nowadays, a wide variety of tools is available: there are text editors such as LaTeX [27] or AnnoMathTex, which recognize expressions and mathematical formulas, making it easier for students to edit them [28]; there are also a wide variety of applications that allow students to interpret mathematical concepts and facilitate interaction. An example of this is the case of Geogebra, which is used for functions or graphics [29,30], or web applications such as Wolfram Alpha, for the development of algebraic problems [31,32,33].
Young people are considered digital natives because of their birth in the cyber-age and their natural predisposition to use technologies [34]. However, despite the wide offering of applications and tools available, students do not generally use them during the practice and learning of mathematics [23].

1.3. ICT Uses

If teenagers do not have an adequate level of digital competence in education [7,35], how do they use ICT? Despite the vast majority of young Spanish teenagers having a desktop or laptop computer at home [36], one out of five teenagers experiences difficulties using technology in general due to connectivity problems or data limits and technical problems with their devices [37]. These limitations more often affect peripheral urban areas, deepening social differences and conditioning equal opportunities [38]. The largest differences are found in populations at risk of social exclusion, deepening the digital divide [37]. In this sense, access to technology for educational purposes positively affects the mathematical performance of young immigrants, while unsupervised use of ICT has a negative effect [39].
Although socioeconomic factors also influence the digital competences of teenagers, in general, young people have a basic competence level and their digital literacy is mainly focused on simple Internet searches and communications through chats and social media [40,41]. To this end, young people use mobile phones, usually with Wi-Fi, as their preferred communication and information device, as they are more practical and accessible [42,43]. Likewise, the use of mobile phones by young people is more common than in adults; in relation to gender, there is more use by girls [42]. In addition, the scientific literature posits that girls spend more time on social media and online chats [44,45]. Spending more than two hours per day correlates with increased risk of depressive and sleep disorders [46]. Regarding boys, the highest consumption is of online entertainment, but mobile phone use is not correlated with depression [45].
Having their own laptop influences the normal academic monitoring of students, but it is not necessarily associated with academic performance [47]. Instead, a reliable predictor of students’ academic performance is active participation in online discussions in educational programs [48], although a comprehensive review that analyzed studies from the 1960s to 2018 showed no significant relationships regarding the effect of the frequency use of electronic devices on students’ academic performance [49]. However, other authors reported that the use of mobile phones for more than one hour a day on weekdays and two hours a day on weekends negatively impacts performance in mathematics [50].

1.4. Justification

Education focused on classrooms provides a limited view of the teaching/learning process in developed societies [51]. The distance education models allow for attaining objective 4 (education for sustainable development) of the Rio+20 document of the United Nations Organization (UNO) for 2019, since they are not subject to spatial-temporal restrictions [52]. Likewise, students perceive distance education as a motivating model because of its interactivity and ease of use, in addition to favoring learning and work adapted to the students [53]. Similarly, the advancements in mobile learning have rapidly progressed. The cloud possibilities, scalability, and costs adjusted to demand allow for sustainably training the world population [51].
From the academic point of view, the COVID-19 pandemic has shown that the current regulated educational model must be rethought, contemplating mixed models of on-site and distance learning. The flipped classroom is one of the active methodologies compatible with mixed programs, applicable to primary and secondary cycles, and produces better results than traditional methodologies [54]. With this methodology, higher scores are obtained in the evaluation of attitudinal indicators in mathematics, especially in analysis and graphic representation [55].
In this study, the use of ICT for educational purposes by the mathematics students was studied in depth with the following objectives: (1) to analyze the influencing personal, family, and economic factors; and (2) to specify what attributes of the mathematics students in Melilla, Spain, could explain an additional variation in the use of ICT for academic purposes. To this end, we used some items from the dimensions D. ICT Uses and Resources and E. ICT and Mathematics Learning of the main study.
The research questions constructed to describe the proposed objectives were: RQ1: what is the general behavior of the students in relation to the use of ICT for educational purposes? RQ2: Which considered variables influence the use of ICT for educational purposes? RQ3: Of these variables, which scores have the greatest incidence on the use of ICT for educational purposes? RQ4: Does gender and educational level influence the use of ICT for educational purposes? RQ5: Could the attributes of D.1 ICT Resources and D.6 Student Habits explain additional variation in the use of ICT for educational purposes? RQ6: Is it possible to predict the adequate monitoring of teaching by the students of mathematics during the COVID-19 confinement?

2. Materials and Methods

In the present study, a quasi-experimental method was used without pre-post and without a control group. The study population was obtained by applying the following inclusion criteria: (1) under 18 years old; (2) residing in the Autonomous City of Melilla; and (3) studying secondary and high school during the 2018/2019 academic year. The total number of students included in the population was 5875 (50.84% girls and 49.16% boys). To avoid bias, students from all educational centers in the city and from all stages participated. The total sample of this study was formed by 2018 students, of which 53.40% were girls. The sample differentiated by educational level was as follows: 1st year (417), 2nd year (473), 3rd year (394), and 4th year (417) of secondary school; and 1st year (233) and 2nd year (84) of high school.
The instrument was designed ad hoc, with 135 Likert-scale closed items with four graduated levels (1, none; 2, a little; 3, enough; and 4, a lot) for most items. The procedure followed for its elaboration was: literature review, identification of the dimensions, item writing, content validation by experts, construct validation, and reliability analysis [56,57]. The questionnaire used in the present study was submitted for content validation by expert judgment of both the level of writing and the degree of adequacy of the items used. In addition, a test questionnaire was administered to detect the aspects requiring improvement. Finally, the data matrix was validated through the criteria of Kaiser–Guttman and Tucker–Lewis index, with a score of 1.052.
The reliability of data collection was guaranteed using Google Forms and implementing the questionnaires during school hours. Previously, all subjects were informed about the nature of the study, in which they participated voluntarily. To access the educational centers, we received the authorization of Melilla’s Provincial Directorate of the Ministry of Education and Vocational Training [41].
In the present study, the results of 14 items were obtained from the dimensions D. ICT Uses and Resources and E. ICT and Mathematics Learning from the general questionnaire. The indicators analyzed in dimension D were: D.1 ICT Resources, D.4 Daily ICT Consumption, D.6 Students Habits, and D.7 ICT Consumption by Parents. Regarding dimension E, the indicators analyzed were E.1 At Home, E.3 Perception, and E.4 Tasks.
Table 1 lists the different dimensions and their indicators related to the items in this study.

Statistical Justification

Before the statistical display, outliers were eliminated. For the development of the naïve Bayes algorithm, the factors of all the independent variables were respected. No problems of linearity, homoscedasticity, or normality were observed in the analyzed variables. To verify the significant/non-significant incidence of the different independent variables on the given dependent variables, through multiple linear regression, with the discriminant linear model (LDA) and multivariate, these factors were maintained at all times.
The statistical procedure used in this study maintains the sequence of the following cascade process:
  • Elimination of missing values
  • Employment of a Bayesian model. This algorithm computes the conditional a posteriori probabilities of a categorical class variable given independent predictor variables using the Bayes rule
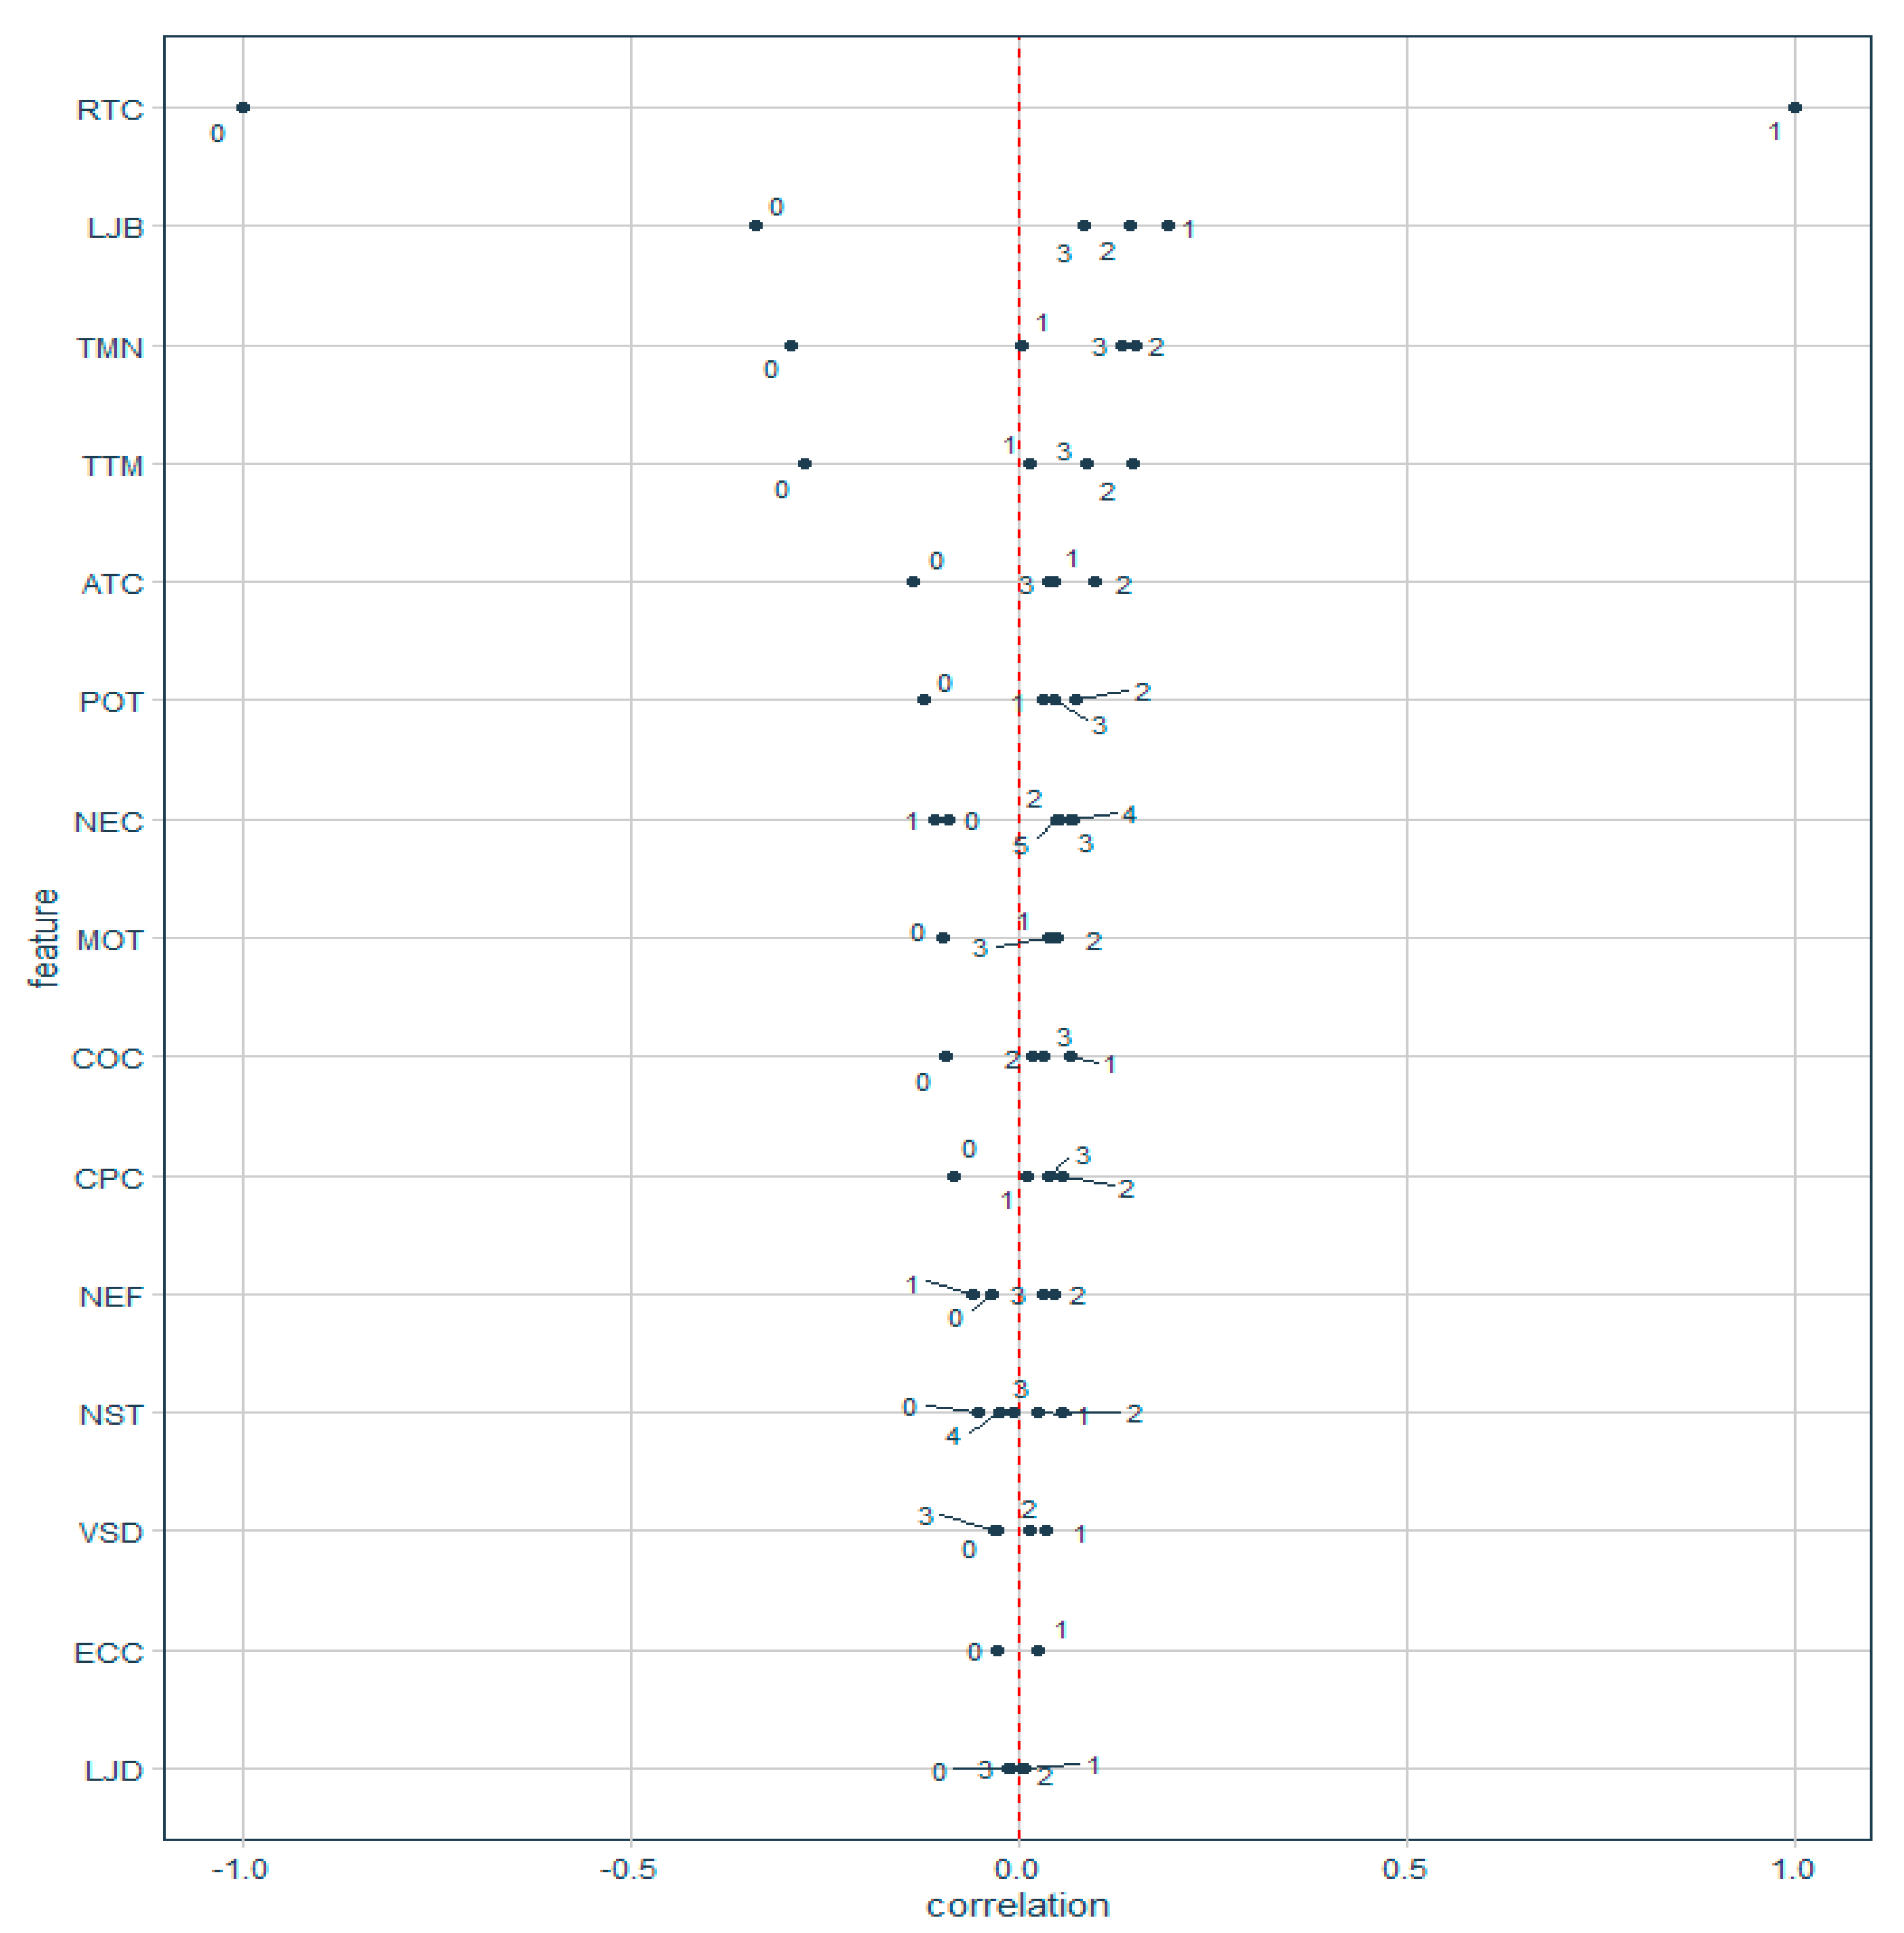
  • Binarization of the results of the variable in Figure 1 and the correlations funnel is applied to the dependent variable RTC. This algorithm uses the binarize() function to produce a feature set of binary variables (0 and 1). Numeric data are binned using n_bins parameter into categorical data, then all categorical data are one-hot encoded to produce binary outputs. To prevent low frequency categories from increasing the dimensionality, we use thresh_infreq = 0.005. Next, we used the correlate() function. This algorithm is not used to obtain the usual correlations with the dependent variable RTC. In the present study, we pretend to study in depth in order to find the correlations between the scores of each item with RTC. In this way, the correlation analysis acquires a more complete nuance than an ordinary correlation.
  • Determination of the variables that have a significant impact on the response variability for the given dependent variable. It is important to highlight that the model used was supervised.
  • The analysis of Wilks’ lambda criterion was crucial since it allows us to determine, from a multivariate perspective, the independent variables that have a significant impact on the dependent variable analyzed, RTC. In contrast to the results in Multiple linear regression model, the incidence of all levels or modes of response of the study’s participants is taken into account in a holistic manner.
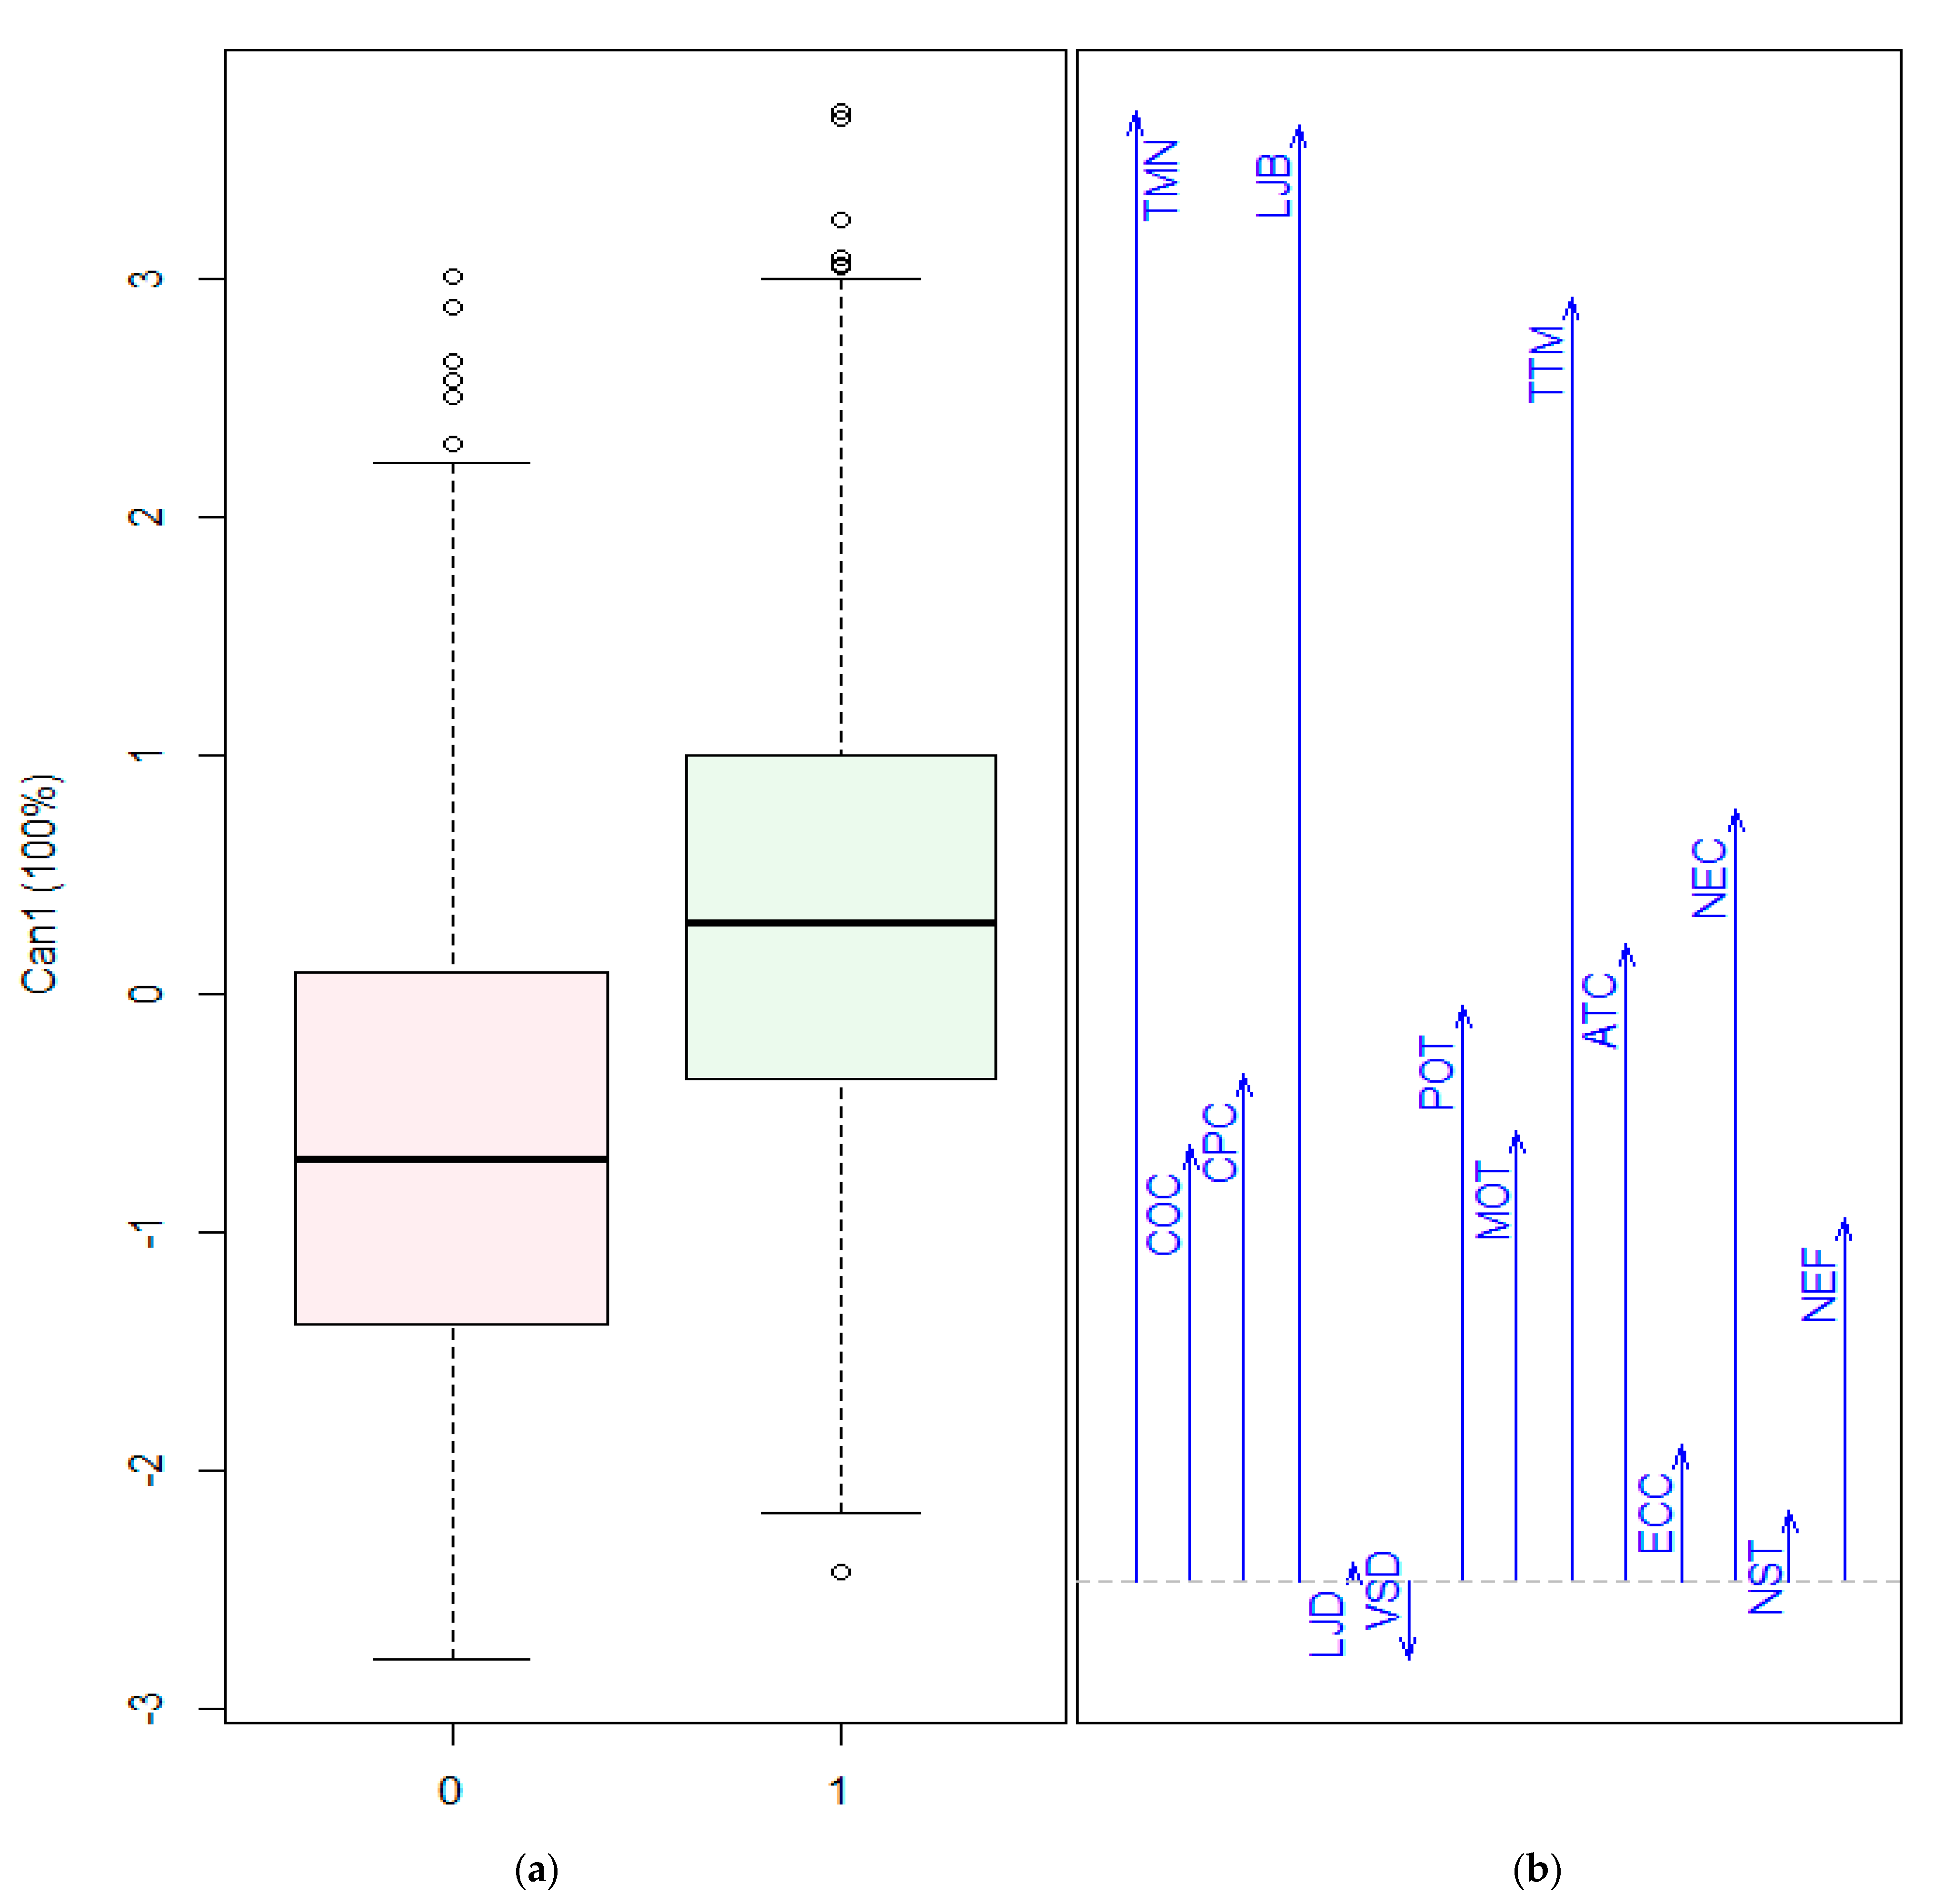
  • The LDA analysis is used to corroborate the previous results in Table 4 and to reinforce the conclusions of the study.

3. Results

Before addressing our first objective, we first analyze the general profile of Melilla’s mathematics students. We were looking for an answer to the first research question (RQ1): what is the general behavior of the students when they use ICT for educational purposes? The general behavior of the mathematics students toward the uses of ICT is reflected in the Bayesian model (Table 2). In this model, the a priori probabilities of RTC are shown (do you use the technological resources you have at home to study mathematics?) as well as the conditional probabilities of RTC of the rest of the study items.
Table 2 shows that 36.19% of students did not use ICT to study mathematics. Among them, 68.43% reported that ICT helped little or not at all to improve their grades in mathematics, and 64.77% did not spend any time searching on the Internet for academic purposes.
As for academic performance in mathematics, 30.22% of students who said they did not use ICT for this purpose failed, compared to 25.52% who say they did use them. In the rest of the grades, the perception among those who do and do not use ICT to study mathematics was similar.
Regarding technological resources at home, among the students who reported they did not use ICT to study mathematics, 45.39% said they did not own a desktop computer and 24.80% did not own a laptop. Another 45.66% and 62.06%, respectively, reported that they had between one and two desktop computers and laptops at home.
A deeper analysis of these results showed an increase in the number of students who used ICT to study mathematics compared to those who did not at all levels. These increases were 11.14% in the first year of secondary school, 9.90% in the second year of secondary school, 38.12% in the third year of secondary school, 40.05% in the fourth year of secondary school, 46.22% in the first year of high school, and 50.38% in the second year of high school. In terms of gender, 51.49% of students who reported that they did not use ICT to study mathematics were girls, compared to 54.27% of girls who reported that they did do not use it for this purpose.
Other relevant findings regarding the students that claimed not to use ICT to study mathematics show the following:
  • 58.40% indicated that teachers do not propose any homework activities;
  • 64.77% did not dedicate any time per day to Internet searches for academic purposes;
  • 73.04% of fathers and 83.20% of mothers used the computer little or not at all daily for work tasks; and
  • 35.09% stated that the family economic level (NEF) was very low or low.
The results regarding to students who affirmed using ICT to study mathematics show that:
  • 41.51% of those who used ICT to study mathematics spend between 1 and 2 h a day searching the Internet for academic purposes;
  • 63.49% of fathers and 77.40% of mothers uses the computer little or not at all daily for work tasks; and
  • 28.49% of the students affirmed that the family economic level was very low or low.
The use of the Bayesian model provided quantitative information of the contribution of each item conditioned to the RTC variable. However, a correlation funnel analysis (Figure 1) allowed us to visualize how the different scores were distributed around the reference variable RTC.
Figure 1. Correlations funnel for RTC.
Sustainability 13 01630 g001
Figure 1 shows the correlations between the different levels of the independent variables and the values of RTC. Generally, we observed that when the score of the participants in RTC was one, the correlation between this variable and the levels (one, two, and three) of the independent variables was positive. However, in all cases, it was slightly weak. Figure 1 also shows that the contribution of each item to the dependent variable RTC differed. It is important to consider the impact of the scores of the different study items on RTC—that is, using the multiple linear regression model, we were looking for the answer to RQ3: of these variables, which scores had the highest incidence in the use of ICT for educational purposes (Table 3)?
The statistical analysis in Table 3 shows that the model is significant (F(43,1995) = 13.18, p < 0.05). This is, it is a good predictor of the scores obtained by the mathematics students. However, the model with the items analyzed only explains 20.45% of the variability in the response (R2). These results suggest that 79.55% of the variation in the use of ICT for educational purposes cannot be explained by the variables used. Therefore, other variables must have also influenced the result. In addition, we observed that the variables that significantly contributed to the dependent variable were TMN, LJB, NEC, and TTM.
Table 3 shows the most significant value for each level in the different items in the dependent variable RTC. Significant values were observed in scores 2 and 3 for TMN (do you think that ICT helps you improve your grades in mathematics?). That is, the positive perceptions, which varied considerably, about the influence of technologies on academic performance had higher weight in explaining the use of ICT resources for educational purposes.
We observed that LJB (from Monday to Thursday, how many hours do you spend each day searching the Internet for information just to study or do class work?) showed high values in scores 1, 2, and 3. This indicated that the use of ICT resources is associated with students who spend more than one hour each day on the Internet for educational purposes. Similar results were observed regarding to scores 2, 3, and 4 for NEC (what level of education are you studying?). In other words, in general, students in grades higher than third-year secondary school used ICT for educational purposes more than the rest of the students.
Regarding the variable TTM (do you think you work more and better with ICT for mathematics?), the most significant scores were “little” and “quite”. No significant results were observed for the scores “a lot” of this item. ATC (Does your teacher propose activities, tasks or projects for you to do using ICT in class?) contributes to a lesser extent. For this variable, the most significant scores were “little” or “quite”. It is noteworthy that some variables obtained significant values for only one of their levels. Such is the case of POT (at home, does your father use the computer daily for work tasks?) and NST (what grade did you obtain in mathematics in this second quarter?) for level 2. That is, the father’s daily use of the computer “quite” and the grade “well” in mathematics in the second quarter were significantly associated with the use of ICT for educational purposes by mathematics students.
The remaining items did not have a significant impact on the RTC for any of their levels. The items COC and CPC, related to hardware resources at home; LJD and VSD, related to hours of sleep; MOT, referring to the use of technology by the mother; ECC; gender; and NEF family economic level did not explain the positive RTC scores.
The above results provide an answer to RQ4: does gender and educational level influence the use of ICT for educational purposes? In terms of gender, no significant effect was observed. The NEC results show an increased use of ICT for educational purposes at levels above third-year secondary school. This implied that the use of ICT by students in the first and second year of secondary school is not very significant. These data showed that age and academic demands may be predictors of ICT use. Similar results were obtained in the Bayesian model described above.
In response to RQ2 (which variables in the study influence the use of ICT for educational purposes?), we used the stepwise procedure with the Wilks’ lambda criterion, which allowed us to analyze the impact of each variable (Table 4).
Based on these results, we found that TMN + LJB + TTM + NEC + ATC + NEF + VSD had a significant impact on RTC. That is, the use of ICT to study mathematics was influenced by the perception of its usefulness to overcome the subject, the time dedicated to the Internet for educational purposes, the perception of its effectiveness, the educational level, the family economic level, and the hours of sleep during the weekend.
However, Table 4 does not show information regarding a quasi-R2, i.e., the lambda did not provide information about what percentage of the response variable is explained in comparison to such regressors. Therefore, a discriminant canonical analysis was performed (Figure 2).
Discriminant analysis implies a theoretical value as a linear combination of two or more independent variables that discriminates between the groups defined a priori. The discrimination is conducted by establishing the weights of the theoretical value of each variable so that they maximize the variance between groups versus intra-groups. The linear combination or discriminant function takes the following form:
Di = a + W1X1,i + W2X2,i + … + WnXn,i,
where Di is the discriminant score (membership group) of the ith individual, a is a constant, and Wj is the weighting of the jth variable. The result of this function is for a set of variables X1, …, Xn, where a value of D discriminates the individual in one group or another.
According to Figure 2a, levels 0 and 1 of RTC presented outliers, so they were corrected by eliminating those observations as they were few. Figure 2b shows the relative importance of each of the variables contemplated in Table 3. This figure shows that the variables with the greatest impact on RTC were TMN, LJB, and TTM. That is, they had a relevant influence on the use of ICT to study mathematics, the students’ perceptions about the perceived utility/performance of ICT, and the time dedicated to the Internet for educational purposes. We observed a not very significant negative relationship with the influence of VSD, referring to the hours of sleep during the weekends. The items COC and CPC of the indicator D.1, ICT Resources, and the items LJD and VSD of the indicator D.6, Students’ Habits, did not contribute significantly to the variability in the RTC scores: neither the possession of computer equipment at home nor the sleeping habits of the mathematics students contributed significantly to the use of ICT for educational purposes. With these results, we obtained answers to the RQ5: could the attributes of indicators D.1 ICT Resources and D.6 Student’s Habits explain an additional variation in the use of ICT for educational purposes?
To achieve objective 2, the MRPP algorithm was used, considering that the dependent variable is binary. The procedure followed by this algorithm is as follows:
  • Calculate a distance matrix between all observations;
  • Calculate the average distance in each group (d);
  • Calculate the weighted average distance within each group (delta);
  • Calculate the p-value associated with the delta by Monte Carlo permutations;
  • Determine the size of the effect, regardless of the selected sample size, using A, the corrected group agreement index (randomly): 1, delta_observed/delta_expected. It describes the intra-group homogeneity compared to the one expected randomly: A = 1, all observations are identical within groups; A = 0, the intra-group heterogeneity is equal to that expected randomly.
The results reveal that the delta value was 0.001, and the A value was 11%. Therefore, we concluded that there were significant multivariate differences between the RTC groups. That is, there were two very different profiles regarding the use of ICT for educational purposes, and this difference was very significant.
As shown by the analytical summary of the results, the procedure followed in this study is detailed. Firstly, the dependent variable RTC and the influence of the rest of the items on it were analyzed through the following statistical instruments: the Bayesian model, correlation analysis, and the multiple linear regression model. Secondly, to contrast the results obtained, the following models were used: Wilks’ lambda and LDA. This guaranteed the reliability of the results obtained in this study.

4. Discussion

To evaluate the relationship between students’ use of ICT and their academic performance, two items were analyzed in this study: TMN, which refers to the mathematics students’ perception of ICTl and NST, which is associated with mathematics grades. Regarding the first item, the correlation analysis showed that positive perceptions about the influence of technologies on academic performance were associated with the use of ICT resources for educational purposes. The use of ICT to study mathematics was significantly positively correlated with the academic usefulness perceived by the students, but not with academic performance in mathematics, especially for students with the highest grades. These results are in line, first, with the findings of Abidin et al. [10] on the motivational effects of technology toward learning mathematics, and second, with the findings of Asif et al. [8], who proposed that higher grades are not affected by different uses of ICT. In contrast, the literature suggests that lower grades are affected by inappropriate use of ICT [7], whereas other authors noted positive evidence in the academic performance through the use of technology for academic purposes [5,6].
The correlation and multiple linear regression models showed that the use of ICT resources is associated with students who spend more than one hour a day weekly on the Internet for educational purposes. In addition, a significant positive correlation was observed between the time spent on technology for educational purposes and academic performance. Proposing homework, activities, or projects to reinforce the use of ICT for educational purposes showed weak positive correlations. Regarding grades obtained in mathematics, NST, no clear significant associations were observed with the use of ICT for educational purposes by mathematics students. Along this line, Abe et al. [48] argued that active participation in digital educational communities is a reliable predictor of academic performance. Significant negative correlations have been observed between time spent using technology unsupervised by adults and non-educational uses of ICT [23,58]. However, several authors argued that evidence is lacking about the effect between the frequency of electronic device use and student academic performance [49,59,60].
Around 50% of students who reported not using ICT for educational purposes claimed to own computers at home. Bayesian correlation and multiple linear regression models did not show significant correlations between the possession of desktop computers and/or laptops and the use of ICT for educational purposes, or with the academic performance of mathematics students.
The statements of the mathematics students of the Autonomous City of Melilla on hardware equipment at home are far below the data provided by the statistics National Institute (INE) in its survey on ICT in at Spanish homes [36], which estimated that more than 80% of homes have computers. The literature postulates that the possession of ICT resources necessary for the monitoring of educational programs is not a predictor of performance [47]. However, although a high percentage of students claimed to use ICT for learning mathematics, several authors have argued that their use is restricted by the low level of digital competence of most mathematics students [16,23], who use ICT mainly for Internet searches [40]. According to Eger’s classification of digital competence [23], the majority of Melilla’s mathematics students can be considered to be in the two lower levels. Other causes that could condition the use of ICT for educational purposes are connectivity limitations and technical problems with hardware [37].
In this study, the number of laptops exceeded the number of desktop computers by more than 17%. These data suggested that the mathematics students have a clear preference for laptops. In line with the findings of this study, the preference of young people for mobile devices over fixed ones was postulated [42].
In terms of student behavior, the differences in perceptions between those who use and those who do not use ICT were significant. We observed that the proportion of students who use ICT to study mathematics was near to 40% in the two stages of secondary school, rising to 90% in high school groups. The correlation and multiple linear regression models also showed that the use of ICT by students in the first and second years of secondary school was not very significant and that it increased with educational level. These results may be associated with the maturity of older students and with academic demands. No gender differences were observed between the use or non-use of ICT for studying mathematics. Similar findings were reported in other studies, where no significant gender differences were evident [9,10]. In addition, the literature postulates a significant positive correlation between the different uses of technology and the age of young people [11,45].
Regarding students who did not use ICT to study mathematics, more than 70% of fathers and 80% of mothers hardly used a computer for daily work tasks. Correlation and multiple linear regression models showed that high daily computer use by fathers was significantly associated with their children’s use of ICT for educational purposes. In contrast, the mother’s ICT use did not explain the children’s positive RTC scores. In addition, our findings did not show that the use of ICT to study mathematics was associated with family economic level due to the similar responses of all the students surveyed. However, the literature postulates that socioeconomic factors are predictors of ICT use due to the availability of resources [38]. In addition to socioeconomic factors, associated geographic factors have influence [37]. Access to technology for educational purposes also reduces the digital divide among vulnerable people and has a positive impact on the performance in mathematics of young immigrants, whereas unsupervised use of ICT has a negative effect [39].
In relation to the incidence of sleep habits on working days and holidays, no significant correlations were found with the use of ICT to study mathematics. A significant increase was noted in the sleep of teenagers on holidays, by more than 14% who go to sleep after 12:00 a.m. and by more than 28% after 2:00 a.m. In contrast, the correlation and multiple linear regression models and LDA showed that sleep time on work days and on holidays did not significantly impact the use of ICT for educational purposes. However, the scientific literature suggests that inappropriate ICT use results in sleep disorders [46], generates addiction in teenagers [34,45], and negatively impacts students’ academic performance [59,60].
Based on our findings (MANOVA), the use of technological resources at home to study mathematics was mainly influenced by the students’ perception of ICT, the educational level and the socioeconomic family level of the students, the time spent weekly on the Internet searching for information for academic purposes, and the activities with ICT assigned by the mathematics teachers, with the weekend hours being less affected as the students usually disconnect all the devices and go to sleep. The rest of the study variables had a non-significant effect on RTC.
The LDA findings show that the variables that had the strongest impact on the use of ICT for educational purposes were the students’ perceptions of the perceived usefulness and performance of ICT and the time spent on the Internet for educational purposes. We observed a not very significant negative relationship with the influence of VSD, referring to the hours of sleep on weekends.
Finally, the MRPP algorithm highlighted the existence of well-differentiated profiles regarding the use of ICT for educational purposes. This result leads to the idea that the general profile of students is quite complex and difficult to group around the use of ICT for educational purposes.
The results described above provide an argument supporting adapting teaching and learning to various situations such as the challenge posed by the current COVID-19 pandemic. In addition to a complete change in the pedagogical approach, we determined that the use of ICT by the entire educational community promotes a forced approach to technologies for teaching use, being the main teaching resource, reducing the digital divide and demonstrating the reality of ICT use by students and teachers. Likewise, a recent study concluded that one of the possibilities offered by technologies in this situation is the effectiveness of promoting mathematical thinking and communication outside the classroom [61].
The strengths of the present study include the in-depth analysis of the study variables and its multidisciplinary nature. Some limitations should be also highlighted. Firstly, this was a cross-sectional study conducted within a specific time frame. Second, there is possible bias derived from the sample obtained, which was very localized geographically. In addition, we only focused on the subject of mathematics and only on 14 items of different indicators were analyzed. Future lines of research should evaluate in a longitudinal study the attributes with the strongest impact on the use of ICT for academic purposes by students. A study is recommended after overcoming the pandemic to contrast these results. Replication of the study with a different sample and in other academic subjects would allow generalization of the findings. Further research should address these limitations.

5. Conclusions

The use of technologies by secondary school students for the study of mathematics was found to be influenced by their perceived usefulness for learning and improving their academic performance. We found evidence of a significant association between the use of ICT for educational purposes with the academic level of the students and the time spent on the Internet for educational purposes. No significant gender differences were observed among mathematics students with respect to the use or non-use of ICT, nor was there any significant association between technological resources at home and family socioeconomic level with the use of ICT for educational purposes.
The results of this study provide an answer to RQ6: is it possible to predict an adequate monitoring of teaching by mathematics students during the confinement caused by COVID-19? In general, the answer is no, because students were not previously familiar with the use of ICT for educational purposes. In addition, the impact of another possible confinement derived from the uncontrolled evolution of the pandemic could have greater repercussions on school failure, especially among younger students due to their low digital competence and in countries with exclusively face-to-face educational models.
In relation to our findings, some practical implications are proposed. First, it would be advisable for educational institutions to rethink the current educational model to make it sustainable. Secondly, mathematics teachers should design the classroom program to encourage the use of technologies for the development of activities, tasks, and projects inside and outside the classroom. In addition, specific programs should be established for the training and evaluation of students’ digital competence for learning mathematics. In this new stage, the role of mathematics teachers is fundamental when designing dynamic and attractive pedagogical activities inside and outside the classroom for students, which encourage them to use ICT responsibly and productively. Therefore, teachers must be trained for the challenge faced by education all around the world.

Author Contributions

Conceptualization, H.H.-M. (Hassan Hossein-Mohand) and M.G.-G.; methodology, H.H.-M. (Hassan Hossein-Mohand) and J.-M.T.-T.; software, H.H.-M. (Hossein Hossein-Mohand); validation, H.H.-M. (Hossein Hossein-Mohand), M.G.-G. and J.-M.T.-T.; formal analysis, M.G.-G. investigation, H.H.-M. (Hassan Hossein-Mohand); resources, H.H.-M. (Hassan Hossein-Mohand); data curation, H.H.-M. (Hassan Hossein-Mohand); writing—original draft preparation, H.H.-M. (Hassan Hossein-Mohand); writing—review and editing, H.H.-M. (Hassan Hossein-Mohand) and J.-M.T.-T.; visualization, M.B.-H.; supervision, M.G.-G., J.-M.T.-T., H.H.-M. (Hossein Hossein-Mohand) and M.B.-H. All authors have read and agreed to the published version of the manuscript.

Funding

This research received no external funding.

Institutional Review Board Statement

Not applicable.

Informed Consent Statement

Informed consent was obtained from all subjects involved in the study.

Data Availability Statement

Not applicable.

Conflicts of Interest

The authors declare no conflict of interest.

References

  1. Chen, I.-H.; Gamble, J.H.; Lee, Z.-H.; Fu, Q.-L. Formative assessment with interactive whiteboards: A one-year longitudinal study of primary students’ mathematical performance. Comput. Educ. 2020, 150, 103833. [Google Scholar] [CrossRef]
  2. Mercader, C. Explanatory model of barriers to integration of digital technologies in higher education institutions. Educ. Inf. Technol. 2020. [Google Scholar] [CrossRef]
  3. Almen, L.; Bagga-Gupta, S.; Bjursell, C. Access to and accounts of using digital tools in swedish secondary grades. An exploratory study. J. Inf. Technol. Educ. Res. 2020, 19, 287–314. [Google Scholar] [CrossRef]
  4. Gubbels, J.; Swart, N.M.; Groen, M.A. Everything in moderation: ICT and reading performance of Dutch 15-year-olds. Large-Scale Assess. Educ. 2020, 8. [Google Scholar] [CrossRef] [Green Version]
  5. Diaz, L.M.B.; Garcia, M.L.S.; Cano, E.V. Effects on academic performance in secondary students according to the use of ICT. Int. J. Educ. Res. Innov. 2019, 12, 90–108. [Google Scholar]
  6. Garcia-Martin, S.; Canton-Mayo, I. Use of technologies and academic performance in adolescent students. Comunicar 2019, 27, 73–81. [Google Scholar] [CrossRef]
  7. Wakefield, J.; Frawley, J.K. How does students’ general academic achievement moderate the implications of social networking on specific levels of learning performance? Comput. Educ. 2020, 144. [Google Scholar] [CrossRef]
  8. Asif, R.; Merceron, A.; Ali, S.A.; Haider, N.G. Analyzing undergraduate students’ performance using educational data mining. Comput. Educ. 2017, 113, 177–194. [Google Scholar] [CrossRef]
  9. Meggiolaro, S. Information and communication technologies use, gender and mathematics achievement: Evidence from Italy. Soc. Psychol. Educ. 2018, 21, 497–516. [Google Scholar] [CrossRef]
  10. Abidin, Z.; Mathrani, A.; Hunter, R. Gender-related differences in the use of technology in mathematics classrooms: Student participation, learning strategies and attitudes. Int. J. Inf. Learn. Technol. 2018, 35, 266–284. [Google Scholar] [CrossRef]
  11. Areepattamannil, S.; Santos, I.M. Adolescent students’ perceived information and communication technology (ICT) competence and autonomy: Examining links to dispositions toward science in 42 countries. Comput. Hum. Behav. 2019, 98, 50–58. [Google Scholar] [CrossRef]
  12. Sagone, E.; De Caroli, M.E.; Falanga, R.; Indiana, M.L. Resilience and perceived self-efficacy in life skills from early to late adolescence. Int. J. Adolesc. Youth 2020, 25, 882–890. [Google Scholar] [CrossRef]
  13. Diaz-Lauzurica, B.; Moreno-Salinas, D. Computational Thinking and Robotics: A Teaching Experience in Compulsory Secondary Education with Students with High Degree of Apathy and Demotivation. Sustainability 2019, 11, 5109. [Google Scholar] [CrossRef] [Green Version]
  14. Hu, S.L.; Laxman, K.; Lee, K. Exploring factors affecting academics’ adoption of emerging mobile technologies-an extended UTAUT perspective. Edu. Inf. Technol. 2020, 25, 4615–4635. [Google Scholar] [CrossRef]
  15. Anghel, G.A.; Gorghiu, G.; Gorghiu, L.M. Exploiting the ICT and Web 2.0 Competencies in the Teaching Methodologies of Disciplines framed in the Mathematics and Natural Science Area. In New Approaches in Social and Humanistic Sciences; Medimond: Bologna, Italy, 2016; pp. 39–43. [Google Scholar]
  16. Botuzova, Y.V. Experience of using ict tools for teaching mathematical analysis to future teachers of mathematics. Inf. Technol. Learn. Tools 2020, 75, 153–169. [Google Scholar]
  17. Fernández Batanero, J.M.; López Meneses, E.; Cabero Almenara, J. Knowledge and degree of training of primary education teachers in relation to ICT taught to disabled students. Br. J. Educ. Technol. 2019, 50, 1961–1978. [Google Scholar] [CrossRef]
  18. Montelongo, R.; Eaton, P.W. Online learning for social justice and inclusion The role of technological tools in graduate student learning. Int. J. Inf. Learn. Technol. 2019, 37, 33–45. [Google Scholar] [CrossRef]
  19. Panthi, R.K.; Luitel, B.C.; Belbase, S. Teachers’ Perception of Social Justice in Mathematics Classrooms. Redimat-Rev. De Investig. En Didact. De Las Mat. 2018, 7, 7–37. [Google Scholar] [CrossRef]
  20. Gudmundsdottir, G.B.; Hernandez Gasso, H.; Colomer Rubio, J.C.; Hatlevik, O.E. Student teachers’ responsible use of ICT: Examining two samples in Spain and Norway. Comput. Educ. 2020, 152. [Google Scholar] [CrossRef]
  21. Ankiewicz, P. Perceptions and attitudes of pupils towards technology: In search of a rigorous theoretical framework. Int. J. Technol. Des. Educ. 2019, 29, 37–56. [Google Scholar] [CrossRef]
  22. Caena, F.; Redecker, C. Aligning teacher competence frameworks to 21st century challenges: The case for the European Digital Competence Framework for Educators (DIGCOMPEDU). Eur. J. Educ. 2019, 54, 356–369. [Google Scholar] [CrossRef] [Green Version]
  23. Eger, L.; Klement, M.; Tomczyk, L.; Pisonova, M.; Petrova, G. Different user groups of university students and their ict competence: Evidence from three countries in central europe. J. Balt. Sci. Educ. 2018, 17, 851–866. [Google Scholar] [CrossRef]
  24. Lopez Nunez, J.A.; Campos Soto, M.N.; Aznar Diaz, I.; Rodriguez Jimenez, C. Digital competence of the teaching staff to attend to students with learning difficulties. A theoretical review. Rev. Electron. Interuniv. De Form. Del Profr. 2020, 23, 143–154. [Google Scholar] [CrossRef]
  25. Heidari, E.; Salimi, G.; Mehrvarz, M. The influence of online social networks and online social capital on constructing a new graduate students’ professional identity. Interact. Learn. Environ. 2020. [Google Scholar] [CrossRef]
  26. Roanes-Lozano, E.; Galan-Garcia, J.L.; Solano-Macias, C. Some Reflections About the Success and Impact of the Computer Algebra System DERIVE with a 10-Year Time Perspective. Math. Comput. Sci. 2019, 13, 417–431. [Google Scholar] [CrossRef]
  27. Melfi, G.; Schwarz, T.; Stiefelhagen, R. An Inclusive and Accessible LaTeX Editor. In Computers Helping People with Special Needs, Pt I, Proceedings of the 15th International Conference, ICCHP 2016, Linz, Austria, 13–15 July 2016; Miesenberger, K., Kouroupetroglou, G., Eds.; Springer: Berlin/Heidelberg, Germany, 2016; Volume 10896, pp. 579–582. [Google Scholar]
  28. Scharpf, P.; Mackerracher, I.; Schubotz, M.; Beel, J.; Breitinger, C.; Gipp, B.; Assoc Comp, M. AnnoMathTe—A Formula Identifier Annotation Recommender System for STEM Documents. In Recsys 2019: Proceedings of the 13th Acm Conference on Recommender Systems, Copenhagen, Denmark, 16–20 September 2019; Association for Computing Machinery: New York, NY, USA, 2019; pp. 532–533. [Google Scholar]
  29. Albano, G.; Dello Iacono, U. GeoGebra in e-learning environments: A possible integration in mathematics and beyond. J. Ambient Intell. Humaniz. Comput. 2019, 10, 4331–4343. [Google Scholar] [CrossRef]
  30. Birgin, O.; Acar, H. The effect of computer-supported collaborative learning using GeoGebra software on 11th grade students’ mathematics achievement in exponential and logarithmic functions. Int. J. Math. Educ. Sci. Technol. 2020, 1–18. [Google Scholar] [CrossRef]
  31. Abramovich, S. Paying attention to students’ ideas in the digital era. Teach. Math. 2020, 23, 1–16. [Google Scholar]
  32. Do, N.V.; Nguyen, H.D.; Mai, T.T. Intelligent Educational Software in Discrete Mathematics and Graph Theory. In New Trends in Intelligent Software Methodology Tools, and Techniques: Proceedings of the 17th International Conference (SoMeT), Granada, Spain, 26–28 September 2018; Fujita, H., Herrera-Viedma, E., Eds.; IOS Press: Amsterdam, The Netherlands, 2018; Volume 303, pp. 925–938. [Google Scholar]
  33. Ye, B. Analysis of Semantic Retrieval System Based on Information Resource Management A Comparative Analysis of Wolfram Alpha and Google. In Proceedings of the 2nd International Conference on Culture, Education and Economic Development of Modern Society, Moscow, Russia, 1–3 March 2018; McAnally, E., Solovjeva, I., Zhang, Y., Green, R., Hou, R., Eds.; Atlantis Press: Paris, Frnace, 2018; Volume 205, pp. 1145–1150. [Google Scholar]
  34. Wang, H.Y.; Sigerson, L.; Cheng, C. Digital Nativity and Information Technology Addiction: Age cohort versus individual difference approaches. Comput. Hum. Behav. 2019, 90, 1–9. [Google Scholar] [CrossRef]
  35. Sánchez-Prieto, J.C.; Huang, F.; Olmos-Miguelanez, S.; García-Penalvo, F.J.; Teo, T. Exploring the unknown: The effect of resistance to change and attachment on mobile adoption among secondary pre-service teachers. Br. J. Educ. Technol. 2019, 50, 2433–2449. [Google Scholar] [CrossRef]
  36. INE. Encuesta Sobre Equipamiento y Uso de Tecnologías de Información y Comunicación en Los Hogares INE. Estadística de la Sociedad de la Información y la Comunicación en los Centros Educativos no Universitarios. Available online: https://www.educacionyfp.gob.es/servicios-al-ciudadano/estadisticas/no-universitaria/centros/sociedad-informacion/2018-2019.html (accessed on 10 October 2020).
  37. Gonzales, A.L.; Calarco, J.M.; Lynch, T. Technology Problems and Student Achievement Gaps: A Validation and Extension of the Technology Maintenance Construct. Commun. Res. 2020, 47, 750–770. [Google Scholar] [CrossRef] [Green Version]
  38. Levine, L. Broadband adoption in urban and suburban California: Information-based outreach programs ineffective at closing the digital divide. J. Inf. Commun. Ethics Soc. 2020. [Google Scholar] [CrossRef]
  39. Kim, S. ICT and the UN’s Sustainable Development Goal for Education: Using ICT to Boost the Math Performance of Immigrant Youths in the US. Sustainability 2018, 10, 4584. [Google Scholar] [CrossRef] [Green Version]
  40. Durak, H.Y.; Seferoglu, S.S. Antecedents of Social Media Usage Status: Examination of Predictiveness of Digital Literacy, Academic Performance, and Fear of Missing Out Variables. Soc. Sci. Q. 2020, 101, 1056–1074. [Google Scholar] [CrossRef]
  41. Gomez-Garcia, M.; Hossein-Mohand, H.; Trujillo-Torres, J.M.; Aznar-Diaz, I. Technological Factors That Influence the Mathematics Performance of Secondary School Students. Mathematics 2020, 8, 1935. [Google Scholar] [CrossRef]
  42. Gigantesco, A.; Palumbo, G.; Zadworna-Cieslak, M.; Cascavilla, I.; Del Re, D.; Kossakowska, K.; Chrusciel, M.; Kelpsait, D.; Kuklinska, G.; Zaharieva, B.; et al. An international study of middle school students’ preferences about digital interactive education activities for promoting psychological well-being and mental health. Ann. Dell Ist. Super. Di Sanita 2019, 55, 108–117. [Google Scholar] [CrossRef]
  43. Hegarty, B.; Thompson, M. A teacher’s influence on student engagement: Using smartphones for creating vocational assessment eportfolios. J. Inf. Technol. Educ. Res. 2019, 18, 113–159. [Google Scholar] [CrossRef]
  44. Davey, A.; Nasser, K.; Davey, S. Gender Differential for Smart Phone Addiction and its Predictors among Adolescents: Assessing relationship with Self Control via SEM Approach. J. Indian Assoc. Child. Adolesc. Ment. Health 2020, 16, 80–101. [Google Scholar]
  45. Nishida, T.; Tamura, H.; Sakakibara, H. The association of smartphone use and depression in Japanese adolescents. Psychiatry Res. 2019, 273, 523–527. [Google Scholar] [CrossRef]
  46. Alimoradi, Z.; Lin, C.-Y.; Brostrom, A.; Bulow, P.H.; Bajalan, Z.; Griffiths, M.D.; Ohayon, M.M.; Pakpour, A.H. Internet addiction and sleep problems: A systematic review and meta-analysis. Sleep Med. Rev. 2019, 47, 51–61. [Google Scholar] [CrossRef] [Green Version]
  47. Reisdorf, B.; Triwibowo, W.; Yankelevich, A. Laptop or Bust: How Lack of Technology Affects Student Achievement. Am. Behav. Sci. 2020, 64, 927–949. [Google Scholar] [CrossRef]
  48. Abe, J.A.A. Big five, linguistic styles, and successful online learning. Internet High. Educ. 2020, 45. [Google Scholar] [CrossRef]
  49. Adelantado-Renau, M.; Moliner-Urdiales, D.; Cavero-Redondo, I.; Beltran-Valls, M.R.; Martinez-Vizcaino, V.; Alvarez-Bueno, C. Association between Screen Media Use and Academic Performance among Children and Adolescents A Systematic Review and Meta-analysis. JAMA Pediatrics 2019, 173, 1058–1067. [Google Scholar] [CrossRef] [PubMed]
  50. Liu, X.C.; Luo, Y.C.; Liu, Z.Z.; Yang, Y.Y.; Liu, J.H.; Jia, C.X. Prolonged Mobile Phone Use Is Associated with Poor Academic Performance in Adolescents. Cyberpsychol. Behav. Soc. Netw. 2020, 23, 303–311. [Google Scholar] [CrossRef]
  51. Ahmad, N.; Hoda, N.; Alahmari, F. Developing a Cloud-Based Mobile Learning Adoption Model to Promote Sustainable Education. Sustainability 2020, 12, 3126. [Google Scholar] [CrossRef] [Green Version]
  52. Juan Carrion-Martinez, J.; Luque-de la Rosa, A.; Fernandez-Cerero, J.; Montenegro-Rueda, M. Information and Communications Technologies (ICT) in Education for Sustainable Development: A Bibliographic Review. Sustainability 2020, 12, 3288. [Google Scholar] [CrossRef] [Green Version]
  53. Faisal, P.; Kisman, Z. Information and communication technology utilization effectiveness in distance education systems. Int. J. Eng. Bus. Manag. 2020, 12. [Google Scholar] [CrossRef] [Green Version]
  54. Sanchez, S.; Belmonte, J.; Guerrero, A.J.; Nunez, J.A. Impact of Educational Stage in the Application of Flipped Learning: A Contrasting Analysis with Traditional Teaching. Sustainability 2019, 11, 5968. [Google Scholar] [CrossRef] [Green Version]
  55. Lopez Belmonte, J.; Fuentes Cabrera, A.; Lopez Nunez, J.A.; Pozo Sanchez, S. Formative Transcendence of Flipped Learning in Mathematics Students of Secondary Education. Mathematics 2019, 7, 1226. [Google Scholar] [CrossRef] [Green Version]
  56. Cisneros-Cohernour, E.J.; Jorquera Jaramillo, M.C.; Aguilar Pereyra, Á.M. Validación de instrumentos de evaluación docente en el contexto de una universidad española. Voces Y Silencios. Rev. Latinoam. De Educ. 2012, 3, 41–55. [Google Scholar] [CrossRef]
  57. Rosenbluth, A.; Cruzat-Mandich, C.; Ugarte, M.L. Methodology to Validate a Competencies Assessment Tool for Psychology Students. Univ. Psychol. 2016, 15, 303–314. [Google Scholar]
  58. Royant-Parola, S.; Londe, V.; Trehout, S.; Hartley, S. The use of social media modifies teenagers’ sleep-related behavior. Enceph. Rev. De Psychiatr. Clin. Biol. Et Ther. 2018, 44, 321–328. [Google Scholar] [CrossRef]
  59. Aharony, N.; Zion, A. Effects of WhatsApp’s Use on Working Memory Performance Among Youth. J. Educ. Comput. Res. 2019, 57, 226–245. [Google Scholar] [CrossRef]
  60. Felisoni, D.D.; Godoi, A.S. Cell phone usage and academic performance: An experiment. Comput. Educ. 2018, 117, 175–187. [Google Scholar] [CrossRef]
  61. Attard, C.; Holmes, K. An exploration of teacher and student perceptions of blended learning in four secondary mathematics classrooms. Math. Educ. Res. J. 2020. [Google Scholar] [CrossRef]
Figure 2. Discriminant linear model (LDA) for variable RTC: (a) canonical scores; (b) structure.
Sustainability 13 01630 g002
Table 1. Relationships among dimensions, indicators, and items.
DimensionIndicatorCodeItems
A. General students’ dataA.1 Students’ dataNSTWhat mark did you get in the second trimester?
ECCAre you a boy or a girl?
NECEducational level
A.4 Other dataNEFWhat do you think about your family’s economic level?
D. ICT uses and resourcesD.1 TIC ResourcesCOCHow many computers are there in your house?
CPCHow many laptops are there in your house?
D.4 Daily ICT consumptionLJBFrom Monday to Thursday, how many hours do you dedicate each day to searching for material on the Internet for the sole purpose of studying or doing class work?
D.6 Students’ HabitsLJDFrom Monday to Thursday, what time do you usually disconnect all the devices and go to sleep?
VSDOn Fridays, Saturdays, and Sundays, what time do you usually disconnect from all the devices and go to sleep?
D.7 Parents ICT ConsumptionPOTAt home, does your father use the computer for work tasks daily?
MOTAt home, does your mother use the computer for work tasks daily?
E. ICT and mathematics learningE.1 At HomeRTCDo you use the technological resources that you have at home to study mathematics?
E.3 PerceptionTTMDo you think you work on mathematics more and better using ICT?
TMNDo you think ICT makes you improve your marks in mathematics?
E.4 TasksATCDoes your teacher propose homework, exercises, tasks or projects to do by using ICT in the classroom?
Note: Likert-scale for study variables: NST (1, fail; 2, adequate; 3, good; 4, merit; and 5, outstanding); NEC (1, 1° Secondary; 2, 2° Secondary; 3, 3° Secondary; 4, 4° Secondary; 5, 1° High School; and 6, 2° High School); NEF (1, very low; 2, low; 3, high; and 4, very high); COC (1, none; 2, 1 or 2; 3, 3 or 4; and 4 more than 4), LJB, (1, none; 2, from 1 to 2 h; 3, from 3 to 4 h; and 4, more than 4 h), LJD and VSD (1, before 22:00 h; 2, from 22:00 to 00:00 h; 3, from 00:00 to 02:00 h; 4, up to 02:00 h). For all other items: 1, none; 2, a little; 3, enough; and 4, a lot.
Table 2. Naïve Bayes classifier. A priori probabilities of second trimester marks (RTC) and conditional probabilities/RTC.
RTC Do you use technological resources that you have at home to study mathematics? (a priori probabilities)
NoYes
0.36194210.6380579
Conditional Probability/RTC
ECC Are you a boy or a girl?
BoyGirl
No0.48509490.5149051
Yes0.45734050.5426595
TTM Do you think you work on mathematics more and better with ICT?
NoneA LittleEnoughA LotGraphs
No0.34146340.29674800.25203250.1097561 Sustainability 13 01630 i001
Yes0.11375860.31129900.39892390.1760184 Sustainability 13 01630 i002
TMN Do you think ICT make you improve your marks in mathematics?
NoneA LittleEnoughA LotGraphs
No0.384823850.299457990.216802170.09891599 Sustainability 13 01630 i003
Yes0.132206000.304381250.362029210.20138355 Sustainability 13 01630 i004
COC How many computers are there in your house?
None1–23–4>4Graphs
No0.453929540.456639570.063685640.02574526 Sustainability 13 01630 i005
Yes0.360491930.526518060.074558030.03843198 Sustainability 13 01630 i006
CPC How many laptops are there in your house?
None1–23–4>4Graphs
No0.247967480.620596210.105691060.02574526 Sustainability 13 01630 i007
Yes0.177555730.634127590.146810150.04150653 Sustainability 13 01630 i008
LJB From Monday to Thursday, how many hours do you dedicate each day to searching for material on the Internet for the sole purpose of studying or doing class work?
None1–2 h3–4 h>4 hGraphs
No0.647696480.223577240.082655830.04607046 Sustainability 13 01630 i009
Yes0.299769410.415065330.191391240.09377402 Sustainability 13 01630 i010
LJD From Monday to Thursday, what time do you usually disconnect all the devices and go to sleep?
None1–2 h3–4 h>4 hGraphs
No0.31300810.40243900.21409210.0704607 Sustainability 13 01630 i011
Yes0.30207530.41275940.21906230.0661030 Sustainability 13 01630 i012
VSD Fridays, Saturdays, and Sundays, what time do you usually disconnect all the devices and go to sleep?
22:00 h22:00–00:00 h00:00–02:00 h>02:00 hGraphs
No0.092140920.199186990.356368560.35230352 Sustainability 13 01630 i013
Yes0.076863950.229823210.370484240.32282859 Sustainability 13 01630 i014
POT At home, does your father daily use the computer for work tasks?
NoneA LittleEnoughA LotGraphs
No0.48238480.24796750.13685640.1327913 Sustainability 13 01630 i015
Yes0.35741740.27747890.19677170.1683321 Sustainability 13 01630 i016
MOT At home, does your mother daily use the computer for work tasks?
NoneA LittleEnoughA LotGraphs
No0.638211380.193766940.092140920.07588076 Sustainability 13 01630 i017
Yes0.538816300.235203690.126056880.09992314 Sustainability 13 01630 i018
ATC Does your teacher propose homework, exercises, tasks, or projects to do by using ICT in the classroom?
NoneA LittleEnoughA LotGraphs
No0.584010840.230352300.094850950.09078591 Sustainability 13 01630 i019
Yes0.443505000.272867030.166026130.11760184 Sustainability 13 01630 i020
NEF What do you think about your family’s economic level?
Very lowLowHighVery highGraphs
No0.036585370.314363140.584010840.06504065 Sustainability 13 01630 i021
Yes0.024596460.261337430.631821680.08224443 Sustainability 13 01630 i022
NST Second trimester marks
FailAdequateGoodMeritOutstandingGraphs
No0.30216800.19376690.14769650.22899730.1273713 Sustainability 13 01630 i023
Yes0.25518830.21445040.19215990.22521140.1129900 Sustainability 13 01630 i024
1st Secondary School2nd Secondary School3rd Secondary School4th Secondary School1st High School2nd High SchoolGraphs
No0.254742550.294037940.166666670.170731710.085365850.02845528 Sustainability 13 01630 i025
Yes0.179861640.200614910.211375860.226748650.132206000.04919293 Sustainability 13 01630 i026
Table 3. Multiple linear regression model.
What Variables Had a Strong Impact on RTC?
EstimateStd. ErrorT ValuePr (>|t|) EstimateStd. ErrorT ValuePr (>|t|)
Intercept1.0367960.07000614.810<2 × 10⁻¹⁶ ***MOT10.0324300.0260561.2450.21343
TMN10.1065270.0378692.8130.00496 **MOT20.0245590.0331760.7400.45923
TMN20.1857630.0405094.5864.81 × 10−6 ***MOT30.0474960.0372681.2740.20265
TMN30.2547500.0481385.2921.34 × 10−16 ***TTM10.1120420.0388922.8810.00401 **
COC10.0216080.0215741.0020.31666TTM20.1186770.0414712.8620.00426 **
COC2−0.0284380.041709−0.6820.49544TTM30.0555210.0503041.1040.26985
COC3−0.0317860.064764−0.4910.62363ATC10.0489260.0236382.0700.03860 *
CPC10.0288900.0258051.1200.26304ATC20.0837630.0296612.8240.00479 **
CPC20.0220450.0371500.5930.55297ATC30.0635250.0333441.9050.05690
CPC30.0473480.0645970.7330.46366ECC10.0309180.0192971.6020.10927
LJB10.2496370.02268411.005<2 × 10⁻¹⁶ ***NEC10.0126820.0294470.4310.66677
LJB20.2674140.0294249.088<2 × 10⁻¹⁶ ***NEC20.1635440.0312005.2421.76 × 10−7 ***
LJB30.2687820.0391856.8599.19 × 10−12 ***NEC30.1623170.0313155.1832.40 × 10−7 ***
LJD1−0.0088810.027876−0.3190.75008NEC40.1756840.0372854.7122.62 × 10−7 ***
LJD20.0021420.0356990.0600.95216NEC50.1641200.0527753.1100.00190 **
LJD3−0.0027170.049103−0.0550.95587NST10.0449690.0280781.6020.10940
VSD1−0.0271030.040198−0.6740.50024NST20.0636100.0297072.1410.03237 *
VSD2−0.0452150.042100−1.0740.28295NST30.0273540.0276400.9900.32246
VSD3−0.0559600.045026−1.2430.21407NST40.0359370.0341461.0520.29271
POT10.0220890.0261650.8440.39865NEF10.0239570.0597370.4010.68844
POT20.0722190.0304942.3680.01797 *NEF20.0448620.0592940.7570.44938
POT30.0269500.0323660.8330.40513NEF30.0909870.0679161.3400.18049
Significance codes: ***, 0; **, 0.001; *, 0.01; 0.05; 0.1‘ ’1; Residual standard error: 0.4287 on 1995 degrees of freedom; multiple R2: 0.2213. Adjusted R2: 0.2045. F-statistic: 13.18 on 43 and 1995 DF, p-value < 2.2 × 10⁻¹⁶.
Table 4. Wilks’ lambda criterion.
VarsWilks LambdaF Statistics Overallp-Value OverallF. Statistics Diffp Value Diff
1 TMN0.9176173182.879715.727415 × 10−40182.8797125.72741 × 10−40
2 LJB0.8626270162.116144.654175 × 10−66129.7899420.000000 × 1000
3 NEC0.8414408127.823617.397385 × 10−7651.2381401.13731 × 10−12
4 ATC0.837487598.673267.758576 × 10−779.6013761.970897 × 10−3
5 NEF0.834846980.435413.398091 × 10−776.4303001.129325 × 10−2
Publisher’s Note: MDPI stays neutral with regard to jurisdictional claims in published maps and institutional affiliations.

