
Rapid Quantum Magnetic IL-6 Point-of-Care Assay in Patients Hospitalized with COVID-19

 ,
,
Abstract
:1. Introduction
2. Materials and Methods
2.1. Patients
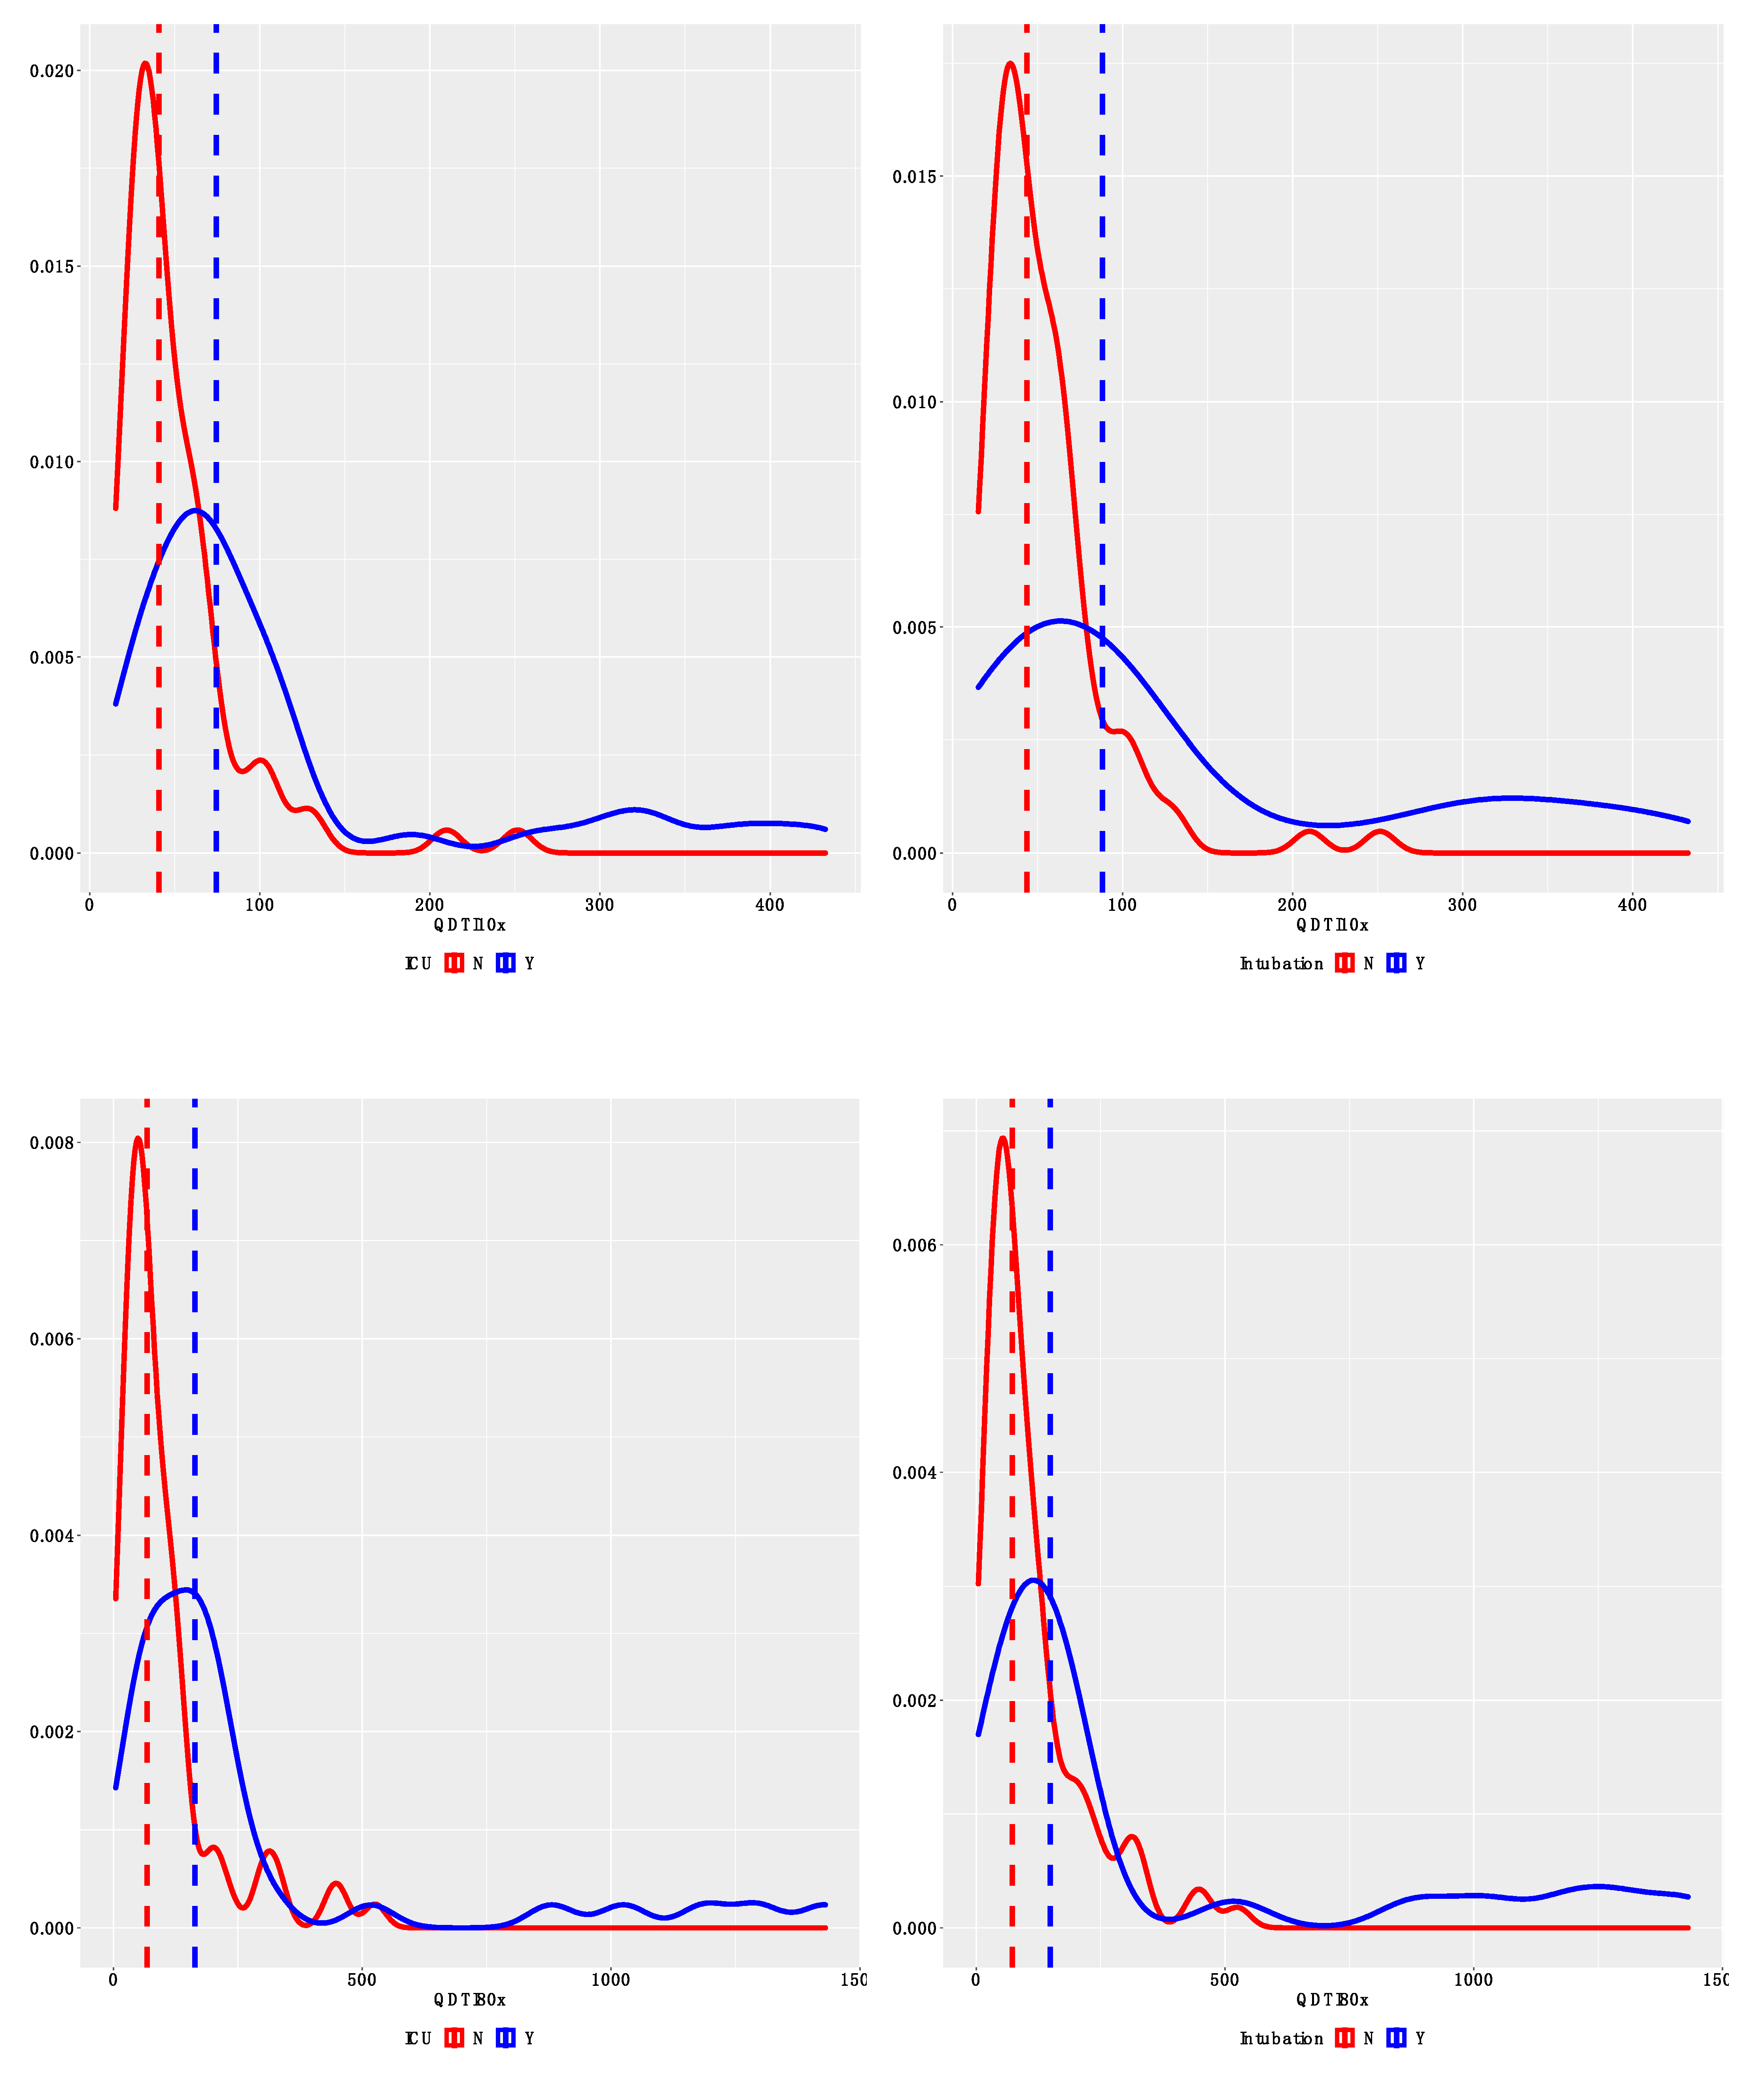
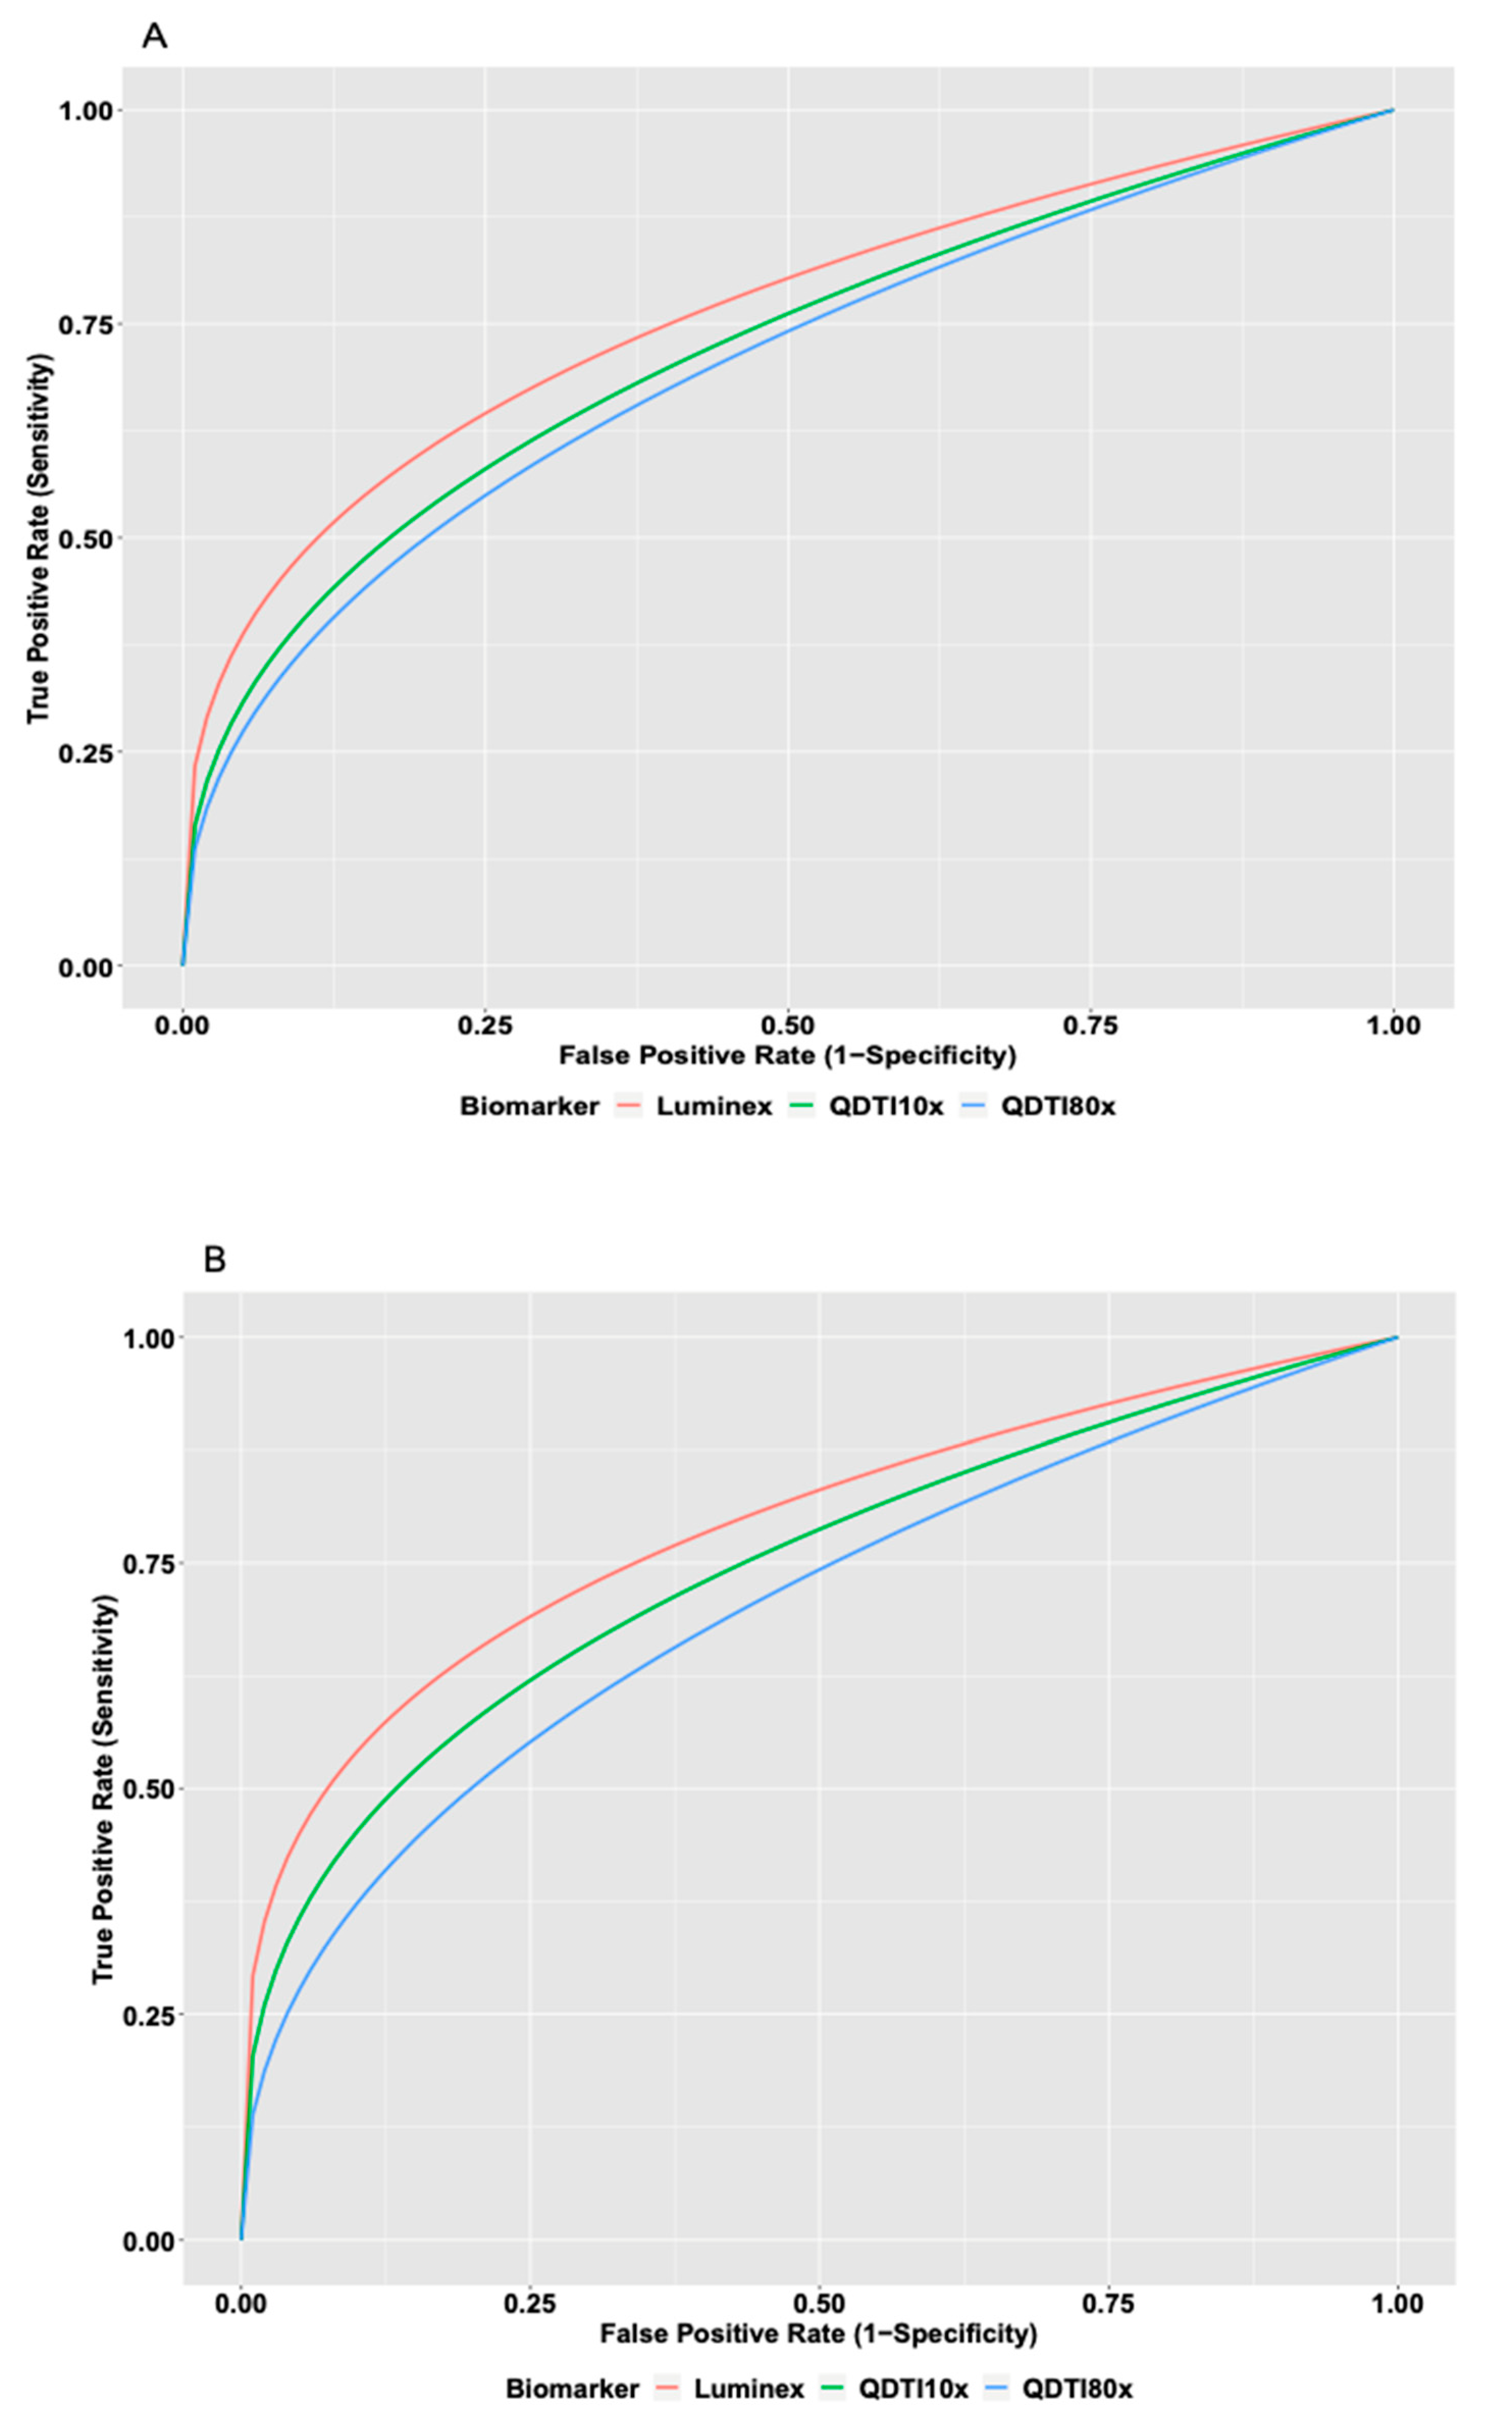
2.2. Outcomes
2.3. Statistical Analysis
2.4. Magnetic Imaging Assay
2.5. QDTI Assay Protocol
2.6. QDTI IL-6 Assay Specifications:
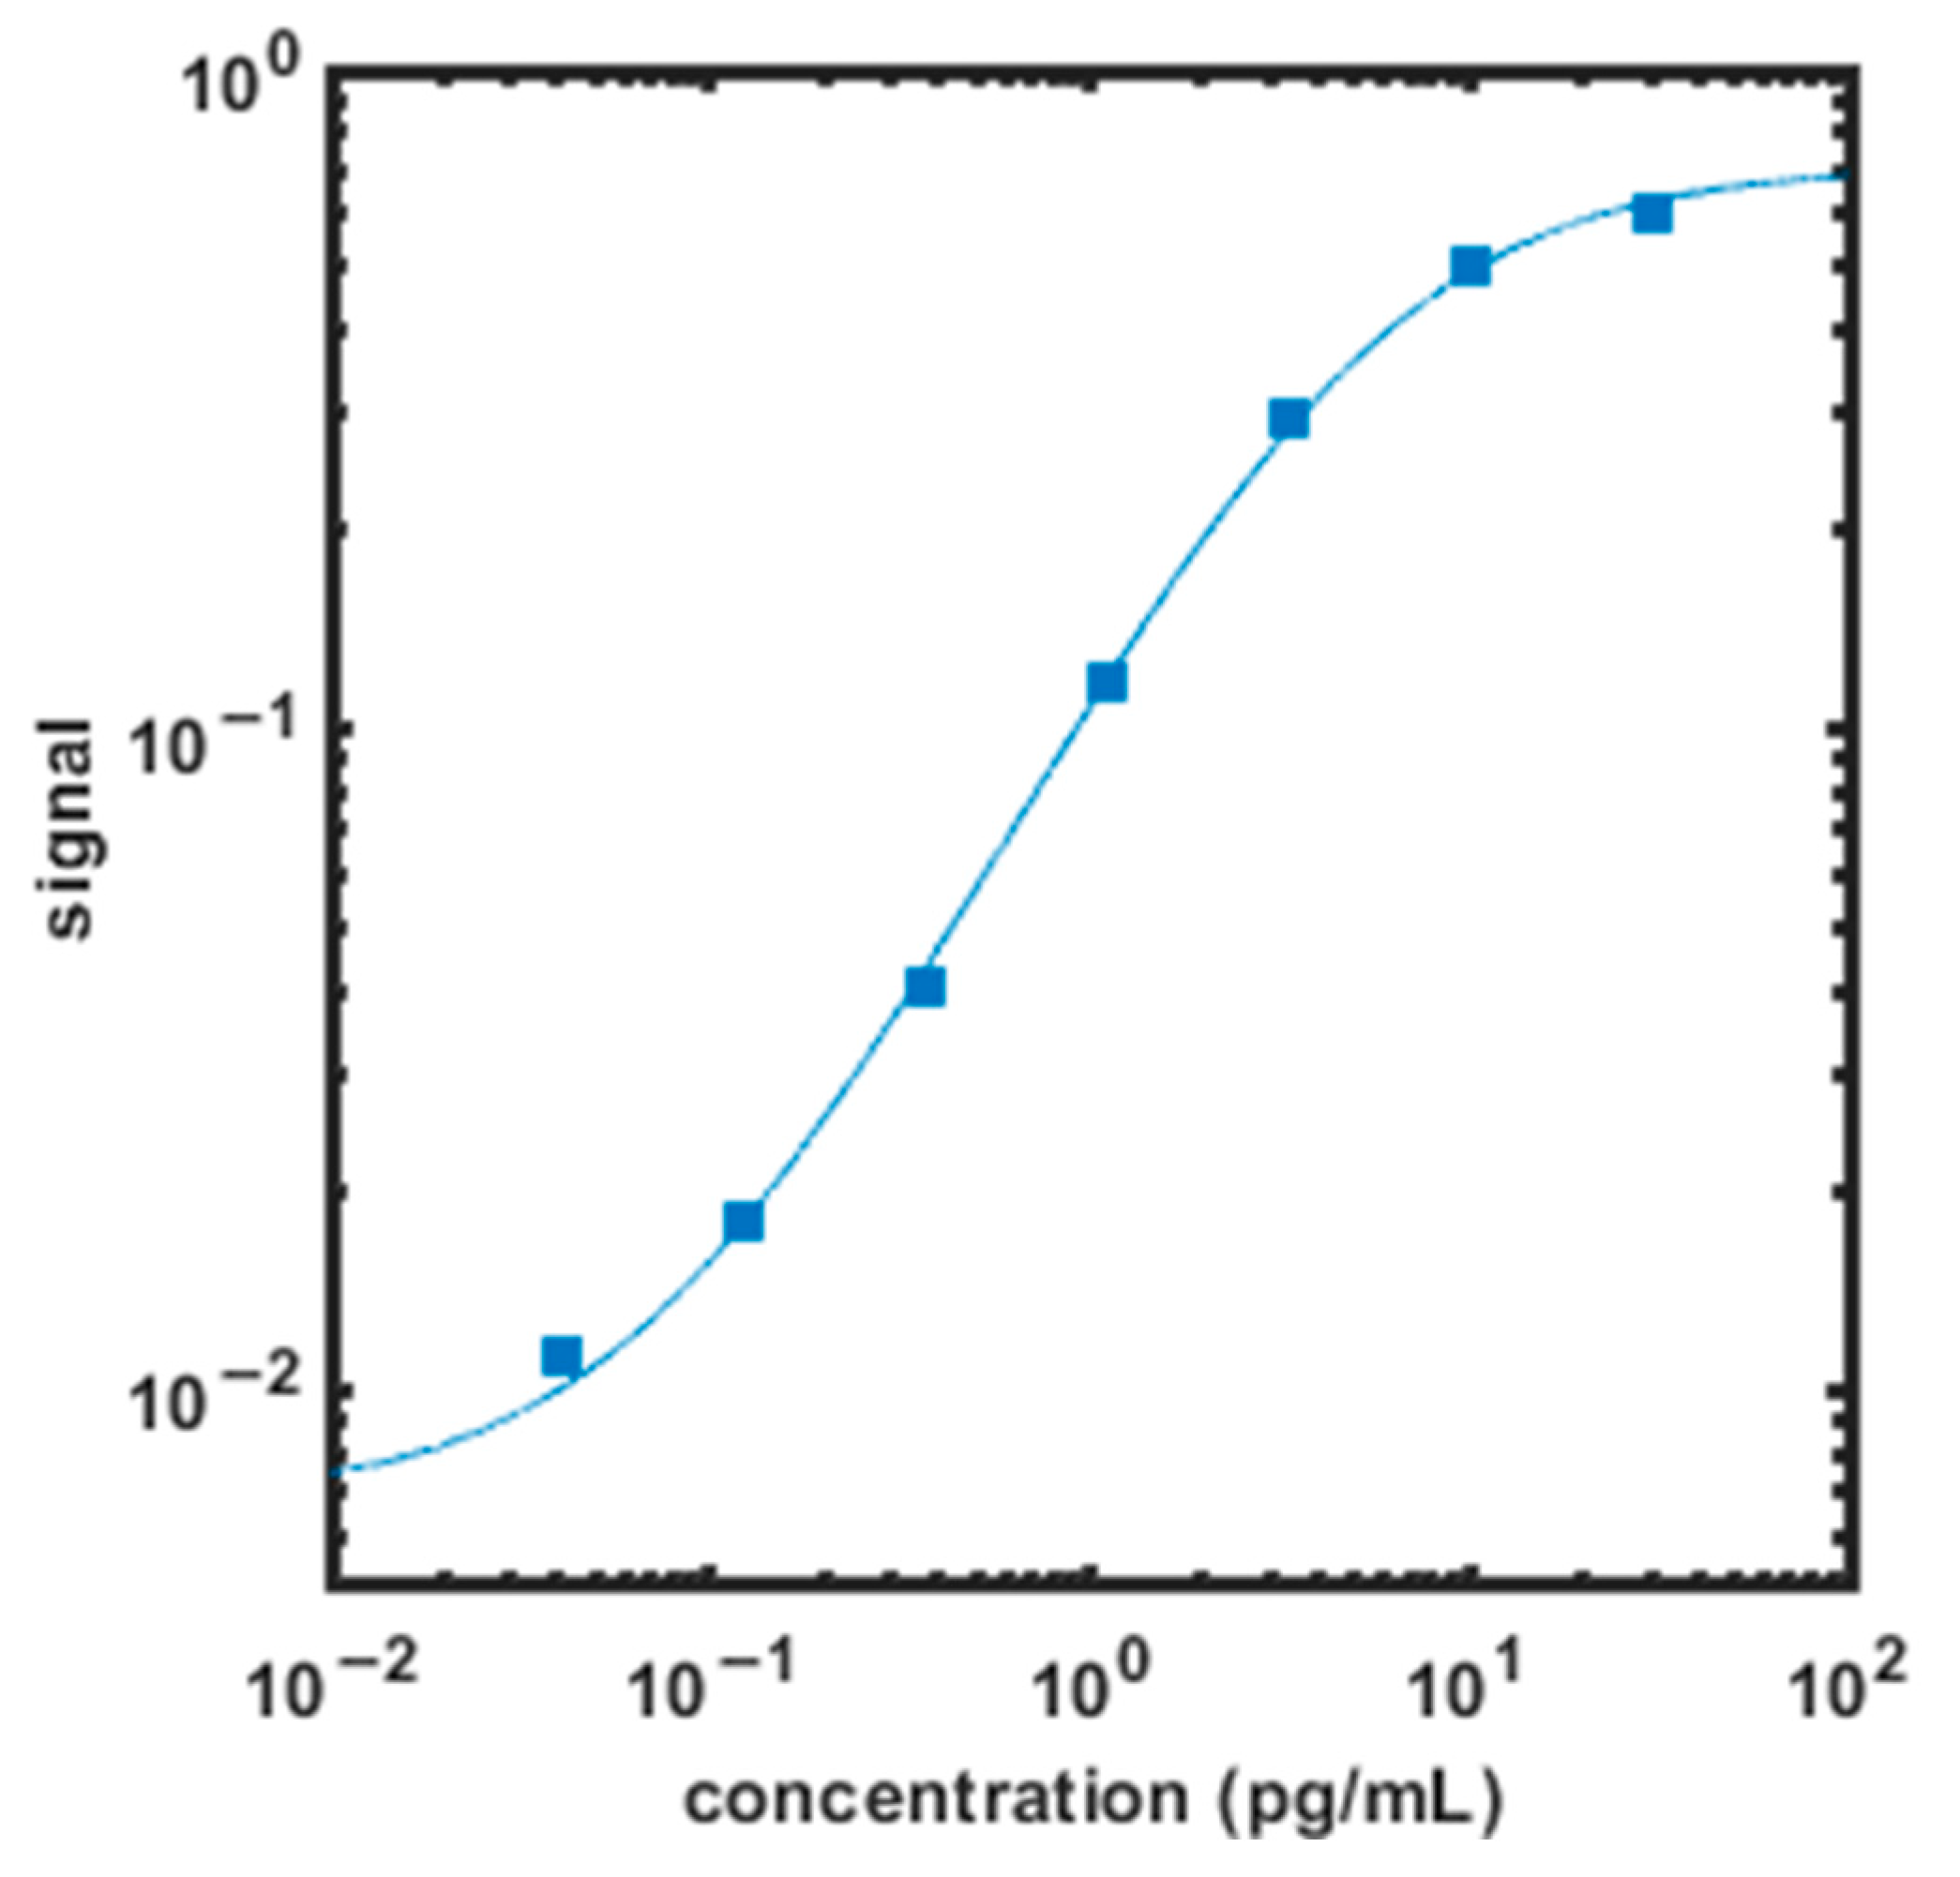
2.6.1. Assay Sensitivity
2.6.2. Recovery and Linearity
2.6.3. Luminex
3. Results
3.1. Patients
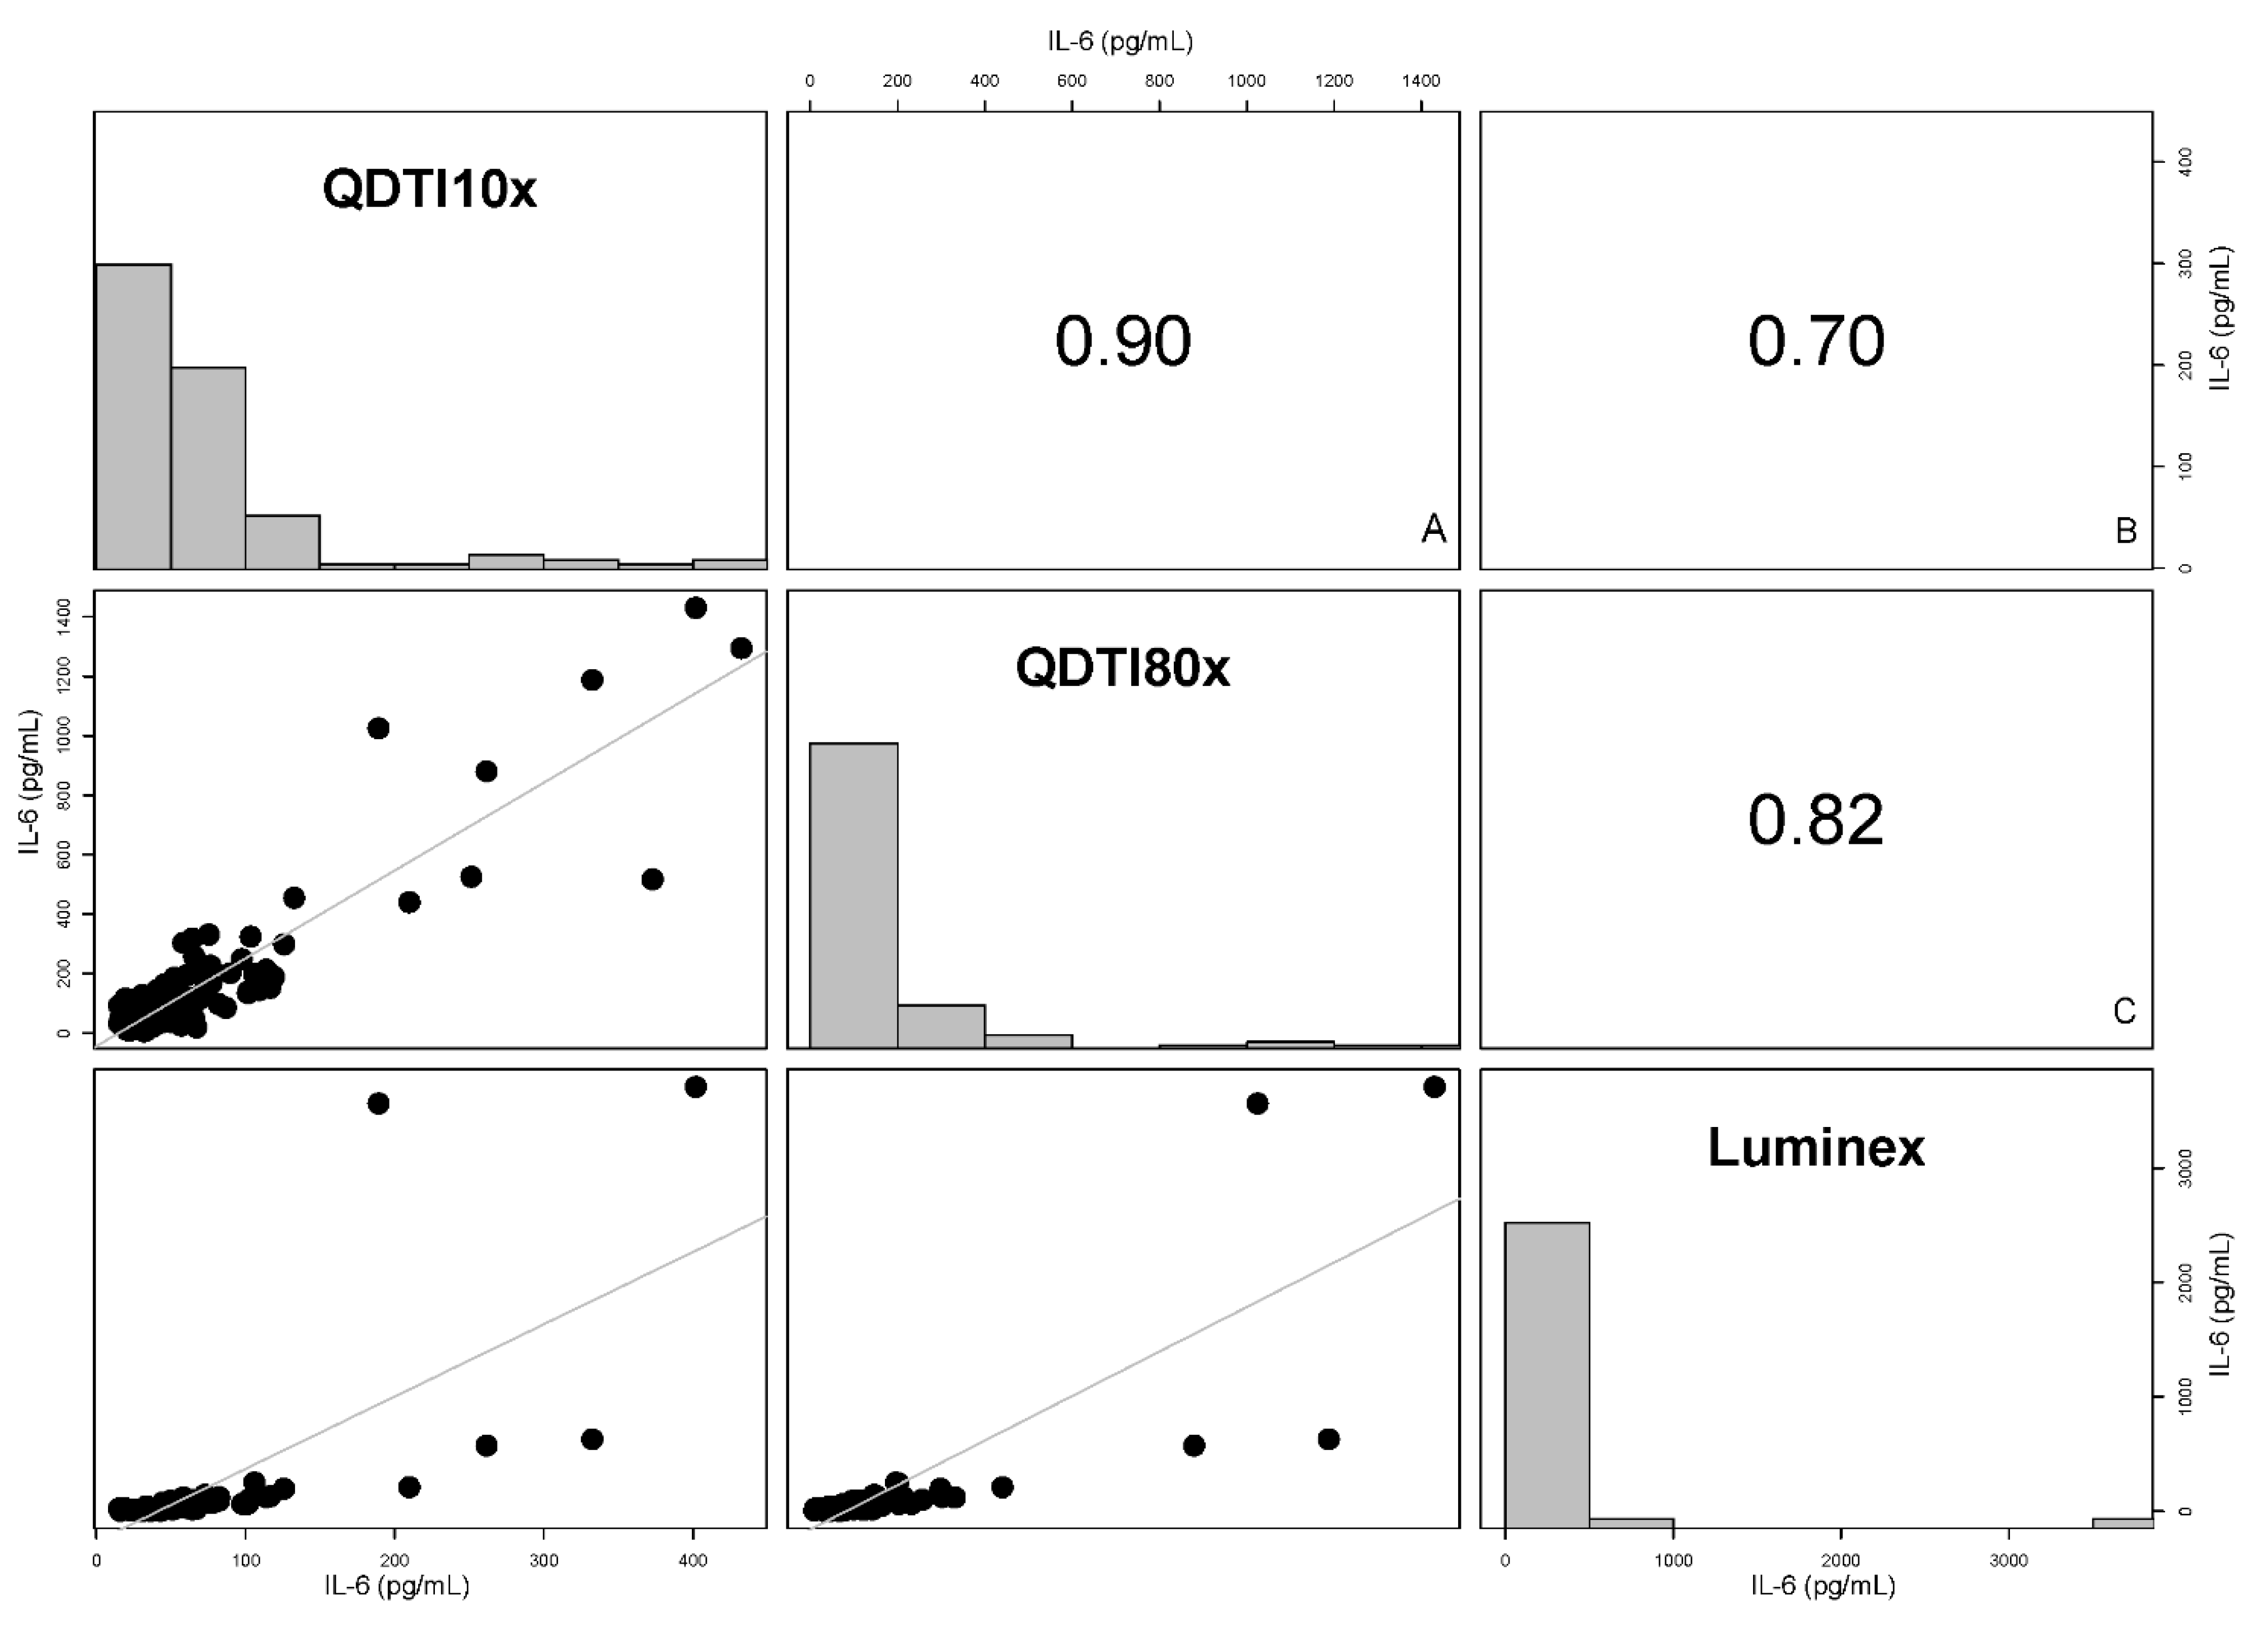
3.2. Comparison between QDTI Assay and Luminex Assay IL-6 Results
4. Discussion
5. Limitations
6. Conclusions
Supplementary Materials
Author Contributions
Funding
Institutional Review Board Statement
Informed Consent Statement
Data Availability Statement
Conflicts of Interest
Abbreviations
| ACS | Acute coronary syndrome |
| CAR-T cell therapy | Chimeric antigen receptor-T cell therapy |
| CRP | C-reactive protein |
| ED | Emergency department |
| ESR | Erythrocyte sedimentation rate |
| ICU | Intensive care unit |
| IL-6 | Interleukin-6 |
| IQR | Interquartile range |
| LLOD | Lower limit of detection |
| LLOQ | Lower limit of quantification |
| NEWS | National early warning score |
| NV | Nitrogen vacancy |
| ROC | Receiving operating characteristic curve |
| WBC | White blood cells |
References
- Dinnes, J.; Deeks, J.J.; Berhane, S.; Taylor, M.; Adriano, A.; Davenport, C.; Dittrich, S.; Emperador, D.; Takwoingi, Y.; Cunningham, J.; et al. Rapid, point-of-care antigen and molecular-based tests for diagnosis of SARS-CoV-2 infection. Cochrane Database Syst. Rev. 2021, 2021, CD013705. [Google Scholar] [CrossRef]
- Rawling, D.; Nie, W.; Remmel, M.; Eshoo, M.; Romanowsky, J.; Liesenfeld, O.; Sweeney, T. 2021. An Ultra-Rapid Host Response Assay to Discriminate Between Bacterial and Viral Infections Using Quantitative Isothermal Gene Expression Analysis. Open Forum Infect. Dis. 2018, 5 (Suppl. 1), S589. [Google Scholar] [CrossRef]
- McAlister, F.A.; Laupacis, A.; Armstrong, P.W. Finding the right balance between precision medicine and personalized care. Can. Med. Assoc. J. 2017, 189, E1065–E1068. [Google Scholar] [CrossRef] [PubMed] [Green Version]
- Atallah, J.; Mansour, M.K. Implications of Using Host Response-Based Molecular Diagnostics on the Management of Bacterial and Viral Infections: A Review. Front. Med. 2022, 9, 805107. [Google Scholar] [CrossRef]
- Pliakos, E.E.; Andreatos, N.; Shehadeh, F.; Ziakas, P.D.; Mylonakis, E. The Cost-Effectiveness of Rapid Diagnostic Testing for the Diagnosis of Bloodstream Infections with or without Antimicrobial Stewardship. Clin. Microbiol. Rev. 2018, 31, e00095-17. [Google Scholar] [CrossRef] [Green Version]
- Eubank, T.A.; Long, S.W.; Perez, K.K. Role of Rapid Diagnostics in Diagnosis and Management of Patients with Sepsis. J. Infect. Dis. 2020, 222 (Suppl. 2), S103–S109. [Google Scholar] [CrossRef]
- Slikker, W. Biomarkers and their impact on precision medicine. Exp. Biol. Med. 2018, 243, 211–212. [Google Scholar] [CrossRef]
- Byrnes, S.A.; Weigl, B.H. Selecting analytical biomarkers for diagnostic applications: A first principles approach. Expert Rev. Mol. Diagn. 2017, 18, 19–26. [Google Scholar] [CrossRef]
- Mayeux, R. Biomarkers: Potential uses and limitations. NeuroRx 2004, 1, 182–188. [Google Scholar] [CrossRef]
- Tanaka, T.; Narazaki, M.; Kishimoto, T. IL-6 in Inflammation, Immunity, and Disease. Cold Spring Harb. Perspect. Biol. 2014, 6, a016295. [Google Scholar] [CrossRef]
- Santomasso, B.; Bachier, C.; Westin, J.; Rezvani, K.; Shpall, E.J. The Other Side of CAR T-Cell Therapy: Cytokine Release Syndrome, Neurologic Toxicity, and Financial Burden. Am. Soc. Clin. Oncol. Educ. Book 2019, 39, 433–444. [Google Scholar] [CrossRef] [PubMed]
- Koster, M.J.; Warrington, K.J. Giant cell arteritis: Pathogenic mechanisms and new potential therapeutic targets. BMC Rheumatol. 2017, 1, 2. [Google Scholar] [CrossRef] [PubMed] [Green Version]
- Sabaka, P.; Koščálová, A.; Straka, I.; Hodosy, J.; Lipták, R.; Kmotorková, B.; Kachlíková, M.; Kušnírová, A. Role of interleukin 6 as a predictive factor for a severe course of COVID-19: Retrospective data analysis of patients from a Long-term Care Facility during COVID-19 Outbreak. BMC Infect. Dis. 2020, 21, 1–8. [Google Scholar] [CrossRef] [PubMed]
- Nguyen, N.; Ukoha, C.; Ikram, F.; Patetl, C.; Nguyen, H.; Hoang, L.; Acharya, P.; Dhillon, A.; Sidhu, M. Elevated interleukin-6 levels in COVID-19-infected patients are associated with major adverse cardiac events and/or mortality. J. Am. Coll. Cardiol. 2021, 77, 3143. [Google Scholar] [CrossRef]
- Cruz, A.S.; Mendes-Frias, A.; Oliveira, A.I.; Dias, L.; Matos, A.R.; Carvalho, A.; Capela, C.; Pedrosa, J.; Gil Castro, A.; Silvestre, R. Interleukin-6 Is a Biomarker for the Development of Fatal Severe Acute Respiratory Syndrome Coronavirus 2 Pneumonia. Front. Immunol. 2021, 12, 613422. [Google Scholar] [CrossRef]
- Zhang, P.; Shi, L.; Xu, J.; Wang, Y.; Yang, H. Elevated interleukin-6 and adverse outcomes in COVID-19 patients: A meta-analysis based on adjusted effect estimates. Immunogenetics 2020, 72, 431–437. [Google Scholar] [CrossRef]
- Liu, X.; Wang, H.; Shi, S.; Xiao, J. Association between IL-6 and severe disease and mortality in COVID-19 disease: A systematic review and meta-analysis. Postgrad. Med. J. 2021. [Google Scholar] [CrossRef]
- Vatansever, H.S.; Becer, E. Relationship between IL-6 and COVID-19: To be considered during treatment. Future Virol. 2020, 15, 817–822. [Google Scholar] [CrossRef]
- Rosas, I.O.; Bräu, N.; Waters, M.; Go, R.C.; Hunter, B.D.; Bhagani, S.; Skiest, D.; Aziz, M.S.; Cooper, N.; Douglas, I.S.; et al. Tocilizumab in Hospitalized Patients with Severe COVID-19 Pneumonia. N. Engl. J. Med. 2021, 384, 1503–1516. [Google Scholar] [CrossRef]
- Roumier, M.; Paule, R.; Groh, M.; Vallée, A.; Ackermann, F. Interleukin-6 blockade for severe COVID-19. medRxiv 2020. [Google Scholar] [CrossRef]
- Guillén, L.; Padilla, S.; Fernández, M.; Agulló, V.; García, J.A.; Telenti, G.; García-Abellán, J.; Botella, A.; Gutiérrez, F.; Masiá, M. Preemptive interleukin-6 blockade in patients with COVID-19. Sci. Rep. 2020, 10, 16826. [Google Scholar] [CrossRef] [PubMed]
- Gordon, A.C.; Mouncey, P.R.; Al-Beidh, F.; Rowan, K.M.; Nichol, A.D.; Arabi, Y.M.; Annane, D.; Beane, A.; Van Bentum-Puijk, W.; Berry, L.R.; et al. Interleukin-6 Receptor Antagonists in Critically Ill Patients with COVID-19. N. Engl. J. Med. 2021, 384, 1491–1502. [Google Scholar] [CrossRef] [PubMed]
- Hermine, O.; Mariette, X.; Tharaux, P.L.; Resche-Rigon, M.; Porcher, R.; Ravaud, P.; Bureau, S.; Dougados, M.; Tibi, A. Effect of Tocilizumab vs Usual Care in Adults Hospitalized With COVID-19 and Moderate or Severe Pneumonia: A Randomized Clinical Trial. JAMA Intern. Med. 2021, 181, 32–40. [Google Scholar] [CrossRef] [PubMed]
- Stone, J.H.; Frigault, M.J.; Serling-Boyd, N.J.; Fernandes, A.D.; Harvey, L.; Foulkes, A.S.; Horick, N.K.; Healy, B.C.; Shah, R.; Bensaci, A.M.; et al. Efficacy of Tocilizumab in Patients Hospitalized with COVID-19. N. Engl. J. Med. 2020, 383, 2333–2344. [Google Scholar] [CrossRef]
- Al barzin, R.M.G.T.; Raheem, S.G.; Khudhur, P.K.; Abdulkarimi, R.; Mohammadnejad, E.; Tabatabaee, A. Interleukin-6 role in the severity of COVID-19 and intensive care unit stay length. Cell. Mol. Biol. 2020, 66, 15–18. [Google Scholar] [CrossRef]
- Ghebremichael, M.; Michael, H.; Tubbs, J.; Paintsil, E. Comparing the Diagnostics Accuracy of CD4+ T-Lymphocyte Count and Percent as a Surrogate Markers of Pediatric HIV Disease. J. Math. Stat. 2019, 15, 55–64. [Google Scholar] [CrossRef] [Green Version]
- Glenn, D.R.; Lee, K.; Park, H.; Wetissleder, R.; Yacoby, A.; Lukin, M.D.; Lee, H.; Walsworth, R.L.; Connolly, C.B. Single cell magnetic imaging using a quantum diamond microscope. Nat. Methods 2015, 12, 736–738. [Google Scholar] [CrossRef]
- Levine, E.V.; Turner, M.J.; Kehayias, P.; Hart, C.A.; Langellier, N.; Trubko, R.; Glenn, D.R.; Fu, R.R.; Walsworth, R.L. Principles and techniques of the quantum diamond microscope. Nanophotonics 2019, 8, 1945–1973. [Google Scholar] [CrossRef]
- Doherty, M.W.; Manson, N.B.; Delaney, P.; Jelezko, F.; Wrachtrup, J.; Hollenberg, L.C.L. The nitrogen-vacancy colour centre in diamond. Phys. Rep. 2013, 528, 1–45. [Google Scholar] [CrossRef] [Green Version]
- Colombo, C.J.; Colombo, R.E.; Maves, R.C.; Branche, A.R.; Cohen, S.H.; Elie, M.-C.; George, S.L.; Jang, H.J.; Kalil, A.C.; Lindholm, D.A.; et al. Performance Analysis of the National Early Warning Score and Modified Early Warning Score in the Adaptive COVID-19 Treatment Trial Cohort. Crit. Care Explor. 2021, 3, e0474. [Google Scholar] [CrossRef]
- Gong, Y.; Liang, S.; Zeng, L.; Ni, Y.; Zhou, S.; Yuan, X. Effects of blood sample handling procedures on measurable interleukin 6 in plasma and serum. J. Clin. Lab. Anal. 2019, 33, e22924. [Google Scholar] [CrossRef] [PubMed]
- Fischer, S.K.; Williams, K.; Wang, L.; Capio, E.; Briman, M. Development of an IL-6 point-of-care assay: Utility for real-time monitoring and management of cytokine release syndrome and sepsis. Bioanalysis 2019, 11, 1777–1785. [Google Scholar] [CrossRef] [PubMed]
- Ohsfeldt, R.L.; Choong, C.K.C.; Collam, P.L.M.; Abedtash, H.; Kelton, K.A.; Burge, R. Inpatient Hospital Costs for COVID-19 Patients in the United States. Adv. Ther. 2021, 38, 5557–5595. [Google Scholar] [CrossRef] [PubMed]
- Engel, N.; Krumeich, A. Valuing Simplicity: Developing a Good Point of Care Diagnostic. Front. Sociol. 2020, 5, 37. [Google Scholar] [CrossRef]
- Lee, H. Procalcitonin as a biomarker of infectious diseases. Korean J. Intern. Med. 2013, 28, 285–291. [Google Scholar] [CrossRef]
- Waterfield, T.; Maney, J.A.; Hanna, M.; Fairley, D.; Shields, M.D. Point-of-care testing for procalcitonin in identifying bacterial infections in young infants: A diagnostic accuracy study. BMC Pediatr. 2018, 18, 387. [Google Scholar] [CrossRef] [Green Version]
- Qihong, G.; Zhixin, W.; Mingfeng, H.; Lianhong, Y.; Wenchong, X. Experiences and the use of BNP POCT platform on suspected stroke patients by a Chinese emergency department. Ann. Indian Acad. Neurol. 2014, 17, 243–244. [Google Scholar] [CrossRef]
- Cohen, R.; Lata, J.P.; Lee, Y.; Hernández, J.C.C.; Nishimura, N.; Schaffer, C.B.; Mukai, C.; Nelson, J.L.; Brangman, S.A.; Agrawal, Y.; et al. Use of Tethered Enzymes as a Platform Technology for Rapid Analyte Detection. PLoS ONE 2015, 10, e0142326. [Google Scholar] [CrossRef]
- Fernandes, E.; Sobrino, T.; Martins, V.C.; Lopez-Loureiro, I.; Campos, F.; Germano, J.; Rodríguez-Pérez, M.; Cardoso, S.; Petrovykh, D.Y.; Castillo, J.; et al. Point-of-care quantification of serum cellular fibronectin levels for stratification of ischemic stroke patients. Nanomed. Nanotechnol. Biol. Med. 2020, 30, 102287. [Google Scholar] [CrossRef]
- Harpaz, D.; Eltzov, E.; Seet, R.C.S.; Marks, R.S.; Tok, A.I.Y. Point-of-Care-Testing in Acute Stroke Management: An Unmet Need Ripe for Technological Harvest. Biosensors 2017, 7, 30. [Google Scholar] [CrossRef] [Green Version]
- Shahrestani, S.; Wishart, D.; Han, S.M.J.; Strickland, B.A.; Bakhsheshian, J.; Mack, W.J.; Toga, A.W.; Sanossian, N.; Tai, Y.-C.; Zada, G. A systematic review of next-generation point-of-care stroke diagnostic technologies. Neurosurg. Focus 2021, 51, E11. [Google Scholar] [CrossRef] [PubMed]
- Bolliger, D.; Tanaka, K.A. Point-of-Care Coagulation Testing in Cardiac Surgery. Semin. Thromb. Hemost. 2017, 43, 386–396. [Google Scholar] [CrossRef] [PubMed]
- Heidt, B.; Siqueira, W.F.; Eersels, K.; Diliën, H.; Van Grinsven, B.; Fujiwara, R.; Cleij, T. Point of Care Diagnostics in Resource-Limited Settings: A Review of the Present and Future of PoC in Its Most Needed Environment. Biosensors 2020, 10, 133. [Google Scholar] [CrossRef] [PubMed]
- Drain, P.K.; Hyle, E.P.; Noubary, F.; Freedberg, K.A.; Wilson, D.; Bishai, W.R.; Rodriguez, W.; Bassett, V. Diagnostic point-of-care tests in resource-limited settings. Lancet Infect. Dis. 2014, 14, 239–249. [Google Scholar] [CrossRef] [Green Version]
- Kozel, T.R.; Burnham-Marusich, A.R. Point-of-Care Testing for Infectious Diseases: Past, Present, and Future. J. Clin. Microbiol. 2017, 55, 2313–2320. [Google Scholar] [CrossRef] [PubMed] [Green Version]
- Husabø, G.; Nilsen, R.M.; Flaatten, H.; Solligård, E.; Frich, J.C.; Bondevik, G.T.; Braut, G.S.; Walshe, K.; Harthug, S.; Hovlid, E. Correction: Early diagnosis of sepsis in emergency departments, time to treatment, and association with mortality: An observational study. PLoS ONE 2021, 16, e0248879. [Google Scholar] [CrossRef]
- Prince, K.; Omar, F.; Joolay, Y. A Comparison of Point of Care C-Reactive Protein Test to Standard C-Reactive Protein Laboratory Measurement in a Neonatal Intensive Care Unit Setting. J. Trop. Pediatr. 2019, 65, 498–504. [Google Scholar] [CrossRef] [PubMed]
- Goldstein, L.N.; Wells, M.; Vincent-Lambert, C. The cost-effectiveness of upfront point-of-care testing in the emergency department: A secondary analysis of a randomised, controlled trial. Scand. J. Trauma. Resusc. Emerg. Med. 2019, 27, 110. [Google Scholar] [CrossRef] [Green Version]


| Characteristic | Patients (N = 35) |
|---|---|
| Age in years (Median, IQR) | 58 (45–69) |
| Age > 65—no. (%) | 10 (28.6) |
| Sex—no. (%) Male Female | 19 (54) 16 (46) |
| * Ethnic group—no. (‡%) Hispanic Non-Hispanic | 16 (46) 19 (54) |
| BMI (Median, IQR) | 30.2 (25.9–33.8) |
| † BMI > 30—no. (%) | 18 (51) |
| Diabetes—no. (%) | 14 (40) |
| History of lung disease (COPD, Asthma)—no. (%) | 4 (11) |
| NEWS scale score—no. (%) 1–4 5–6 >7 | 5 (14) 2 (6) 28 (80) |
| Oxygen requirement at day 1—no. (%) No oxygen required Nasal Cannula 2–6 L/min Nasal Cannula > 6 L/min High Flow Nasal Cannula or non-invasive ventilation Intubation | 7 (20) 24 (68) 2 (6) 1 (3) 1 (3) |
| Median Laboratory Values (IQR) Erythrocyte sedimentation rate—mm/hr. D-Dimer Level—ng/mL Ferritin level—ng/mL WBC count—×109/L | 68 (43–87) 670 (399–1739) 686 (378–1346) 5.6 (4.14–7.6) |
| Human IL-6 Assay | Concentration |
|---|---|
| LLOD | 0.06 pg/mL |
| LLOQ | 0.12 pg/mL |
| Sample Volume | 5 uLs |
| Dilution | Median | Interquartile Range | |
|---|---|---|---|
| Spike Recovery (N = 4) | 10× | 96% | 92–99% |
| Dilutional Linearity (N = 16) | 5–10× | 107% | 99–119% |
| Luminex | QDTI 10× Dilution | QDTI 80× Dilution | ||||
|---|---|---|---|---|---|---|
| Sample Number | Median (pg/mL) | Interquartile Range (IQR) | Median (pg/mL) | Interquartile Range (IQR) | Median (pg/mL) | Interquartile Range (IQR) |
| 106 | 136.25 | 13.50 | 103.05 | 36.61 | 151.82 | |
| 212 | 249.40 | 5.10 | 105.96 | 196.84 | ||
| 252 | 3634.97 | 146.30 | 346.96 | 132.29 | 1025.27 | |
| 350 | 123 | 1.12 | 89.89 | 26.55 | 230.39 | |
| 355 | 45.10 | 49.075 | 10.46 | 163.83 | ||
| 433 | 10.20 | 0.42 | 25.19 | 31.34 | 6.98 | |
| 443 | 73.40 | 3.12 | 58.63 | 15.02 | 122.49 | |
| 601 | 27 | 0.80 | 61.15 | 76.98 | 29.67 | |
| 608 | 10 | 0.19 | 24.67 | 3.52 | 77 | |
| 628 | 111 | 1.91 | 81.97 | 32.26 | 133.91 | |
| 679 | 602 | 55.48 | 314.94 | 102.91 | 1187.66 | |
| 737 | 98 | 4.87 | 65.65 | 241.68 | 86.05 | |
| Luminex | QDTI 10× Dilution | QDTI 80× Dilution | ||||
|---|---|---|---|---|---|---|
| Sample Number | Median (pg/mL) | Interquartile Range (IQR) | Median (pg/mL) | Interquartile Range (IQR) | Median (pg/mL) | Interquartile Range (IQR) |
| 106 | 136.25 | 13.50 | 103.05 | 36.61 | 151.82 | |
| 212 | 249.40 | 5.10 | 105.96 | 196.84 | ||
| 252 | 3634.97 | 146.30 | 346.96 | 132.29 | 1025.27 | |
| 433 | 10.20 | 0.42 | 25.19 | 31.34 | 6.98 | |
| 443 | 73.4. | 3.12 | 58.63 | 15.02 | 122.49 | |
| 608 | 10 | 0.19 | 24.67 | 3.52 | 77.0 | |
| 628 | 111 | 1.91 | 81.97 | 32.36 | 133.91 | |
| 679 | 602 | 55.48 | 314.94 | 102.91 | 1187.66 | |
Publisher’s Note: MDPI stays neutral with regard to jurisdictional claims in published maps and institutional affiliations. |
© 2022 by the authors. Licensee MDPI, Basel, Switzerland. This article is an open access article distributed under the terms and conditions of the Creative Commons Attribution (CC BY) license (https://creativecommons.org/licenses/by/4.0/).
Share and Cite
Atallah, J.; Archambault, D.; Randall, J.D.; Shepro, A.; Styskal, L.E.; Glenn, D.R.; Connolly, C.B.; Katsis, K.; Gallagher, K.; Ghebremichael, M.; et al. Rapid Quantum Magnetic IL-6 Point-of-Care Assay in Patients Hospitalized with COVID-19. Diagnostics 2022, 12, 1164. https://doi.org/10.3390/diagnostics12051164
Atallah J, Archambault D, Randall JD, Shepro A, Styskal LE, Glenn DR, Connolly CB, Katsis K, Gallagher K, Ghebremichael M, et al. Rapid Quantum Magnetic IL-6 Point-of-Care Assay in Patients Hospitalized with COVID-19. Diagnostics. 2022; 12(5):1164. https://doi.org/10.3390/diagnostics12051164
Chicago/Turabian StyleAtallah, Johnny, Dakota Archambault, Jeffrey D. Randall, Adam Shepro, Lauren E. Styskal, David R. Glenn, Colin B. Connolly, Katelin Katsis, Kathleen Gallagher, Musie Ghebremichael, and et al. 2022. "Rapid Quantum Magnetic IL-6 Point-of-Care Assay in Patients Hospitalized with COVID-19" Diagnostics 12, no. 5: 1164. https://doi.org/10.3390/diagnostics12051164