Simulating COVID-19 Trajectory in the UAE and the Impact of Possible Intervention Scenarios
Simulating COVID-19 Trajectory in the UAE and the Impact of Possible Intervention Scenarios
Volume 6, Issue 1, Page No 791-797, 2021
Author’s Name: Abdulla M. Alsharhana)
View Affiliations
Faculty of Engineering and IT, The British University in Dubai, Dubai, 345015, United Arab Emirates
a)Author to whom correspondence should be addressed. E-mail: Alsharhan@outlook.com
Adv. Sci. Technol. Eng. Syst. J. 6(1), 791-797 (2021); ![]() DOI: 10.25046/aj060188
DOI: 10.25046/aj060188
Keywords: Agent-Based Model, COVID-19 Simulation, UAE, United Arab Emirates, Agent-based simulation
Export Citations
This paper aims to simulate the current trajectory of the pandemic growth in the UAE; when it is likely to end and at what cost? It also examines the current and additional possible measures to contain the second wave of the pandemic. The method used is a simple Susceptible-Infected-Recovered (SIR) model called covid19_scenarios. The key finding suggests current intervention is 35 – 45% and effective, and based on keeping them, the pandemic curve in the UAE is expected to be flattened around the fourth quarter of 2022 with the maximum saved lives and lowest burden on the healthcare system. In contrast, it can end earlier at the end of the second quarter of 2021 but at a much higher fatality rate and a health system ready with 3,600 intensive care units. It also revealed that country closure has a minor impact, and severe and fatal cases will continue to appear even after vaccinating the whole community.
Received: 11 December 2020, Accepted: 27 January 2021, Published Online: 05 February 2021
1. Introduction
On 16th January, a Chinese family arrived from Wuhan in the United Arab Emirates (UAE) to spend their holiday. One week later, the family headed to a local clinic after feeling unwell. Four family members, including the grandmother, mother, father, and a nine-year-old girl, were confirmed to have the virus [1]. The next day, on 30th January 2020, [2] confirmed COVID-19 outbreak as a Public Health Emergency of International Concern, and on 11th March declared COVID-19 as a pandemic.
In response, the UAE announced its National Disinfection Programme, whereby public facilities and transportation were disinfected daily from 26th March – 24th June 2020. After the quarantine, the UAE carried on specific interventions related to COVID-19, including preventing public gatherings and family visits, keeping physical distance, wearing masks and gloves, and not exceeding the limit of three passengers per vehicle for non-family members.
Policy-makers in the UAE made some noticeable primary efforts to contain the pandemic. Significant interventions included implementing distance learning and remote work, suspending prayer in all worship places, postponing sports events, closing shopping malls, maintaining distance at entertainment venues, and suspending visas, flights, and even the entry of GCC citizens [3]. On 24th June 2020, the National Emergency Crisis and Disaster Management Authority announced the end of the National Disinfection Programme with immediate effect.
These efforts paid off when the rate of daily confirmed cases started declining, reaching the lowest recorded number of daily cases on 3rd August 2020. However, after some rules of social distancing were relaxed, the daily numbers started rising again, indicating a second wave of the pandemic. By 25th November, the National Emergency Crisis and Disaster Management Authority reported that 161,000 cases had been diagnosed in the UAE. While 93% have recovered, there are still 10,000 active cases and 500+ deaths.
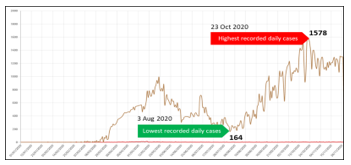 Figure 1: Intervention impact on daily cases in the UAE (NCEMA 2020)
2. Literature Review
After carefully searching the major databases, two papers were located that discuss simulating COVID-19 in the UAE. The search databases included WorldCat, Google Scholar, and CrossRef. The search keywords included terms such as “COVID-19” AND (“simulation” OR “simulating”) AND (“UAE” OR “United Arab Emirates”).
In [4], the authors tried to estimate the number of required beds for both acute and critical cases in the UAE in addition to the possible infection of healthcare personnel. The simulation also predicted the peak time and the total infections before and after non-pharmaceutical interventions.
Assuming the UAE population is 9,631,000. The simulation revealed that UAE would reach the highest at t = 56 at April 2020, where on the 26th of May, it will reach its peak at a 1.67 per cent infection rate of the total population, an equivalent to 165,360 infections. After that, it will decrease dramatically. The infection should disappear on the 100th day, around the 9th of July. However, although the actual figures from NCEMA match the peak prediction of the first wave, it did not match the total infection at that time, which appears to be around 30,000 confirmed cases only, which could suggest the effectiveness of the measures used by the policy-makers during that period.
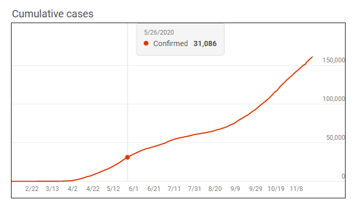 Figure 2: Actual cumulative cases in the UAE as of the 26th of May, 2020 ( Microsoft Bing.com)
This study also predicted that the maximum number of required beds would be 63,138 at t=66, which is equivalent to that of the 6th of June, 2020. While it is difficult to validate this assumption; the study did not mention how many of them are needed to be for intensive care unit (ICU) beds. The simulation also concluded the UAE transmission rate and the basic reproduction number on the period between the 21st of April to the 15th of May, 2020 to be R0 = 1.7768.
In [5], the authors simulated the dynamics of COVID-19 in the UAE based on fractional derivative modelling using Riesz wavelets. The parameters used in this study were calculated based on official published data of COVID-19 in the UAE, while the dynamic of the virus transmission was considered from other sources due to the fact that the dynamic of the virus transmission from a country to another does not change much. The total UAE population used in this study was 9.666 million, which is close to the previous study. The study did not mention a clear transmission rate or the basic reproduction number, but the transmissibility multiple used is ψp at (0.1).
However, as the UAE is preparing to get back to normal, little is known on how the new relaxed interventions will impact the spread of the pandemic. This study objective is to support the policy-makers by analysing the impact of going back to normal by the beginning of 2021. In order to simulate the desired outcomes, the following hypothesis will be tested:
- The UAE is ready to go back to normal at the beginning of 2021.
- The UAE can go back to normal, and the current healthcare system can handle all the cases.
- Suspending entry to the UAE is necessary to contain and end the pandemic.
- Extending the current intervention should be the new normal, as it is essential to decreasing severe, deadly cases.
- Vertical Isolation (isolating young and senior citizens) is similar to the “doing nothing” scenario.
- The vaccine will end the pandemic, and we can go back to normal life.
- We still need to keep the current interventions, even if the community is vaccinated.
3. Methods
A simple Susceptible-Infected-Recovered (SIR) model was used to simulate the COVID-19 outbreaks in the UAE. The model is called “covid19_scenarios”.
This model was selected because of its unique ability to blend real and simulated data. It is also already loaded with each country default parameters, including the UAE. It is simple to use and provide a web-based user-friendly interface that allows real-time data adjustment, which reflects the output immediately on the model. Besides, it has different categories for individuals exposed to the virus that are not yet infectious. In addition, severely sick individuals in need of hospitalisation, people in critical condition, and a fatal category. The tool that was utilised was a computational biology tool developed by [6]. The source code of this tool is freely available at github.com/neherlab/covid19_scenarios and the web-based version is also available at https://covid19-scenarios.org.
3.1. Basic Assumptions
- Individuals are infected by contact with infectious persons. Each individual causes, on average, R0 secondary infections while they are infectious.
- Infection rates could change based on seasonal variations.
- Individuals who are infected go into a state after a latency period. This development occurs in three different stages, which will ensure that the distribution of time spent in the exposed compartment matches real-life scenarios.
- Positive individuals either recover or progress to a severe case. The ratio of progressing to recovery to severe case depends on age.
- Severe positive cases are hospitalised in the Intensive Care Unit (ICU) (if beds are available), placed in an overflow compartment, or receive palliative care. At the same time, younger age groups are given priority access to the ICU.
- Individuals in the ICU either recover and are transferred to standard hospital rooms or die. Fatality rate depends on the age group and ICU admission availability.
- Individuals in palliative care die, which could also represent death at home [6].
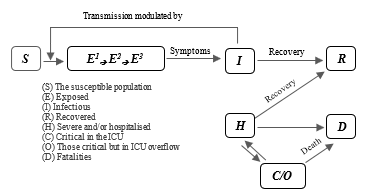 Figure 3: A schematic illustration of the underlying model
3.2. Parameters
The parameter values presented are based on the following assumptions:
Table 1: The UAE’s Epidemiology and Population Parameters
| Parameter | Value |
| Population 1 | 9,935,374 |
| Seroprevalence | 8% |
| Initial number of cases | 109,3962 |
| Hospital Beds (est.) 2 | 15,868 |
| ICU/ICMU (est.) 3 | 476 |
| Imports per day 4 | 22 |
| Simulation time range | 10th August 2020 – 31st December 2021 |
| Number of Runs | 15 |
| Annual average R0 | 0.89 – 1.16 |
| Latency (days) | 3 |
| Infection period (day) | 3 |
| Seasonal forcing | 1 |
| Seasonal Peak | January |
| Hospital stay (days) | 3 |
| Intensive Care Unit (ICU) stay | 14 |
| Severity of ICU overflow | 2 |
3.3. Basic assumptions about the UAE
- According to [7], the current population of the UAE as of Tuesday 17th November 2020 is 9,935,374.
- In reference to [8], the latest bed estimation goes back to 2013, since more recent numbers of beds are not provided. The total number of hospital beds in 2020 was estimated to be 15,868. Figure 2 shows the estimation is based on calculating the compound annual growth rate (CAGR) from 2013 (9,760 beds) to 2018 (13,811 beds), which is equivalent to 7.19%.
- Intensive care units (ICU) were estimated with a common standard of 3% of the total hospital beds [6]. Therefore, the estimated ICU numbers are (3% x 15,868 = 476).
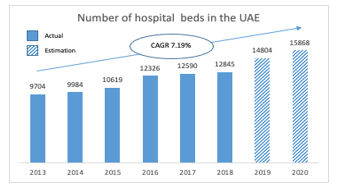 Figure 4: The total number of hospital beds in the UAE estimation
- The latest available data about arrivals are not provided. The total number of passengers who arrived in the UAE in 2020 was estimated to be 15,868. Figure 3 shows that assumption is based on calculating the Compound Annual Growth Rate (CAGR) from 2011 (34 million passengers) to 2016 (58 million passengers) [8], which is equivalent to 7.19%. Then the growth rate was used to calculate the growth trajectory for 2017, 2018, 2019, and 2020. Since last February 2020, 59 airline companies stopped or reduced flights, and many countries, including the United States, Russia, Australia, and Italy, have introduced travel restrictions [9]. It is difficult to determine how much traffic is impacted by these interventions; therefore, we assumed international travel restrictions produce a 90% overall traffic reduction in the UAE, which result in an equivalent to 8 million (90 x 10% = 8).
- The remaining data was based on the default setting of the model, which are based on the published epidemiological and clinical notesabout each country, including the UAE.
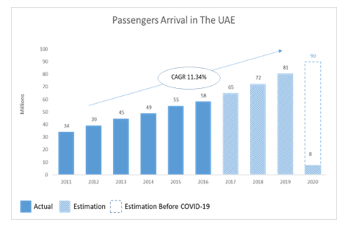 Figure 5: Estimated number of passenger arrivals in the UAE
3.4. Age-dependent parameters
Table 2 shows the UAE age-dependent parameters. The second column shows the number of individuals who falls under each age group category. The next columns summarise the COVID-19 intensity based on epidemiological and clinical notes from China, Spain, Switzerland, and Italy. The “Confirmed” column shows the assumption of what fraction of the previous category will impact the next [6]. Both “Confirmed” and “Isolated” columns are editable and can be adjusted to test different hypotheses.
Table 2: The UAE age-dependent parameters
| Age group | Age distribution | Confirmed % total | Severe % of confirmed | Palliative % of severe | Critical % of severe | Fatal % of critical | Fatal % of all infections | Isolated % total |
| 0–9 | 1011712 | 5 | 1 | 0 | 5 | 10 | 0 | 0 |
| 10–19 | 842993 | 5 | 3 | 0 | 10 | 10 | 0 | 0 |
| 20–29 | 2149345 | 10 | 3 | 0 | 10 | 10 | 0 | 0 |
| 30–39 | 3169316 | 15 | 3 | 0 | 15 | 10 | 0.01 | 0 |
| 40–49 | 1608106 | 20 | 6 | 0 | 20 | 10 | 0.02 | 0 |
| 50–59 | 797911 | 20 | 10 | 0 | 25 | 20 | 0.1 | 0 |
| 60–69 | 242705 | 25 | 25 | 5 | 30 | 30 | 0.88 | 0 |
| 70–79 | 55883 | 30 | 35 | 10 | 25 | 40 | 2.1 | 0 |
| 80+ | 12431 | 40 | 50 | 20 | 15 | 40 | 5.2 | 0 |
4. Results and analysis
This section shows the results for several scenarios. The simulations represent major possible interventions that could be made by the policy-makers in the UAE. In this study, the parameters are based on data from the UAE.
4.1. Scenario (A): Going back to normal at the beginning of 2021
This scenario simulates the behaviour without any additional intervention, as it will be used as a baseline for comparison with all the other scenarios. To generate this scenario, the current intervention is assumed to provide 35% – 45% protection (Table 5). As per Figure 5, the estimated annual visitors are expected to be 10% of the usual annual visitors. At least 8 million passengers are expected to arrive in the UAE annually. If we are assuming the current airport interventions are effective and are dedicating 99% of the cases, then the community will only import about 0.1% undedicated positive cases annually. This is equivalent to 8,000 positive cases per year, or 22 positive daily cases on average (Table 3).
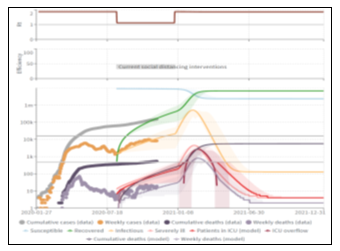 Figure 6: Scenario (A): Going back to normal at the beginning of 2021
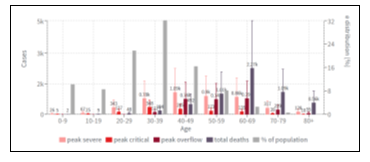 Figure 7: Scenario (A): Distribution across age groups
Table 3: The UAE population parameters, baseline
| Population parameter | Value |
| Age distribution for | UAE |
| Case counts for | UAE |
| Number of hospital beds | 15868 |
| Number of available ICU beds | 476 |
| Cases imported into the community per day | 22 |
| Number of cases at the start of the simulation | 3000 |
| Population size | 9935374 |
| Seroprevalence [%] | 8.5 |
Table 4: The UAE epidemiology parameters, baseline
| Epidemiology parameter | Value |
| Average time in regular ward [days] | 3 |
| Average time in ICU ward [days] | 14 |
| Infectious period [days] | 3 |
| Latency [days] | 3 |
| Increase in death rate when ICUs are overcrowded | 2 |
| Seasonal peak in transmissibility | January |
| R0 at the beginning of the outbreak | 1.8–2.2 |
| Seasonal variation in transmissibility | 0 |
Table 5: The UAE Mitigation parameters baseline
| Intervention name | From | To | Reduction of transmission |
| Current social distancing interventions | Aug 10 2020 | Dec 31 2020 | 35% – 45% |
With this scenario, a new peak should be expected during the second week of February 2021 resulting in the number of severe cases to reach 55.76k, with deaths totalling 5.68k. Moreover, 40% of the deaths are estimated to be among the 60 – 69 age group. The curve will then flatten during the second week of June after most of the community has immunity against the virus and weekly cases will continue to fluctuate between 127 – 142, and the total weekly deaths will be two. It is noticeable that there are four months of overflow in ICUs.
4.2. Scenario (B): Increasing the ICU up to no overflow is happening
In these scenarios (Figure 8), the number of ICUs is increased up to a level where there is no overflow. After several runs, the required ICU numbers are 3,800, eight times more than the current estimated available ICUs. This scenario shows that the total severe cases did not change than the baseline. However, the total death has decreased to 4.75k, which is 16% less than Scenario (1).
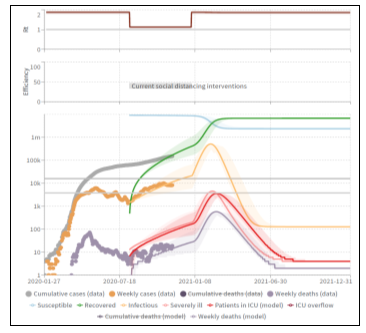 Figure 8: Scenario (B): Increasing the ICU units up to no overflow is happening
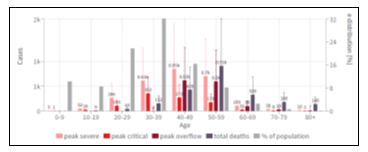 Figure 9: Distribution across age groups in scenario (C) shows decreased death rates in the 60 – 69 age group
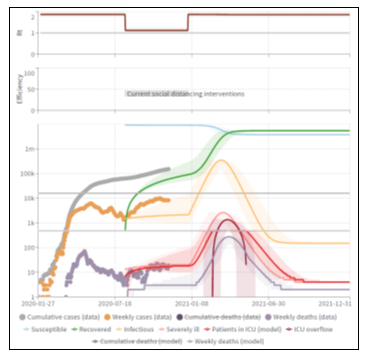 Figure 10: Scenario (C): Vertical Isolation shows that severe cases have decreased by 32%, and the death rates have decreased by 61%
4.3. Scenario (C): Vertical Isolation
In this scenario (Figure 10), some age groups were isolated to examine how this intervention will affect the model. The isolated age groups are 0 – 9 and 60 – 69. However, since full isolation will not be possible due to family and community contact, the isolation rate was kept at 90%. The result of this scenario shows the total severe cases decreased by 32% to 37.85k of the baseline, and the total death has decreased by 61% to 2.19k of the baseline. The following chart (Figure 9) shows how Scenario (C) decreased death rates in the 60 – 69 age group.
4.4. Scenario (D): Airport closure
In this scenario (Figure 11), the impact of new cases imported to the community was examined. Simulating this scenario, the number of imported daily cases was assumed to be zero. Scenario (D) shows that the impact of this intervention was only less than 1% on the outcome as total severe cases have decreased by 0.3% to 55.59k of the baseline. At the same time, the total death cases have decreased by 0.9% to 5.63k of the baseline. However, it shows the pandemic will end by the middle of 2021, probably after achieving herd immunity.
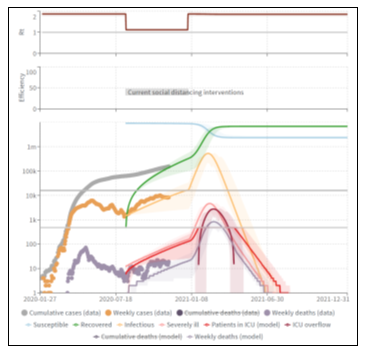 Figure 11: Scenario (D): Airport closure
4.5. Scenario (E): Extending the current intervention
This scenario examines extending the current intervention taken by the policy-makers and the community of the UAE. In order to simulate the impact of these interventions, several runs were conducted to create a similar growth trajectory for the actual weekly cases. It was found the actual weekly growth, starting from the second wave (10th August 2020), matches a 35% – 45% reduction, which means the current intervention is reducing transmission by 35% – 45%. In this scenario, the same rate was continued for as long as it took to flatten the curve. The result shows the peak will be reached by the second week of March 2021. However, it will take the curve much longer to flatten, which should decrease the pressure on the health care system, as there will be no ICU overflow, and therefore, no extra ICU units will be needed. The simulation assumes the curve can be flattened by the second week of October 2022, regarding severe cases and deaths. Scenario (E) shows that the number of severe cases has decreased dramatically, by 68.8%, to 17.4k of the baseline, and the total deaths have decreased, by 73.1%, to 1.53k of the baseline.
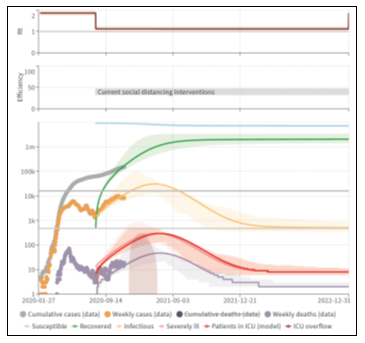 Figure 12: Scenario (E): Extending the Current Intervention
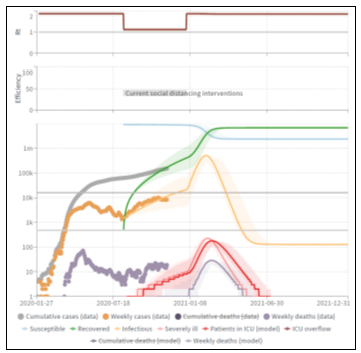 Figure 13: Scenario (F): Vaccinating the community
4.6. Scenario (F): Vaccinating the community
On 18th November 2020, [10] announced their COVID-19 vaccine to be 95% effective, beginning 28 days after the first dose. Many hope the vaccine will allow life to return to normal. The scenario (F) simulation (Figure 13) assumes the entire community has been vaccinated against COVID-19. Therefore, all interventions are lifted at the beginning of 2021. The effectiveness of the vaccine was determined to be at 95%, meaning only 5% of the community could still be infected. The scenario, in this case, predicts the infection rate will reach its peak in the second week of February 2021, and a total of 501,000 people will have tested positive. However, most of these cases will be mild. This scenario shows that the total severe cases have decreased by 95% to 2.79k. In comparison, the total death cases have decreased by 96% to 228.5 of the baseline. The curve will be flattened in the third week of August 2021 at an average of 127 confirmed cases per week.
4.7. Scenario (G): Vaccinating the community and keeping the current interventions
In this scenario, we assume the whole community are vaccinated and have 95% immunity against the COVID-19. Nevertheless, the current interventions are still applied for as long as it takes to flatten the curve. The curve needed to be modelled for over three years. The outcome shows a 98.5% reduction in critical and death cases, with 910 critical cases and 82.5 death cases. The simulations also show the curve could be flattened in the second week of June 2022 at an average of 52k confirmed cases per week and 0 fatality rates afterwards.
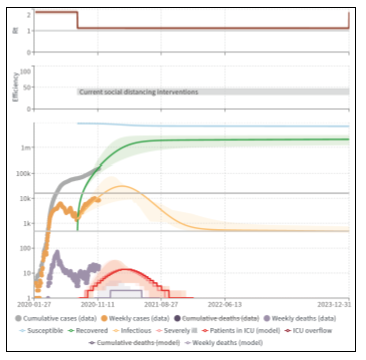 Figure 14: Scenario (G): Vaccinating the community and keeping the current interventions
5. Discussion
5.1. (A) The UAE is ready to go back to normal at the beginning of 2021.
The simulation shows it is still too early to go back to normal at the beginning of 2021. The going back to normal life scenario (A) shows that another wave is expected to rise, reaching a peak in 45 days with more than 5,000 deaths to be expected, part of which is caused by intensive care units’ capacity overflow.
5.2. (B) The UAE can go back to normal, and the current healthcare system can handle all the cases.
Scenario (B) examines how many ICU units are needed to prevent death by lack of ICU capacities. The simulation indicates there will be a need of 3,124 additional ICU units (total of 3,600). Furthermore, that will only decrease the fatality rate by 16%. However, the scenario (A) is likely to be the shortest scenario to flatten the curve (Q3 2021), but it comes with the highest fatality rate.
5.3. (C) Vertical Isolation (isolating young and senior citizens) is similar to the do-nothing scenario.
On the other hand, the vertical isolation scenario (C) seems to have a noticeable impact on the simulation outcome. It decreases death rates by 61%, and the severe cases by 31%. Therefore, it cannot be assumed it is similar to the do-nothing scenario.
5.4. (D) Suspending entry to the UAE is necessary to contain and end the pandemic.
One significant finding of these simulations is the minor impact of the airport closure scenario (D). As it turns out, it only has a less than 1% impact on the simulation outcomes, which indicate it is not an effective intervention and has an insignificant impact in the context of the UAE parameters.
5.5. (E) Extending the current intervention should be the new normal, as it is essential to decrease severe and death cases.
Keeping the current interventions scenario (E) is still highly effective, as it has decreased both severe and fatality rates by nearly 70%.
5.6. (F) The vaccine will end the pandemic, and we can go back to normal life.
The long-awaited vaccine for COVID-19. However, the outcome of this scenario shows around a 95% decrease in severe and death rates. However, the remaining 5% can result in an average of 2.79k severe cases and 127 deaths. A significant finding of scenario (F) suggests the importance of keeping some sort of intervention for some time, even after getting vaccinated.
5.7. (G) We still need to keep the current interventions, even if the community is vaccinated.
The final tested hypothesis in this study is vaccinating the community while keeping the current interventions (G). The outcome of this simulation shows little impact as it decreased severe and deadly cases by only an additional 3.5% (total of 98%).
As an alternative, a key takeaway of this study is that no matter what interventions are taken, at least 154 cases will still be expected on a weekly bases. This is even under the assumption that the airport intervention is 99.9% effective, airline movement is 10% of normal (Figure 3), and 100% of positive cases are isolated.
6. Conclusion
George Edward Pelham once said, “All models are wrong, but some are useful”. We hope this study will bring some useful insights to policy-makers in the community of the UAE.
Based on the current trajectory of the pandemic growth, the current intervention suggests its effectiveness is 35-45%. The pandemic daily cases curve is expected to be flattened around the fourth quarter of 2022. Moreover, relaxing intervention and going back to normal earlier than expected will cost the UAE health system to be ready with an average of 3,600 intensive care units. This assumption is not counting the different federal Emirates measures nor vaccine availability as there is still not enough data about when it will be made available.
It is highly encouraged to use the COVID-19 scenario model to simulate different parameters in different geographical locations. This simulation provides some key insights that can confirm some commonly known hypotheses and disapprove others.
Conflict of Interest
The authors declare no conflict of interest.
Acknowledgement
This study was made based on assumptions and accessible parameters. Furthermore, it can be improved if more accurate data and parameters are made available. This is a part of a project done at The British University in Dubai. This study could not be possible without the guidance of Professor Piyush Maheshwari and the valuable contributions from the team who developed the COVID-19 scenario, including Noll, N., Aksamentov, I., Druelle, V., Badenhorst, A., Ronzani, B., Jefferies, G., Albert, J. & Neher, R.
- G. Duncan, S. Gautam, “Coronavirus: UAE records first case – The National,” The National News, 2020.
- WHO, Archived: WHO Timeline – COVID-19, World Health Organization, 2020.
- U.AE, National Disinfection Programme – The Official Portal of the UAE Government, 2020.
- S. Bentout, A. Tridane, S. Djilali, T.M. Touaoula, “Age-Structured Modeling of COVID-19 Epidemic in the USA, UAE and Algeria,” Alexandria Engineering Journal, 2020, doi:10.1016/j.aej.2020.08.053.
- M. Mohammad, A. Trounev, C. Cattani, “The dynamics of COVID-19 in the UAE based on fractional derivative modeling using Riesz wavelets simulation,” Zayed University, 2020.
- N.B. Noll, I. Aksamentov, V. Druelle, A. Badenhorst, B. Ronzani, G. Jefferies, J. Albert, R.A. Neher, “COVID-19 Scenarios: An interactive tool to explore the spread and associated morbidity and mortality of SARS-CoV-2,” MedRxiv, 2020, doi:10.1101/2020.05.05.20091363.
- Worldometer, United Arab Emirates Population (2020) – Worldometer, 2020.
- FCSA, Statistics by Subject, Federal Competitiveness and Statistics Centre, 2020.
- M. Chinazzi, J.T. Davis, M. Ajelli, C. Gioannini, M. Litvinova, S. Merler, A. Pastore y Piontti, K. Mu, L. Rossi, K. Sun, C. Viboud, X. Xiong, H. Yu, M. Elizabeth Halloran, I.M. Longini, A. Vespignani, “The effect of travel restrictions on the spread of the 2019 novel coronavirus (COVID-19) outbreak,” Science, 368(6489), 395–400, 2020, doi:10.1126/science.aba9757.
- Pfizer, Pfizer and BioNTech Conclude Phase 3 Study of COVID-19 Vaccine Candidate, Meeting All Primary Efficacy Endpoints | Pfizer, 2020.

