
Mutations in the B.1.1.7 SARS-CoV-2 Spike Protein Reduce Receptor-Binding Affinity and Induce a Flexible Link to the Fusion Peptide

 , , , , , and
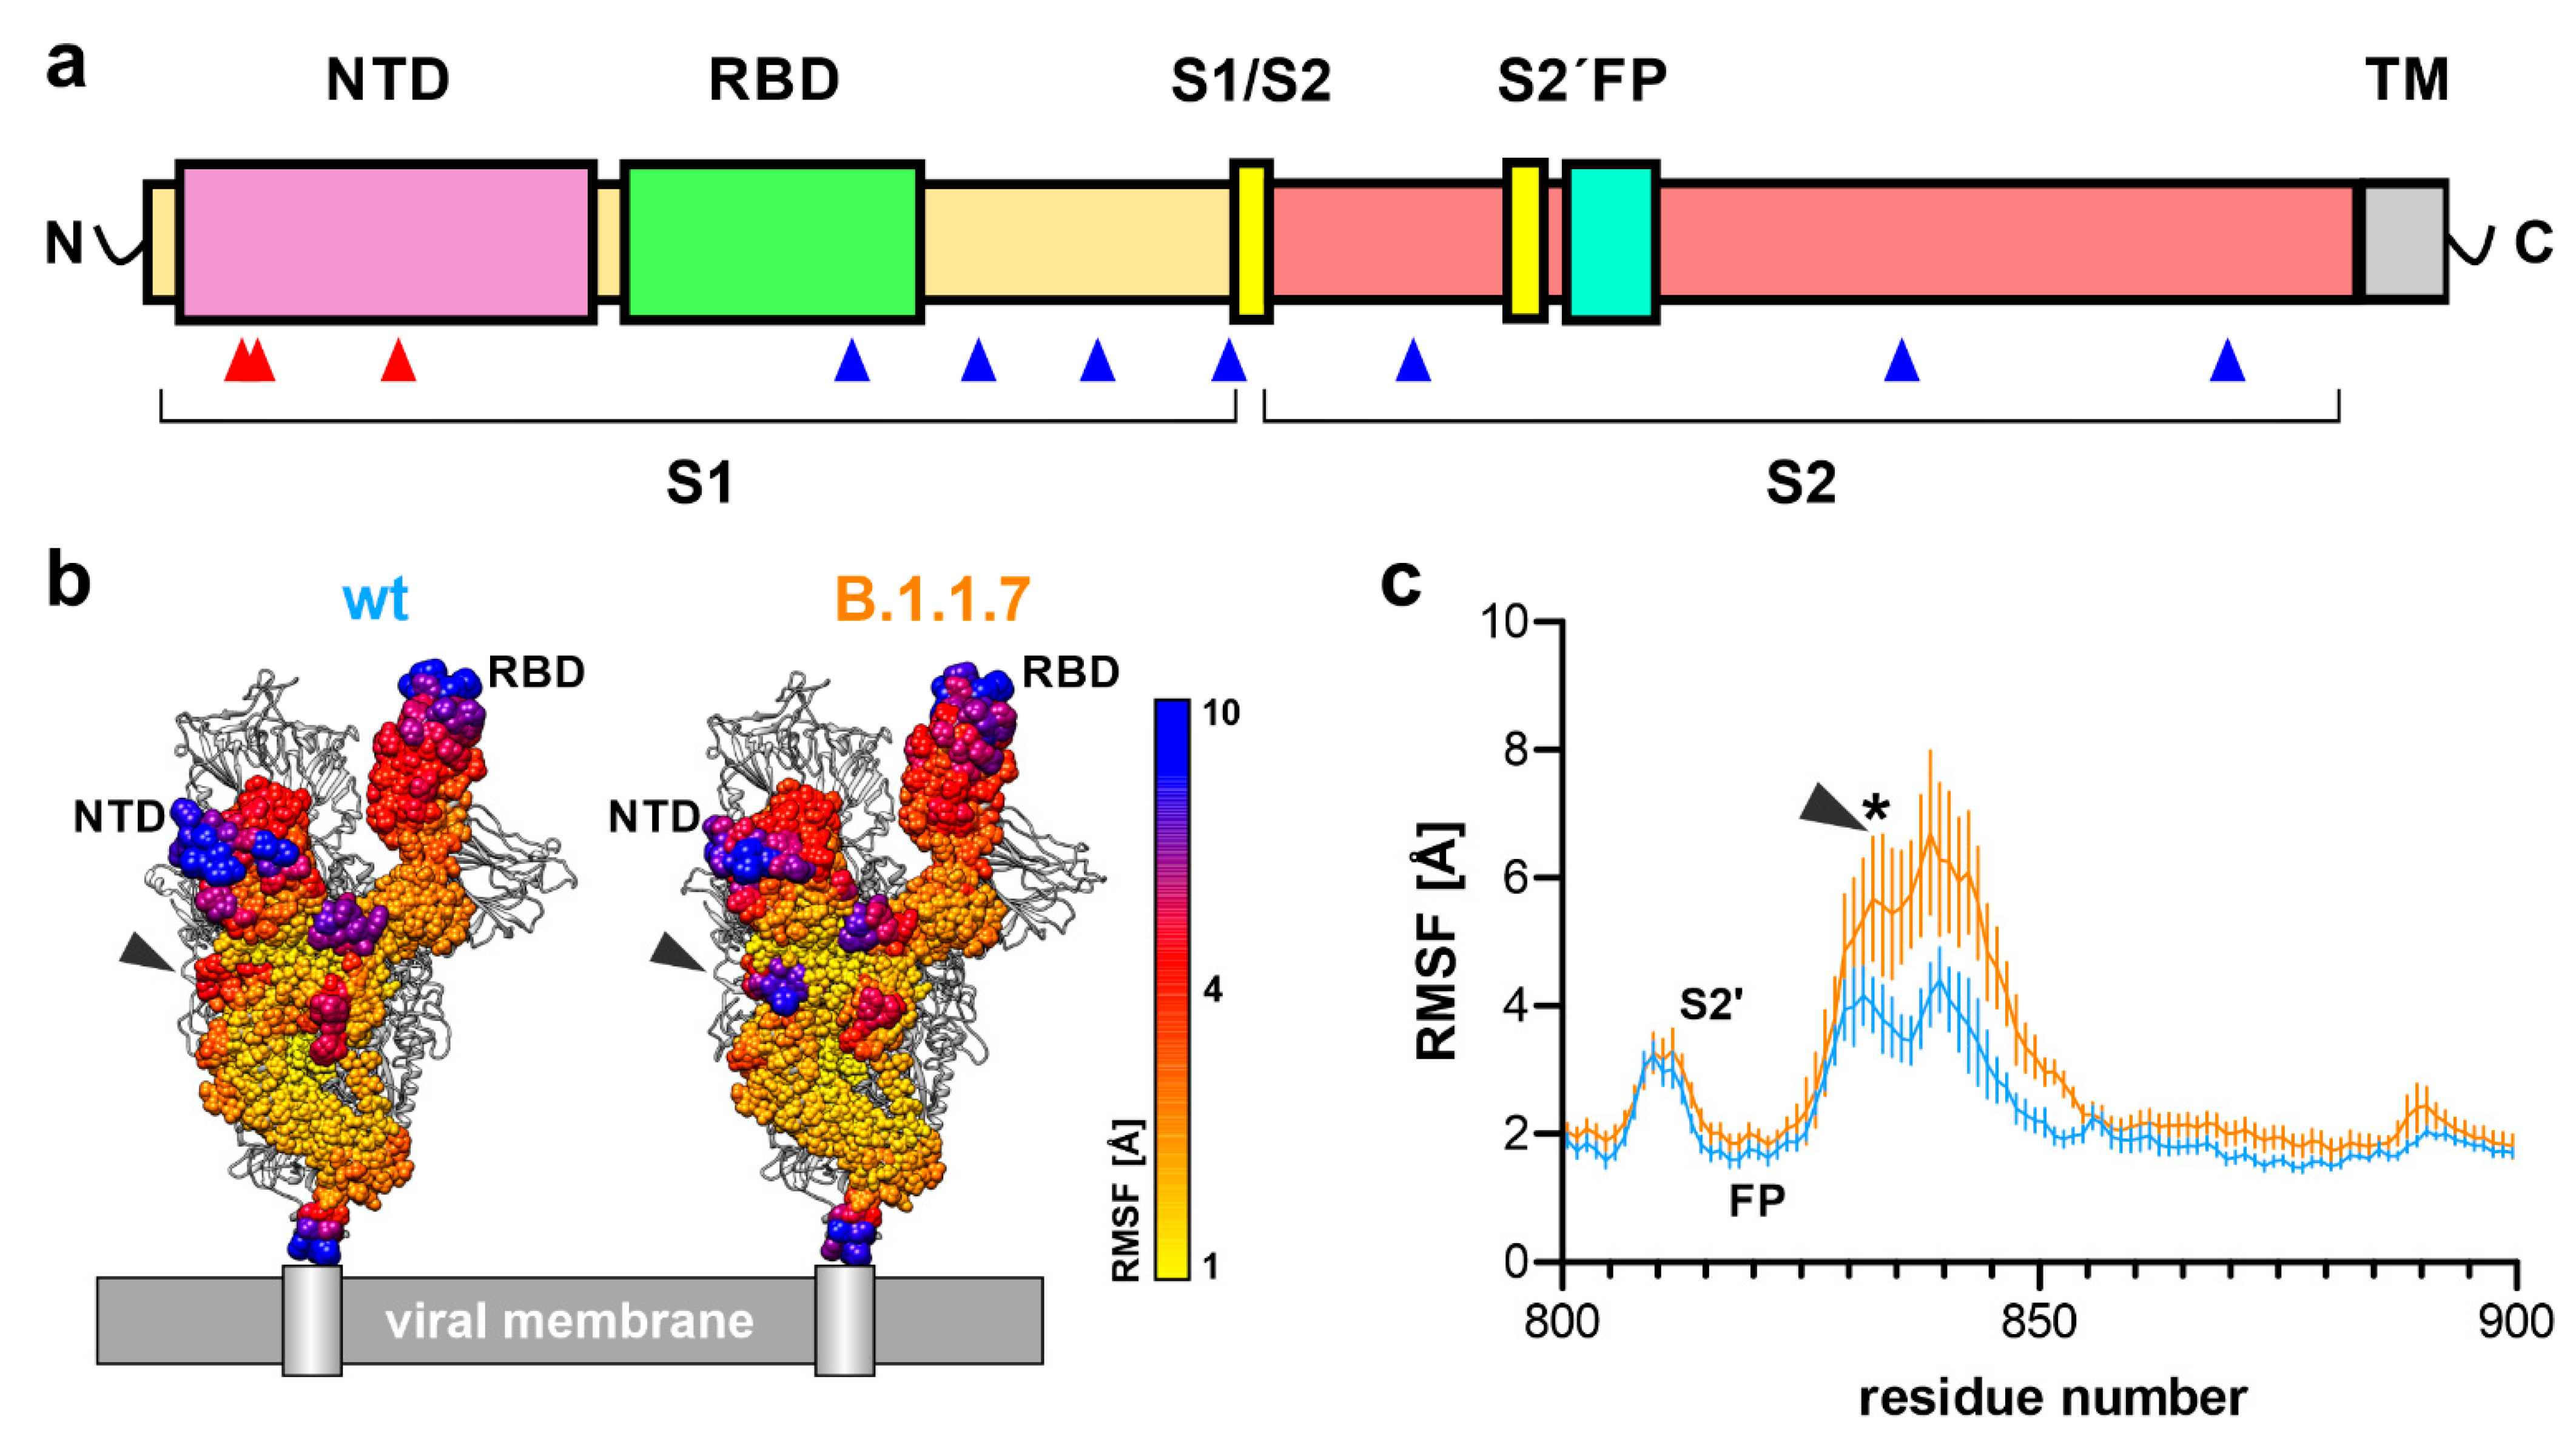
Abstract
:1. Introduction
2. Materials and Methods
2.1. Generation of the Starting Structures
2.2. Molecular Dynamics Simulations
2.3. Statistics and Display
3. Results
3.1. Flexibility of the Spike Trimer
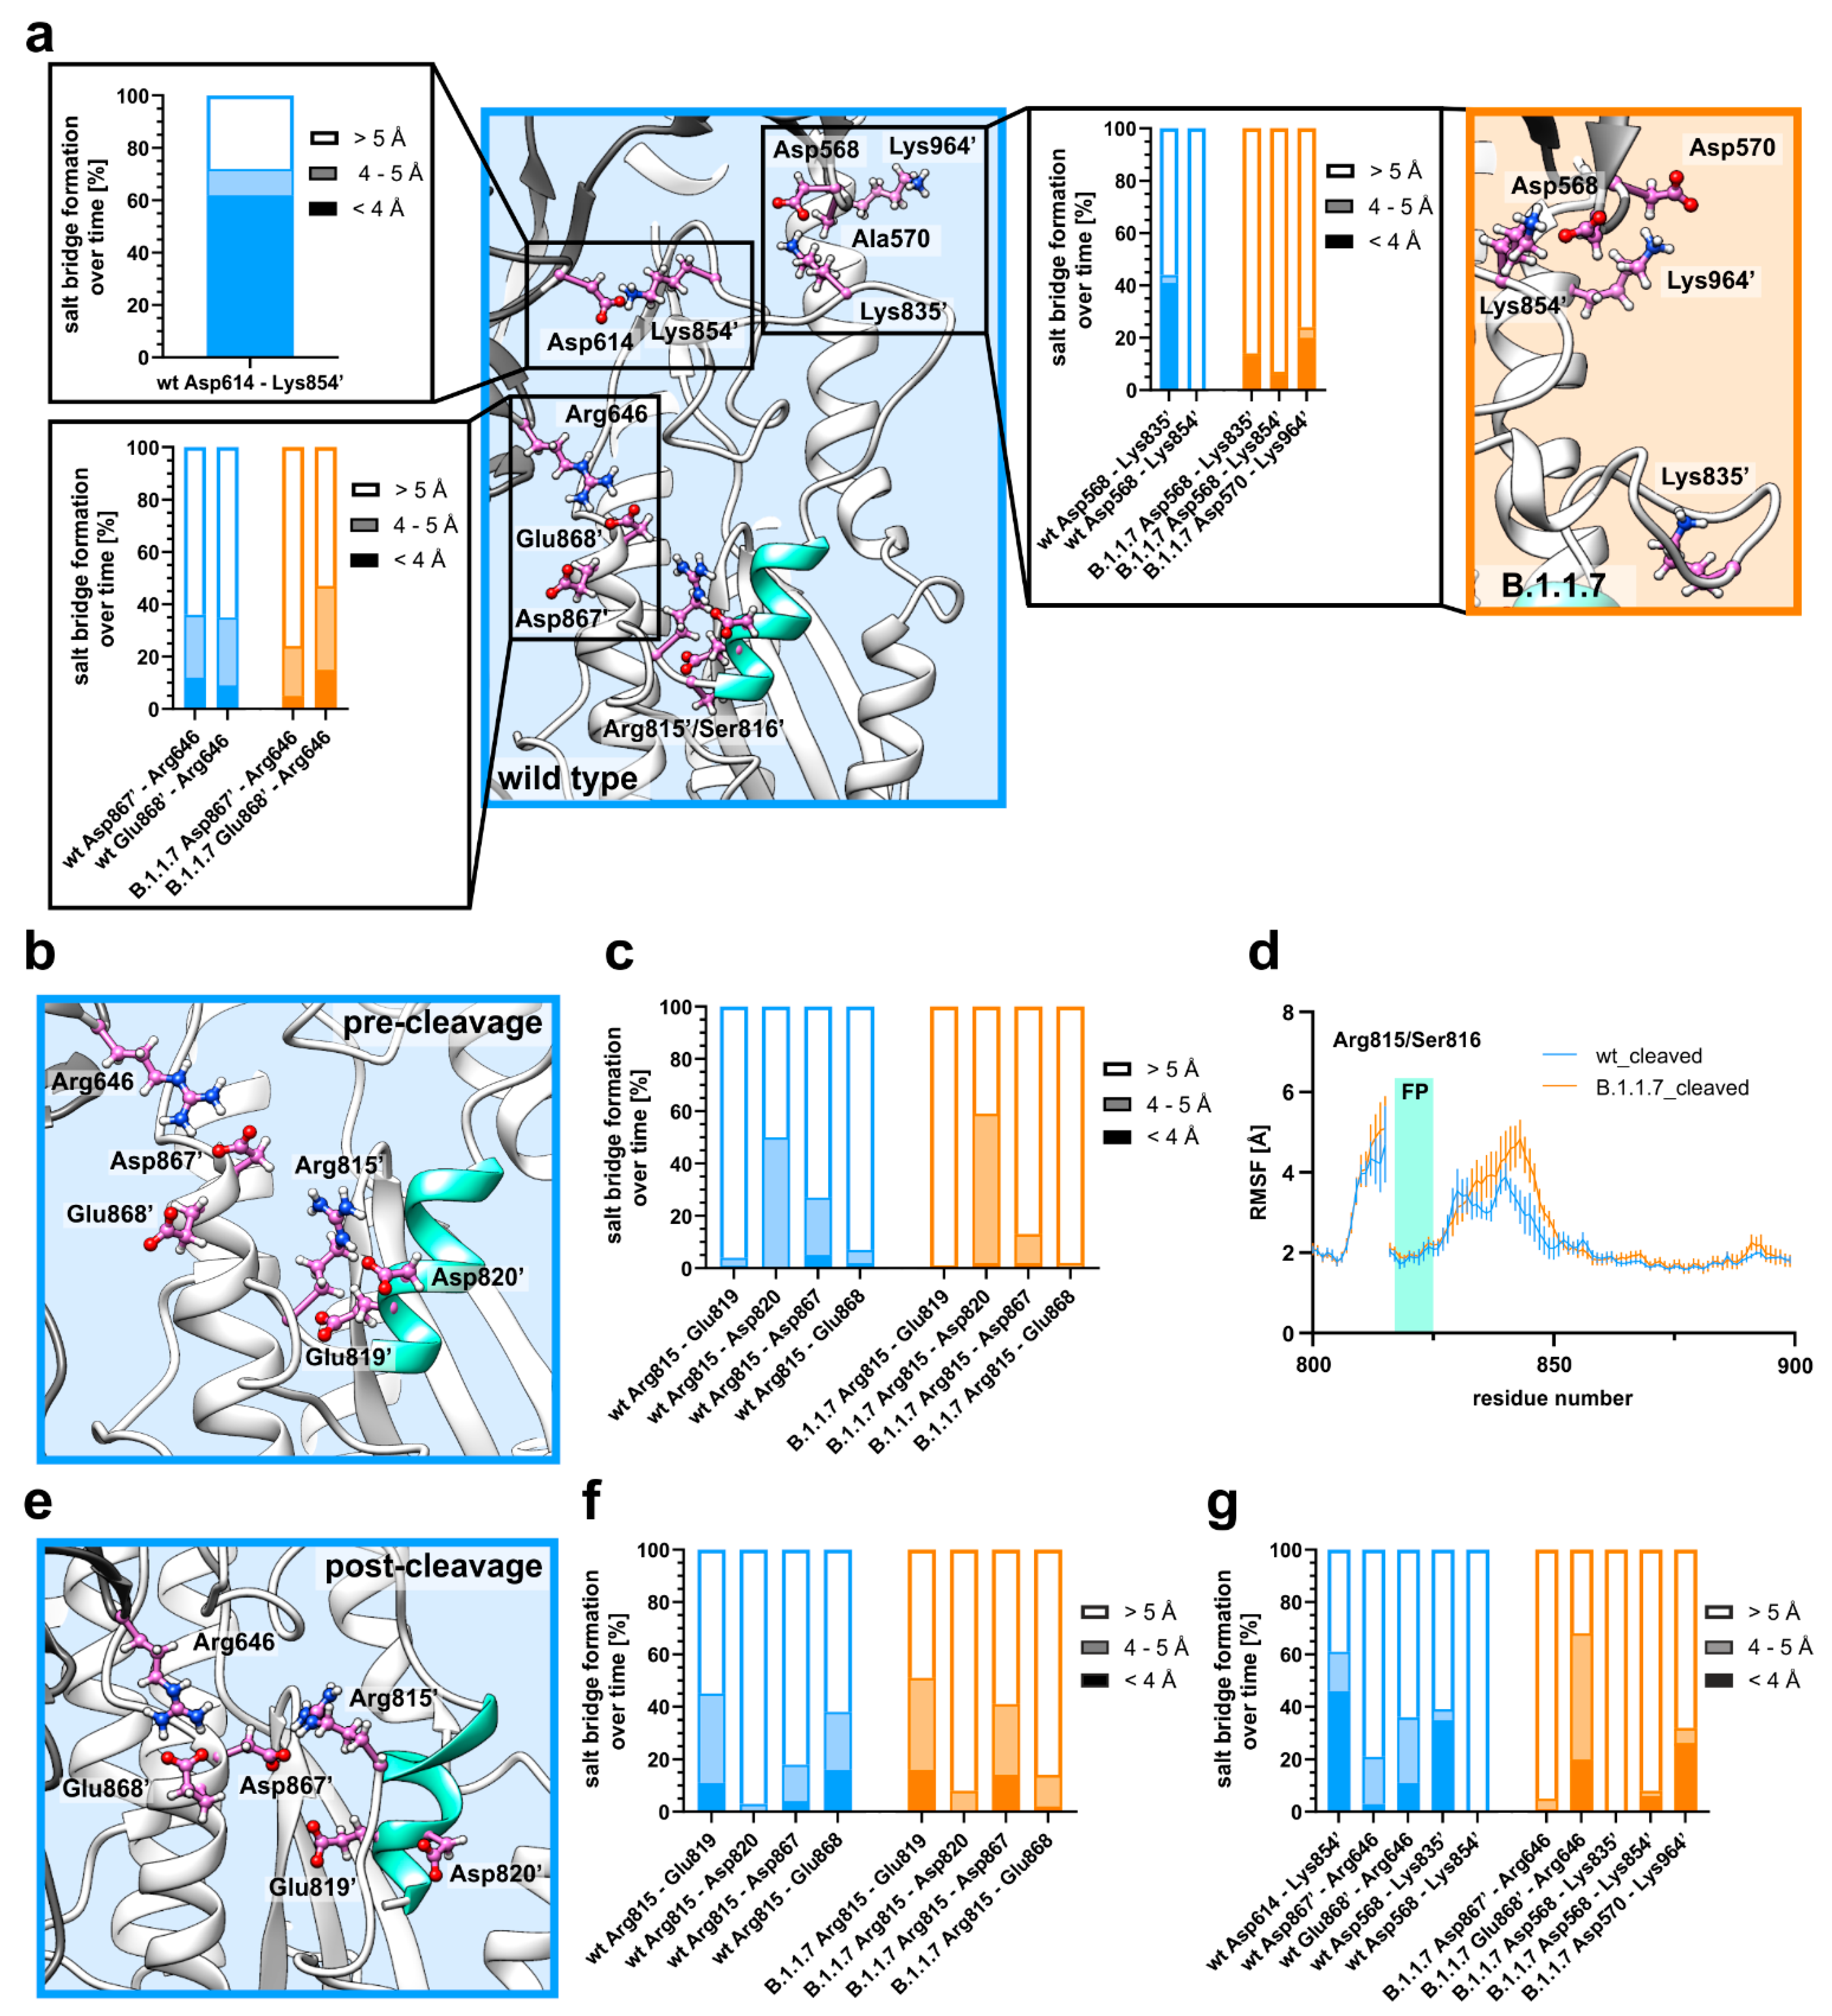
3.2. D614G Induces Flexibility around the Fusion Peptide via Salt Bridge Rearrangement
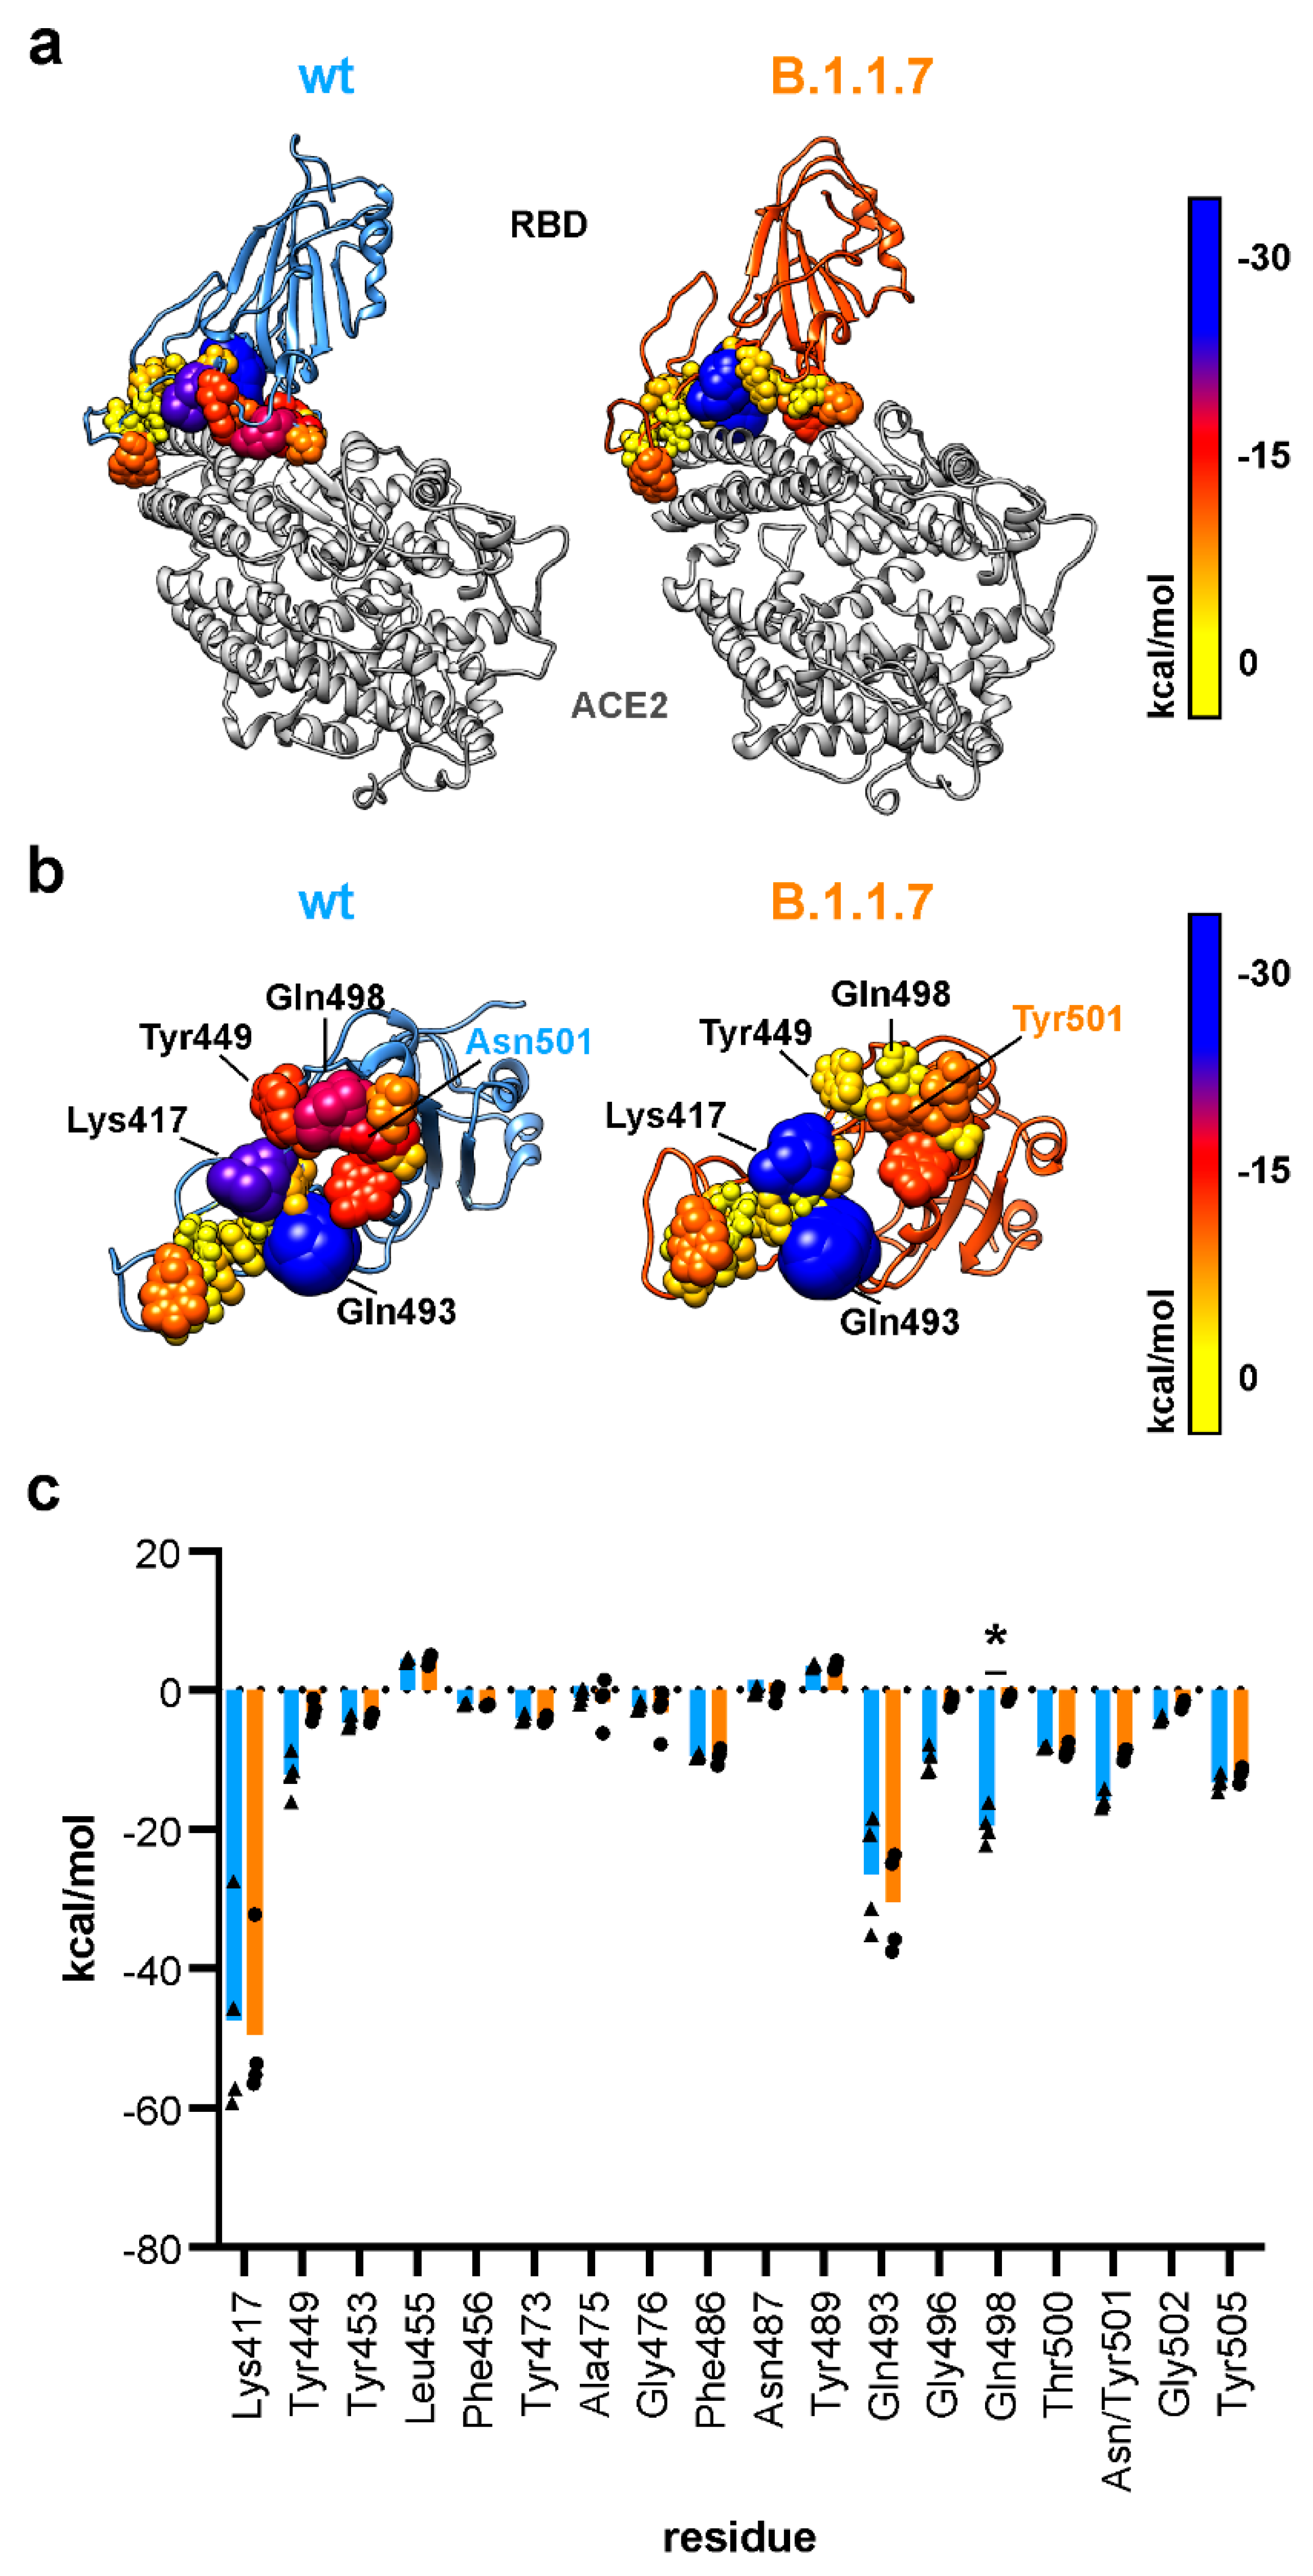
3.3. N501Y Replacement Displaces Glutamine 498 from the SARS-CoV-2 ACE2 Interface
3.4. The N501Y Mutation Decreses Electrostatic Binding in B.1.1.7
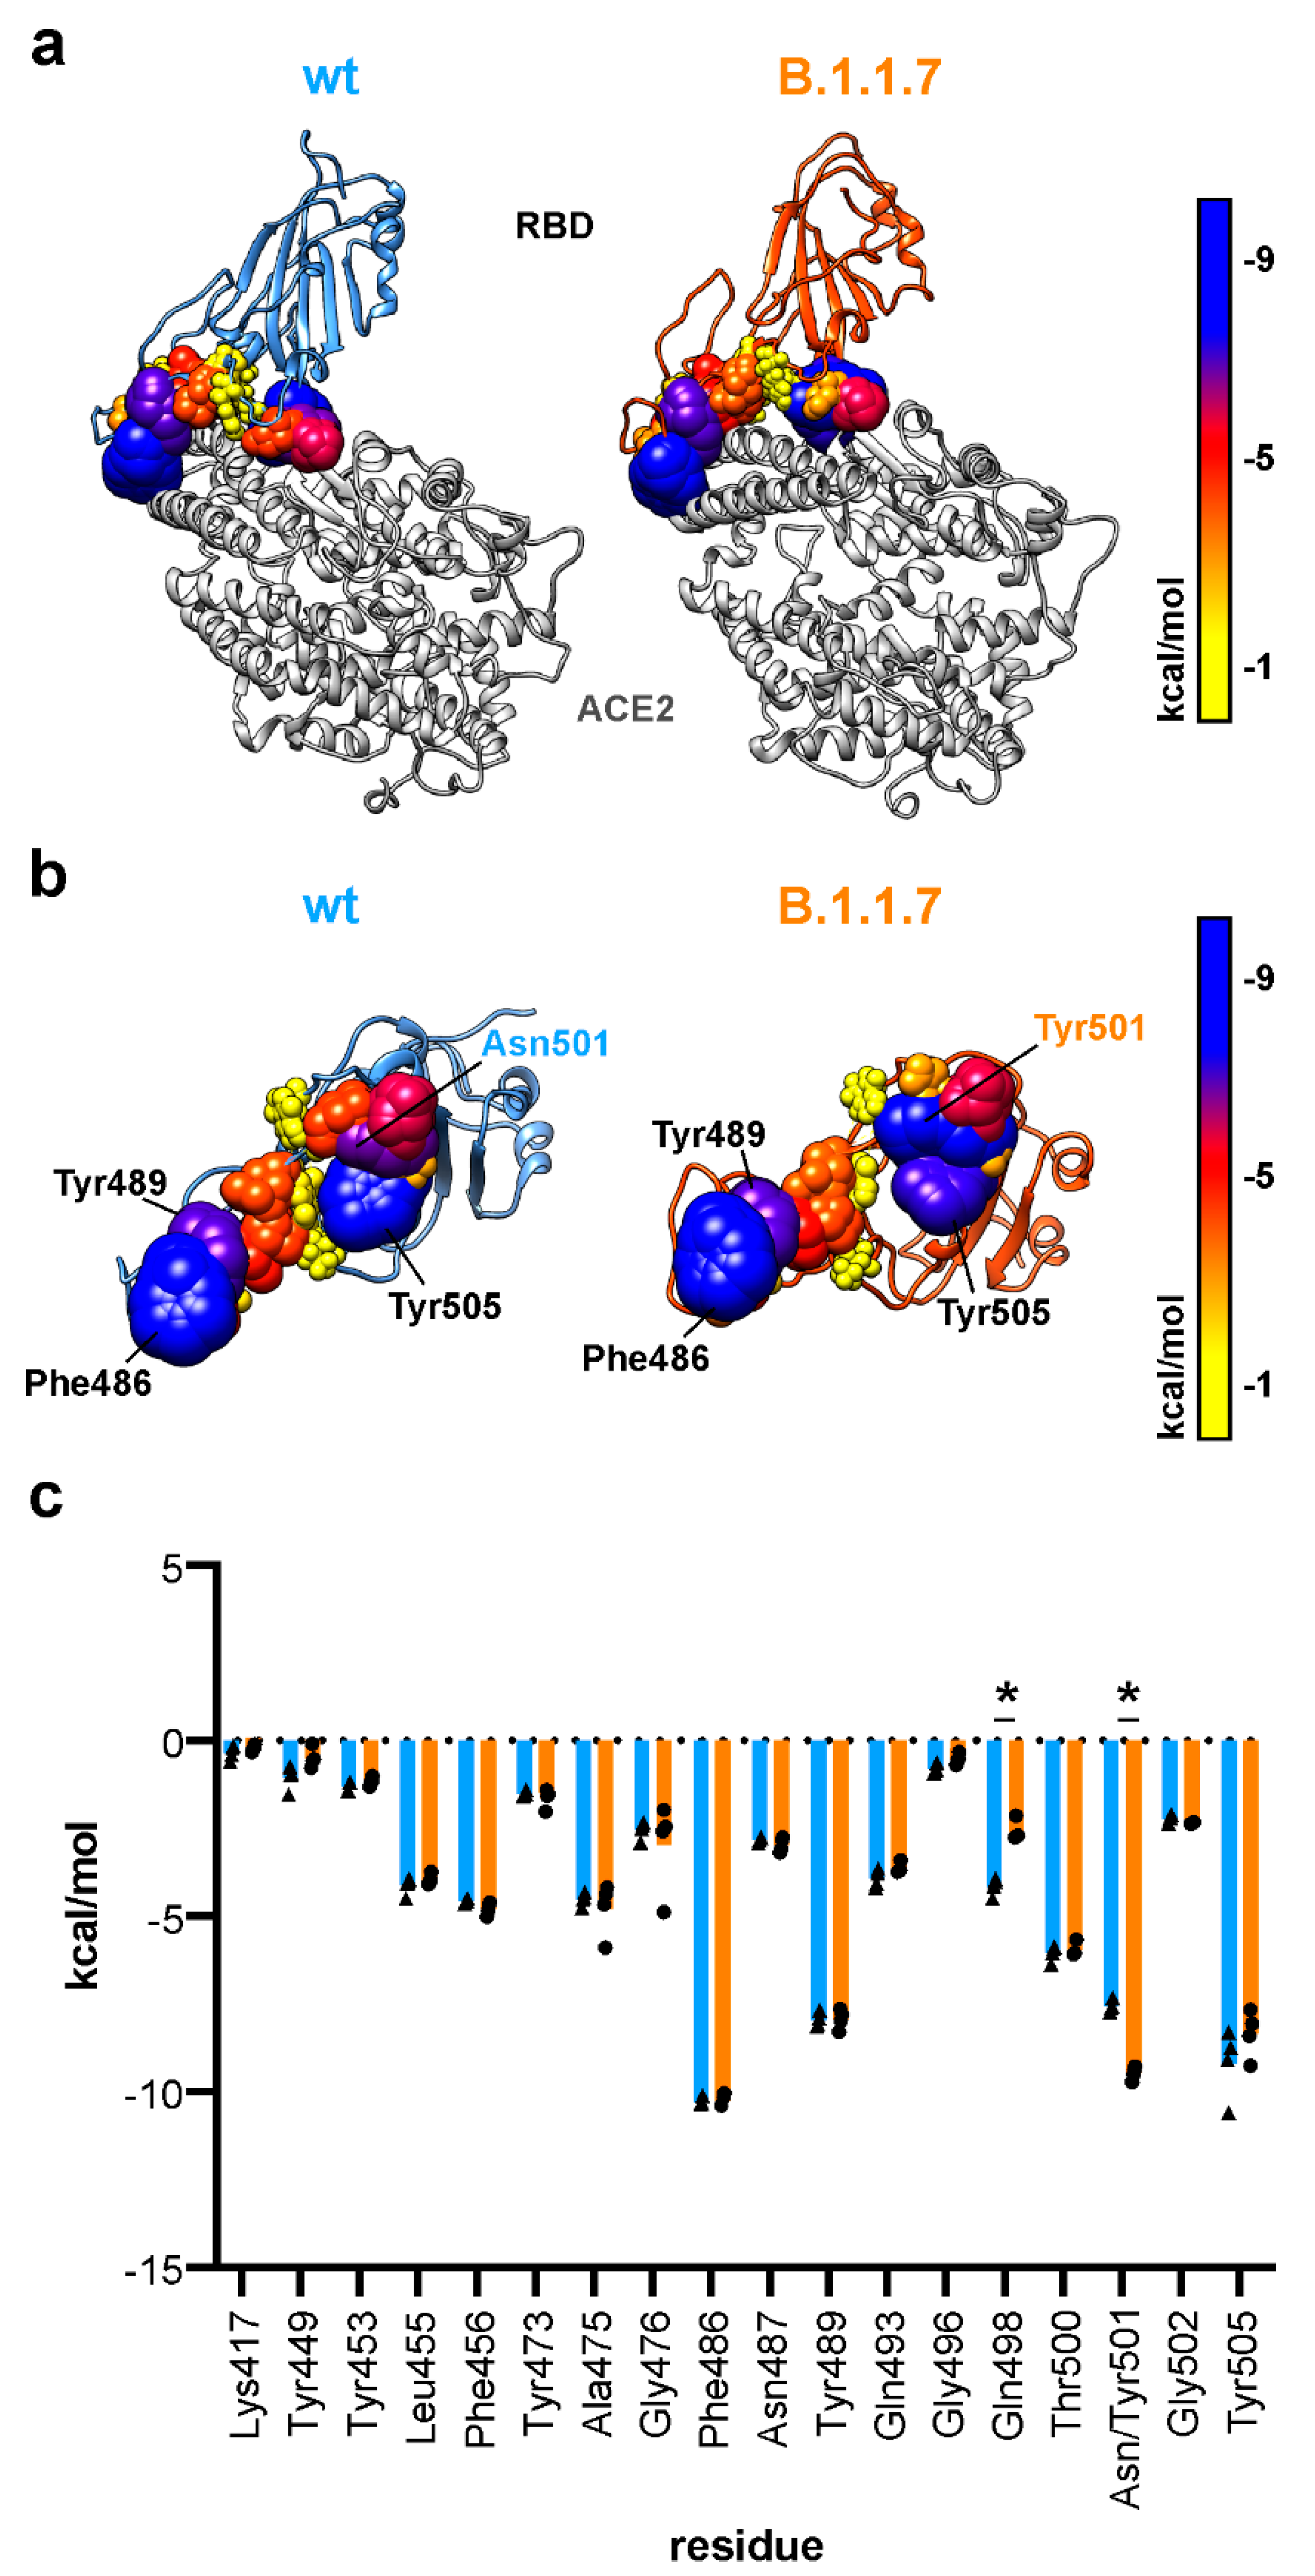
3.5. Tyrosine at Position 501 Increases Van der Waals Interaction Locally in B.1.1.7
4. Discussion
Supplementary Materials
Author Contributions
Funding
Institutional Review Board Statement
Informed Consent Statement
Acknowledgments
Conflicts of Interest
References
- Benton, D.J.; Wrobel, A.G.; Xu, P.; Roustan, C.; Martin, S.R.; Rosenthal, P.B.; Skehel, J.J.; Gamblin, S.J. Receptor binding and priming of the spike protein of SARS-CoV-2 for membrane fusion. Nature 2020, 588, 327–330. [Google Scholar] [CrossRef] [PubMed]
- Galloway, S.E.; Paul, P.; MacCannell, D.R.; Johansson, M.A.; Brooks, J.T.; MacNeil, A.; Slayton, R.B.; Tong, S.; Silk, B.J.; Armstrong, G.L.; et al. Emergence of SARS-CoV-2 B.1.1.7 Lineage—United States, December 29, 2020–January 12, 2021. Morb. Mortal. Wkly. Rep. 2021, 70, 95–99. [Google Scholar] [CrossRef]
- Leung, K.; Shum, M.H.; Leung, G.M.; Lam, T.T.; Wu, J.T. Early transmissibility assessment of the N501Y mutant strains of SARS-CoV-2 in the United Kingdom, October to November 2020. Euro Surveill 2021, 26, 2002106. [Google Scholar] [CrossRef]
- Korber, B.; Fischer, W.M.; Gnanakaran, S.; Yoon, H.; Theiler, J.; Abfalterer, W.; Hengartner, N.; Giorgi, E.E.; Bhattacharya, T.; Foley, B.; et al. Tracking Changes in SARS-CoV-2 Spike: Evidence that D614G Increases Infectivity of the COVID-19 Virus. Cell 2020, 182, 812–827.e19. [Google Scholar] [CrossRef] [PubMed]
- Zhang, L.; Jackson, C.B.; Mou, H.; Ojha, A.; Peng, H.; Quinlan, B.D.; Rangarajan, E.S.; Pan, A.; Vanderheiden, A.; Suthar, M.S.; et al. SARS-CoV-2 spike-protein D614G mutation increases virion spike density and infectivity. Nat. Commun. 2020, 11, 6013. [Google Scholar] [CrossRef] [PubMed]
- Davies, N.G.; Jarvis, C.I.; Kucharski, A.J.; Munday, J.; Pearson, C.A.B.; Russell, T.W.; Tully, D.C.; Abbott, S.; Gimma, A.; Waites, W.; et al. Estimated transmissibility and severity of novel SARS-CoV-2 Variant of Concern 202012/01 in England. medRxiv 2020. [Google Scholar] [CrossRef]
- Götz, A.W.; Williamson, M.J.; Xu, D.; Poole, D.; le Grand, S.; Walker, R.C. Routine Microsecond Molecular Dynamics Simulations with AMBER on GPUs. 1. Generalized Born. J. Chem. Theory Comput. 2012, 8, 1542–1555. [Google Scholar] [CrossRef]
- Zhou, P.; Yang, X.-L.; Wang, X.-G.; Hu, B.; Zhang, L.; Zhang, W.; Si, H.-R.; Zhu, Y.; Li, B.; Huang, C.-L.; et al. A pneumonia outbreak associated with a new coronavirus of probable bat origin. Nature 2020, 579, 270–273. [Google Scholar] [CrossRef] [Green Version]
- Hoffmann, M.; Kleine-Weber, H.; Schroeder, S.; Krüger, N.; Herrler, T.; Erichsen, S.; Schiergens, T.S.; Herrler, G.; Wu, N.-H.; Nitsche, A.; et al. SARS-CoV-2 Cell Entry Depends on ACE2 and TMPRSS2 and Is Blocked by a Clinically Proven Protease Inhibitor. Cell 2020, 181, 271–280.e8. [Google Scholar] [CrossRef]
- Li, F.; Li, W.; Farzan, M.; Harrison, S.C. Structure of SARS coronavirus spike receptor-binding domain complexed with receptor. Science 2005, 309, 1864–1868. [Google Scholar] [CrossRef]
- Shang, J.; Wan, Y.; Luo, C.; Ye, G.; Geng, Q.; Auerbach, A.; Li, F. Cell entry mechanisms of SARS-CoV-2. Proc. Natl. Acad. Sci. USA 2020, 117, 11727–11734. [Google Scholar] [CrossRef]
- Belouzard, S.; Chu, V.C.; Whittaker, G.R. Activation of the SARS coronavirus spike protein via sequential proteolytic cleavage at two distinct sites. Proc. Natl. Acad. Sci. USA 2009, 106, 5871–5876. [Google Scholar] [CrossRef] [Green Version]
- Ou, X.; Zheng, W.; Shan, Y.; Mu, Z.; Dominguez, S.R.; Holmes, K.V.; Qian, Z. Identification of the Fusion Peptide-Containing Region in Betacoronavirus Spike Glycoproteins. J Virol 2016, 90, 5586–5600. [Google Scholar] [CrossRef] [Green Version]
- Hoffmann, M.; Kleine-Weber, H.; Pohlmann, S. A Multibasic Cleavage Site in the Spike Protein of SARS-CoV-2 Is Essential for Infection of Human Lung Cells. Mol. Cell 2020, 78, 779–784.e5. [Google Scholar] [CrossRef] [PubMed]
- Wrapp, D.; Wang, N.; Corbett, K.S.; Goldsmith, J.A.; Hsieh, C.-L.; Abiona, O.; Graham, B.S.; McLellan, J.S. Cryo-EM Structure of the 2019-nCoV Spike in the Prefusion Conformation. bioRxiv 2020. [Google Scholar] [CrossRef] [Green Version]
- Walls, A.C.; Park, Y.J.; Tortorici, M.A.; Wall, A.; McGuire, A.T.; Veesler, D. Structure, Function, and Antigenicity of the SARS-CoV-2 Spike Glycoprotein. Cell 2020, 183, 1735. [Google Scholar] [CrossRef]
- Zhou, T.; Tsybovsky, Y.; Gorman, J.; Rapp, M.; Cerutti, G.; Chuang, G.-Y.; Katsamba, P.S.; Sampson, J.M.; Schön, A.; Bimela, J.; et al. Cryo-EM Structures of SARS-CoV-2 Spike without and with ACE2 Reveal a pH-Dependent Switch to Mediate Endosomal Positioning of Receptor-Binding Domains. Cell Host Microbe 2020, 28, 867–879.e5. [Google Scholar] [CrossRef]
- Lan, J.L.; Ge, J.; Yu, J.; Shan, S.; Zhou, H.; Fan, S.; Zhang, Q.; Shi, X.; Wang, Q.; Zhang, L.; et al. Structure of the SARS-CoV-2 spike receptor-binding domain bound to the ACE2 receptor. Nature 2020, 581, 215–220. [Google Scholar] [CrossRef] [Green Version]
- CDC. Available online: https://www.cdc.gov/coronavirus/2019-ncov/cases-updates/variant-surveillance/variant-info.html#Concern (accessed on 17 March 2021).
- Pettersen, E.F.; Goddard, T.D.; Huang, C.C.; Couch, G.S.; Greenblatt, D.M.; Meng, E.C.; Ferrin, T.E. UCSF Chimera—A visualization system for exploratory research and analysis. J. Comput. Chem. 2004, 25, 1605–1612. [Google Scholar] [CrossRef] [PubMed] [Green Version]
- Case, D.A.; Belfon, K.; Ben-Shalom, I.; Brozell, S.R.; Cerutti, D.; Cheatham, T.; Cruzeiro, V.W.D.; Darden, T.; Duke, R.E.; Giambasu, G.; et al. AMBER 2020; University of California: San Francisco, CA, USA, 2020. [Google Scholar]
- Maier, J.A.; Martinez, C.; Kasavajhala, K.; Wickstrom, L.; Hauser, K.E.; Simmerling, C. ff14SB: Improving the Accuracy of Protein Side Chain and Backbone Parameters from ff99SB. J. Chem. Theory Comput. 2015, 11, 3696–3713. [Google Scholar] [CrossRef] [PubMed] [Green Version]
- Jorgensen, W.L.; Chandrasekhar, J.; Madura, J.D.; Impey, R.W.; Klein, M.L. Comparison of Simple Potential Functions for Simulating Liquid Water. J. Chem. Phys. 1983, 79, 926–935. (In English) [Google Scholar] [CrossRef]
- Socher, E.; Sticht, H.; Horn, A.H.C. The conformational stability of nonfibrillar amyloid-beta peptide oligomers critically depends on the C-terminal peptide length. ACS Chem. Neurosci. 2014, 5, 161–167. [Google Scholar] [CrossRef] [PubMed] [Green Version]
- Salomon-Ferrer, R.; Götz, A.W.; Poole, D.; le Grand, S.; Walker, R.C. Routine Microsecond Molecular Dynamics Simulations with AMBER on GPUs. 2. Explicit Solvent Particle Mesh Ewald. J. Chem. Theory Comput. 2013, 9, 3878–3888. [Google Scholar] [CrossRef] [PubMed]
- Le Grand, S.; Götz, A.W.; Walker, R.C. SPFP: Speed without compromise-A mixed precision model for GPU accelerated molecular dynamics simulations. Comput. Phys. Commun. 2013, 184, 374–380. (In English) [Google Scholar] [CrossRef]
- Berendsen, H.J.C.; Postma, J.P.M.; Vangunsteren, W.F.; Dinola, A.; Haak, J.R. Molecular-Dynamics with Coupling to an External Bath. J. Chem. Phys. 1984, 81, 3684–3690. (In English) [Google Scholar] [CrossRef] [Green Version]
- Ryckaert, J.P.; Ciccotti, G.; Berendsen, H.J.C. Numerical-Integration of Cartesian Equations of Motion of a System with Constraints—Molecular-Dynamics of N-Alkanes. J. Comput. Phys. 1977, 23, 327–341. (In English) [Google Scholar] [CrossRef] [Green Version]
- Hopkins, C.W.; le Grand, S.; Walker, R.C.; Roitberg, A.E. Long-Time-Step Molecular Dynamics through Hydrogen Mass Repartitioning. J. Chem. Theory Comput. 2015, 11, 1864–1874. [Google Scholar] [CrossRef] [PubMed]
- Roe, D.R.; Cheatham, T.E., 3rd. PTRAJ and CPPTRAJ: Software for Processing and Analysis of Molecular Dynamics Trajectory Data. J. Chem. Theory Comput. 2013, 9, 3084–3095. [Google Scholar] [CrossRef]
- Söldner, C.A.; Horn, A.H.C.; Sticht, H. Interaction of Glycolipids with the Macrophage Surface Receptor Mincle—A Systematic Molecular Dynamics Study. Sci. Rep. 2018, 8, 5374. [Google Scholar] [CrossRef] [PubMed]
- Yang, J.; Petitjean, S.J.L.; Koehler, M.; Zhang, Q.; Dumitru, A.C.; Chen, W.; Derclaye, S.; Vincent, S.P.; Soumillion, P.; Alsteens, D. Molecular interaction and inhibition of SARS-CoV-2 binding to the ACE2 receptor. Nat. Commun. 2020, 11, 4541. [Google Scholar] [CrossRef]
- Ali, A.; Vijayan, R. Dynamics of the ACE2-SARS-CoV-2/SARS-CoV spike protein interface reveal unique mechanisms. Sci. Rep. 2020, 10, 14214. [Google Scholar] [CrossRef]
- Hou, Y.J.; Chiba, S.; Halfmann, P.; Ehre, C.; Kuroda, M.; Dinnon, K.H., 3rd; Leist, S.R.; Schäfer, A.; Nakajima, N.; Takahashi, K.; et al. SARS-CoV-2 D614G Variant Exhibits Enhanced Replication ex vivo and Earlier Transmission in vivo. bioRxiv 2020. [Google Scholar] [CrossRef]
- Leung, K.; Pei, Y.; Leung, G.M.; Lam, T.T.Y.; Wu, J.T. Empirical transmission advantage of the D614G mutant strain of SARS-CoV-2. medRxiv 2020. [Google Scholar] [CrossRef]
- Volz, E.; IHill, V.; McCrone, J.T.; Price, A.; Jorgensen, D.; O’Toole, Á.; Southgate, J.; Johnson, R.; Jackson, B.; Nascimento, F.F.; et al. Evaluating the Effects of SARS-CoV-2 Spike Mutation D614G on Transmissibility and Pathogenicity. Cell 2021, 184, 64–75.e11. [Google Scholar] [CrossRef]
- Plante, J.A.; Liu, Y.; Liu, J.; Xia, H.; Johnson, B.A.; Lokugamage, K.G.; Zhang, X.; Muruato, A.E.; Zou, J.; Fontes-Garfias, C.R.; et al. Spike mutation D614G alters SARS-CoV-2 fitness. Nature 2021, 592, 116–121. [Google Scholar] [CrossRef]
- Matsuyama, S.; Nagata, N.; Shirato, K.; Kawase, M.; Takeda, M.; Taguchi, F. Efficient activation of the severe acute respiratory syndrome coronavirus spike protein by the transmembrane protease TMPRSS2. J. Virol. 2010, 84, 12658–12664. [Google Scholar] [CrossRef] [PubMed] [Green Version]
- Gobeil, S.M.; Janowska, K.; McDowell, S.; Mansouri, K.; Parks, R.; Manne, K.; Stalls, V.; Kopp, M.F.; Henderson, R.; Edwards, R.J.; et al. D614G Mutation Alters SARS-CoV-2 Spike Conformation and Enhances Protease Cleavage at the S1/S2 Junction. Cell Rep. 2021, 34, 108630. [Google Scholar] [CrossRef] [PubMed]
- Starr, T.N.; Greaney, A.J.; Hilton, S.K.; Ellis, D.; Crawford, K.H.D.; Dingens, A.S.; Navarro, M.J.; Bowen, J.E.; Tortorici, M.A.; Walls, A.C.; et al. Deep Mutational Scanning of SARS-CoV-2 Receptor Binding Domain Reveals Constraints on Folding and ACE2 Binding. Cell 2020, 182, 1295–1310.e20. [Google Scholar] [CrossRef] [PubMed]


Publisher’s Note: MDPI stays neutral with regard to jurisdictional claims in published maps and institutional affiliations. |
© 2021 by the authors. Licensee MDPI, Basel, Switzerland. This article is an open access article distributed under the terms and conditions of the Creative Commons Attribution (CC BY) license (https://creativecommons.org/licenses/by/4.0/).
Share and Cite
Socher, E.; Conrad, M.; Heger, L.; Paulsen, F.; Sticht, H.; Zunke, F.; Arnold, P. Mutations in the B.1.1.7 SARS-CoV-2 Spike Protein Reduce Receptor-Binding Affinity and Induce a Flexible Link to the Fusion Peptide. Biomedicines 2021, 9, 525. https://doi.org/10.3390/biomedicines9050525
Socher E, Conrad M, Heger L, Paulsen F, Sticht H, Zunke F, Arnold P. Mutations in the B.1.1.7 SARS-CoV-2 Spike Protein Reduce Receptor-Binding Affinity and Induce a Flexible Link to the Fusion Peptide. Biomedicines. 2021; 9(5):525. https://doi.org/10.3390/biomedicines9050525
Chicago/Turabian StyleSocher, Eileen, Marcus Conrad, Lukas Heger, Friedrich Paulsen, Heinrich Sticht, Friederike Zunke, and Philipp Arnold. 2021. "Mutations in the B.1.1.7 SARS-CoV-2 Spike Protein Reduce Receptor-Binding Affinity and Induce a Flexible Link to the Fusion Peptide" Biomedicines 9, no. 5: 525. https://doi.org/10.3390/biomedicines9050525