
Which National Factors Are Most Influential in the Spread of COVID-19?

 , , , , , and
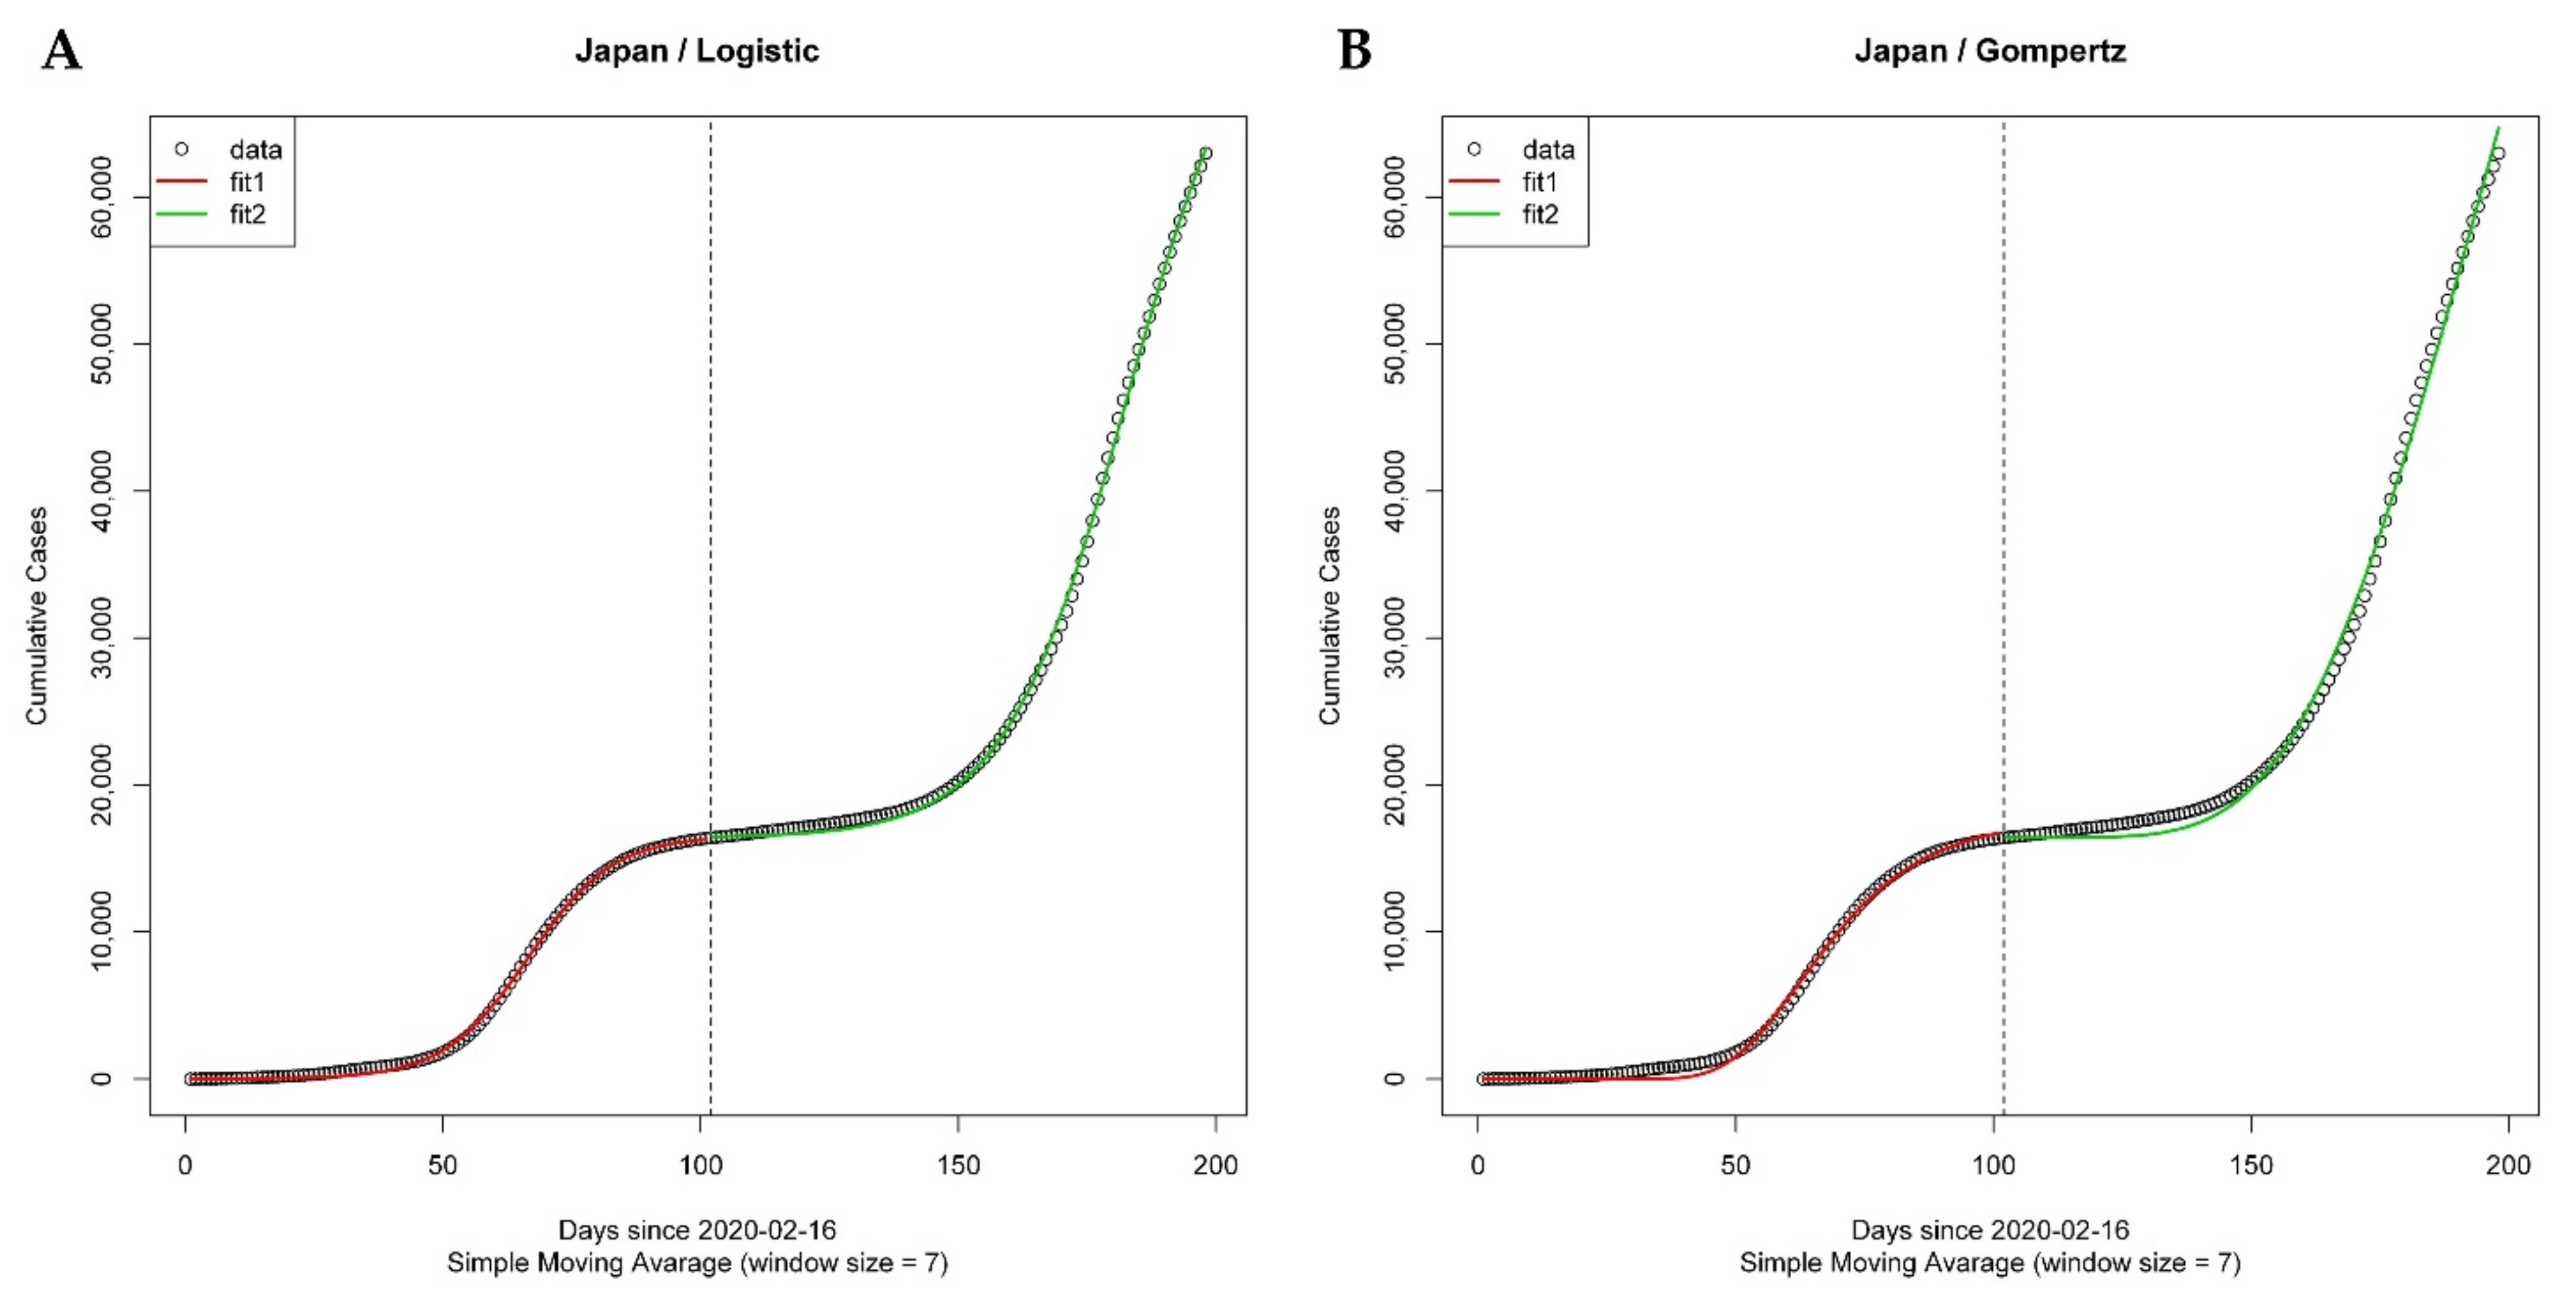
Abstract
:1. Introduction
2. Materials and Methods
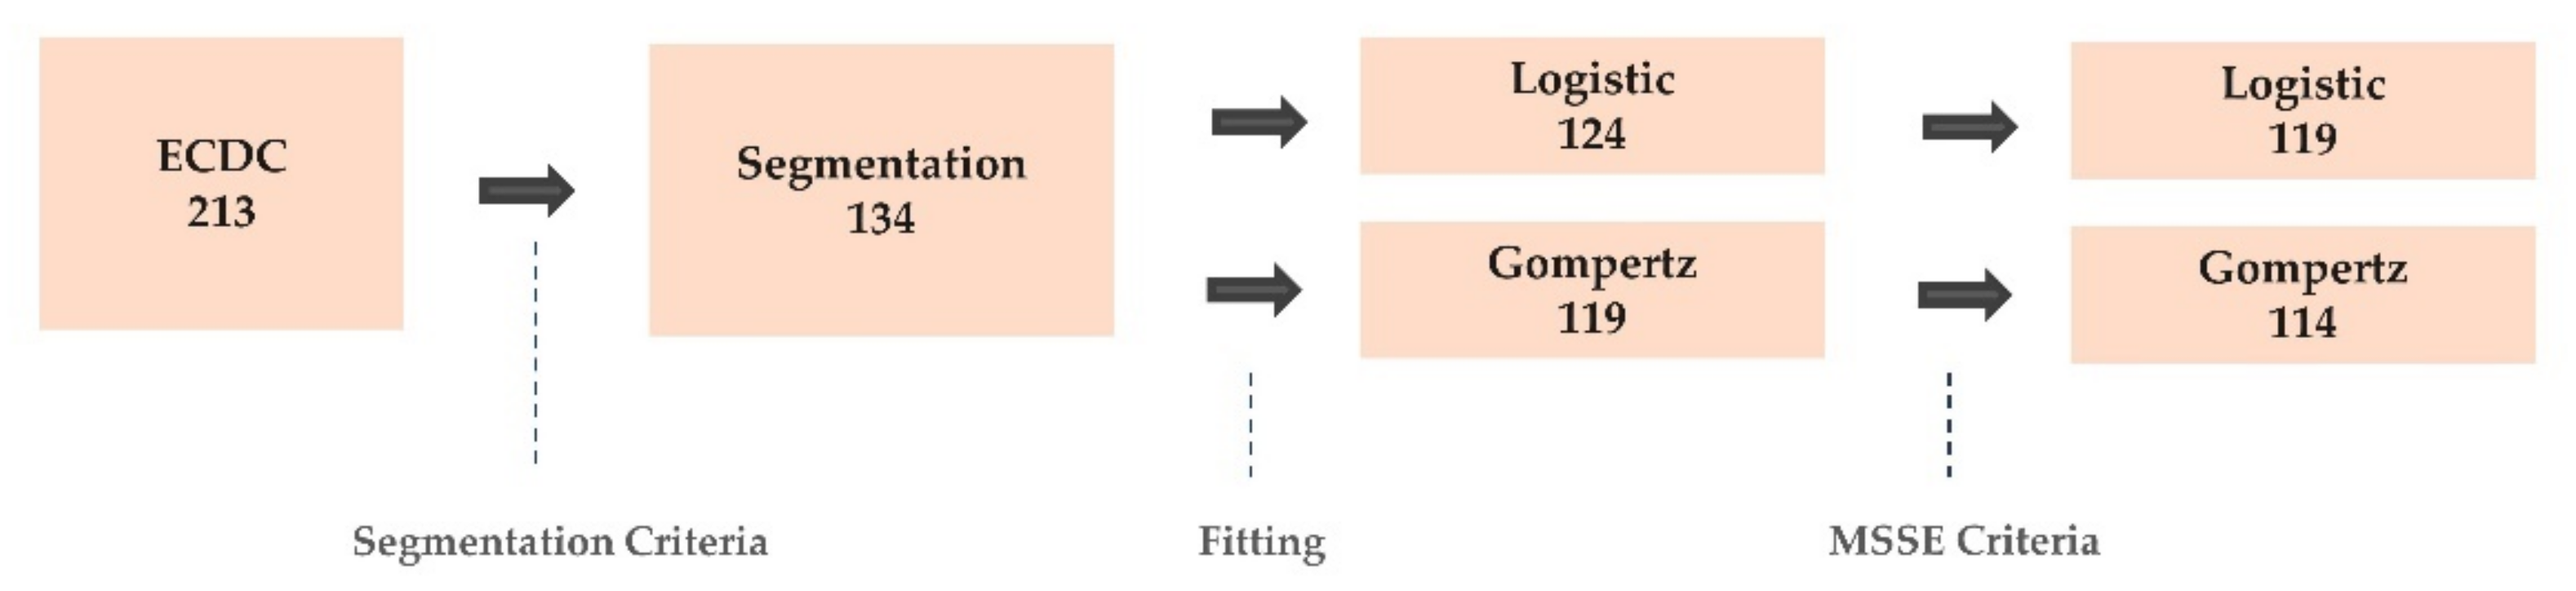
2.1. ECDC COVID-19 Data
2.2. National Factors
2.3. Analysis of the Spread of COVID-19 Using GCMs
2.4. Logistic Model
2.5. Gompertz Model
2.6. Segmentation Algorithm
2.7. Segmented Growth Curve Models
2.8. Regression Model
3. Results
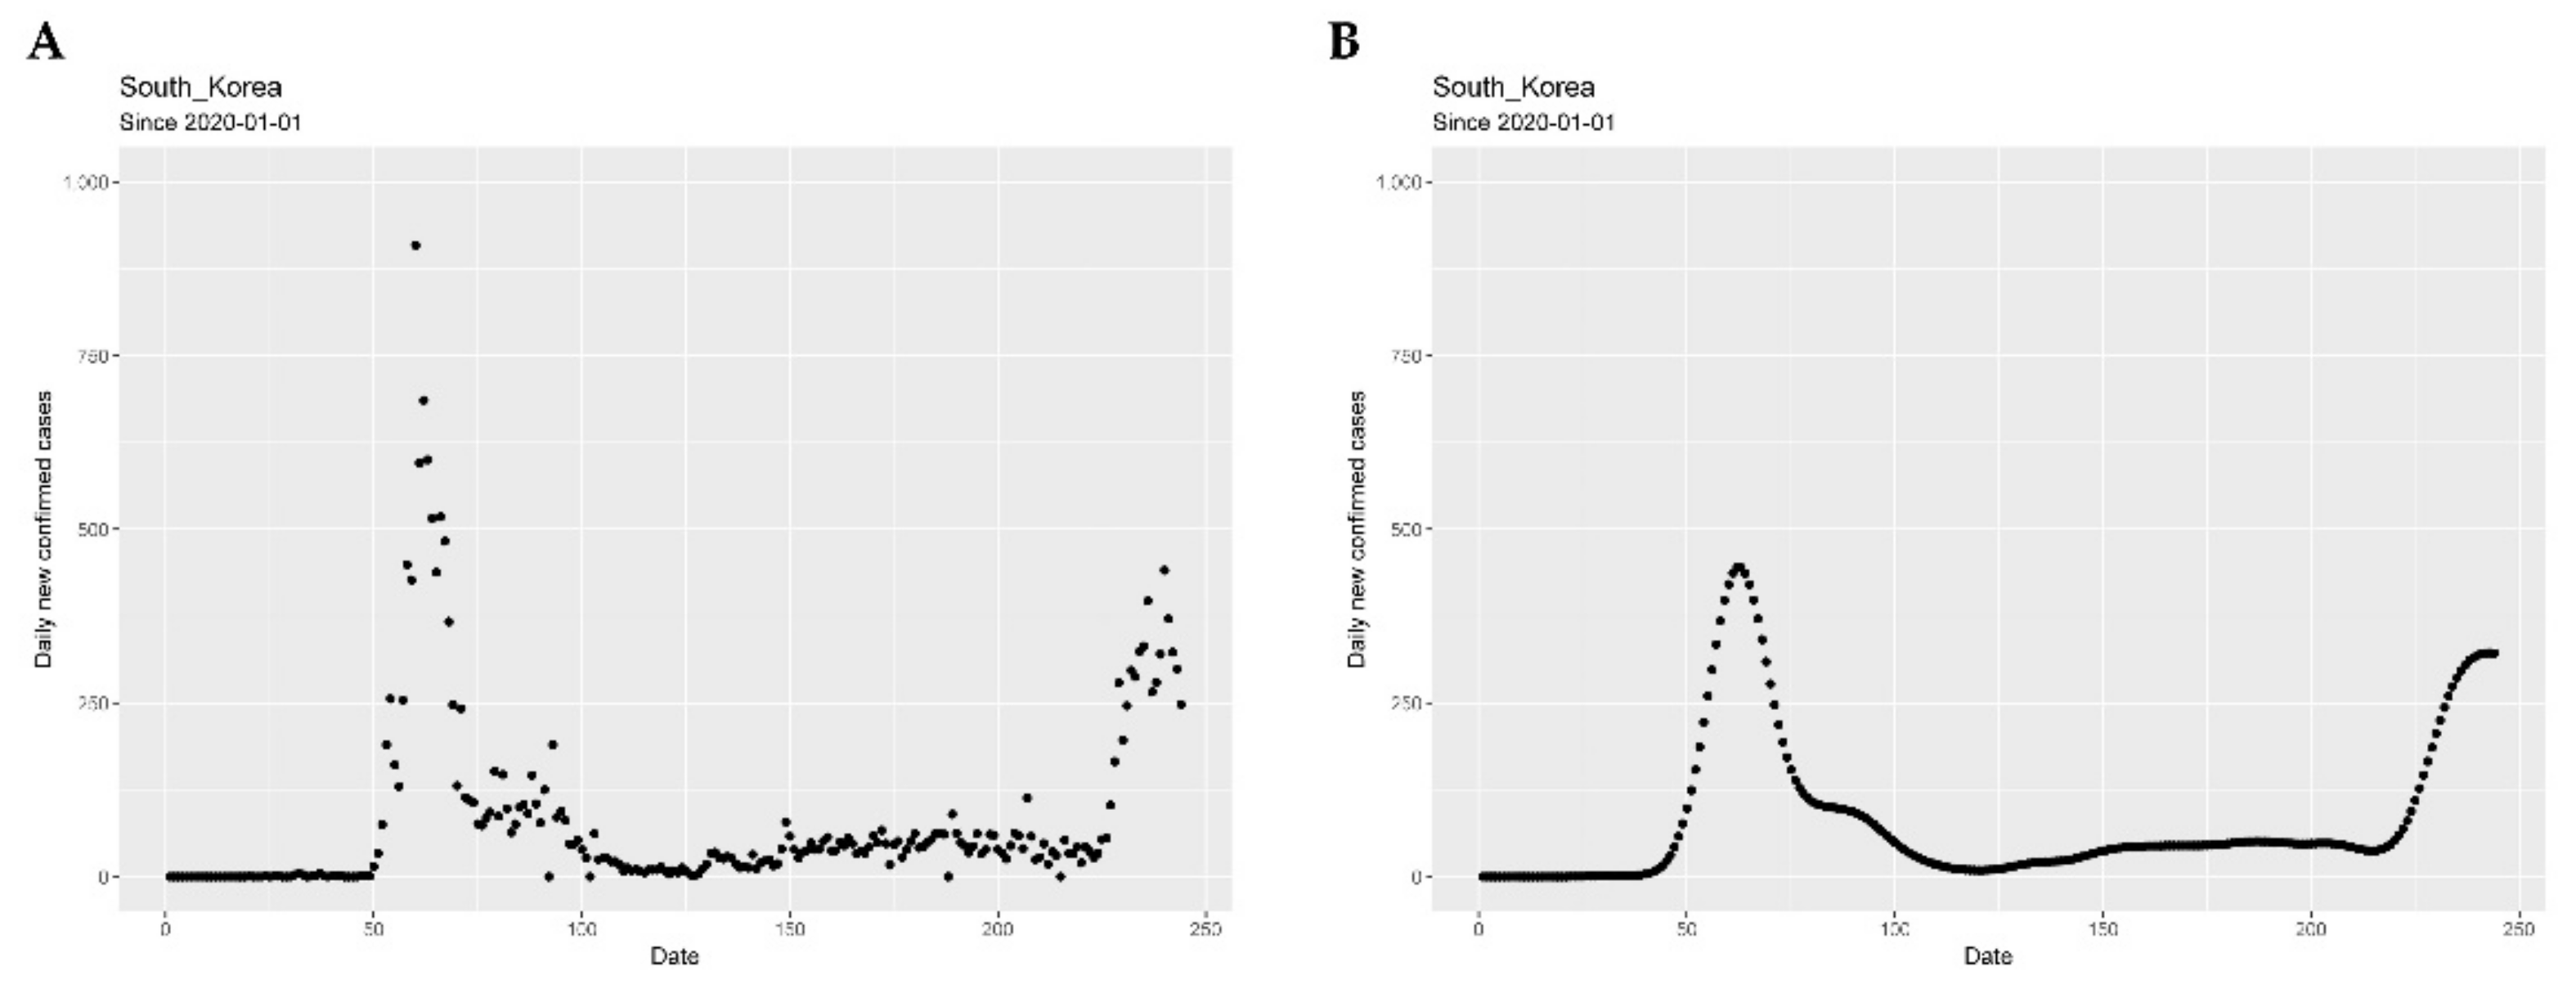
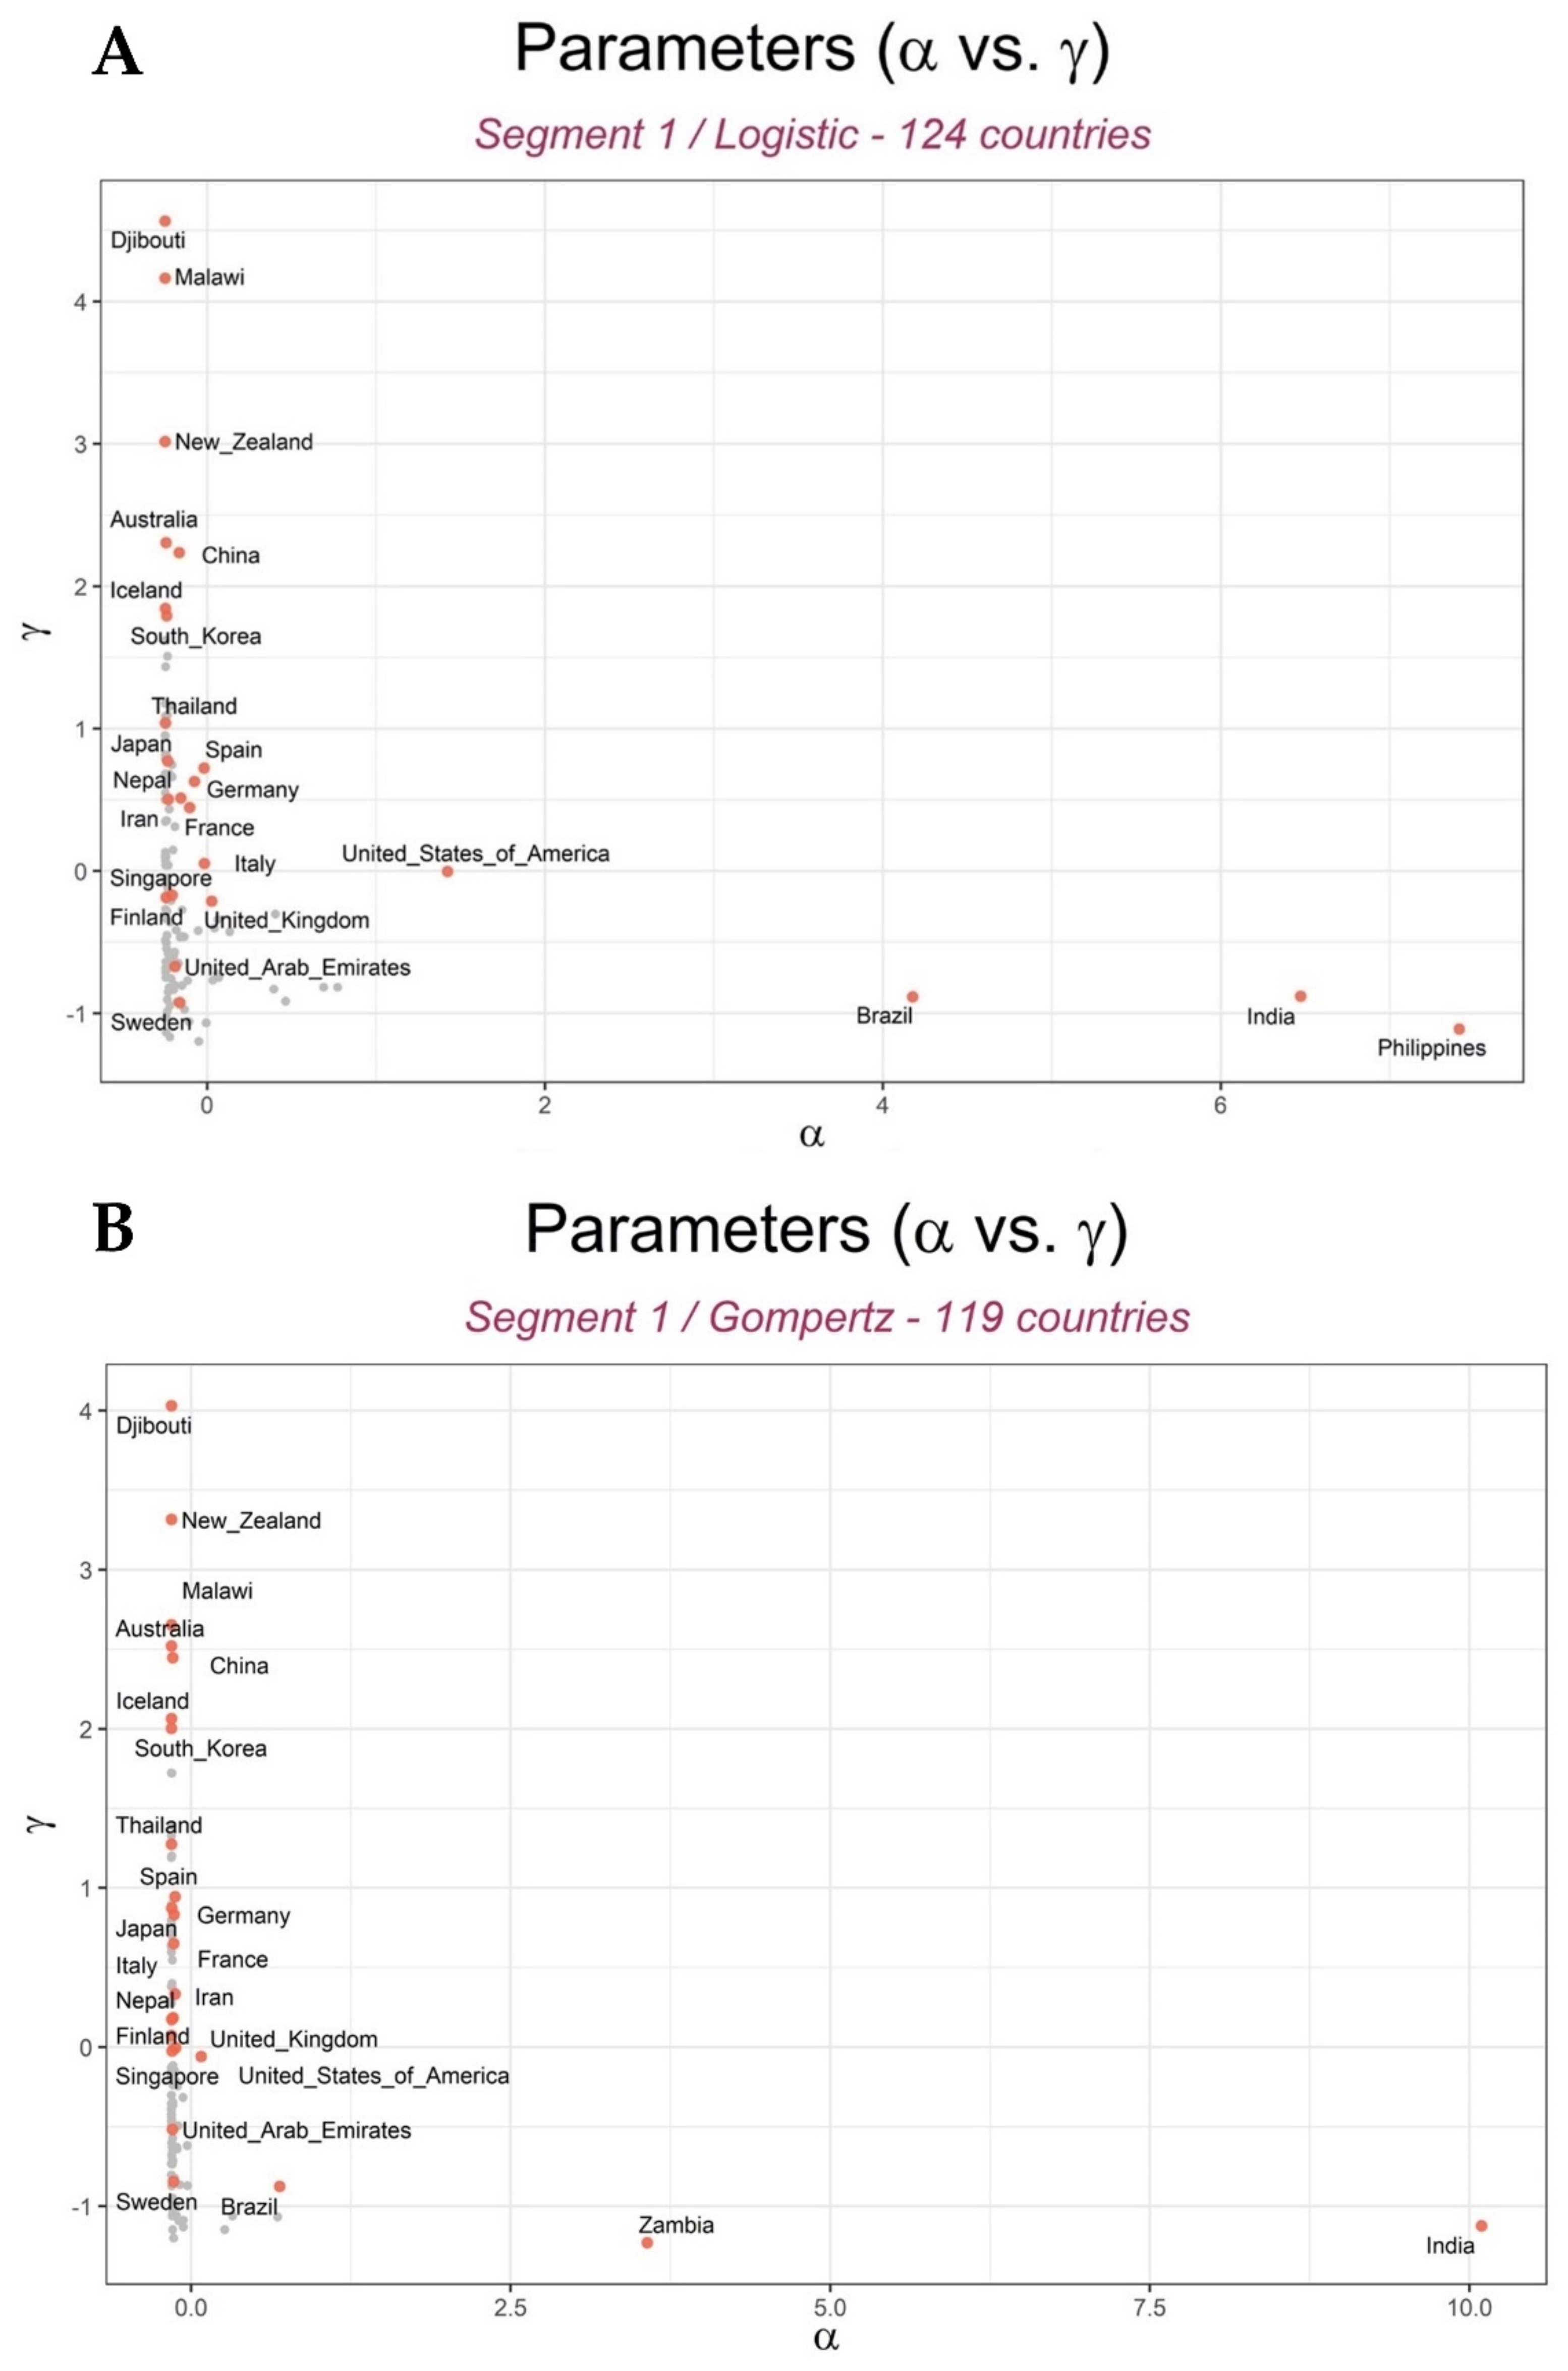
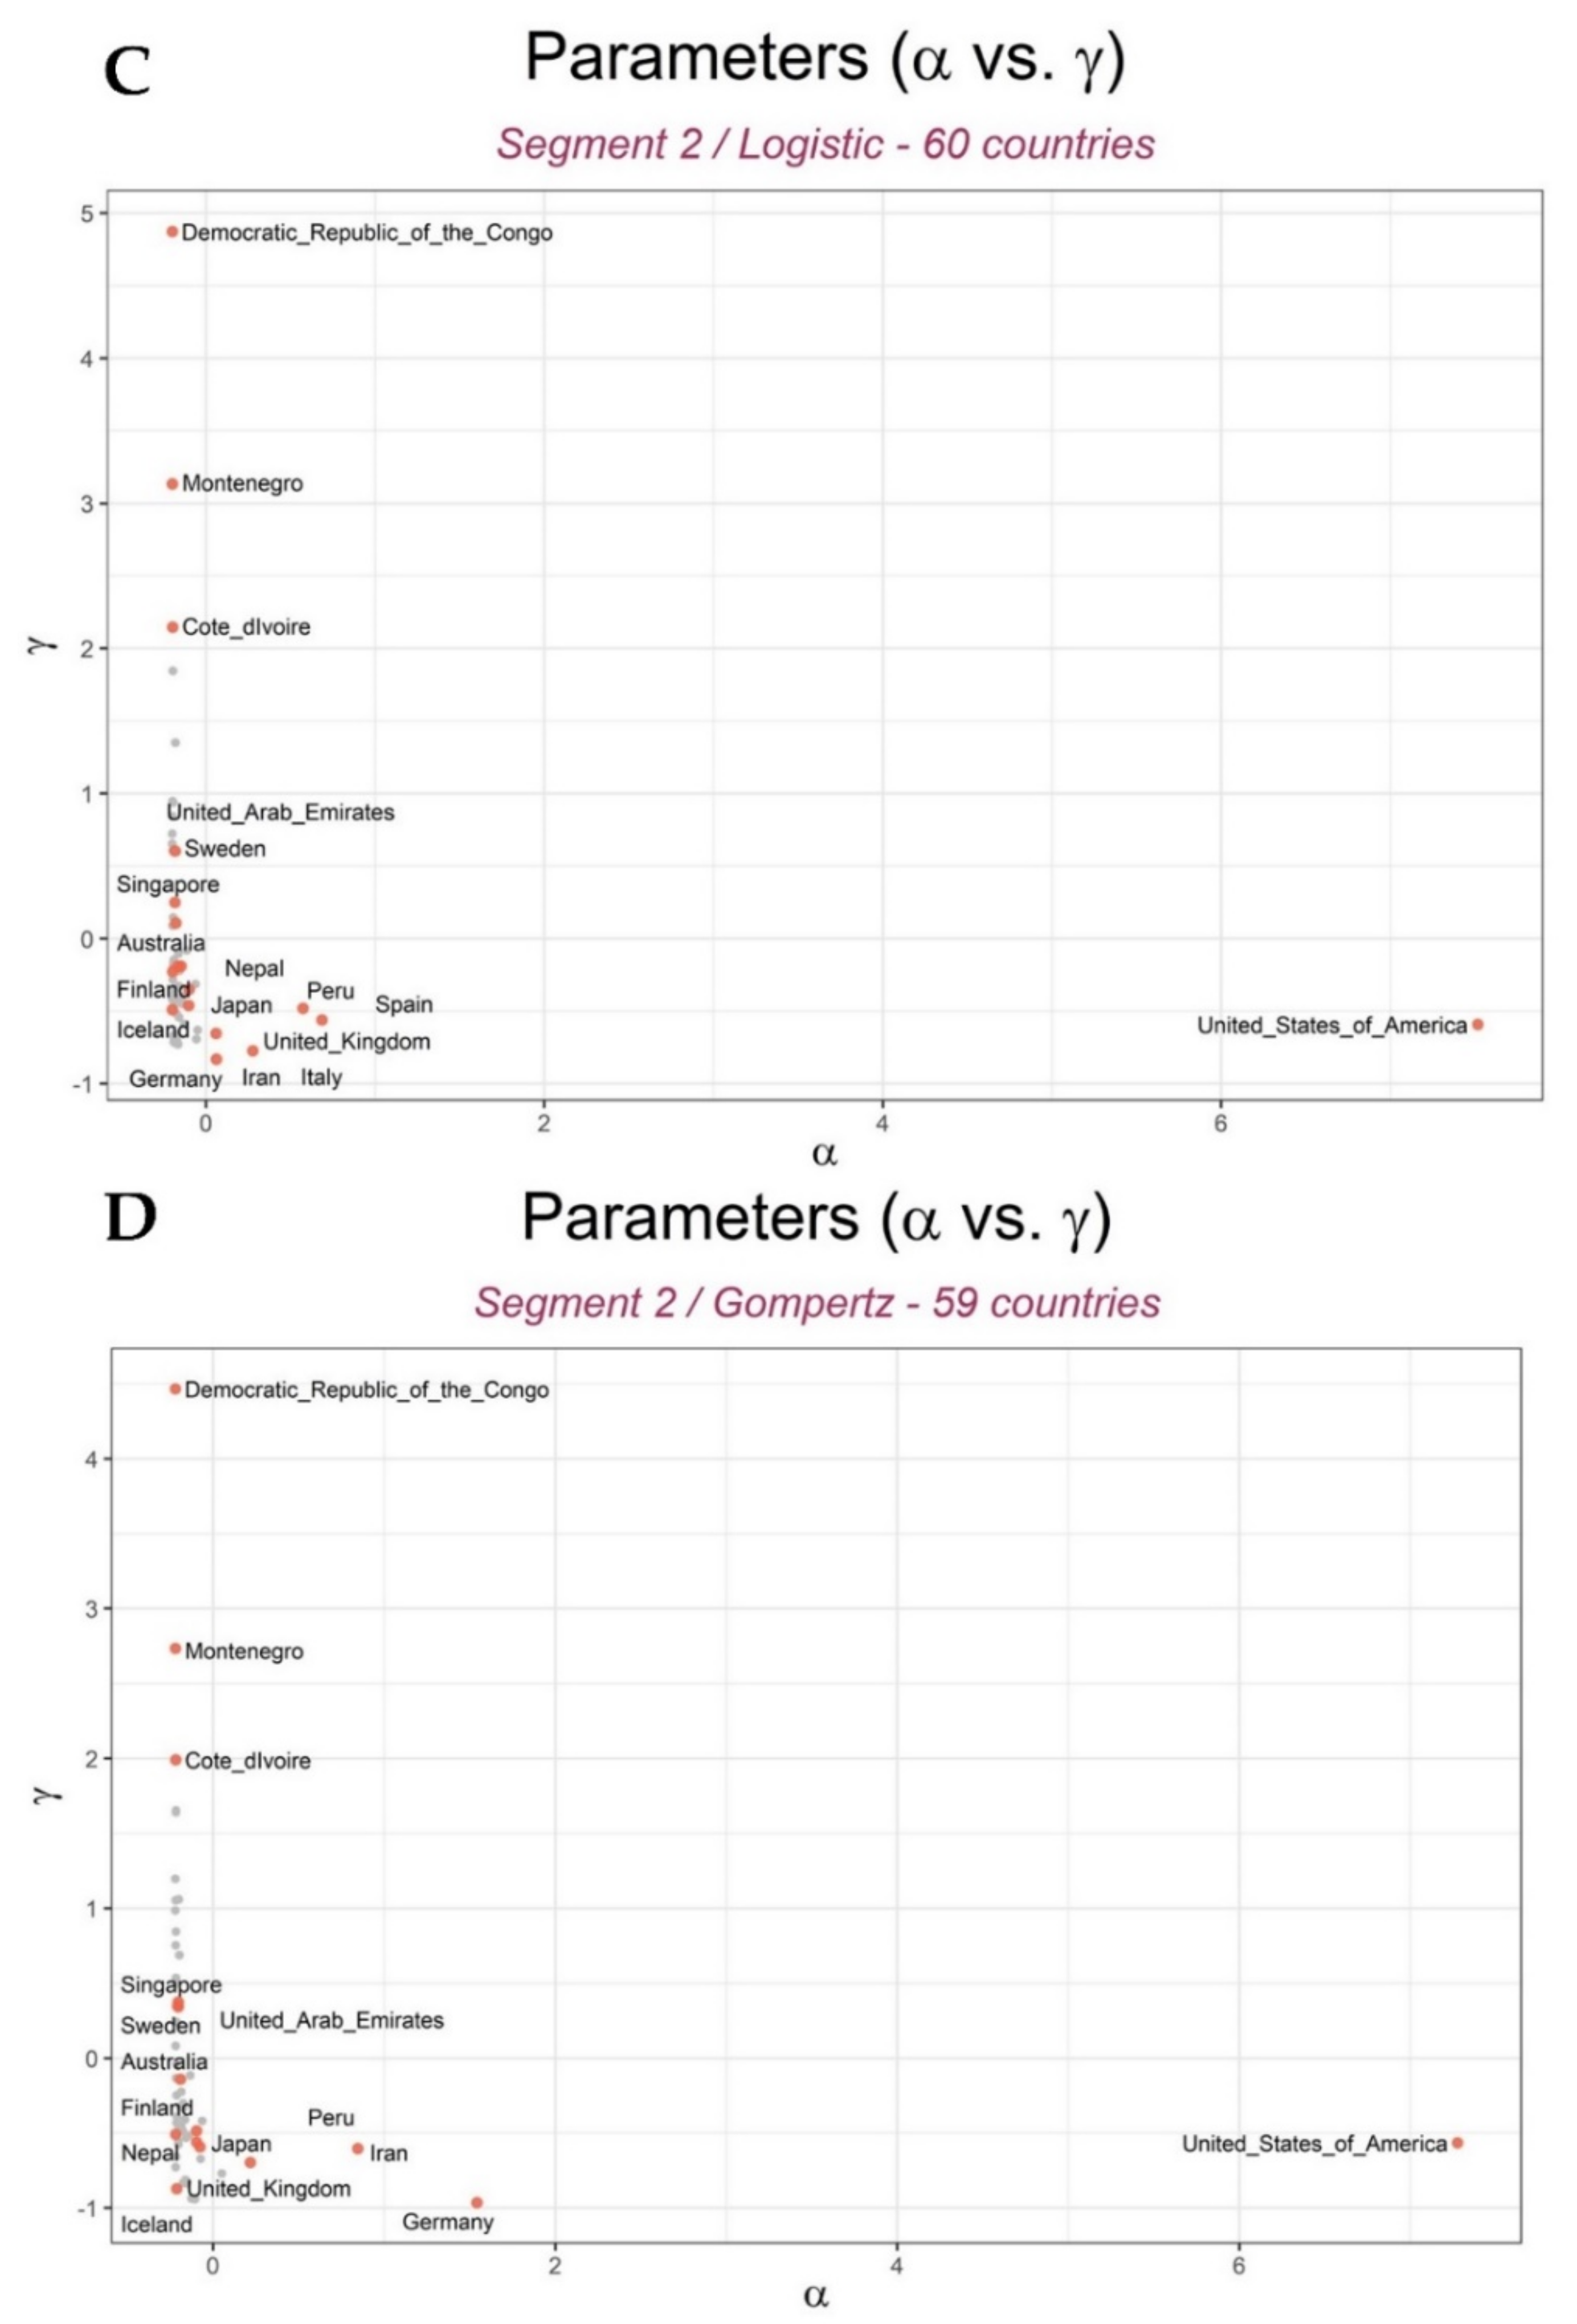
3.1. Growth Curve Models Predicted the Spread of COVID-19 across Countries
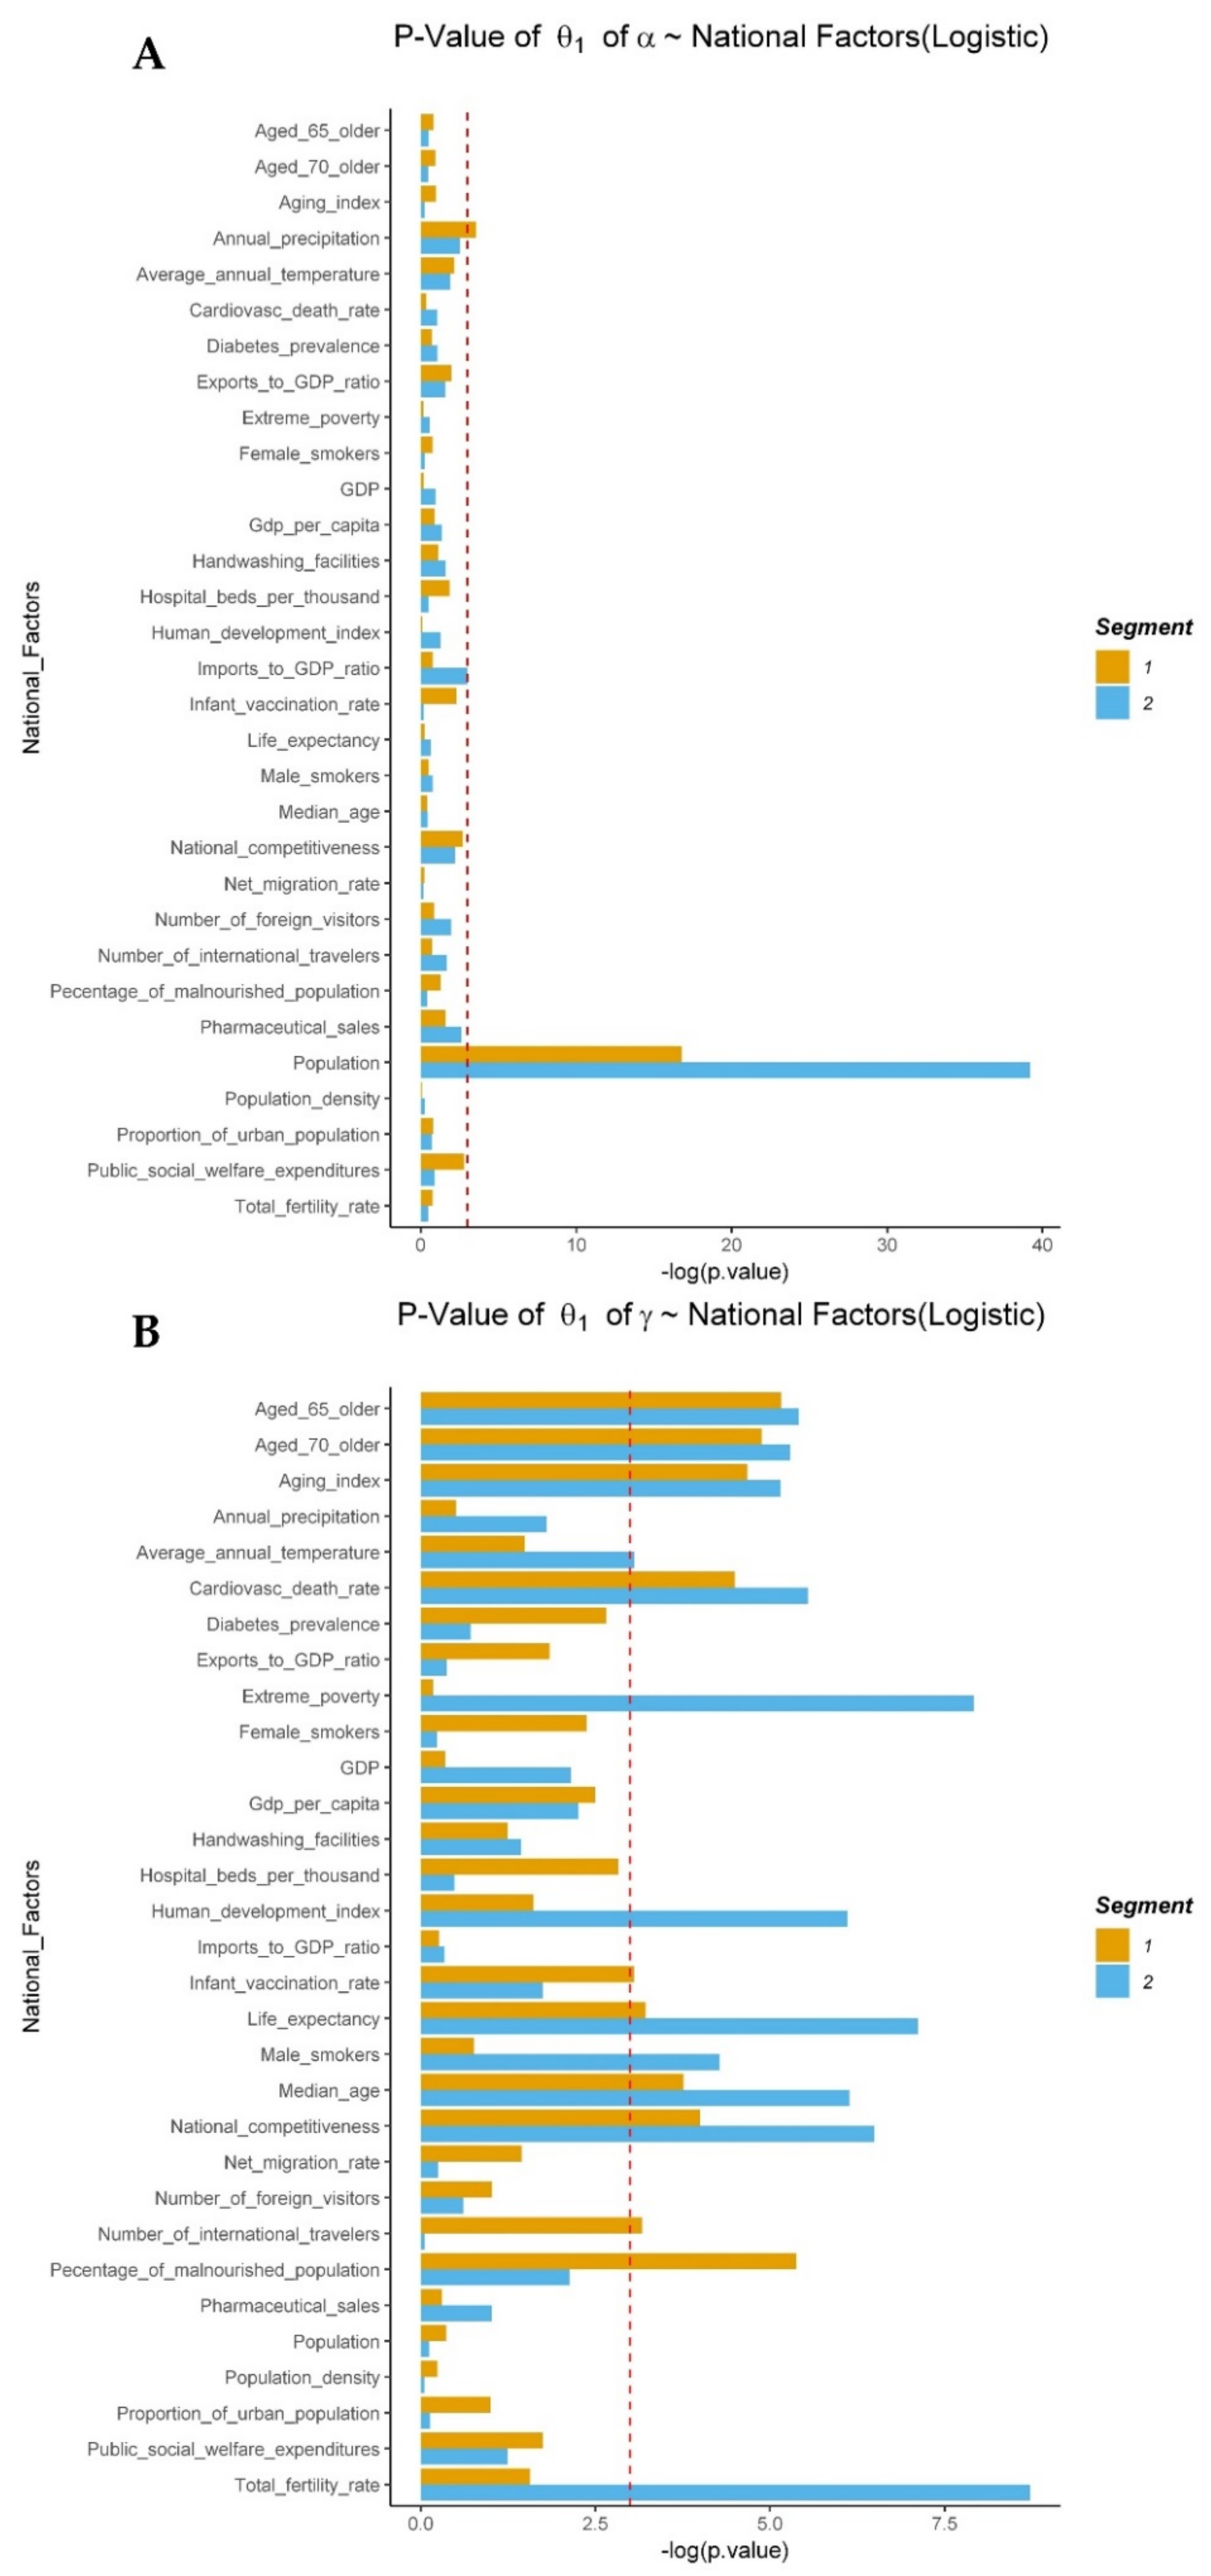
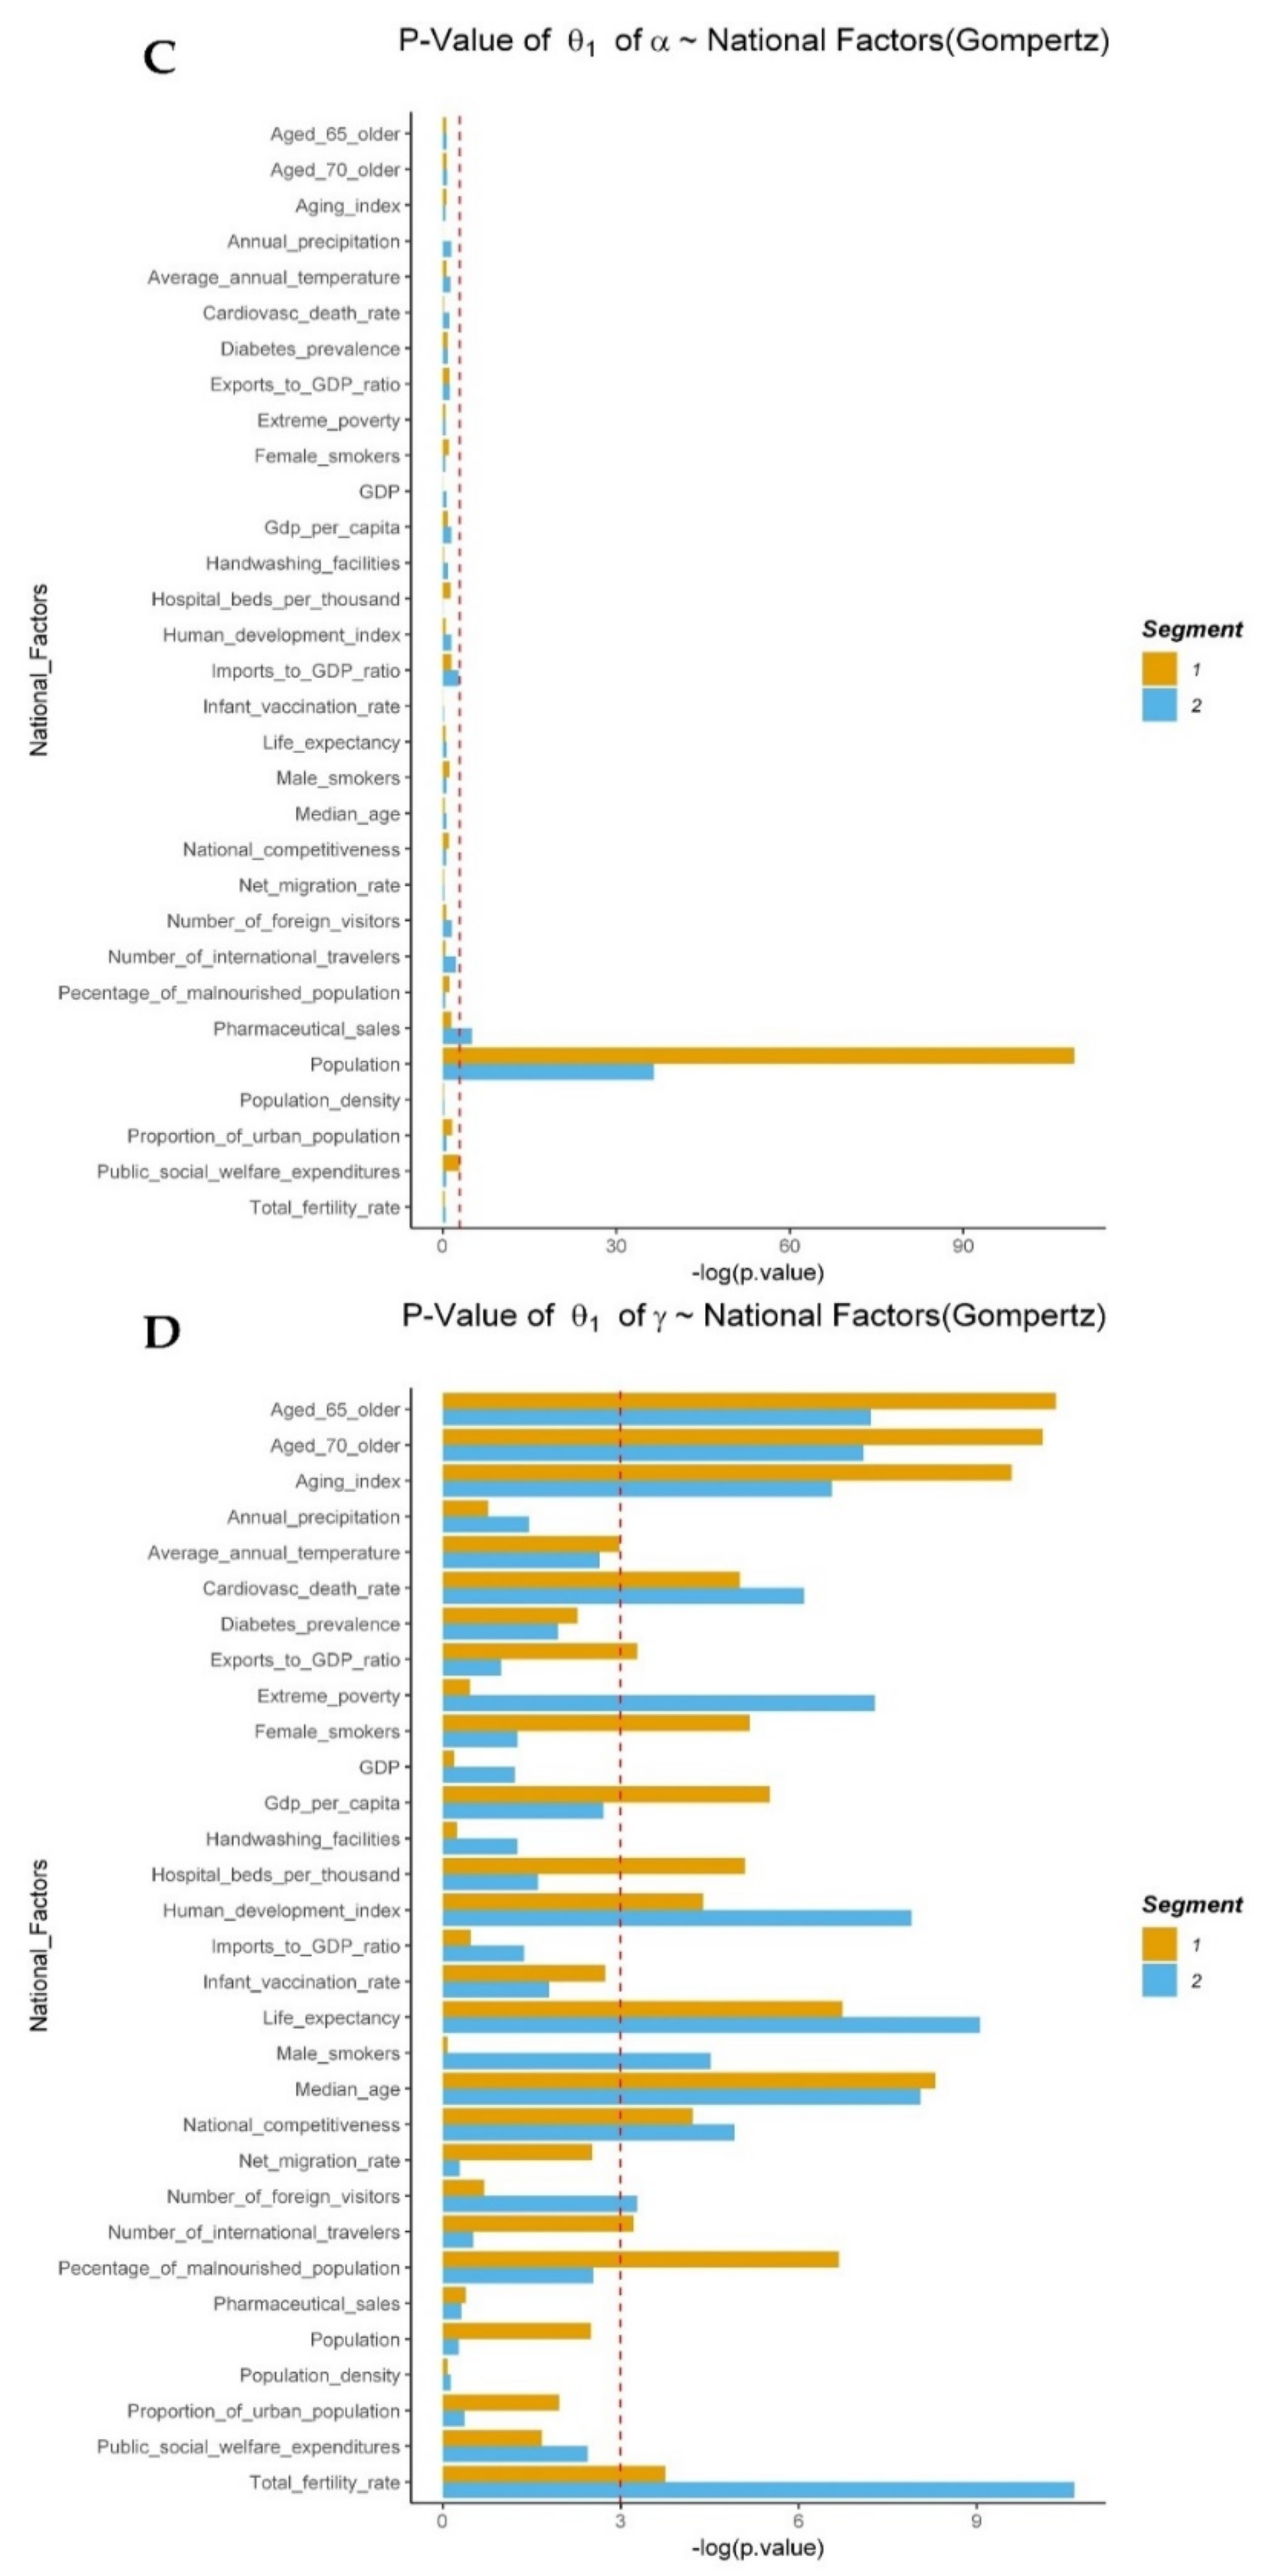
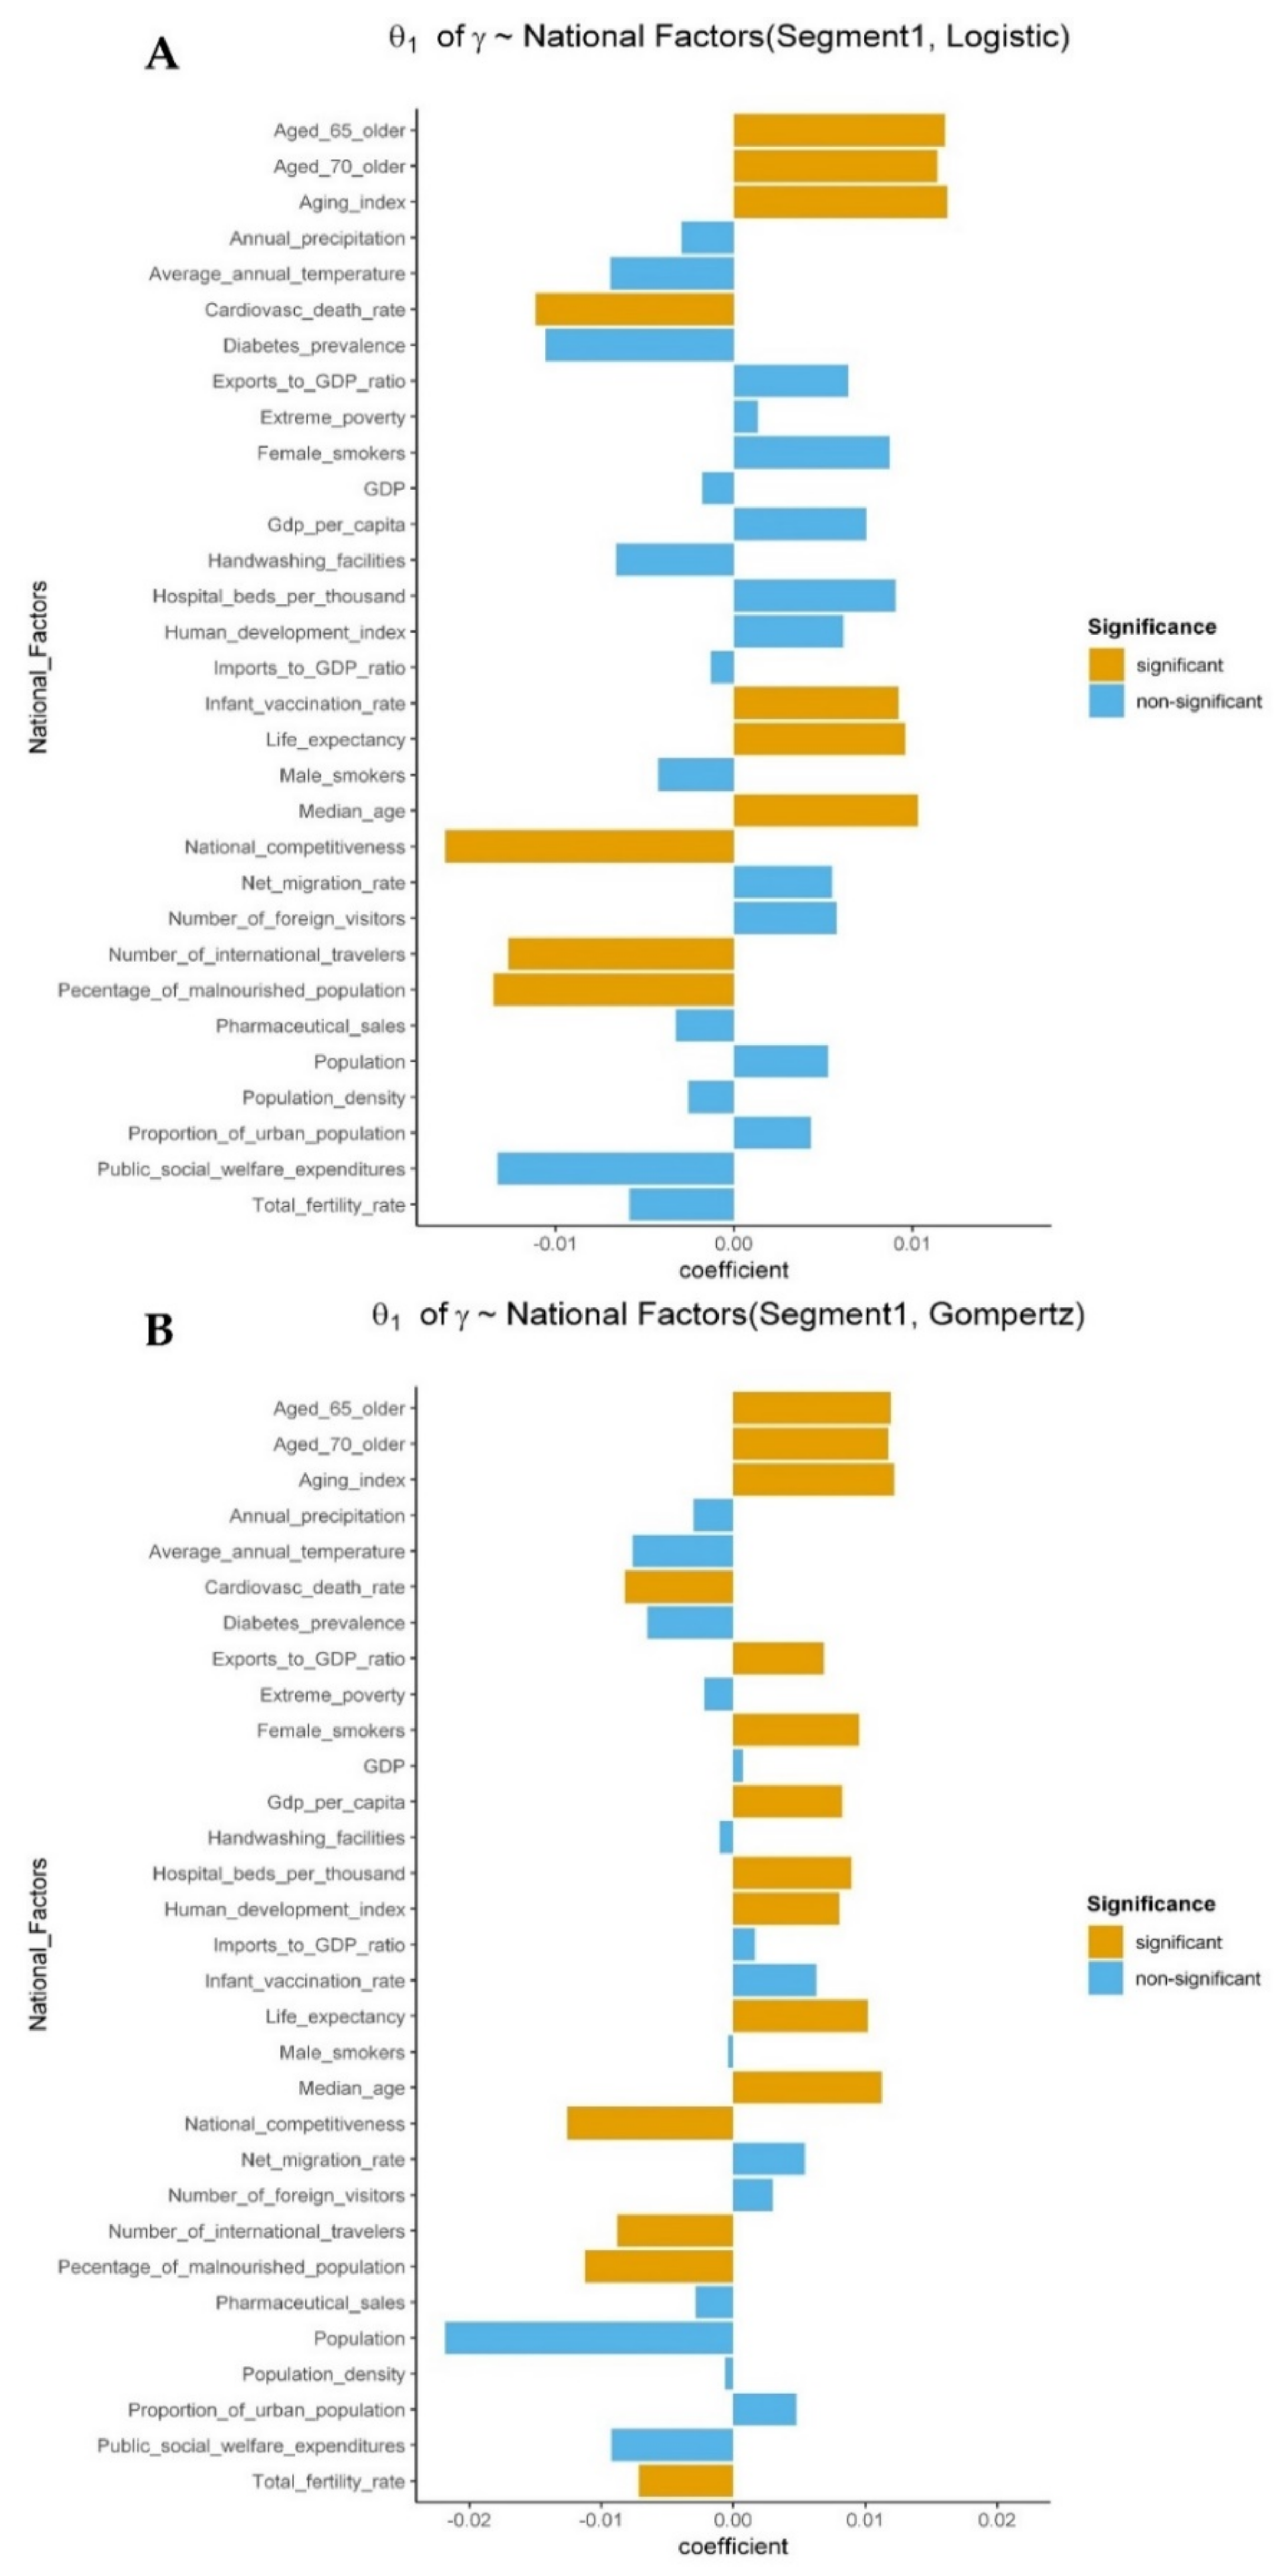
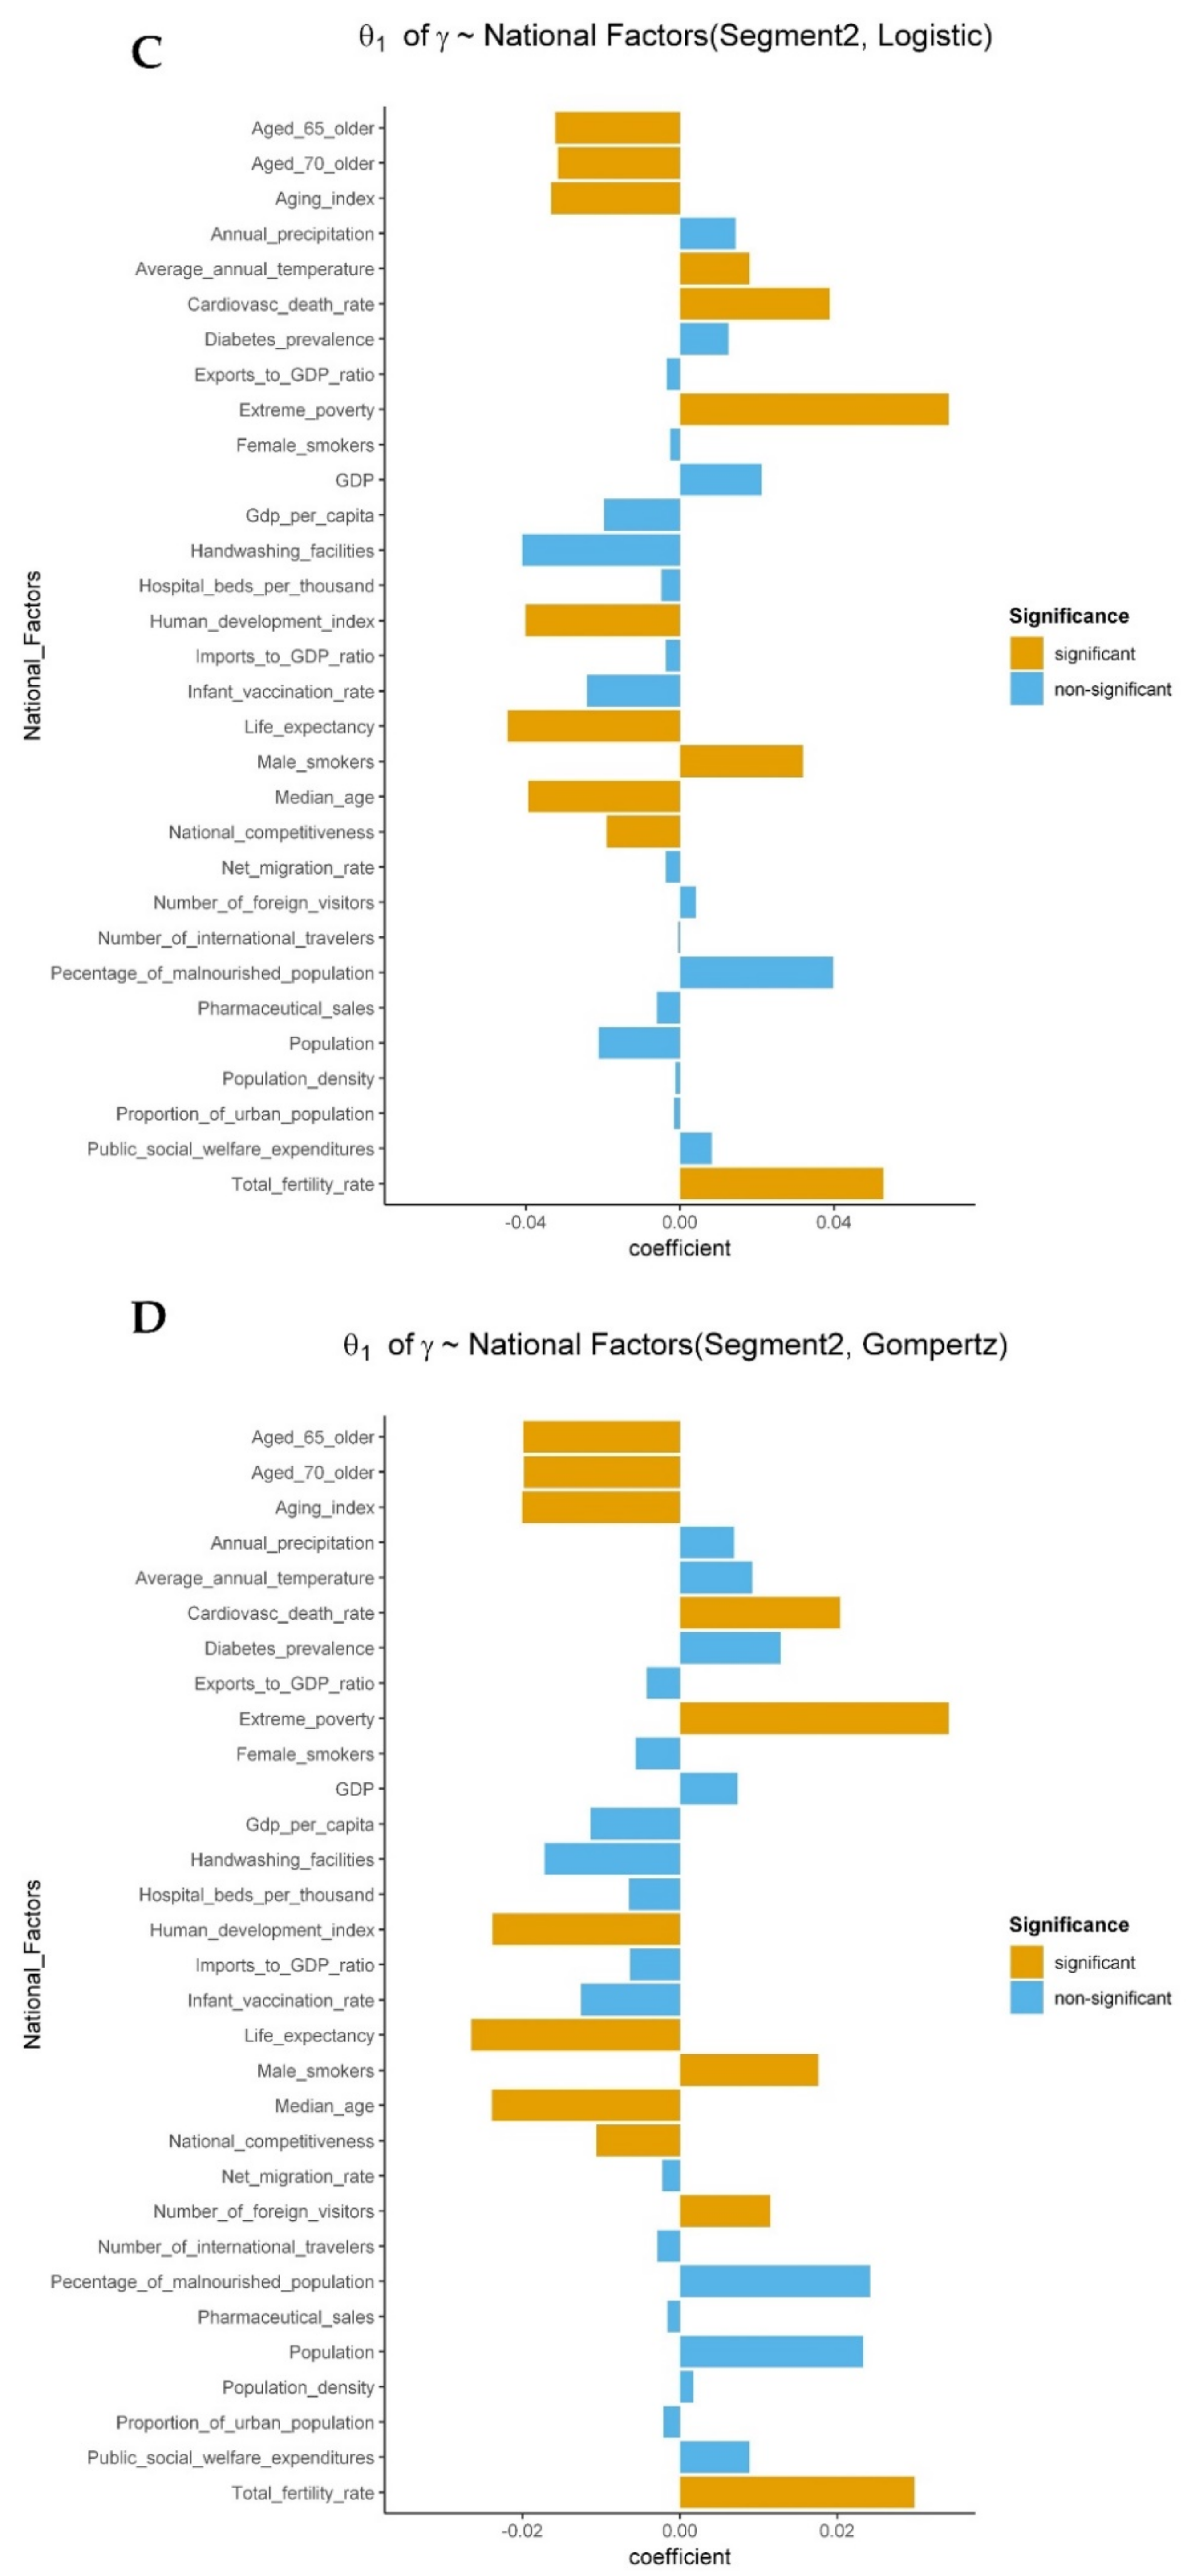
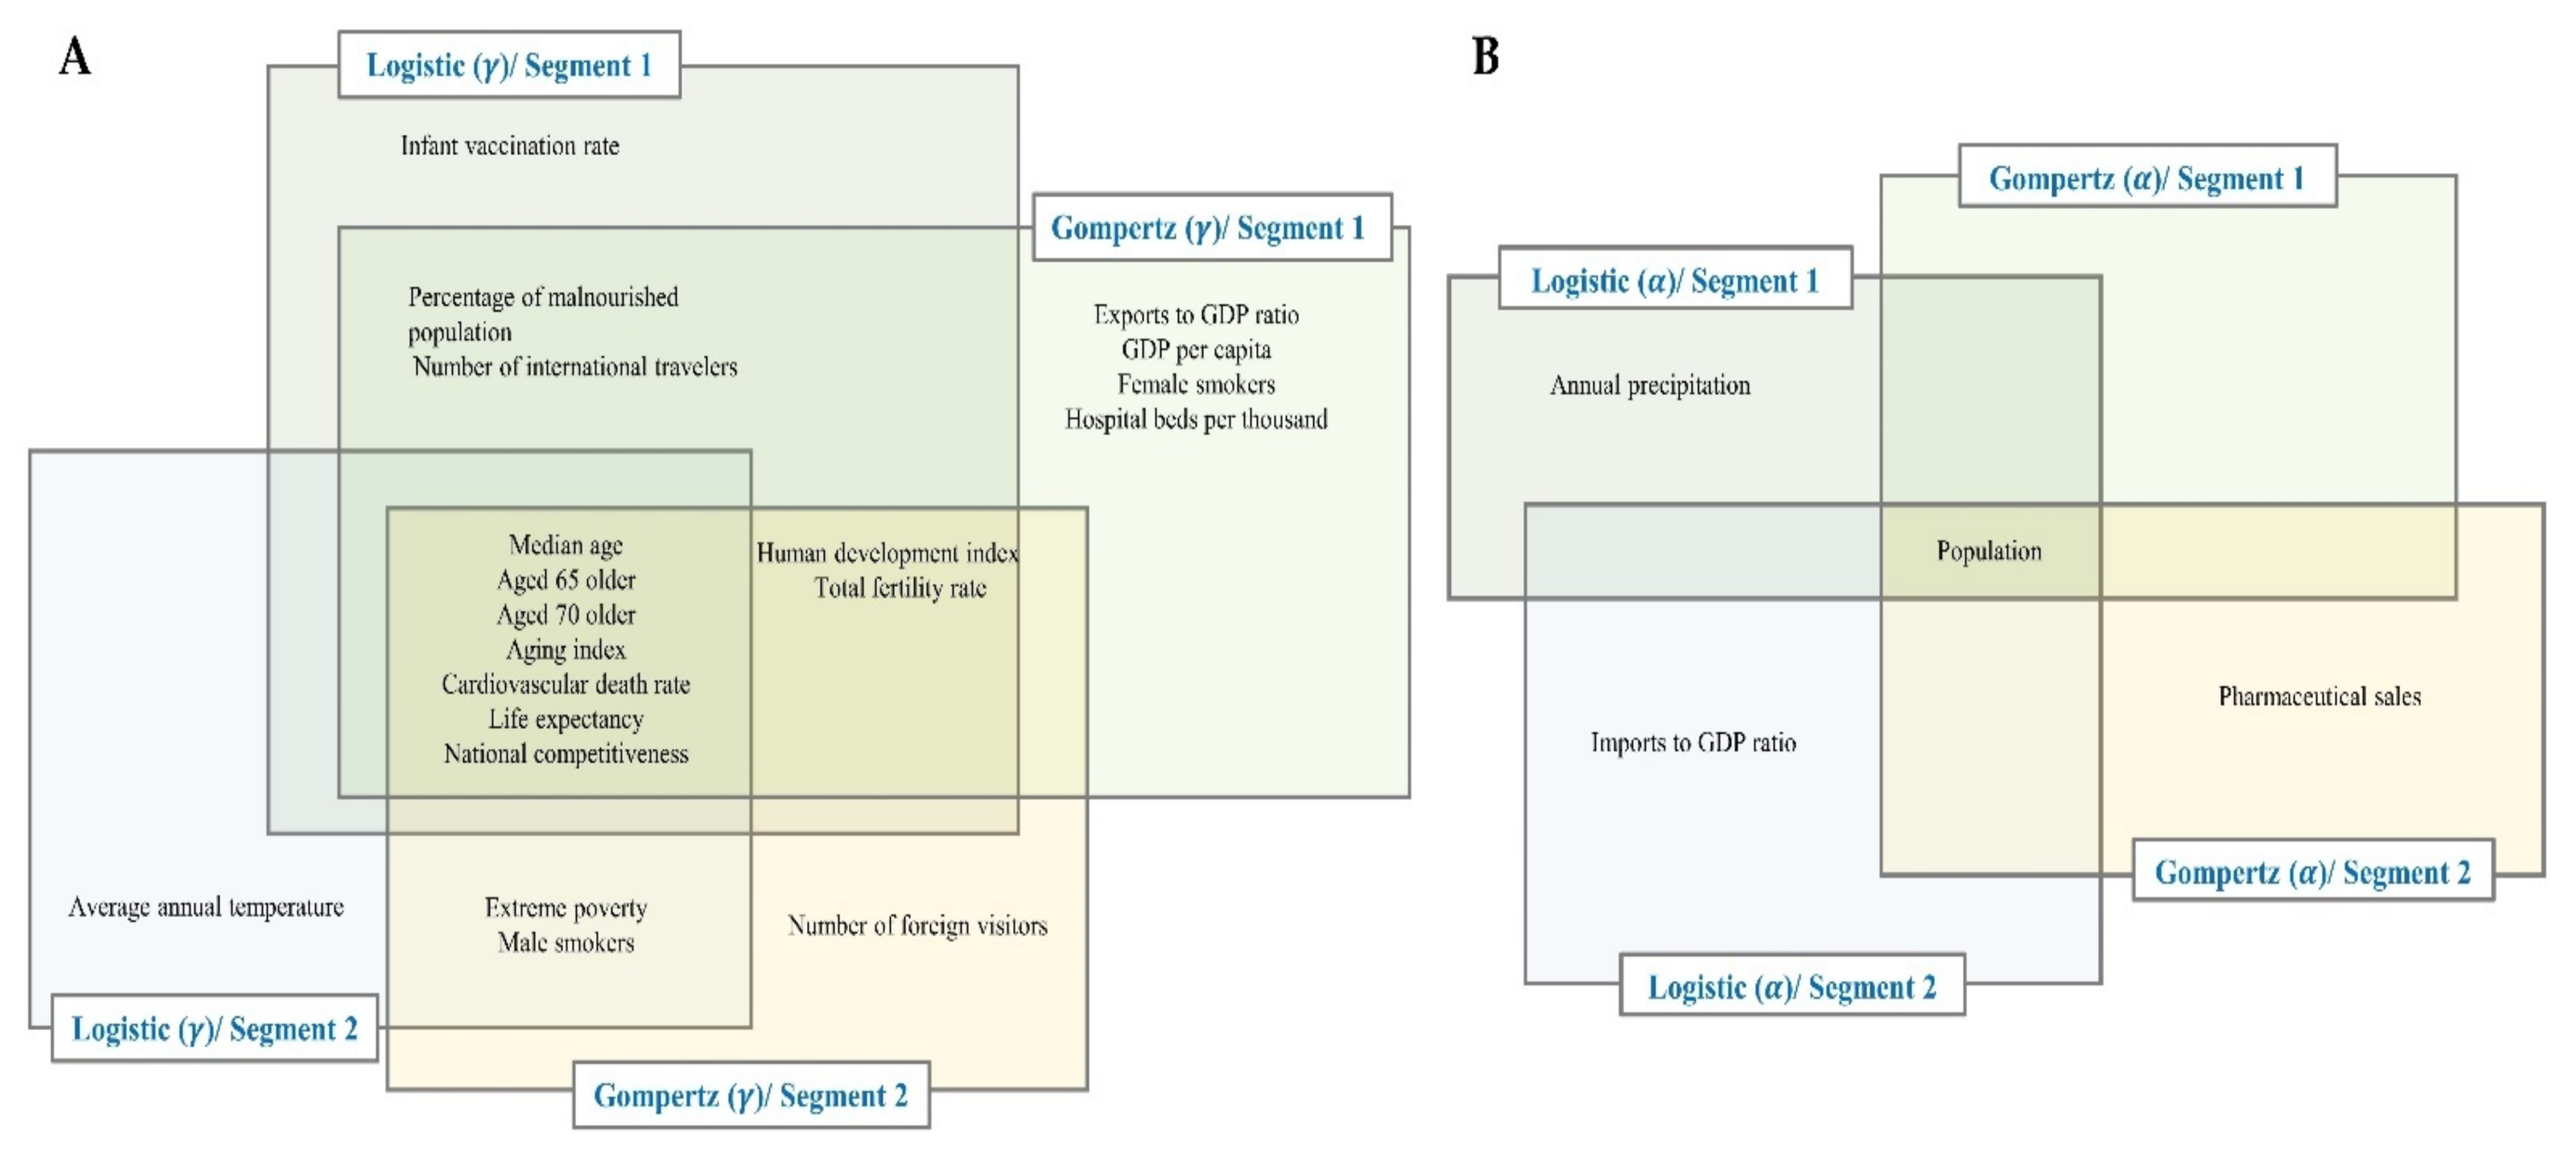
3.2. The Relationship between National Factors and the Spread of COVID-19
4. Discussion
5. Conclusions
Supplementary Materials
Author Contributions
Funding
Institutional Review Board Statement
Informed Consent Statement
Data Availability Statement
Conflicts of Interest
References
- Priyadarsini, S.L.; Suresh, M. Factors influencing the epidemiological characteristics of pandemic COVID 19: A TISM approach. Int. J. Healthc. Manag. 2020, 13, 89–98. [Google Scholar] [CrossRef] [Green Version]
- Li, Q.; Guan, X.; Wu, P.; Wang, X.; Zhou, L.; Tong, Y.; Ren, R.; Leung, K.S.M.; Lau, E.H.Y.; Wong, J.Y.; et al. Early Transmission Dynamics in Wuhan, China, of Novel Coronavirus-Infected Pneumonia. N. Engl. J. Med. 2020, 382, 1199–1207. [Google Scholar] [CrossRef] [PubMed]
- WHO Director-General’s Opening Remarks. Available online: https://www.who.int/dg/speeches/detail/whComingsoono-director-general-s-opening-remarks-at-the-media-briefing-on-covid-19–11-march-2020 (accessed on 8 February 2021).
- Worldometer. Available online: https://www.worldometers.info/coronavirus/ (accessed on 8 February 2021).
- Bootsma, M.C.J.; Ferguson, N.M. The effect of public health measures on the 1918 influenza pandemic in U.S. cities. Proc. Natl. Acad. Sci. USA 2007, 104, 7588–7593. [Google Scholar] [CrossRef] [PubMed] [Green Version]
- Xu, H.; Yan, C.; Fu, Q.; Xiao, K.; Yu, Y.; Han, D.; Wang, W.; Cheng, J. Possible environmental effects on the spread of COVID-19 in China. Sci. Total Environ. 2020, 731, 139211. [Google Scholar] [CrossRef] [PubMed]
- Nakada, L.Y.K.; Urban, R.C. COVID-19 pandemic: Environmental and social factors influencing the spread of SARS-CoV-2 in São Paulo, Brazil. Environ. Sci. Pollut. Res. 2020, 1–7. [Google Scholar] [CrossRef] [PubMed]
- Ahmadi, M.; Sharifi, A.; Dorosti, S.; Ghoushchi, S.J.; Ghanbari, N. Investigation of effective climatology parameters on COVID-19 outbreak in Iran. Sci. Total Environ. 2020, 729, 138705. [Google Scholar] [CrossRef]
- Hamidi, S.; Sabouri, S.; Ewing, R. Does Density Aggravate the COVID-19 Pandemic? J. Am. Plan. Assoc. 2020, 86, 495–509. [Google Scholar] [CrossRef]
- Tobías, A. Evaluation of the lockdowns for the SARS-CoV-2 epidemic in Italy and Spain after one month follow up. Sci. Total Environ. 2020, 725, 138539. [Google Scholar] [CrossRef]
- Harmooshi, N.N.; Shirbandi, K.; Rahim, F. Environmental concern regarding the effect of humidity and temperature on 2019-nCoV survival: Fact or fiction. Environ. Sci. Pollut. Res. 2020, 27, 36027–36036. [Google Scholar] [CrossRef]
- Pramanik, M.; Udmale, P.; Bisht, P.; Chowdhury, K.; Szabo, S.; Pal, I. Climatic factors influence the spread of COVID-19 in Russia. Int. J. Environ. Health Res. 2020, 1–15. [Google Scholar] [CrossRef]
- Prata, D.N.; Rodrigues, W.; Bermejo, P.H.D.S. Temperature significantly changes COVID-19 transmission in (sub)tropical cities of Brazil. Sci. Total Environ. 2020, 729, 138862. [Google Scholar] [CrossRef]
- Cheng, C.; Barceló, J.; Hartnett, A.S.; Kubinec, R.; Messerschmidt, L. COVID-19 Government Response Event Dataset (CoronaNet v.1.0). Nat. Hum. Behav. 2020, 4, 756–768. [Google Scholar] [CrossRef]
- Institute of Medicine (US) Forum on Microbial Threats. Ethical and Legal Considerations in Mitigating Pandemic Disease: Workshop Summary. In Learning from Pandemics Past; National Academies Press: Washington, DC, USA, 2007. Available online: https://www.ncbi.nlm.nih.gov/books/NBK54171/ (accessed on 8 February 2021).
- School of Public Health, University of Michigan. What Makes a “Wave” of Disease? An Epidemiologist Explains. Available online: https://sph.umich.edu/pursuit/2020posts/what-makes-a-wave-of-disease.html (accessed on 8 February 2021).
- Our World in Data. Research and Data to Make Progress against the World’s Largest Problems. Available online: https://ourworldindata.org/ (accessed on 8 February 2021).
- Korean Statistical Information Service. Available online: http://kosis.kr/eng/ (accessed on 8 February 2021).
- European Centre for Disease Prevention and Control. COVID-19—Situation Updates. Available online: https://www.ecdc.europa.eu/en/covid-19-pandemic (accessed on 8 February 2021).
- European Centre for Disease Prevention and Control. Download Historical Data (to 14 December 2020) on the Daily Number of New Reported COVID-19 Cases and Deaths Worldwide. Available online: https://www.ecdc.europa.eu/en/publications-data/download-todays-data-geographic-distribution-covid-19-cases-worldwide (accessed on 8 February 2021).
- European Centre for Disease Prevention and Control. Available online: https://opendata.ecdc.europe.eu/covid19/casedistribution/csv (accessed on 8 February 2021).
- Davies, N.G.; Klepac, P.; Liu, Y.; Prem, K.; Jit, M.; Pearson, C.A.B.; Quilty, B.J.; Kucharski, A.J.; Gibbs, H.; Clifford, S.; et al. Age-Dependent Effects in the Transmission and Control of COVID-19 Epidemics. Nat. Med. 2020, 26, 1205–1211. [Google Scholar] [CrossRef] [PubMed]
- Data on COVID-19 (Coronavirus) by Our World in Data. Available online: https://github.com/owid/covid-19-data/tree/master/public/data (accessed on 8 February 2021).
- Nioi, M.; Napoli, P.E.; Lobina, J.; Fossarello, M.; D’Aloja, E. COVID-19 and Italian Healthcare Workers From the Initial Sacrifice to the mRNA Vaccine: Pandemic Chrono-History, Epidemiological Data, Ethical Dilemmas, and Future Challenges. Front. Public Health 2021, 8, 591900. [Google Scholar] [CrossRef] [PubMed]
- Aabed, K.; Lashin, M.M. An analytical study of the factors that influence COVID-19 spread. Saudi J. Biol. Sci. 2021, 28, 1177–1195. [Google Scholar] [CrossRef] [PubMed]
- Farseev, A.; Chu-Farseeva, Y.Y.; Qi, Y.; Loo, D.B. Understanding Economic and Health Factors Impacting the Spread of COVID-19 Disease. medRxiv 2020. [Google Scholar] [CrossRef]
- Fortaleza, C.M.C.B.; Guimarães, R.B.; de Almeida, G.B.; Pronunciate, M.; Ferreira, C.P. Taking the inner route: Spatial and demographic factors affecting vulnerability to COVID-19 among 604 cities from inner São Paulo State, Brazil. Epidemiol. Infect. 2020, 148, e118. [Google Scholar] [CrossRef]
- Bhadra, A.; Mukherjee, A.; Sarkar, K. Impact of population density on Covid-19 infected and mortality rate in India. Model. Earth Syst. Environ. 2021, 7, 623–629. [Google Scholar] [CrossRef]
- Bargain, O.; Aminjonov, U. “Poverty and COVID-19 in Developing Countries”, Bordeaux Economics Working Papers 2020-08, Groupe de Recherche en Economie Théorique et Appliquée (GREThA). 2020. Available online: https://ideas.repec.org/p/grt/bdxewp/2020-08.html (accessed on 8 February 2021).
- Jia, L.; Li, K.; Jiang, Y.; Guo, X. Prediction and analysis of coronavirus disease 2019. arXiv 2020, arXiv:2003.05447. [Google Scholar]
- The Conversation. What Makes a ‘Wave’ of Disease? An Epidemiologist Explains. Available online: https://theconversation.com/what-makes-a-wave-of-disease-an-epidemiologist-explains-141573 (accessed on 8 February 2021).
- Nadaraya, E.A. On Estimating Regression. Theory Probab. Its Appl. 1964, 9, 141–142. [Google Scholar] [CrossRef]
- Watson, G.S. Smooth regression analysis. Sankhyā Indian J. Stat. Ser. A 1964, 26, 359–372. [Google Scholar]
- Bierens, H.J. The Nadaraya—Watson kernel regression function estimator. In Topics in Advanced Econometrics; Cambridge University Press: New York, NY, USA, 1994; pp. 212–247. ISBN 0-521-41900-X. [Google Scholar]
- The World Bank. Data Bank. Available online: https://databank.worldbank.org/home (accessed on 8 February 2021).
- Franses, P.H. A method to select between Gompertz and logistic trend curves. Technol. Forecast. Soc. Chang. 1994, 46, 45–49. [Google Scholar] [CrossRef] [Green Version]
- Countries in the World by Population. 2021. Available online: https://www.worldometers.info/world-population/population-by-country/ (accessed on 8 February 2021).
- Worldometer. Available online: https://www.worldometers.info/coronavirus/#countries (accessed on 8 February 2021).
- Anzai, A.; Kobayashi, T.; Linton, N.M.; Kinoshita, R.; Hayashi, K.; Suzuki, A.; Yang, Y.; Jung, S.-M.; Miyama, T.; Akhmetzhanov, A.R.; et al. Assessing the Impact of Reduced Travel on Exportation Dynamics of Novel Coronavirus Infection (COVID-19). J. Clin. Med. 2020, 9, 601. [Google Scholar] [CrossRef] [PubMed] [Green Version]
- Alderton, G. Aging immunity. Science 2020, 369, 264–266. [Google Scholar] [CrossRef]
- World Health Organization. Ageing and Health. Available online: https://www.who.int/news-room/fact-sheets/detail/ageing-and-health (accessed on 8 February 2021).
- Hirokawa, K.; Utsuyama, M.; Kasai, M.; Kurashima, C. Aging and Immunity. Pathol. Int. 2008, 42, 537–548. [Google Scholar] [CrossRef] [PubMed]
- Centers for Disease Control and Prevention. COVID-19—Older Adults. Available online: https://www.cdc.gov/coronavirus/2019-ncov/need-extra-precautions/older-adults.html (accessed on 8 February 2021).
- Mueller, A.L.; McNamara, M.; Sinclair, D.A. Why does COVID-19 disproportionately affect older people? Aging 2020, 12, 9959–9981. [Google Scholar] [CrossRef]
- Broeck, J.V.D.; Eeckels, R.; Vuylsteke, J. Influence of nutritional status on child mortality in rural Zaire. Lancet 1993, 341, 1491–1495. [Google Scholar] [CrossRef]
- Our World in Data. In Which Countries Do People Smoke the Most? Available online: https://ourworldindata.org/which-countries-smoke-most (accessed on 8 February 2021).
- Ho, F.K.; Petermann-Rocha, F.; Gray, S.R.; Jani, B.D.; Katikireddi, S.V.; Niedzwiedz, C.L.; Foster, H.; Hastie, C.E.; Mackay, D.F.; Gill, J.M.R.; et al. Is older age associated with COVID-19 mortality in the absence of other risk factors? General population cohort study of 470,034 participants. PLoS ONE 2020, 15, e0241824. [Google Scholar] [CrossRef]
- Gülsen, A.; Yigitbas, B.A.; Uslu, B.; Drömann, D.; Kilinc, O. The Effect of Smoking on COVID-19 Symptom Severity: Systematic Review and Meta-Analysis. Pulm. Med. 2020, 2020, 7590207. [Google Scholar] [CrossRef]
- Wenzl, T. Smoking and COVID-19—A Review of Studies Suggesting a Protective Effect of Smoking against COVID-19; EUR 30373 EN; Publications Office of the European Union: Luxembourg, 2020; p. JRC121837. ISBN 978-92-76-22062-6. [Google Scholar] [CrossRef]
- Man, W.D.C.; Man, W.D.C.; Weber, M.; Weber, M.; Palmer, A.; Palmer, A.; Schneider, G.; Wadda, R.; Jaffar, S.; Jaffar, S.; et al. Nutritional status of children admitted to hospital with different diseases and its relationship to outcome in The Gambia, West Africa. Trop. Med. Int. Health 1998, 3, 678–686. [Google Scholar] [CrossRef] [PubMed] [Green Version]
- Fernandez, I.D.; Himes, J.H.; De Onis, M. Prevalence of nutritional wasting in populations: Building explanatory models using secondary data. Bull. World Health Organ. 2002, 80, 282–291. [Google Scholar] [PubMed]
- World Health Organization. Novel Coronavirus (2019-nCoV) Situation Report-21. 2020. Available online: https://www.who.int/docs/default-source/coronaviruse/situation-reports/20200210-sitrep-21-ncov.pdf (accessed on 8 February 2021).
- Müller, O.; Krawinkel, M. Malnutrition and health in developing countries. Can. Med. Assoc. J. 2005, 173, 279–286. [Google Scholar] [CrossRef] [PubMed] [Green Version]
- Saunders, J.; Smith, T. Malnutrition: Causes and consequences. Clin. Med. 2010, 10, 624–627. [Google Scholar] [CrossRef] [PubMed]
- Centers for Disease Control and Prevention. Domestic Travel During COVID-19. Available online: https://www.cdc.gov/coronavirus/2019-ncov/travelers/travel-during-covid19.html (accessed on 8 February 2021).
- Siegenfeld, A.F.; Bar-Yam, Y. The impact of travel and timing in eliminating COVID-19. Commun. Phys. 2020, 3, 204. [Google Scholar] [CrossRef]
- You, J. Lessons From South Korea’s Covid-19 Policy Response. Am. Rev. Public Adm. 2020, 50, 801–808. [Google Scholar] [CrossRef]
- Cha, V.; Kim, D. A Timeline of South Korea’s Response to COVID-19, Center for Strategic and International Studies. 2020. Available online: https://www.csis.org/analysis/timeline-south-koreas-response-covid-19 (accessed on 8 February 2021).
- The World Bank. Poverty—Overview. Available online: https://www.worldbank.org/en/topic/poverty/overview#:~:text=The%20global%20extreme%20poverty%20rate,%245.50%20a%20day%20in%202017 (accessed on 4 February 2021).
- El-Sayed, A.; Kamel, M. Climatic changes and their role in emergence and re-emergence of diseases. Environ. Sci. Pollut. Res. 2020, 27, 22336–22352. [Google Scholar] [CrossRef]
- Rayan, R.A. Seasonal variation and COVID-19 infection pattern: A gap from evidence to reality. Curr. Opin. Environ. Sci. Health 2021, 20, 100238. [Google Scholar] [CrossRef]
- Our World in Data. Global Extreme Poverty. Available online: https://ourworldindata.org/extreme-poverty#:~:text=We%20can%20also%20see%20that,of%20important%20changes%20across%20time. (accessed on 4 February 2021).
- UNICEF. West and Central Africa: More than 15 Million Cases of Acute Malnutrition Expected in 2020. Available online: https://www.unicef.org/press-releases/west-and-central-africa-more-15-million-cases-acute-malnutrition-expected-2020 (accessed on 4 February 2021).
- Annan, K. Data can help to end malnutrition across Africa. Nat. Cell Biol. 2018, 555, 7. [Google Scholar] [CrossRef]
- World by Map. Young Population. Available online: https://www.citypopulation.de/en/world/bymap/youngpopulation/ (accessed on 4 February 2021).
- Worldometer. Life Expectancy of the World Population. Available online: https://www.worldometers.info/demographics/life-expectancy/ (accessed on 4 February 2021).
- Percentage of Population Who Smoke on a Daily Basis in Selected Countries as of 2017. Available online: https://www.statista.com/statistics/236600/proportion-of-smokers-in-the-population-of-selected-countries/ (accessed on 8 February 2021).
- Worldometer. GDP by Country. Available online: https://www.worldometers.info/gdp/gdp-by-country/ (accessed on 4 February 2021).
- OECD/World Health Organization. Mortality from cardiovascular disease. In Health at a Glance: Asia/Pacific 2018: Meas-Uring Progress Towards Universal Health Coverage; OECD Publishing: Paris, France, 2018. [Google Scholar] [CrossRef]
- Finegold, J.A.; Asaria, P.; Francis, D.P. Mortality from ischaemic heart disease by country, region, and age: Statistics from World Health Organisation and United Nations. Int. J. Cardiol. 2013, 168, 934–945. [Google Scholar] [CrossRef] [Green Version]
- World Health Organization. Coronavirus Disease (COVID-19): Tobacco. Available online: https://www.who.int/westernpacific/news/q-a-detail/coronavirus-disease-covid-19-tobacco#:~:text=Tobacco%20smokers%20(cigarettes%2C,communal%20and%20social%20settings (accessed on 8 February 2021).
- Riou, J.; Althaus, C.L. Pattern of early human-to-human transmission of Wuhan 2019 novel coronavirus (2019-nCoV), December 2019 to January 2020. Eurosurveillance 2020, 25, 2000058. [Google Scholar] [CrossRef]
- Chan, J.F.W.; Yuan, S.; Kok, K.H.; To, K.K.W.; Chu, H.; Yamg, J.; Xing, F.; Liu, J.; Yip, C.C.Y.; Poon, R.W.S.; et al. A familial cluster of pneumonia associated with the 2019 novel coronavirus indicat-ing person-to-person transmission: A study of a family cluster. Lancet 2020, 395, 514–523. [Google Scholar] [CrossRef] [Green Version]
- D’Aloja, E.; Finco, G.; Demontis, R.; Napoli, P.E.; Fossarello, M.; Nioi, M. COVID-19 and medical liability: Italy denies the shield to its heroes. EClinicalMedicine 2020, 25, 100470. [Google Scholar] [CrossRef]
- Nioi, M.; Napoli, P.E.; Finco, G.; Demontis, R.; Fossarello, M.; d’Aloja, E. Fear of the COVID-19 and medical liability. Insights from a series of 130 consecutives medico-legal claims evaluated in a single institution during SARS-CoV-2-related pandemic. Signa Vitae A J. Intensiv. Care Emerg. Med. 2021, 17, 79–85. [Google Scholar] [CrossRef]
- Zhang, X.; Ma, R.; Wang, L. Predicting turning point, duration and attack rate of COVID-19 outbreaks in major Western countries. Chaos Solitons Fractals 2020, 135, 109829. [Google Scholar] [CrossRef] [PubMed]
- Singh, R.; Adhikari, R. Age-structured impact of social distancing on the COVID-19 epidemic in India. arXiv 2020, arXiv:2003.12055. [Google Scholar]
- Hellewell, J.; Abbott, S.; Gimma, A.; Bosse, N.I.; Jarvis, C.I.; Russell, T.W.; Munday, J.D.; Kucharski, A.J.; Edmunds, W.J.; Sun, F.; et al. Feasibility of controlling covid-19 outbreaks by isolation of cases and contacts. Lancet Glob. Health 2020, 8, e488–e496. [Google Scholar] [CrossRef] [Green Version]
- Tanigawa, Y.; Rivas, M. Initial Review and Analysis of COVID-19 Host Genetics and Associated Phenotypes. Preprints 2020, 2020030356. [Google Scholar] [CrossRef] [Green Version]


Publisher’s Note: MDPI stays neutral with regard to jurisdictional claims in published maps and institutional affiliations. |
© 2021 by the authors. Licensee MDPI, Basel, Switzerland. This article is an open access article distributed under the terms and conditions of the Creative Commons Attribution (CC BY) license (https://creativecommons.org/licenses/by/4.0/).
Share and Cite
Kim, H.; Apio, C.; Ko, Y.; Han, K.; Goo, T.; Heo, G.; Kim, T.; Chung, H.W.; Lee, D.; Lim, J.; et al. Which National Factors Are Most Influential in the Spread of COVID-19? Int. J. Environ. Res. Public Health 2021, 18, 7592. https://doi.org/10.3390/ijerph18147592
Kim H, Apio C, Ko Y, Han K, Goo T, Heo G, Kim T, Chung HW, Lee D, Lim J, et al. Which National Factors Are Most Influential in the Spread of COVID-19? International Journal of Environmental Research and Public Health. 2021; 18(14):7592. https://doi.org/10.3390/ijerph18147592
Chicago/Turabian StyleKim, Hakyong, Catherine Apio, Yeonghyeon Ko, Kyulhee Han, Taewan Goo, Gyujin Heo, Taehyun Kim, Hye Won Chung, Doeun Lee, Jisun Lim, and et al. 2021. "Which National Factors Are Most Influential in the Spread of COVID-19?" International Journal of Environmental Research and Public Health 18, no. 14: 7592. https://doi.org/10.3390/ijerph18147592