The Relationship Between Chest Imaging Findings and the Viral Load of COVID-19
 Wei Zhao1
  Lei He
 Jun Liu
- 1Department of Radiology, The Second Xiangya Hospital, Central South University, Changsha, China
- 2Department of Radiology, The First People's Hospital of Yueyang, Yueyang, China
- 3Department of Laboratory Medicine, The Second Xiangya Hospital, Central South University, Changsha, China
- 4Department of Radiology Quality Control Center, Changsha, China
Purpose: We aimed to investigate the relationship between clinical characteristics, radiographic features, and the viral load of patients with coronavirus disease 2019 (COVID-19).
Methods and Materials: We retrospectively collected 56 COVID-19 cases from two institutions in Hunan province, China. The basal clinical characteristics, detail imaging features and follow-up CT changes were evaluated and the relationship with the viral load was analyzed.
Results: GGO (48, 85.7%) and vascular enlargement (44, 78.6%) were the most frequent signs in COVID-19 patients. Of the lesions, 64.3% of the margins were uneasily differentiated. However, no significant correlations were found in terms of leucocytes, neutrophils, lymphocytes, platelets, and C-reactive protein (all P > 0.05). In contrast, the uneasily differentiated margin was negatively correlated with the Ct value (r = −0.283, P = 0.042), that is, an uneasily differentiated margin indicated a lower Ct value (P = 0.043). Patients with a lower Ct value were likely to present a progress follow-up change (P = 0.022). The Ct value at baseline could predict a progress follow-up change with an AUC of 0.685 (Cut-off value = 29.48). All four patients with normal CT findings presented new lesion(s) on follow-up CT scans.
Conclusion: The viral load of COVID-19 is negatively correlated with an uneasily differentiated lesion margin on initial CT scan images and the Ct value should noted when making a diagnosis. In addition, following-up CT scans are necessary for patients who presented a normal CT at the initial diagnosis, especially for those with a low Ct value.
Key Results
- The uneasily differentiated margin was negatively correlated with the Ct value (r = −0.283, P = 0.042). In another words, an uneasily differentiated margin indicated a lower Ct value.
- Follow-up CT scans are necessary for patients with normal CT findings at initial diagnosis, especially for those with a low Ct value.
Introduction
A cluster of “unknown viral pneumonia” cases in Wuhan, China, was reported to World Health Organization (WHO) on December 31 2019 (1). A novel coronavirus, named severe acute respiratory syndrome coronavirus 2 (SARS-CoV-2) was identified through deep sequencing analysis (2). The outbreak of coronavirus disease 2019 (COVID-19), declared as a public health emergency of international concern (PHEIC) (3), has raised intense concerns around the world (1). The situation of the outbreak of COVID-19 in China has been brought under control (4), however, it still threatens the global medical system.
The genome sequence findings suggested that the presence of COVID-19 was closely related to another coronavirus termed severe acute respiratory syndrome (SARS)-related CoV (5). According to the latest study (6), the modality of COVID-19 is lower than that of SARS-CoV. It has been proven that the possibility of human-to human transmission (7, 8) and the R0 (i.e., the expected number of additional cases that one case will generate) ranges from 2 to 3 (9). Since the pathogenesis and the many comprehensive biological features (i.e., the microenvironment change and immune system reaction) of COVID-19 remain undiscovered, no specific antiviral agent and effective vaccine is available for treatment of this disease (10). Early detection, early diagnosis, early isolation, and early therapy remain the basic and essential strategies (11). Accurately assessing the disease severity of COVID-19 is still vital for clinical treatment scenarios and taking action in advance to avoid the presence of rapid progress. The viral load, inversely correlated with the cycle threshold (Ct) value, is considered as a parameter to reflect the disease severity (12–14) and indicate the transmission ability (15). However, not all hospitals reported the Ct value and only gave a binary diagnosis (i.e., positive or negative). Moreover, the assessment of the Ct value of the virus needs a real-time reverse transcription-polymerase chain reaction test (RT-PCR), which has inherent disadvantages including possible false positive results and a long turnaround time. Identifying the potential clinical alternative factors of the Ct value may help us assess the disease severity efficiently.
Several available clinical factors, such as white blood cell/neutrophil/lymphocyte count, might have the potential to reflect the severity of COVID-19 (6, 8, 16). The clinical importance of computed tomography (CT) is emphasized by the evidence of its value in the screening, diagnosis, and evaluation for the daily treatment of patients with COVID-19 in clinical practice (17–19). Moreover, the radiographic features are also reported to reflect the severity of COVID-19 (17–19). Therefore, all the aforementioned potential risk factors may throw light on the viral load indirectly and be considered as convenient and alternative factors to reflect the condition of COVID-19. However, the relationship between the aforementioned risk factors with viral load remains unclear.
In the present research, the purpose is to investigate the relationship between clinical characteristics, radiographic features, and Ct values in patients with COVID-19 and provide some hints for its early diagnosis.
Materials and Methods
This retrospective study was approved by our Medical Ethical Committee (Approved Number. 2020002), which waived the requirement for patients' informed consent referring to the CIOMS guideline.
Patients
In the study, we retrospectively included confirmed COVID-19 cases from Hunan Province, China. From January 16 2020 to February 6 2020, a search of the electronic system and the picture achieving and communication system (PACS) was performed to collect clinical features, laboratory values (the first one upon admission), epidemic characteristics, and all scanned CT images. The inclusion criteria included: (1) patients with PCR-confirmed COVID-19; (2) patients who underwent CT scanning before treatment; (3) the interval between a CT scan and throat swab sample being taken was <2 days; (4) the initial viral load was reported. The exclusion criteria included: (1) patients without PCR-confirmed COVID-19; (2) patients that had not undergone CT scanning before treatment; (3) the interval between a CT scan and throat swab sample being taken was more than 3 days; (4) No viral load was reported. Finally, 56 of 360 cases (30 women, 26 men; mean age, 50.34 years ± 15.65 [SD]; age range, 2–79 years) were included (27 patients from the Second Xiangya Hospital and 29 patients from the First People's Hospital of Yueyang). We characterized patients into four groups, mild type, common type, severe type, and fatal type based on the guideline of COVID-19 (Trial Version 7) (20), proposed by the China National Health Commission. Based on the different treatment regimens, we divided the included patients into two groups, non-severe group (mild type and common type) and severe group (severe type or fatal type). The interval between the onset of the disease and CT scans was 5 (2–8), presented as the median (Inter quartile range).
PCR Method
Duplex RT-PCR assays were performed by using throat swab samples in accordance with the protocol established by WHO (21). The nucleic acid was extracted by using an automatic system (Nathch CS, sansure biotich, Hunan). The nucleic acid amplification was performed on slan96P (Shanghai Hongshi Medical Technology Co., LTD). Each reaction tube was internally controlled. The Ct value was recorded for all samples and a Ct value <40 and >0 was considered as PCR positive.
Imaging Technique and Imaging Interpretation
All CT scans were performed with the following three scanners: Somatom definition AS (Siemens Medical Solutions), Somatom emotion (Siemens Medical Solutions), and ANATOM 16HD (ANKE Medical Solutions). The acquisition parameters were as follows: 120 kVp; 100–200 mAs; pitch, 0.75–1.5; and collimation, 1–5 mm, respectively. All imaging data were reconstructed by using a medium sharp reconstruction algorithm with a thickness of 1 mm. CT images were acquired in the supine position at full inspiration for all patients. All chest CT scans were reviewed blindly and independently by two radiologists (with 5 and 15 years of experience). If an inter-observer difference happened, the two radiologists would re-review the imaging feature(s) together and reach an agreement (in consensus). All images were viewed on both lung (width, 1,500 HU; level, −700 HU) and mediastinal (width, 350 HU; level, 40 HU) settings. Twelve imaging features including features of ground-glass opacities (GGO), consolidation, mixed GGO and consolidation, margin of the lesion (easily differentiated and uneasily differentiated, based on the lesions-lung interface), architectural distortion, reticulation, traction bronchiectasis, sub-pleural bands, intrathoracic lymph node enlargement, fibrosis, vascular enlargement in the lesion, and pleural effusions were evaluated according to our previous studies (18, 22). The number of involved lung lobes, the craniocaudal distribution (upper lung predominant, lower predominant, and no craniocaudal distribution), the transverse distribution (central or peripheral or no transverse distribution), and the scattering distribution (focal, multifocal, or diffuse) were also evaluated. The transverse distribution of the abnormalities were categorized as central (i.e., peribronchovascular), peripheral (i.e., sub-pleural), or with no transverse predilection. Focal was defined as a single lesion of abnormality, multifocal as more than one lesions, and diffuse as involvement of most of the volume of one lung lobe. A CT score system was used to evaluate the extent of disease (23). We defined three imaging changes: no change, progress change, and improvement change (22). No change referred to no obvious changes presented in the chest CT. Progress change referred to the presence of new lesions or the presence of an extent involvement area during the treatment. Improvement change referred to continually absorbed abnormities.
Statistical Analysis
Continuous variables were presented as median (IOR) and categorical variables were presented as numbers (%). The correlations between clinical features, laboratory tests, imaging features, and viral load were analyzed using the Spearman analysis. The ROC analysis was used to investigate the performance of the Ct value in predicting the follow-up change. A two-sided P < 0.05 was considered statistically significant. All statistical analyses were performed using the SPSS software (version 24.0).
Results
Clinical Characteristics and Laboratory Detection
In the beginning, 4 patients (male 1, female 3) were divided into the mild group, 49 patients (male 23, female 26) were common, another 3 patients (male 2, female 1) were in the severe group. Twenty-one (37.5%) patients had a direct exposure history link to Wuhan (i.e., long-term exposure history to Wuhan, traveling in Wuhan before diagnosis), 37 (66.1%) patients had an exposure history to confirmed patients. It is noted that 4 (7.1%) patients denied any direct exposure history and indirect exposure to confirmed patients and 17 (30.3%) patients were related to a family outbreak (more than 2 patients were confirmed in one family). Fever (36 of 56, 64.3%) and cough (31 of 56, 55.4%) were the most common onset symptoms. Other onset symptoms, including myalgia or fatigue, sore throat, dyspnea, diarrhea, nausea, and vomiting were presented in Tables 1, 2 patients had no onset symptoms and most patients (80.4%) had no underlying disease. The information about laboratory tests are also presented in Table 1. The median Ct value was 33.20 in our cohort.
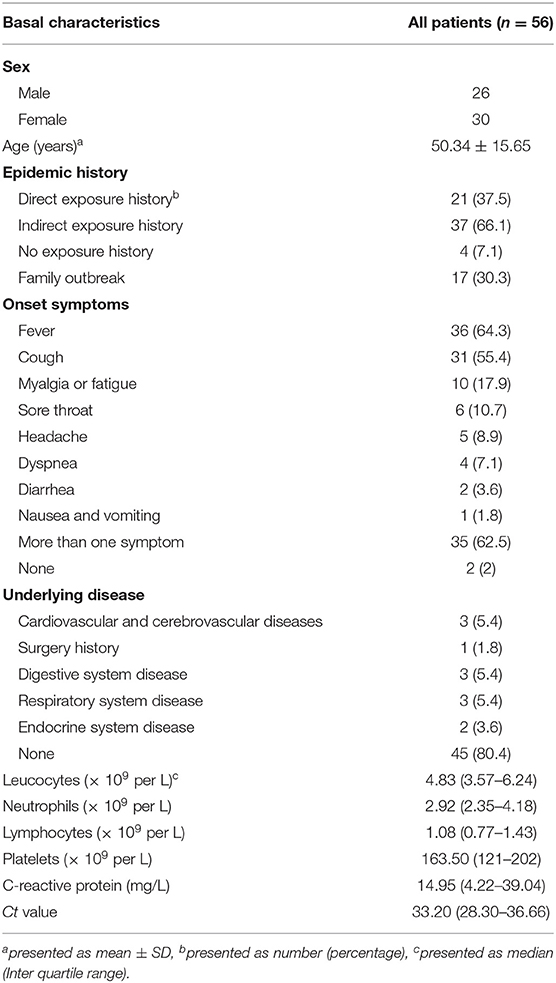
Table 1. Clinical features, laboratory tests in our cohort.
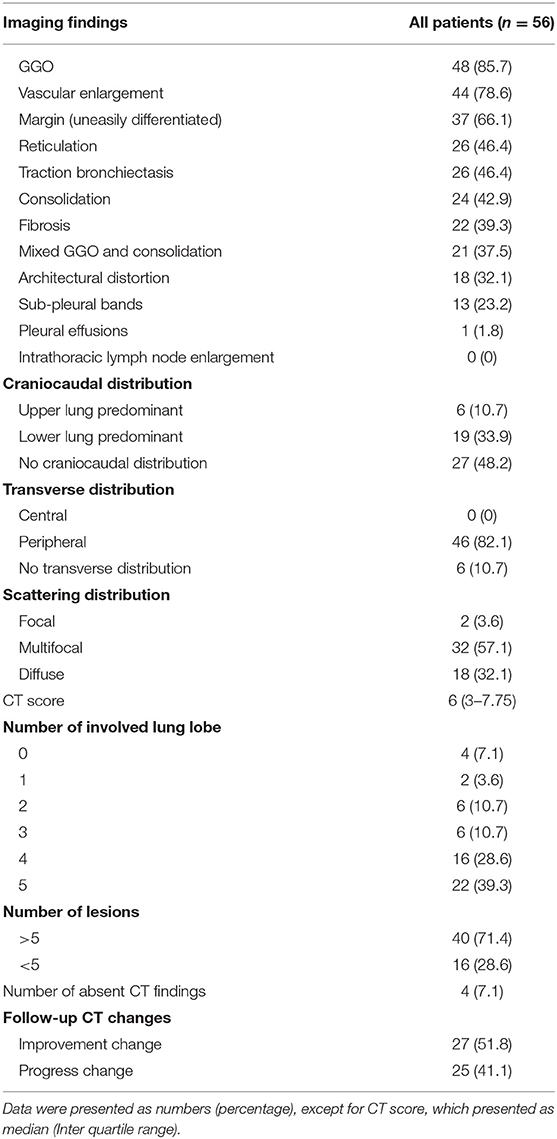
Table 2. Imaging finds of patients with COVID-19.
CT Findings
GGO (48 of 56, 85.7%) and vascular enlargement (44 of 56, 78.6%) were the most frequent signs in COVID-19 patients (Figures 1, 2). The lesion's margins were 64.3% uneasily differentiated. Intrathoracic lymph node enlargement and pleural effusions were rare findings in our cohort. Lesions were more likely to be peripherally distributed (46 of 56, 82.1%) and contain bilateral involvement (49 of 56, 87.5%). 39.3% of patients had 5 lung lobes involved and 71.4% of patients had more than 5 lesions. Other evaluated imaging features are described in detail in Table 2. The median CT score of the lung involvement was 6. It is notable that 4 patients had no obvious abnormity on initial CT images.
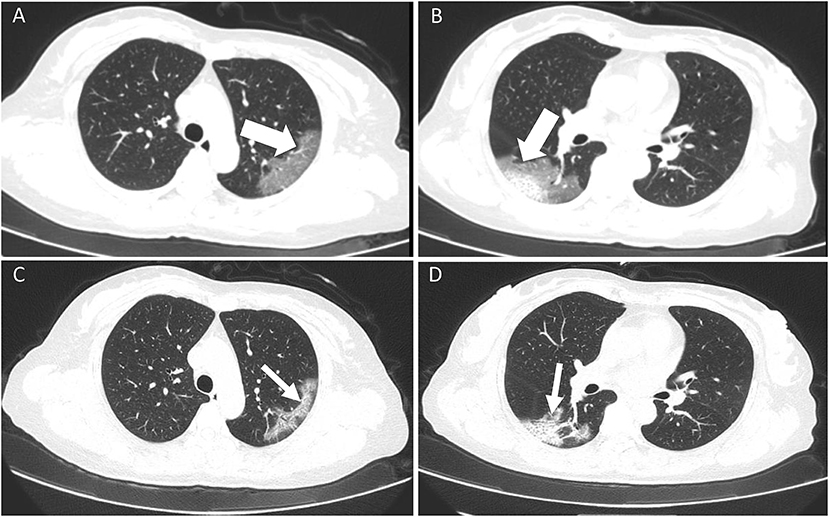
Figure 1. A 52-year old female with confirmed COVID-19 infection. Patient had close contact with a confirmed case and the onset symptom of fever. (A,B) Initial CT scan (performed on February 5 2020) showed bilateral GGO and mixed GGO and consolidation (white thick arrow) with an easily differentiated margin. The viral load (Ct value) was 38.65. (C,D) The follow-up CT scan (performed on February 9 2020) showed an improvement change. All the lesions had been absorbed (white fine arrow).
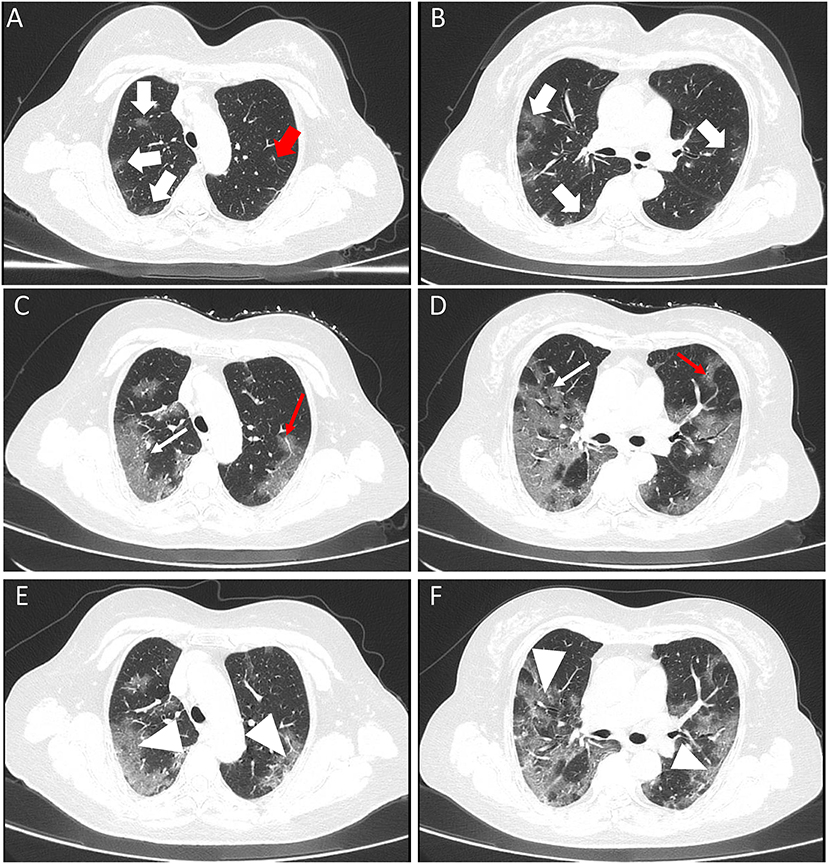
Figure 2. A 67-year old female with confirmed COVID-19 infection. Patient had close contact with a confirmed case and the onset symptom of fever. (A,B) Initial CT scan (performed on January 31 2020) showed bilateral GGOs (white thick arrow) with an uneasily differentiated margin. The viral load (Ct value) was 29.13. (C,D) The first follow-up CT scan (performed on February 5 2020) showed a progress change. All the lesions had been enlarged (white fine arrow). The diameter of the vascular was larger than that of initial CT image [red fine arrow of (C)] and a new lesion was presented [red fine arrow of (D)]. Please note that the margin of lesions on first follow-up CT images was clearer than before. The second follow-up CT scan (performed on February 8 2020) showed an improvement change (white arrowhead) (E,F).
The Relationships Between Clinical Factors, Imaging Findings and Ct Value
We investigated the relationships between clinical factors, imaging findings, and Ct value. No significant correlations were found in terms of leucocytes, neutrophils, lymphocytes, platelets, and C-reactive protein (all P > 0.05). In contrast, the uneasily differentiated margin was negatively correlated with the Ct value (r = −0.298, P = 0.026, Table 3), that is, an uneasily differentiated margin indicated a lower Ct value, which potentially indicated a more severe presentation of the disease (Figures 1, 2).
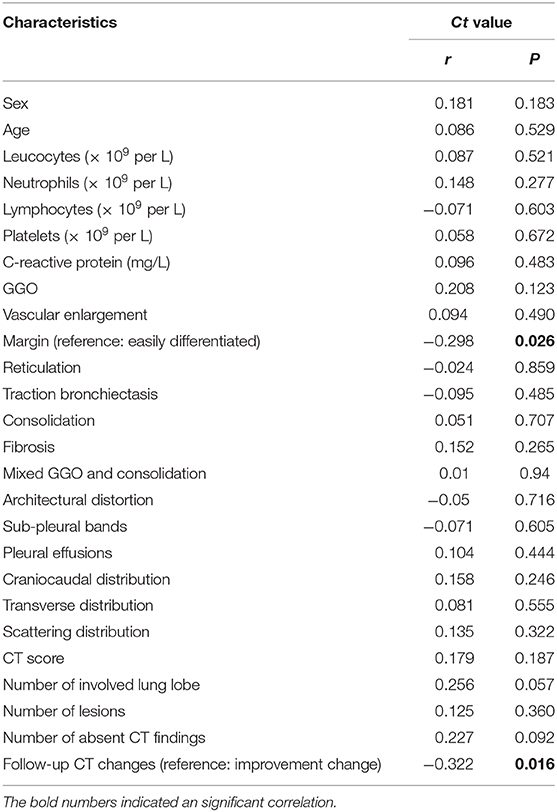
Table 3. The correlations between clinical features, laboratory tests and imaging features and viral load.
Follow-Up CTs and The Relationship With Ct Value
In total, 52 of 56 (92.9%) patients had undergone follow-up CT scans. Among the 52 patients, 27 patients presented an improved change, whereas 25 patients presented a progressed change. Furthermore, we investigated the relationships between the follow-up CT changes and Ct value. The results showed that the progressed follow-up change was negatively correlated with the Ct value (r = −0.322, P = 0.016, Table 3), that is, patients with a lower Ct value were likely to present a progressed follow-up change (P = 0.022). The Ct value at baseline could predict a progress follow-up change with an AUC of 0.685 (Cut-off value = 29.48) (Figure 3). All 4 of the patients (Ct value: 25.23, 29.37, 25.22, and 33.19, respectively), with normal CT findings presented new lesion(s) on follow-up CT scans (Figure 4).
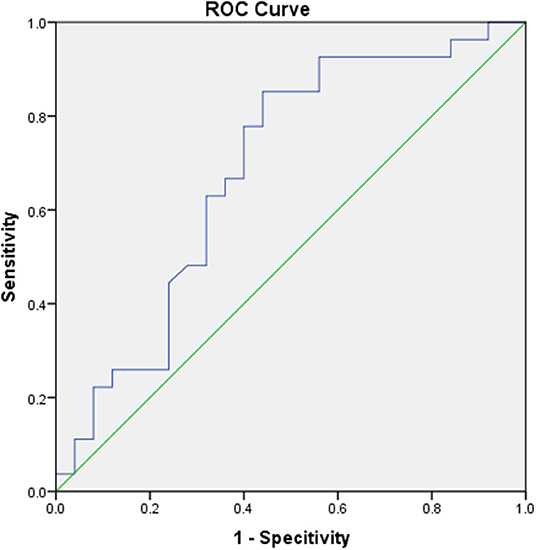
Figure 3. The ROC curve of Ct value in predicting the follow-up CT changes.
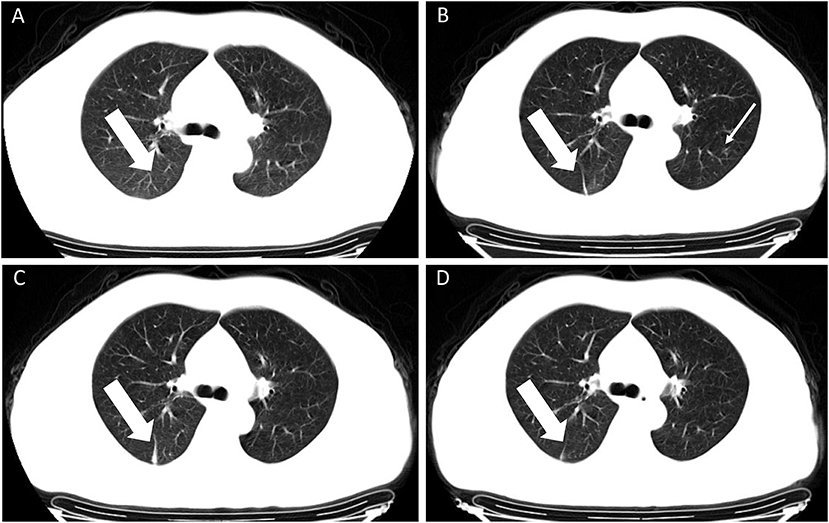
Figure 4. A 45-year old male with confirmed COVID-19 infection. Patient had a direct exposure history to Wuhan and the onset symptom of vomiting. (A–D) CT scan performed four times. Initial CT scan (performed on January 30 2020) showed no obvious abnormal CT findings (A). The next three times follow-up CT images showed a strip lesion in the right lower lobe (white thick arrow), first presented on second CT scan [performed on February 3 2020, (B)], enlarged on the third CT scan [performed on February 6 2020, (C)] and absorbed on the fourth CT scan [performed on February 9 2020, (D)]. An ambiguous lesion was shown in the upper left lobe [white fine arrow, (B)] and was absent in other images. The viral load (Ct value) was 22.53.
Discussion
In the present study, we investigated the relationships between clinical characteristics, radiographic features, and Ct values in patients with COVID-19 and we found that an uneasily differentiated margin of lung lesions was negatively correlated with the Ct value, which could be used as a predictor for the severity of COVID-19, that is, patients with a lower Ct value were likely to present a progress follow-up change (P = 0.022).
Both the number of confirmed cases and deaths has overtaken that of SARS in China (24). The clinical features and epidemic history have been well-reported recently. The onset symptom of fever and specific exposure history were also reported in our study. Most patients (66.1%) had an indirect exposure history and 17 (30.3%) patients were related to a family outbreak. The incidence indicated a serious risk of human-to-human transmission, therefore, early identification of positive cases and separating the negative patients from the suspected group is urgently warranted.
Although advances in treatment scenarios have been made, there is no existing evidence of curative medicine for COVID-19. Early diagnosis and treatment remained the basic strategies. The treatment response and clinical outcome of patients with COVID-19 were not well-documented, especially for severe/fatal patients or patients with rapid progress, so identifying patients with potential rapid progress early, accurately evaluating the severity of the disease at baseline, and further predicting clinical outcomes may improve the prognosis and curative rate. It was reported that the viral load (Ct value) has the potential to determine the severity of the disease (14). However, obtaining the viral load needs a long-term PCR test which has the potential of providing a false negative (18), therefore, investigating the relationships between these factors and the vial load may overcome the disadvantage. Leukopenia, lymphopenia, thrombocytopenia, and elevated C-reactive protein (CRP) levels were identified as risk factors for severe cases (6, 8). Liu et al. has discovered that the Ct value of the virus highly correlates with CRP and lymphopenia in patients with COVID-19. However, no laboratory manifestations were correlated with the viral load which may contribute to data bias, given the fact that we included a relatively large sample size.
CT scans, most frequently used in the diagnosis and monitoring treatment response of COVID-19, has contributed a lot in clinical practice. The typical chest CT features have been reported in previous studies (17, 25). GGO was the most frequent sign among the positive patients in our study, which is consistent with previous studies (25). In addition, the radiographic features were also considered as predictors for the severity of the disease (6). The CT score, a semi-quantitative score to evaluate the extent of the lesions, was a severity predictor in our previous study (26). However, it had no statistical correlation with the viral load. Moreover, another factor related to the extent of the lesions, e.g., number of involved lung lobe and the number of lesions were also not significantly correlated with the viral load. A low viral load may cause more serious reactions in the body, leading to a higher extent of lesions in the lung. The unexpected results may be due to the small sample size. Although the lesions were more likely be peripherally distributed and multifocal, the viral load had no predominant distributions. In other words, the distributions can be considered as a differentiated feature from other viral-related pneumonia instead of a severity predictor. Interestingly, we found that an uneasily differentiated margin indicated a lower Ct value, which possibly indicated the severity of the disease. The suggestion that an uneasily differentiated margin could indicate the reaction of the immune system against COVID-19 is still ongoing and the potential of further progress is expected. In contrast, an easily differentiated margin indicates that the virus has been restricted.
We also found the follow-up CT changes could help identify the patients who might progress in the later stage in our previous study (22). In this study, we also investigated the relationship between the viral load and the follow-up CT changes and found that the progressed follow-up changes were negatively correlated with the Ct value, which means patients with a lower Ct value are likely to present a progressed follow-up CT change, maybe even a worse prognosis. The Ct value at baseline yields an AUC of 0.685 to predict a progress follow-up CT change.
It is notable that 4 patients had no abnormal CT findings in our cohort. All 4 of the patients presented new lesions in the follow-up CT scan images, indicating that abnormal imaging findings might be absent in the early stage of COVID-19. This also further proved a lower Ct value are likely to present a progress follow-up CT change. It reminds physicians of the importance of follow-up CT scans for patients with normal CT findings at initial diagnosis, especially for those with a low Ct value.
Nevertheless, the study has several limitations. Firstly, this is the experience of a single center and the sample size was small. Our conclusions cannot be generalized to other centers taking care of COVID-19 patients directly, which needs further investigation. A multicenter study and/or including more cases might provide more information on the viral load and clinical outcomes of COVID-19. Secondly, the relationship between Ct value during the treatment and clinical features, laboratory tests and radiographic features were not investigated and will be conducted in a future study.
In conclusion, the viral load is negatively correlated with an uneasily differentiated lesion margin on initial CT scan images and the Ct value should be paid attention to in making the diagnosis. In addition, follow-up CT scans are necessary for patients with normal CT findings at initial diagnosis, especially for those with a low Ct value.
Data Availability Statement
The original contributions presented in the study are included in the article/supplementary material, further inquiries can be directed to the corresponding author/s.
Ethics Statement
The studies involving human participants were reviewed and approved by Medical Ethical Committee. Written informed consent for participation was not provided by the participants' legal guardians/next of kin because: This was a retrospective study.
Author Contributions
JL, WZ, and LT: conception and design. JL and LT: administrative support. JL, WZ, and LH: provision of study materials or patients. JL, WZ, LH, HT, and XX: collection, assembly of data, data analysis, and interpretation. All authors: manuscript writing and final approval of manuscript.
Funding
Funding was provided by the Key Emergency Project of Pneumonia Epidemic of novel coronavirus infection (2020SK3006), the Emergency Project of Prevention and Control for COVID-19 of Central South University (160260005), and the Foundation from Changsha Scientific and Technical Bureau, China (kq2001001). The projects who funded this study had no role in the study design, data collection, data analysis, data interpretation, or writing of the report. The corresponding author had full access to all the data in the study and had final responsibility for the decision to submit for publication.
Conflict of Interest
The authors declare that the research was conducted in the absence of any commercial or financial relationships that could be construed as a potential conflict of interest.
References
1. WHO. Novel Coronavirus – China. (2020) Available online at: http://www.who.int/csr/don/12-january-2020-novel-coronavirus-china/en/ (accessed March 6, 2020).
2. Ren L-L, Wang YM, Wu ZQ, Xiang ZC, Guo L, Xu T, et al. Identification of a novel coronavirus causing severe pneumonia in human: a descriptive study. Chin Med J. (2020) 133:1015–24. doi: 10.1097/CM9.0000000000000722
3. WHO. Available online at: https://www.who.int/news-room/detail/30-01-2020-statement-on-the-second-meeting-of-the-international-health-regulations-(2005)-emergency-committee-regarding-the-outbreak-of-novel-coronavirus-(2019-ncov)
4. China National Health Commission. Update on the Novel Coronavirus Pneumonia Outbreak. Beijing: National Health Commission. Available online at: http://www.nhc.gov.cn/xcs/yqtb/202005/3e2bc587447f458c809f10897bb4327e.shtml (accessed May 2, 2020).
5. Drosten C, Gunther S, Preiser W, van der Werf S, Brodt HR, Becker S, et al. Identification of a novel coronavirus in patients with severe acute respiratory syndrome. N Engl J Med. (2003) 348:1967–76. doi: 10.1056/NEJMoa030747
6. Guan W-J, Ni Z-Y, Hu Y, Liang WH, Ou CQ, He JX, et al. Clinical characteristics of 2019 novel coronavirus infection in China. N Engl J Med. (2020) 382:1708–20. doi: 10.1056/NEJMoa2002032
7. Chan JFW, Yuan S, Kok KH, To KKW, Chu H, Yang J, et al. A familial cluster of pneumonia associated with the 2019 novel coronavirus indicating person-to-person transmission: a study of a family cluster. Lancet. (2020) 395:514–23. doi: 10.1016/S0140-6736(20)30154-9
8. Huang C, Wang Y, Li X, Ren L, Zhao J, Hu Y, et al. Clinical features of patients infected with 2019 novel coronavirus in Wuhan, China. Lancet. (2020) 395:497–506. doi: 10.1016/S0140-6736(20)30183-5
9. Boldog P, Tekeli T, Vizi Z, Dénes A, Bartha FA, Röst G. Risk assessment of novel coronavirus 2019-nCoV outbreaks outside China. J Clin Med. (2020) 9:571. doi: 10.3390/jcm9020571
10. CDC. 2019 Novel Coronavirus. Prevention & Treatment. Centers for Disease Control and Prevention. (2020). Available online at: https://www.cdc.gov/coronavirus/2019-nCoV/index.html
11. Wang FS, Zhang C. What to do next to control the 2019-nCoV epidemic? Lancet. (2020) 395:391–3. doi: 10.1016/S0140-6736(20)30300-7
12. Hasegawa K, Jartti T, Mansbach JM, Laham FR, Jewell AM, Espinola JA, et al. Respiratory syncytial virus genomic load and disease severity among children hospitalized with bronchiolitis: multicenter cohort studies in the United States and Finland. J Infect Dis. (2014) 211:1550–9. doi: 10.1093/infdis/jiu658
13. Scagnolari C, Midulla F, Selvaggi C, Monteleone K, Bonci E, Papoff P, et al. Evaluation of viral load in infants hospitalized with bronchiolitis caused by respiratory syncytial virus. Med Microbiol Immunol. (2012) 201:311–7. doi: 10.1007/s00430-012-0233-6
14. Liu Y, Yang Y, Zhang C, Huang F, Wang F, Yuan J, et al. Clinical and biochemical indexes from 2019-nCoV infected patients linked to viral loads and lung injury. Sci China Life Sci. (2020) 63:364–74. doi: 10.1007/s11427-020-1643-8
15. Zou L, Ruan F, Huang M, Liang L, Huang H, Hong Z, et al. SARS-CoV-2 viral load in upper respiratory specimens of infected patients. N Engl J Med. (2020) 382:1177–9. doi: 10.1056/NEJMc2001737
16. Wang D, Hu B, Hu C, Zhu F, Liu X, Zhang J, et al. Clinical characteristics of 138 hospitalized patients with 2019 novel coronavirus-infected pneumonia in Wuhan, China. JAMA. (2020) 323:1061–9. doi: 10.1001/jama.2020.1585
17. Chung M, Bernheim A, Mei X, Zhang N, Huang M, Zeng X, et al. CT imaging features of 2019 novel coronavirus (2019-nCoV). Radiology. (2020) 295:202–7. doi: 10.1148/radiol.2020200230
18. Xie X, Zhong Z, Zhao W, Zheng C, Wang F, Liu J. Chest CT for typical 2019-nCoV pneumonia: relationship to negative RT-PCR testing. Radiology. (2020) 296:E41–5. doi: 10.1148/radiol.2020200343
19. Pan F, Ye T, Sun P, Gui S, Liang B, Li L, et al. Time course of lung changes on chest CT during recovery from 2019 novel coronavirus (COVID-19) pneumonia. Radiology. (2020) 295:715–21. doi: 10.1148/radiol.2020200370
20. China National Health Commission. Diagnosis and Treatment of Pneumonitis Caused by New Coronavirus (Trial Version 7). Beijing: China National Health Commission (2020). Available online at: http://www.nhc.gov.cn/yzygj/s7653p/202003/46c9294a7dfe4cef80dc7f5912eb1989.shtml (accessed June 29, 2020).
21. Laboratory diagnostics for novel coronavirus. WHO (2020). Available online at: https://www.who.int/publications/i/item/10665-330374 (accessed March 6, 2020).
22. Zhao W, Zhong Z, Xie X, Yu Q, Liu J. CT scans of patients with 2019 novel coronavirus (COVID-19) pneumonia. Theranostics. (2020) 10:4606–13. doi: 10.7150/thno.45016
23. Ooi GC, Khong PL, Muller NL, Yiu WC, Zhou WC, Ho JCH, et al. Severe acute respiratory syndrome: temporal lung changes at thin-section CT in 30 patients. Radiology. (2004) 230:836–44. doi: 10.1148/radiol.2303030853
24. Wang C, Horby PW, Hayden FG, Gao GF. A novel coronavirus outbreak of global health concern. Lancet. (2020) 395:470–3. doi: 10.1016/S0140-6736(20)30185-9
25. Song F, Shi N, Shan F, Zhang Z, Shen J, Lu H, et al. Emerging 2019 novel coronavirus (2019-nCoV) pneumonia. Radiology. (2020) 295:210–7. doi: 10.1148/radiol.2020200274
Keywords: CT, COVID-19, viral load, follow-up, margin
Citation: Zhao W, He L, Tang H, Xie X, Tang L and Liu J (2020) The Relationship Between Chest Imaging Findings and the Viral Load of COVID-19. Front. Med. 7:558539. doi: 10.3389/fmed.2020.558539
Received: 05 May 2020; Accepted: 20 August 2020;
Published: 08 September 2020.
Edited by:
Nicola Petrosillo, Istituto Nazionale per le Malattie Infettive Lazzaro Spallanzani (Scientific Institute for Research, Hospitalization and Healthcare), ItalyReviewed by:
Chuanming Li, Chongqing Medical University, ChinaMing Li, Fudan University, China
Hai Bo Xu, Wuhan University, China
Copyright © 2020 Zhao, He, Tang, Xie, Tang and Liu. This is an open-access article distributed under the terms of the Creative Commons Attribution License (CC BY). The use, distribution or reproduction in other forums is permitted, provided the original author(s) and the copyright owner(s) are credited and that the original publication in this journal is cited, in accordance with accepted academic practice. No use, distribution or reproduction is permitted which does not comply with these terms.
*Correspondence: Lingli Tang, linglitang@csu.edu.cn; Jun Liu, junliu123@csu.edu.cn