
Environmental Effects of the COVID-19 Pandemic: The Experience of Bogotá, 2020

 ,
,  and
and 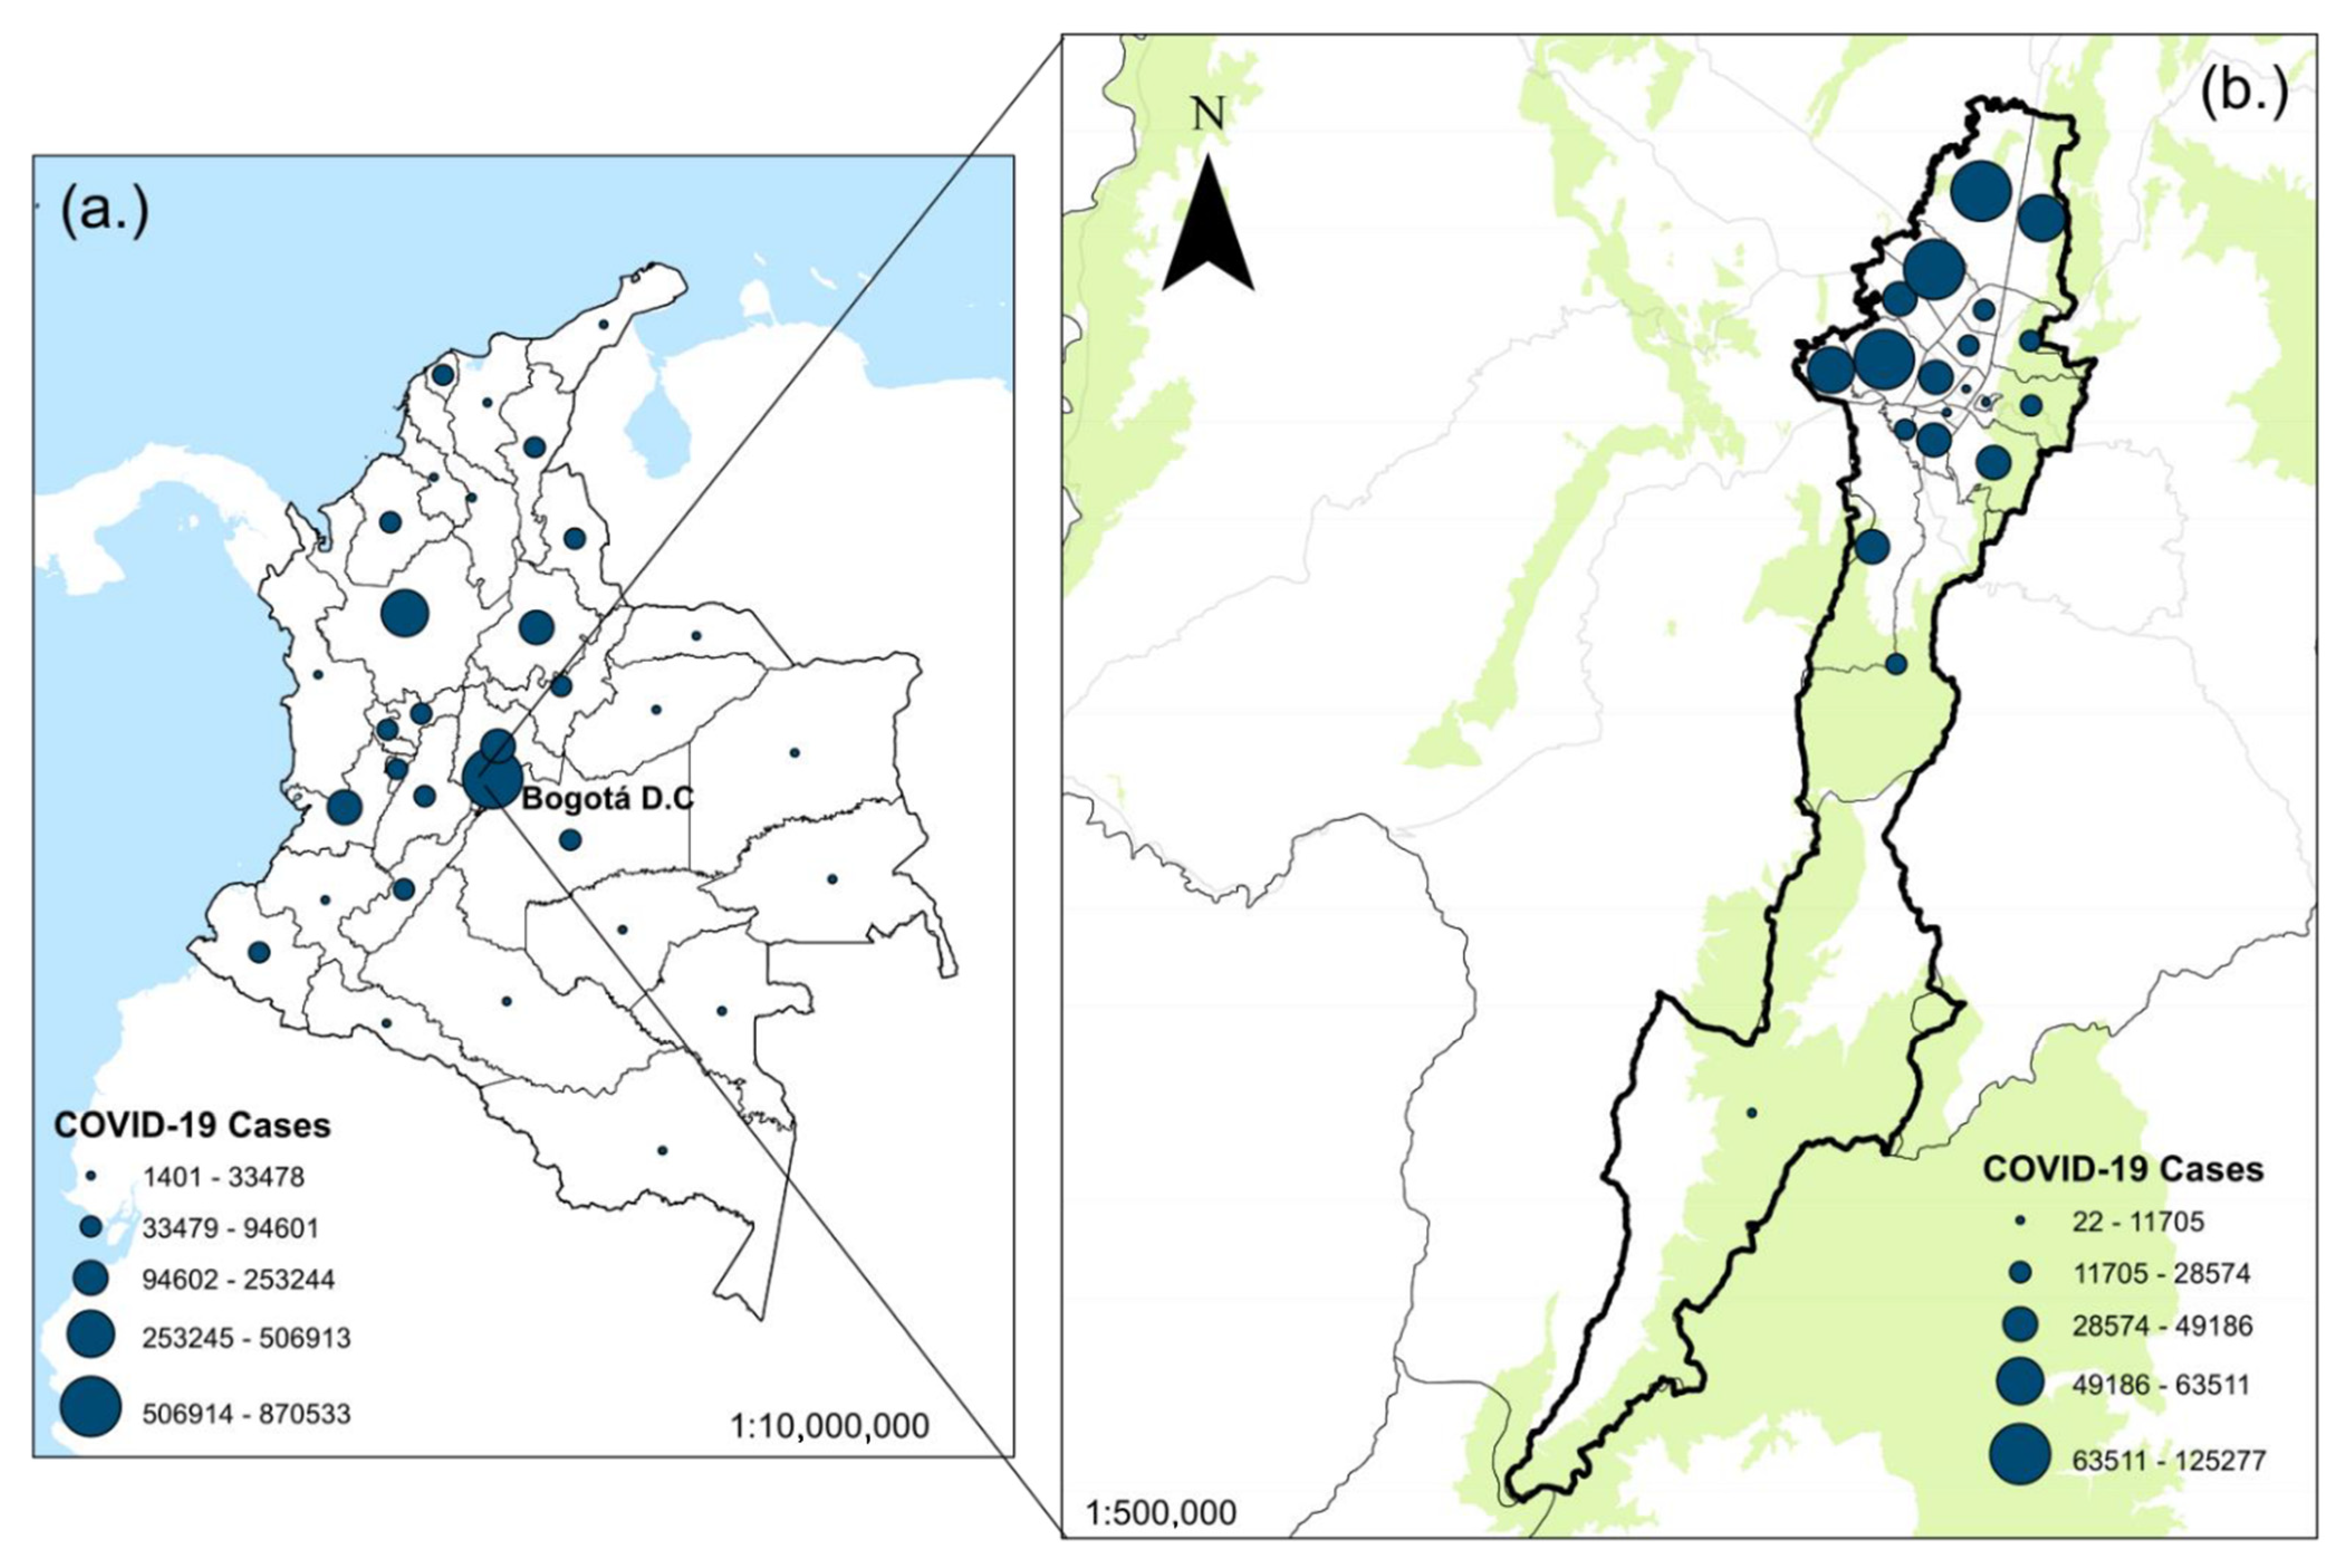
Abstract
:1. Introduction
2. Materials and Methods
2.1. Study Area
2.2. Study Design
2.3. Solid Waste Data Analysis
2.4. Air Quality
2.5. Water Resources
2.6. Transport
2.7. Statistical Analysis
3. Results
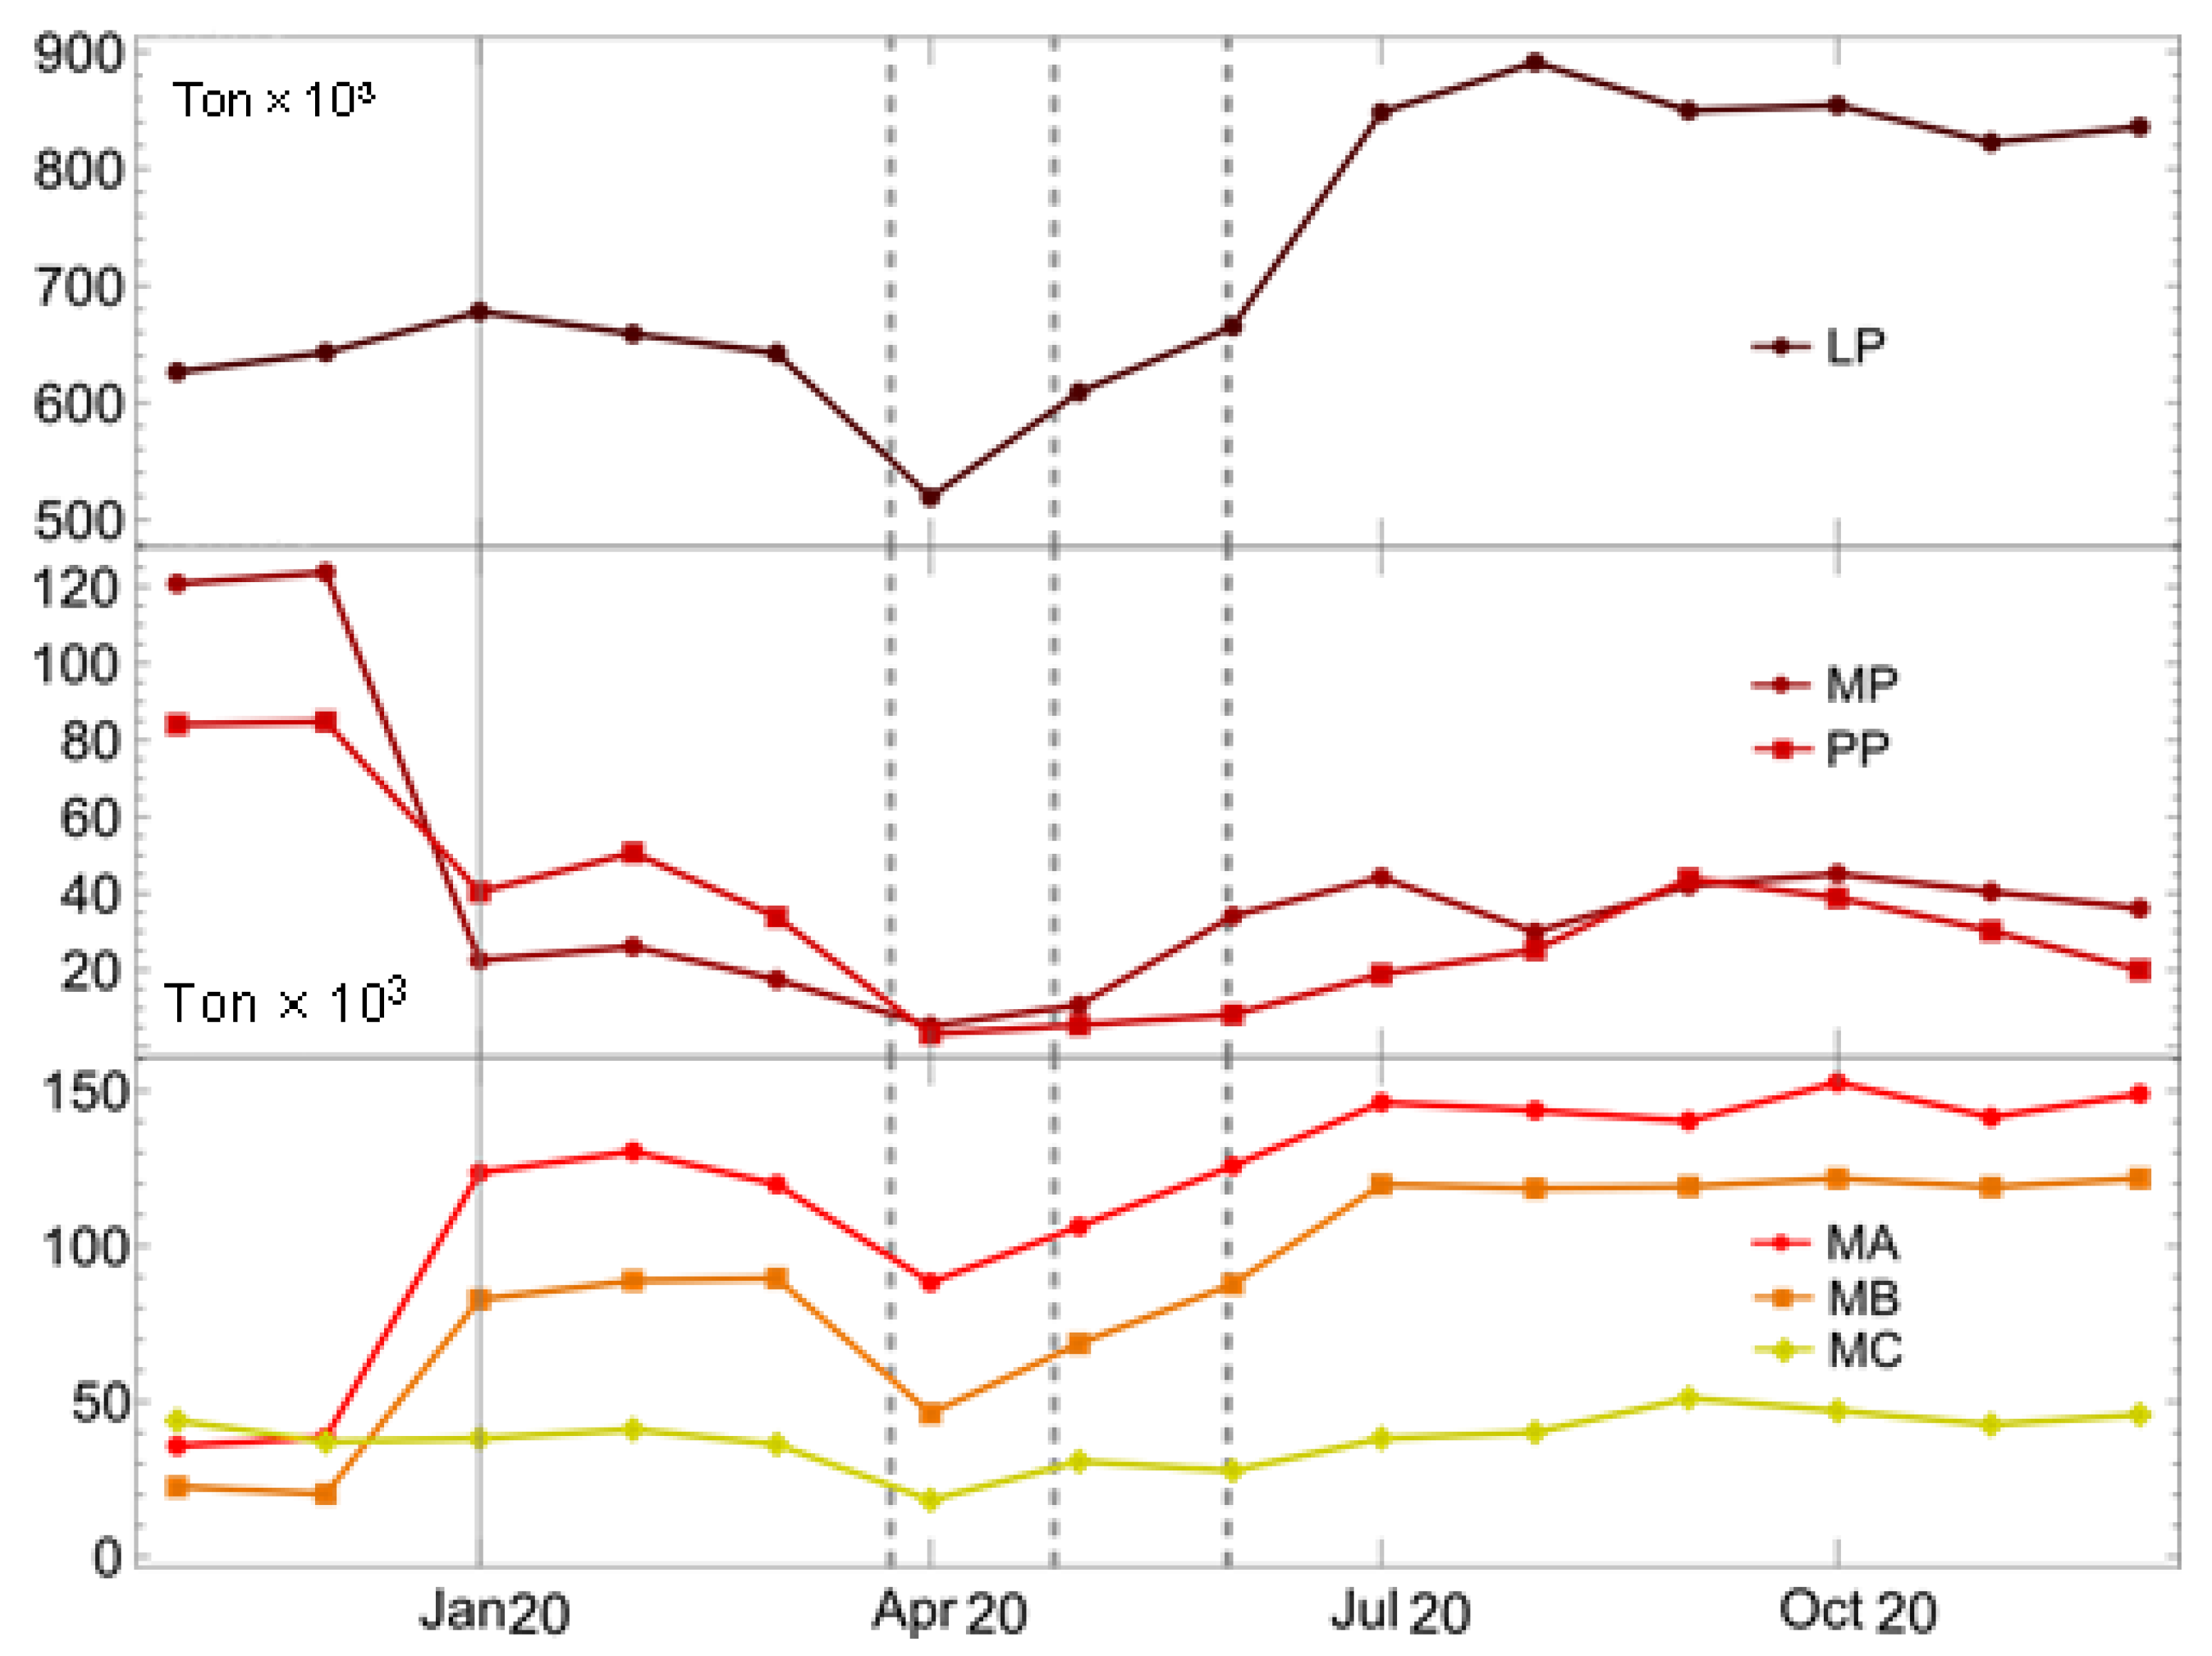
3.1. Solid Waste
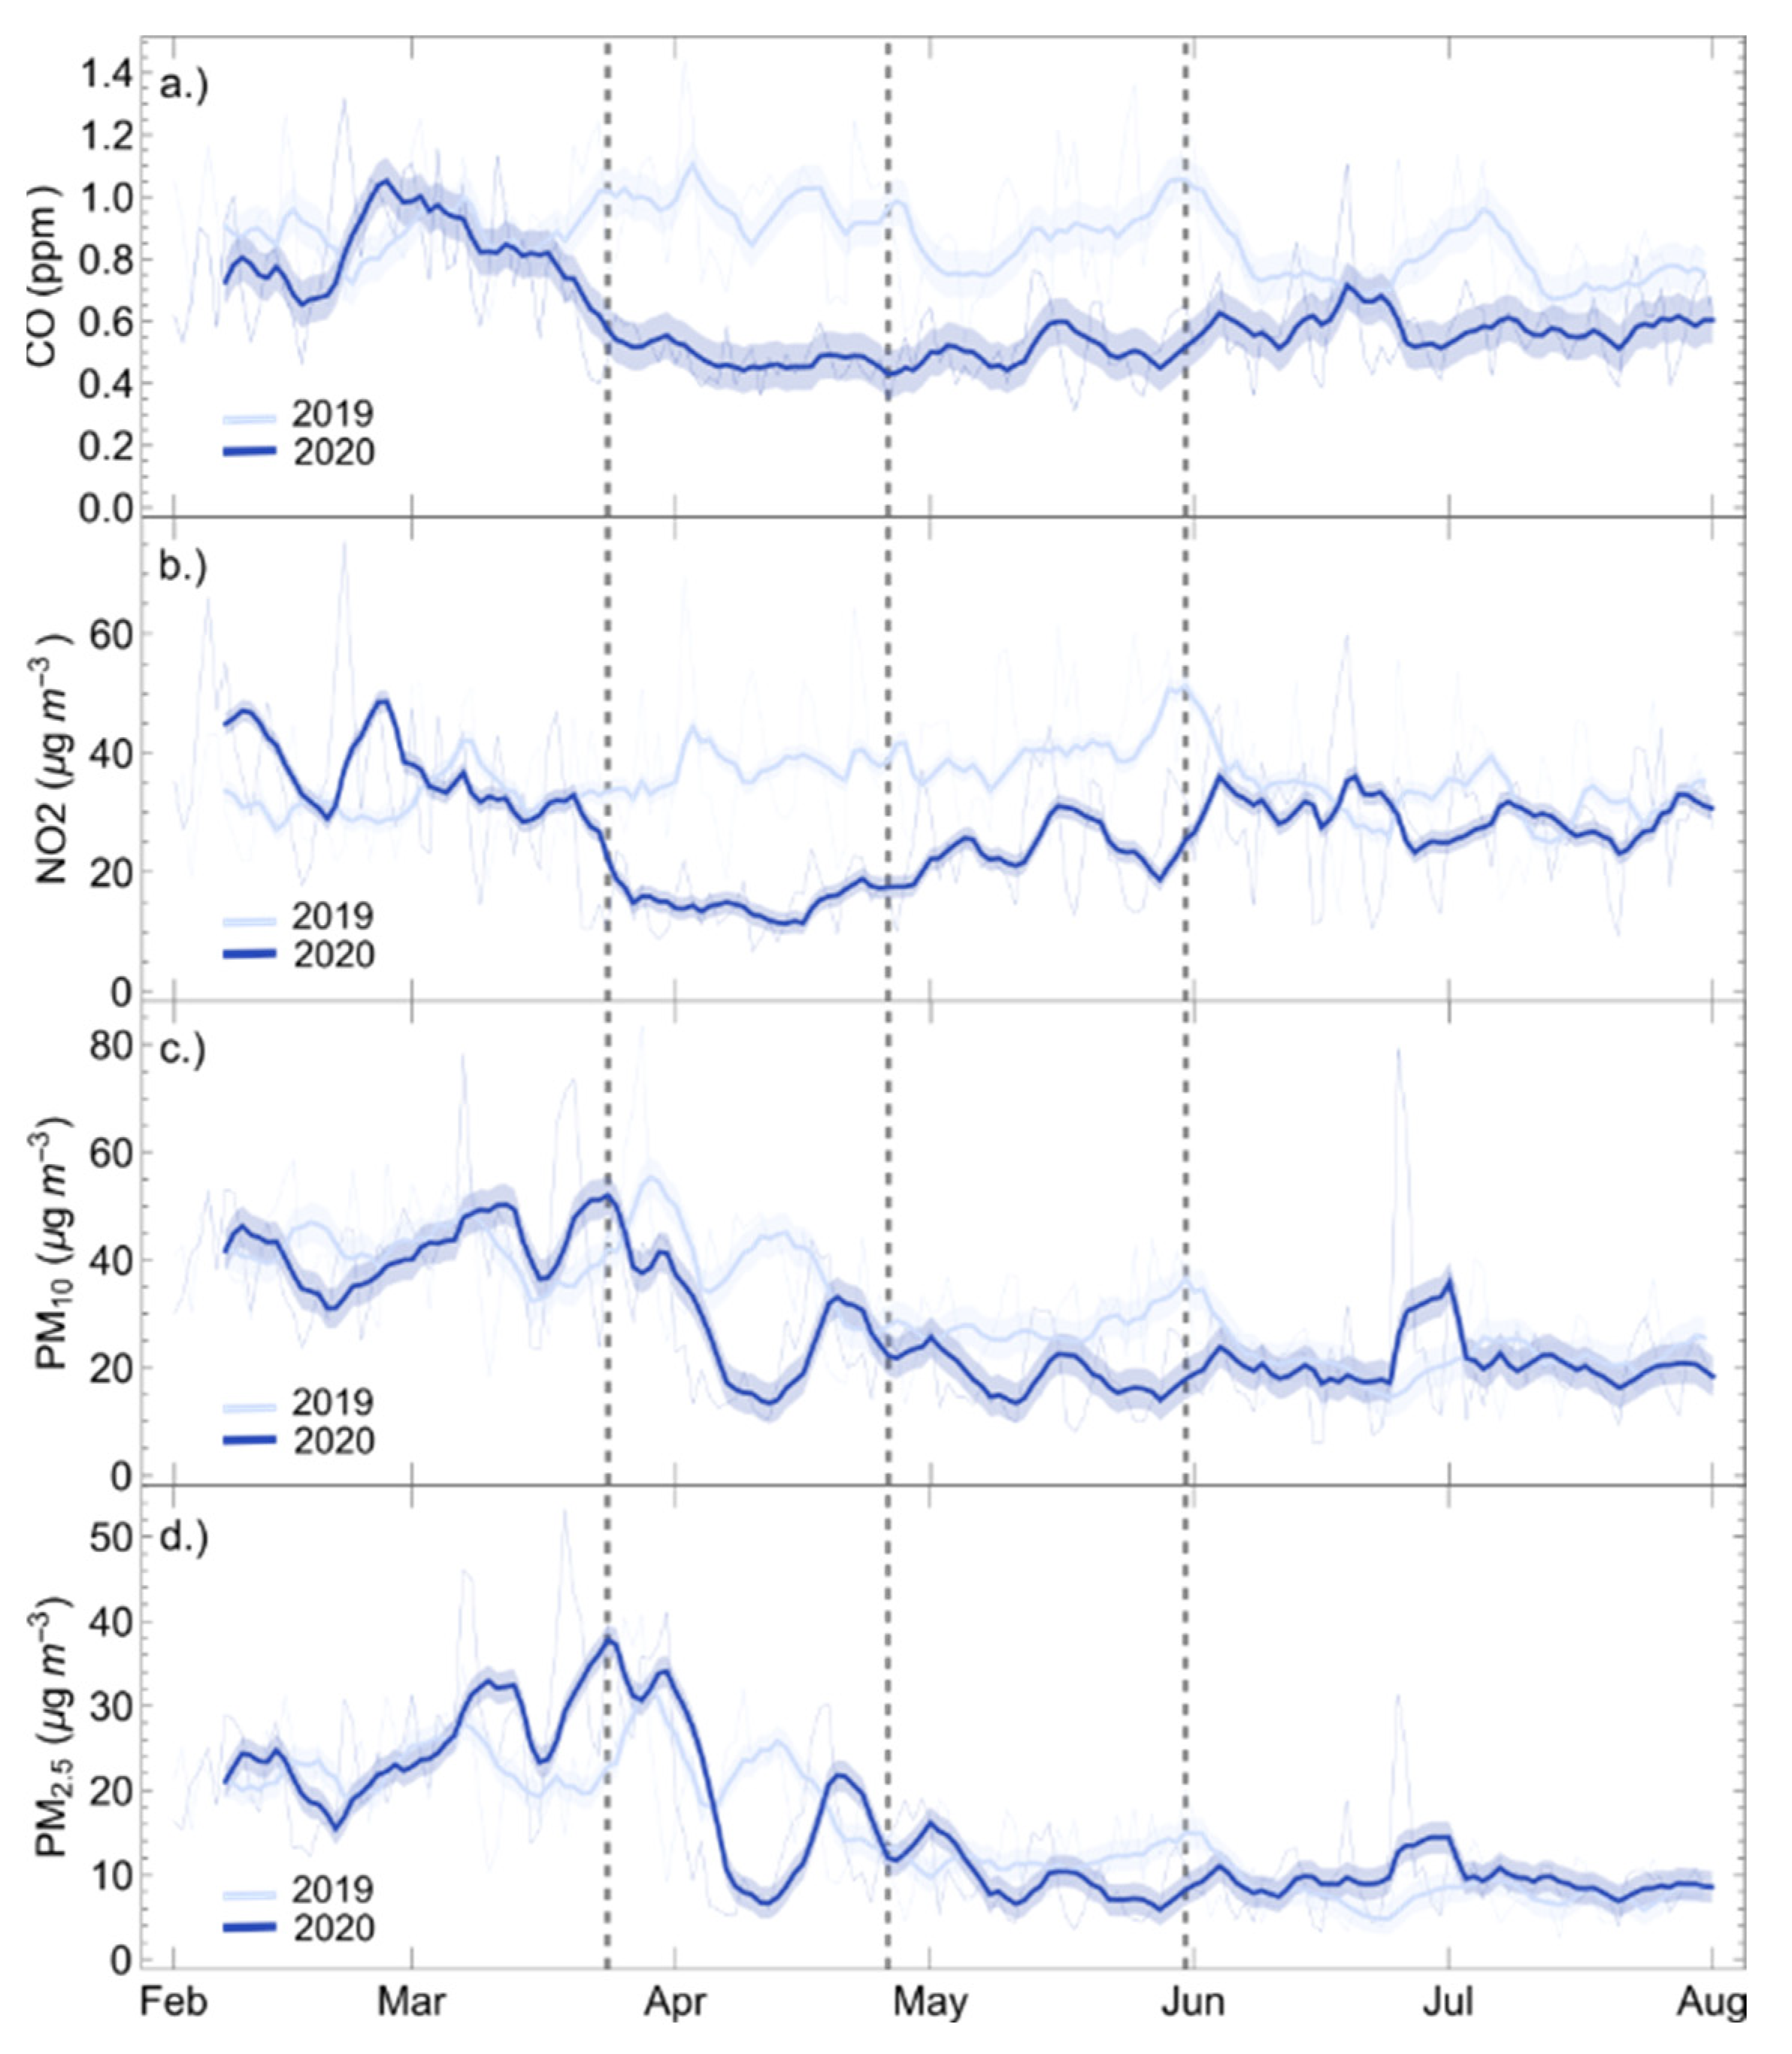
3.2. Air Quality and Citizens’ Perception
3.3. Transport
3.4. Water Resources
4. Discussion
5. Conclusions
Supplementary Materials
Author Contributions
Funding
Institutional Review Board Statement
Informed Consent Statement
Data Availability Statement
Acknowledgments
Conflicts of Interest
References
- Saadat, S.; Rawtani, D.; Hussain, C.M. Environmental Perspective of COVID-19. Sci. Total Environ. 2020, 728, 138870. [Google Scholar] [CrossRef] [PubMed]
- Park, J.-H.; Lee, S.-G.; Ahn, S.; Kim, J.Y.; Song, J.; Moon, S.; Cho, H. Strategies to Prevent COVID-19 Transmission in the Emergency Department of a Regional Base Hospital in Korea: From Index Patient until Pandemic Declaration. Am. J. Emerg. Med. 2021, 46, 247–253. [Google Scholar] [CrossRef] [PubMed]
- Kumar, A.; Malla, M.A.; Dubey, A. With Corona Outbreak: Nature Started Hitting the Reset Button Globally. Front. Public Health 2020, 8, 569353. [Google Scholar] [CrossRef] [PubMed]
- COVID-19: The 4 Building Blocks of the Great Reset. Available online: https://www.weforum.org/agenda/2020/08/building-blocks-of-the-great-reset/ (accessed on 25 April 2022).
- Hawkes, C. Five Steps towards a Global Reset: Lessons from COVID-19. Glob. Sustain. 2020, 3, e30. [Google Scholar] [CrossRef]
- Ramkissoon, H. COVID-19 Place Confinement, Pro-Social, Pro-Environmental Behaviors, and Residents’ Wellbeing: A New Conceptual Framework. Front. Psychol. 2020, 11, 02248. [Google Scholar] [CrossRef] [PubMed]
- Buechler, E.; Powell, S.; Sun, T.; Astier, N.; Zanocco, C.; Bolorinos, J.; Flora, J.; Boudet, H.; Rajagopal, R. Global Changes in Electricity Consumption during COVID-19. iScience 2022, 25, 103568. [Google Scholar] [CrossRef] [PubMed]
- Jiang, P.; Fan, Y.V.; Klemeš, J.J. Impacts of COVID-19 on Energy Demand and Consumption: Challenges, Lessons and Emerging Opportunities. Appl. Energy 2021, 285, 116441. [Google Scholar] [CrossRef]
- Kang, H.; An, J.; Kim, H.; Ji, C.; Hong, T.; Lee, S. Changes in Energy Consumption According to Building Use Type under COVID-19 Pandemic in South Korea. Renew. Sustain. Energy Rev. 2021, 148, 111294. [Google Scholar] [CrossRef]
- Benton, M.; Batalova, J.; Davidoff-Gore, S.; Schmidt, T. COVID-19 and the State of Global Mobility in 2020; International Organization for Migration: Grand-Saconnex, Switzerland, 2020.
- IEA Changes in Transport Behaviour during the COVID-19 Crisis–Analysis. Available online: https://www.iea.org/articles/changes-in-transport-behaviour-during-the-COVID-19-crisis (accessed on 25 April 2022).
- Echaniz, E.; Rodríguez, A.; Cordera, R.; Benavente, J.; Alonso, B.; Sañudo, R. Behavioural Changes in Transport and Future Repercussions of the COVID-19 Outbreak in Spain. Transp. Policy 2021, 111, 38–52. [Google Scholar] [CrossRef]
- Habib, M.A.; Anik, M.A.H. Impacts of COVID-19 on Transport Modes and Mobility Behavior: Analysis of Public Discourse in Twitter. Transp. Res. Rec. 2021. [Google Scholar] [CrossRef]
- Mostafa, M.K.; Gamal, G.; Wafiq, A. The Impact of COVID 19 on Air Pollution Levels and Other Environmental Indicators—A Case Study of Egypt. J. Environ. Manag. 2021, 277, 111496. [Google Scholar] [CrossRef] [PubMed]
- Rodríguez-Urrego, D.; Rodríguez-Urrego, L. Air Quality during the COVID-19: PM2.5 Analysis in the 50 Most Polluted Capital Cities in the World. Environ. Pollut. 2020, 266, 115042. [Google Scholar] [CrossRef] [PubMed]
- Khan, I.; Shah, D.; Shah, S.S. COVID-19 Pandemic and Its Positive Impacts on Environment: An Updated Review. Int. J. Environ. Sci. Technol. 2021, 18, 521–530. [Google Scholar] [CrossRef] [PubMed]
- Le Quéré, C.; Jackson, R.B.; Jones, M.W.; Smith, A.J.P.; Abernethy, S.; Andrew, R.M.; De-Gol, A.J.; Willis, D.R.; Shan, Y.; Canadell, J.G.; et al. Temporary Reduction in Daily Global CO2 Emissions during the COVID-19 Forced Confinement. Nat. Clim. Chang. 2020, 10, 647–653. [Google Scholar] [CrossRef]
- Muhammad, S.; Long, X.; Salman, M. COVID-19 Pandemic and Environmental Pollution: A Blessing in Disguise? Sci. Total Environ. 2020, 728, 138820. [Google Scholar] [CrossRef]
- Tollefson, J. COVID Curbed Carbon Emissions in 2020—But Not by Much. Nature 2021, 589, 343. [Google Scholar] [CrossRef]
- Benson, N.U.; Fred-Ahmadu, O.H.; Bassey, D.E.; Atayero, A.A. COVID-19 Pandemic and Emerging Plastic-Based Personal Protective Equipment Waste Pollution and Management in Africa. J. Environ. Chem. Eng. 2021, 9, 105222. [Google Scholar] [CrossRef]
- Sarkodie, S.A.; Owusu, P.A. Impact of COVID-19 Pandemic on Waste Management. Environ. Dev. Sustain. 2021, 23, 7951–7960. [Google Scholar] [CrossRef]
- Zhang, R.; Zhang, Y.; Lin, H.; Feng, X.; Fu, T.-M.; Wang, Y. NOx Emission Reduction and Recovery during COVID-19 in East China. Atmosphere 2020, 11, 433. [Google Scholar] [CrossRef] [Green Version]
- Kumar, A.; Agrawal, A. Recent Trends in Solid Waste Management Status, Challenges, and Potential for the Future Indian Cities—A Review. Curr. Res. Environ. Sustain. 2020, 2, 100011. [Google Scholar] [CrossRef]
- Cheval, S.; Mihai Adamescu, C.; Georgiadis, T.; Herrnegger, M.; Piticar, A.; Legates, D.R. Observed and Potential Impacts of the COVID-19 Pandemic on the Environment. Int. J. Environ. Res. Public Health 2020, 17, 4140. [Google Scholar] [CrossRef]
- Shulla, K.; Voigt, B.-F.; Cibian, S.; Scandone, G.; Martinez, E.; Nelkovski, F.; Salehi, P. Effects of COVID-19 on the Sustainable Development Goals (SDGs). Discov. Sustain. 2021, 2, 15. [Google Scholar] [CrossRef] [PubMed]
- Instituto Nacional de Salud COVID-19 En Colombia. Available online: https://www.ins.gov.co/Noticias/paginas/coronavirus.aspx (accessed on 4 March 2022).
- Vargas, F.A.; Rojas, N.Y.; Pachon, J.E.; Russell, A.G. PM10 Characterization and Source Apportionment at Two Residential Areas in Bogota. Atmos. Pollut. Res. 2012, 3, 72–80. [Google Scholar] [CrossRef] [Green Version]
- Oróstegui, O. Lo que necesita Bogotá en este 2019. Bogotá Cómo Vamos. 2018. Available online: https://bogotacomovamos.org/que-necesita-bogota-para-el-2019/ (accessed on 30 January 2022).
- Mercado-Reyes, M.; Malagón-Rojas, J.; Rodríguez-Barraquer, I.; Zapata-Bedoya, S.; Wiesner, M.; Cucunubá, Z.; Toloza-Pérez, Y.G.; Hernández-Ortiz, J.P.; Acosta-Reyes, J.; Parra-Barrera, E.; et al. Seroprevalence of Anti-SARS-CoV-2 Antibodies in Colombia, 2020: A Population-Based Study. Lancet Reg. Health Am. 2022, 9, 100195. [Google Scholar] [CrossRef] [PubMed]
- ¿Pico y Cédula, y Ahora Toque de Queda?: Experiencia del Departamento del Atlántico en las Medidas de Contención Frente al COVID-19-Departamento Economía-Uninorte. Available online: https://www.uninorte.edu.co/web/deptoeconomia/home/-/blogs/-pico-y-cedula-y-ahora-toque-de-queda-experiencia-del-departamento-del-atlantico-en-las-medidas-de-contencion-frente-al-COVID-19 (accessed on 25 April 2022).
- Malagón-Rojas, J.N.; Mercado-Reyes, M.; Toloza-Pérez, Y.G.; Parra Barrera, E.L.; Palma, M.; Muñoz, E.; López, R.; Almentero, J.; Rubio, V.V.; Ibáñez, E.; et al. Seroprevalence of the SARS-CoV-2 Antibody in Healthcare Workers: A Multicentre Cross-Sectional Study in 10 Colombian Cities. Occup. Environ. Med. 2021. [Google Scholar] [CrossRef] [PubMed]
- Oyague, E.; Yaja, A.; Franco, P. Efectos Ambientales Del Confinamiento Debido a La Pandemia de COVID-19. Cienc. Desarro. 2020, 26, 2–19. [Google Scholar] [CrossRef]
- Malagon-Rojas, J.; Pinzón-Silva, D.C.; Parra, E.L.; Lagos, L.; Toloza-Perez, Y.G.; Hernández Florez, L.J.; Morales, R.; Romero Díaz, S.A.; Ríos Cabra, A.P.; Sarmiento, O.L. Assessment of Personal Exposure to Particulate Air Pollution in Different Microenvironments and Traveling by Several Modes of Transportation in Bogotá, Colombia: Protocol for a Mixed-Methods Study. (Preprint). JMIR Res. Protoc. 2020, 11, e25690. [Google Scholar] [CrossRef]
- Malagon-Rojas, J.; Parra-Barrera, E.L.; Toloza-Pérez, Y.G.; Soto, H.; Lagos, L.F.; Méndez, D.; Rico, A.; Almentero, J.E.; Quintana-Cortés, M.A.; Pinzón-Silva, D.C.; et al. Assessment of Factors Influencing Personal Exposure to Air Pollution on Main Roads in Bogota: A Mixed-Method Study. Preprints 2022. [Google Scholar] [CrossRef]
- Blackman, A.; Bonilla, J.; Villalobos, L. Quantifying COVID-19′s Silver Lining: Avoided Deaths from Air Quality Improvements in Bogotá|Publications. Available online: https://publications.iadb.org/publications/english/document/Quantifying-COVID-19s-Silver-Lining-Avoided-Deaths-from-Air-Quality-Improvements-in-Bogota.pdf (accessed on 25 April 2022).
- Morales-Solís, K.; Ahumada, H.; Rojas, J.P.; Urdanivia, F.R.; Catalán, F.; Claramunt, T.; Toro, R.A.; Manzano, C.A.; Leiva-Guzmán, M.A. The Effect of COVID-19 Lockdowns on the Air Pollution of Urban Areas of Central and Southern Chile. Aerosol Air Qual. Res. 2021, 21, 200677. [Google Scholar] [CrossRef]
- Arregocés, H.A.; Rojano, R.; Restrepo, G. Effects of Lockdown due to the COVID-19 Pandemic on Air Quality at Latin America’s Largest Open-Pit Coal Mine. Aerosol Air Qual. Res. 2021, 21, 200664. [Google Scholar] [CrossRef]
- Sanap, S.D. Global and Regional Variations in Aerosol Loading during COVID-19 Imposed Lockdown. Atmos. Environ. 2021, 246, 118132. [Google Scholar] [CrossRef] [PubMed]
- López-Feldman, A.; Chávez, C.; Vélez, M.A.; Bejarano, H.; Chimeli, A.B.; Féres, J.; Robalino, J.; Salcedo, R.; Viteri, C. Environmental Impacts and Policy Responses to COVID-19: A View from Latin America. Environ. Resour. Econ. 2020, 76, 447–517. [Google Scholar] [CrossRef]
- Yousefi, M.; Oskoei, V.; Jonidi Jafari, A.; Farzadkia, M.; Hasham Firooz, M.; Abdollahinejad, B.; Torkashvand, J. Municipal Solid Waste Management during COVID-19 Pandemic: Effects and Repercussions. Environ. Sci. Pollut. Res. 2021, 28, 32200–32209. [Google Scholar] [CrossRef] [PubMed]
- Zambrano-Monserrate, M.A.; Ruano, M.A.; Sanchez-Alcalde, L. Indirect Effects of COVID-19 on the Environment. Sci. Total Environ. 2020, 728, 138813. [Google Scholar] [CrossRef] [PubMed]
- Liang, Y.; Song, Q.; Wu, N.; Li, J.; Zhong, Y.; Zeng, W. Repercussions of COVID-19 Pandemic on Solid Waste Generation and Management Strategies. Front. Environ. Sci. Eng. 2021, 15, 115. [Google Scholar] [CrossRef]
- Zand, A.D.; Heir, A.V. Environmental Impacts of New Coronavirus Outbreak in Iran with an Emphasis on Waste Management Sector. J. Mater. Cycles Waste Manag. 2021, 23, 240–247. [Google Scholar] [CrossRef]
- Franco, J.F.; Pacheco, J.; Behrentz, E.; Belalcázar, L.C. Characterization and Source Identification of VOC Species in Bogotá, Colombia. Atmósfera 2015, 28, 1–11. [Google Scholar] [CrossRef]
- Lou, B.; Barbieri, D.M.; Passavanti, M.; Hui, C.; Gupta, A.; Hoff, I.; Lessa, D.A.; Sikka, G.; Chang, K.; Fang, K.; et al. Air Pollution Perception in Ten Countries during the COVID-19 Pandemic. Ambio 2021, 51, 531–545. [Google Scholar] [CrossRef]
- Tollefson, J. Carbon Emissions Rapidly Rebounded Following COVID Pandemic Dip. Nature 2021. [Google Scholar] [CrossRef]
- Ashraf Javid, M.; Abdullah, M.; Ali, N.; Dias, C. Structural Equation Modeling of Public Transport Use with COVID-19 Precautions: An Extension of the Norm Activation Model. Transp. Res. Interdiscip. Perspect. 2021, 12, 100474. [Google Scholar] [CrossRef]
- Abdullah, M.; Dias, C.; Muley, D.; Shahin, M. Exploring the Impacts of COVID-19 on Travel Behavior and Mode Preferences. Transp. Res. Interdiscip. Perspect. 2020, 8, 100255. [Google Scholar] [CrossRef] [PubMed]
- Rume, T.; Islam, S.M.D.-U. Environmental Effects of COVID-19 Pandemic and Potential Strategies of Sustainability. Heliyon 2020, 6, e04965. [Google Scholar] [CrossRef] [PubMed]
- OECD The Long-Term Environmental Implications of COVID-19. Available online: https://www.oecd.org/coronavirus/policy-responses/the-long-term-environmental-implications-of-COVID-19-4b7a9937/ (accessed on 11 November 2021).
- Berlin Takes Part in ‘Car-Free Day.’ Berl. Spect. 2021. Available online: https://berlinspectator.com/2021/09/22/political-correctness-berlin-takes-part-in-car-free-day-2/ (accessed on 30 January 2022).
- Noticias de Día Sin Carro 2021 en Bogotá|Bogota.gov.co. Available online: https://bogota.gov.co/tag/dia-sin-carro-2021 (accessed on 12 November 2021).
- Convention and Visitors Bureau Car-Free Day in Paris-Celebration-Paris Tourist Office. Available online: https://en.parisinfo.com/paris-show-exhibition/170120/third-car-free-day-in-paris (accessed on 11 November 2021).


Publisher’s Note: MDPI stays neutral with regard to jurisdictional claims in published maps and institutional affiliations. |
© 2022 by the authors. Licensee MDPI, Basel, Switzerland. This article is an open access article distributed under the terms and conditions of the Creative Commons Attribution (CC BY) license (https://creativecommons.org/licenses/by/4.0/).
Share and Cite
Malagón-Rojas, J.; Mendez-Molano, D.; Almentero, J.; Toloza-Pérez, Y.G.; Parra-Barrera, E.L.; Gómez-Rendón, C.P. Environmental Effects of the COVID-19 Pandemic: The Experience of Bogotá, 2020. Int. J. Environ. Res. Public Health 2022, 19, 6350. https://doi.org/10.3390/ijerph19106350
Malagón-Rojas J, Mendez-Molano D, Almentero J, Toloza-Pérez YG, Parra-Barrera EL, Gómez-Rendón CP. Environmental Effects of the COVID-19 Pandemic: The Experience of Bogotá, 2020. International Journal of Environmental Research and Public Health. 2022; 19(10):6350. https://doi.org/10.3390/ijerph19106350
Chicago/Turabian StyleMalagón-Rojas, Jeadran, Daniela Mendez-Molano, Julia Almentero, Yesith G. Toloza-Pérez, Eliana L. Parra-Barrera, and Claudia P. Gómez-Rendón. 2022. "Environmental Effects of the COVID-19 Pandemic: The Experience of Bogotá, 2020" International Journal of Environmental Research and Public Health 19, no. 10: 6350. https://doi.org/10.3390/ijerph19106350