
COVID-19 Diagnosis from Chest CT Scans: A Weakly Supervised CNN-LSTM Approach


1
Artificial Intelligence and Data Analytics, KoçDigital with BCG, Istanbul 34700, Turkey
2
Department of Radiology, VKF American Hospital, Istanbul 34365, Turkey
*
Author to whom correspondence should be addressed.
AI 2021, 2(3), 330-341; https://doi.org/10.3390/ai2030020
Submission received: 21 May 2021
/
Revised: 28 June 2021
/
Accepted: 3 July 2021
/
Published: 12 July 2021
(This article belongs to the Special Issue AI for Intelligent Healthcare)
Abstract
:Advancements in deep learning and availability of medical imaging data have led to the use of CNN-based architectures in disease diagnostic assisted systems. In spite of the abundant use of reverse transcription-polymerase chain reaction-based tests in COVID-19 diagnosis, CT images offer an applicable supplement with their high sensitivity rates. Here, we study the classification of COVID-19 pneumonia and non-COVID-19 pneumonia in chest CT scans using efficient deep learning methods to be readily implemented by any hospital. We report our deep network framework design that encompasses Convolutional Neural Networks and bidirectional Long Short Term Memory architectures. Our study achieved high specificity (COVID-19 pneumonia: 98.3%, non-COVID-19 pneumonia: 96.2% Healthy: 89.3%) and high sensitivity (COVID-19 pneumonia: 84.0%, non-COVID-19 pneumonia: 93.9% Healthy: 94.9%) in classifying COVID-19 pneumonia, non-COVID-19 pneumonia and healthy patients. Next, we provide visual explanations for the Convolutional Neural Network predictions with gradient-weighted class activation mapping (Grad-CAM). The results provided a model explainability by showing that Ground Glass Opacities, indicators of COVID-19 pneumonia disease, were captured by our convolutional neural network. Finally, we have implemented our approach in three hospitals proving its compatibility and efficiency.
1. Introduction
The outbreak of a novel coronavirus, severe acute respiratory syndrome coronavirus 2 (SARS-CoV-2), started in Wuhan, China, in December 2019 [1]. Afterwards, the aggressive human-to-human spread of the virus infected the entire world with a disease now widely referred to as COVID-19 (coronavirus disease 2019). The total number of reported cases is more than 110 million at the time of writing (22 February 2021) [2]. Although governments are taking drastic measures to fight the transmission of the virus, emerging variants are threatening progress [3].
Currently, there are two types of diagnostic tests used in the identification of COVID-19. These are molecular tests such as real-time reverse transcription-polymerase chain reaction (RT-PCR) that detect the virus’s genetic material and antigen tests that detect specific proteins from the virus. Although RT-PCR test is performed on patients showing clinical symptoms, the current tests have very high false-negative rates resulting in the lack of treatment of COVID-19 patients and consequently failing to prevent transmission of the virus to others by these patients [4]. Therefore, as an alternative, medical doctors are utilizing chest imaging technologies such as Computed tomography (CT) and X-ray images for diagnosing COVID-19. X-ray images are a fast and cheap way to detect COVID-19 [5,6]. CT scans of lungs are found to be a sensitive and accurate test for COVID-19 diagnosis [7,8]. Chest CT scans have the further advantage of identifying patients who are at the very start of the symptoms and even identifying asymptomatic patients [9]. X-ray images can catch inflammation in the lungs; however, CT scans are more effective for COVID-19 and pneumonia detection because they present a detailed picture of air sacs [8]. Hence, in this study, we have selected CT scans of lungs for identifying COVID-19 and other pneumonia.
In addition to diagnosis challenges, the prevalence of the virus and the ever-growing number of confirmed cases created a high-level demand for healthcare workers. Healthcare providers are facing intense workloads due to the pandemic [10]. There are studies that use meta-heuristic optimization algorithms [11,12] and anomaly detection methods [13] to detect COVID-19 pneumonia. To relieve the overwhelming workload, AI systems are also being used to detect and identify COVID-19 using medical imaging technologies [14,15,16,17,18,19,20,21,22]. Recent studies on radiology demonstrate promising results for COVID-19 pneumonia classification using chest CTs with the help of deep learning methodologies.
Although there are works proposing deep Convolutional Neural Networks (CNNs) without performing segmentation on CT slices [14,18], performing segmentation of CT slices is usually preferred as a preprocessing step before classification networks. The reason why segmentation before classification is commonly preferred is that lung regions in CT images can easily be extracted with segmentation networks, which are efficacious in removing redundant information and eliminating noise. In these related works, pre-trained well-known architectures such as U-Net [23], U-Net++ [24], and Deeplabv3 [25] are used for the segmentation task. As for the classification, deep CNNs, ResNext [26] based classifiers, and LSTMs are utilized. There are different class definition approaches in COVID-19 related studies, such as binary or multi-class. Binary classification is usually applied for COVID pneumonia and non-COVID pneumonia [17,22] or COVID-positive and COVID-negative [19,21]. Multiclass classification separates COVID-negative further into COVID pneumonia, non-COVID pneumonia and no pneumonia [14,15,16,18,20]. For radiologists diagnosing hundreds of patients with COVID pneumonia and distinguishing COVID pneumonia and non-COVID pneumonia in a short time is challenging. Therefore, a multi-class classifier is beneficial to radiologists for making a fast diagnosis.
Another important difference in the methods applied among the related studies is the use of slice-based or patient-level labeling. While most COVID-19 classification studies exploit slice-based CT image labels [15,17,18,20,21,22] because of its convenience, it has a significant labor cost requiring manual labeling of slices by radiologists. Therefore, patient-level labeling has also been used [14,16,19] instead of slice-based labeling, where slice-based features can be obtained with the help of deep learning methods. Notwithstanding, the studies making patient-level predictions apply restrictions on the input slice size of a single CT volume, causing information loss. These are done via random selection or interpolation.
At the beginning of the outbreak, most infected patients were diagnosed with pneumonia with unknown causes [27]. The resemblance between the chest CT scans of patients with COVID-19 and non-COVID pneumonia made identification of the disease difficult. Therefore, it is crucial to distinguish between non-COVID pneumonia and pneumonia caused by COVID-19. To achieve this, we developed a multi-class deep learning model for diagnosing COVID-19 disease, which can identify COVID-19 pneumonia, non-COVID pneumonia, and healthy patients from chest CT scans. The main contributions of this work are as follows: (1) AI-assisted medical imaging detection of COVID-19 pneumonia and non-COVID-19 pneumonia for radiologists with high specificity and sensitivity (2) proposing an efficient model which can utilize inference task using moderate memory and computational power. (3) Implementation of our two-staged deep learning framework in selected Turkish hospitals. The dataset used in this study was provided by a Turkish hospital.
2. Materials and Methods
2.1. Dataset
The dataset used in this study consists of 26,935 CT images of 348 patients with varying numbers from 13 to 261 for each patient. For each CT slice image, the labels of the patients were used. The dataset was supplied by American Hospital and labeled by their expert radiologists. CT images were exported onto a local server from the CT machines via the picture archiving and communication systems (PACS) in DICOM format. All slices were converted to PNG format with adaptive histogram equalization.
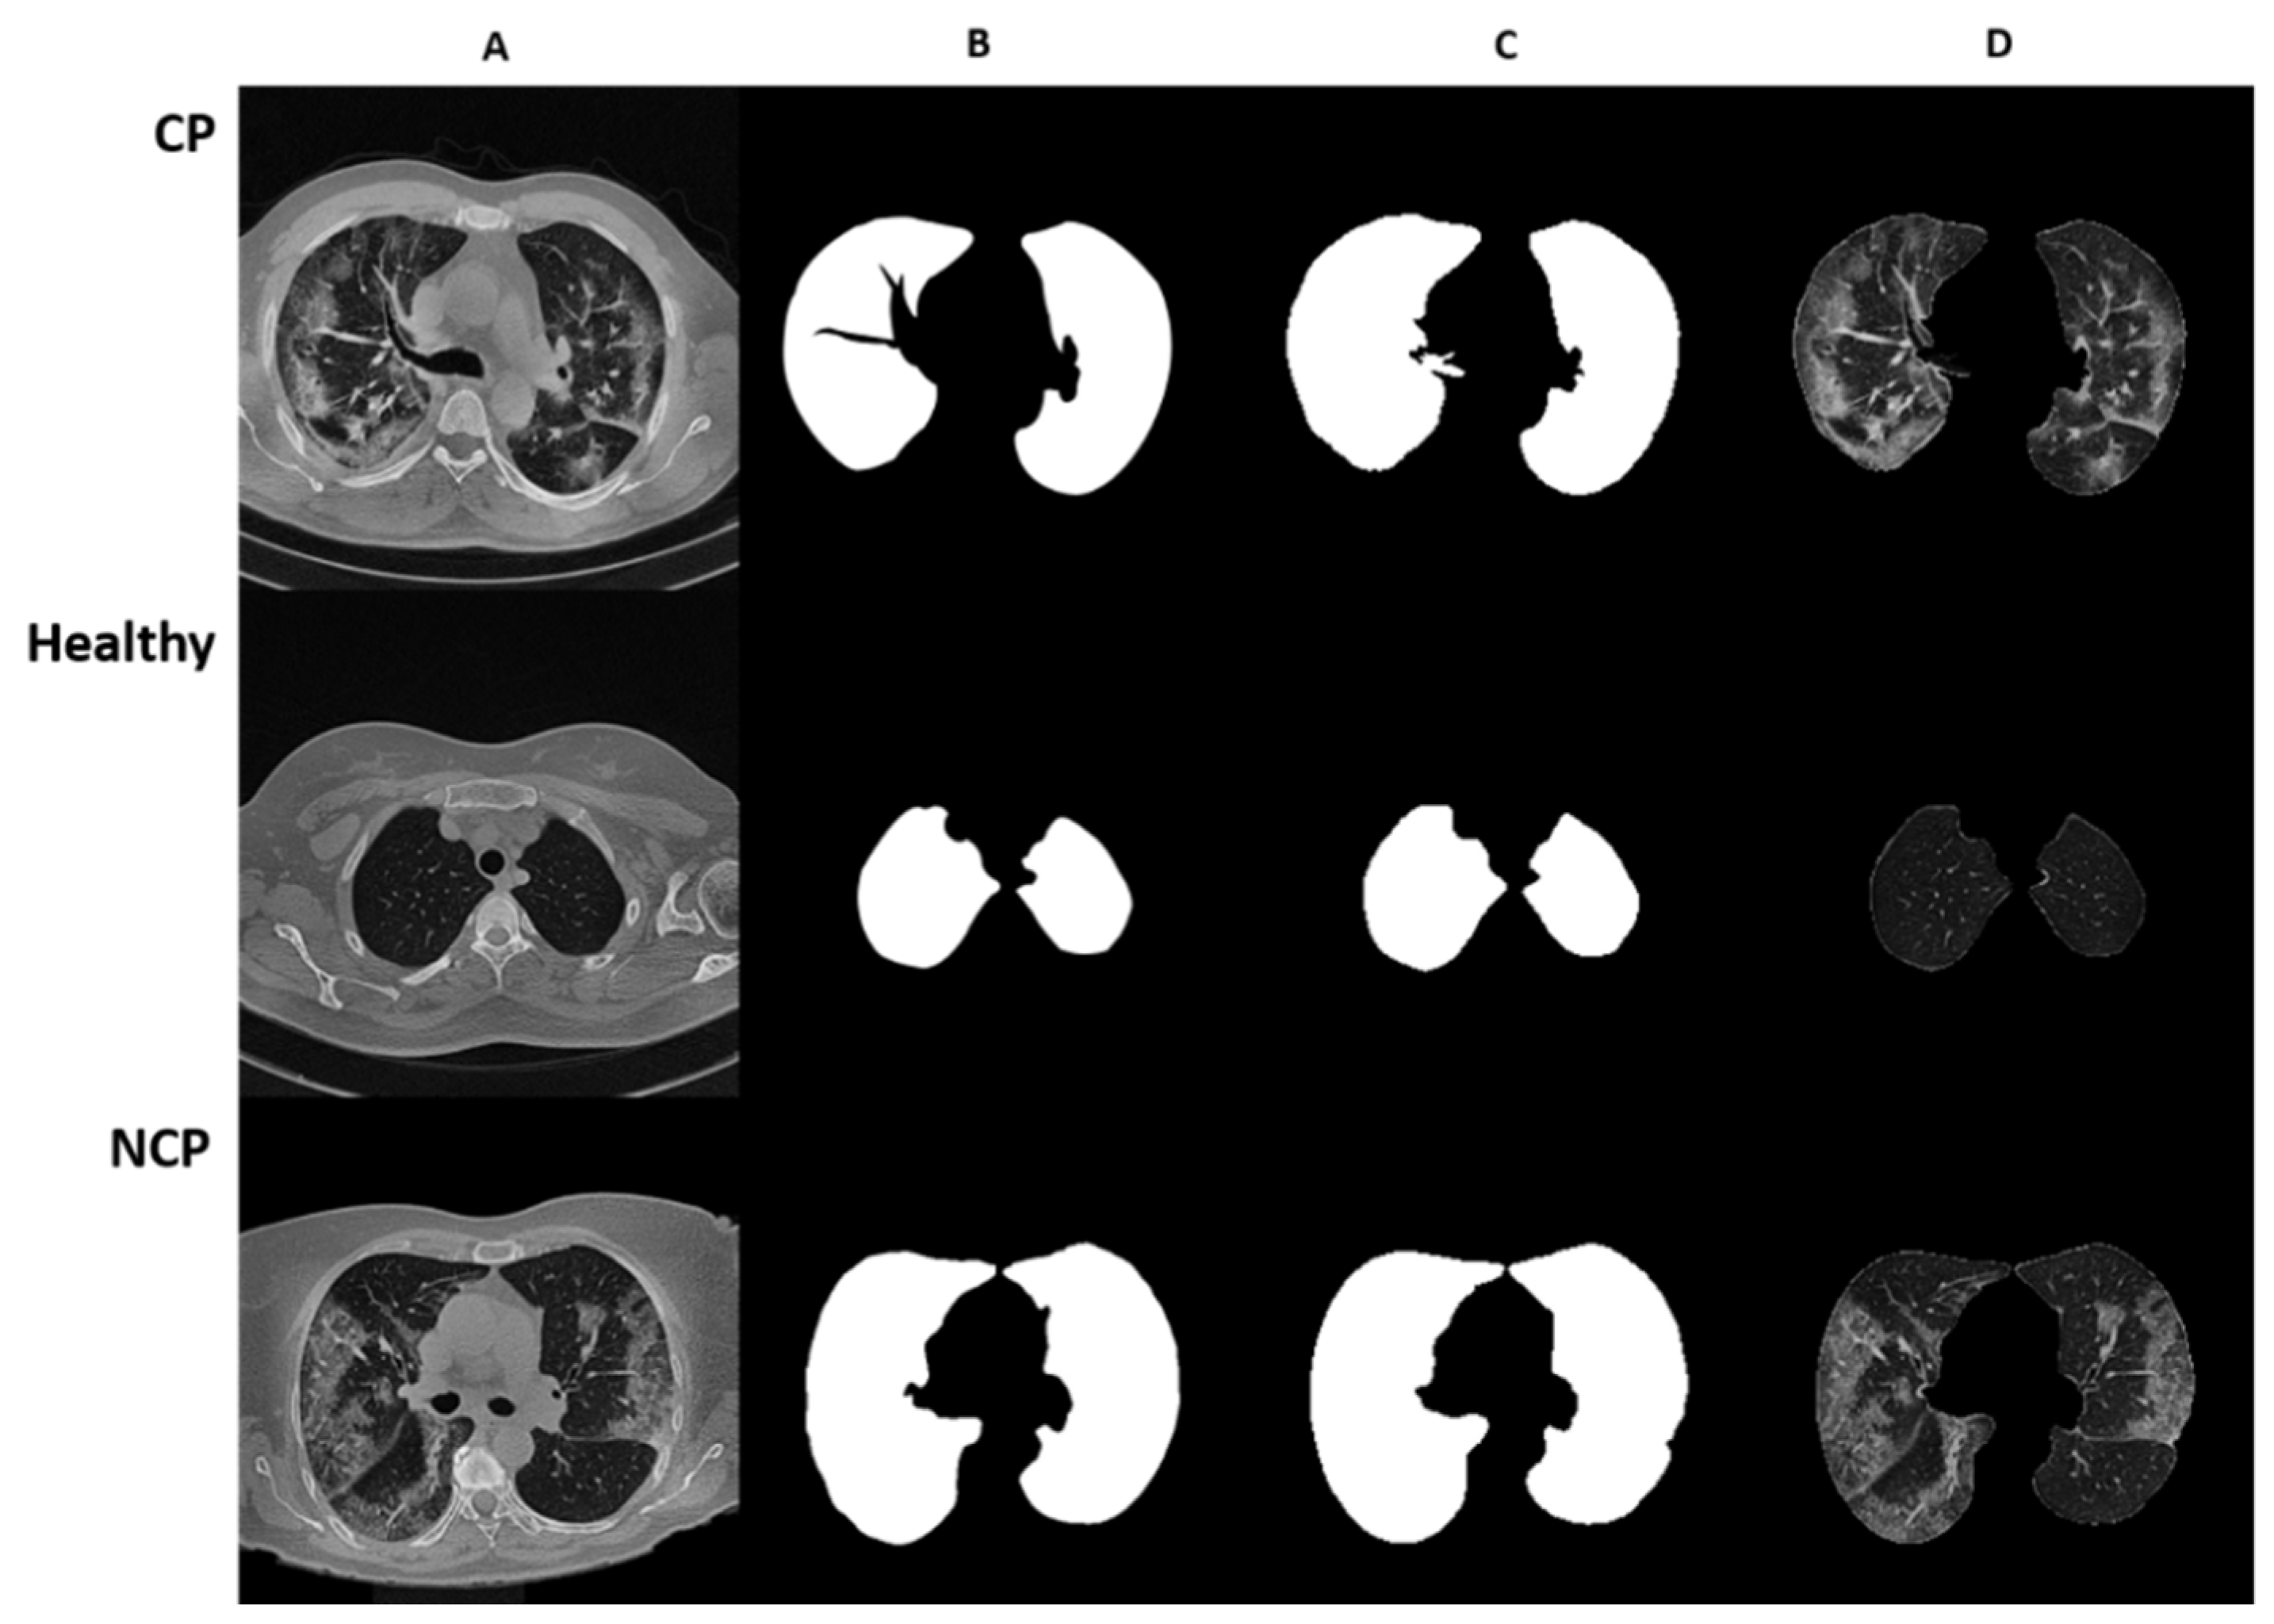
In this study, three subclasses, COVID Pneumonia (CP), Non-COVID Pneumonia (NCP), and healthy, were used. Out of 348 patients, 270 were assigned to the training set and 78 to the test set with these three subclasses. The distribution of the dataset is given in Table 1. For each of the three subclasses, CT slice images are represented in Figure 1 with original, manually segmented, AI-based segmented, and final merged format.
2.2. Preprocessing
The spatial resolution of the CT images is 512 pixels, and slice thicknesses are between 0.75 and 5.0 mm. In the image preprocessing step, CT images were scaled to 256 × 256 pixels. To eliminate redundant information in lung CT slices, CT slices were segmented, and the obtained masks were used to eliminate small lungs. The slices of each patient were grouped to have 50 slices in each group to feed the network.
2.2.1. Lung Segmentation
U-Net [23] medical image segmentation architecture was used for CT slices segmentation. In this study, U-Net architecture was trained from scratch since it is not designed for CT images. The segmentation helped to reduce the background information and assisted the classifier model by focusing on the areas with pneumonia characteristics.
The segmentation model was trained with 301 manually annotated CT slice images. The validation set was assigned randomly from 10% of the annotated dataset. The model was trained for 30 epochs achieving 0.9681 Dice-Coefficient Index proving an accurate segmentation. The learning rate of the segmentation model was set to 2 × 10⁻⁵. For data augmentation, rotating, flipping, blurring, and brightening were used. The generalization of the model was increased by applying augmentation in a random range with a randomly selected augmentation type through a data generator.
2.2.2. Segmentation-Based Elimination
The areas containing no lung information were eliminated. CT slices having small lung regions were also eliminated since those were not supplying valuable information on pneumonia characteristics. The original CT slices were masked by the ratio obtained by the maximum CT lung area. Threshold values of 0.4 for the up-side of the lung and 0.9 for the down-side of the lung were used for masking. The segmentation mask was applied to those having a scaled CT lung area smaller than the defined thresholds.
2.2.3. Slice Grouping
In this study, we adopted patient-based labeling without imposing any restrictions on input size not to have any information loss. A patient-based labeled dataset requires the number of slices in a group, which has to be defined considering the number of occurrences of pneumonia characteristics. We grouped CT images since each slice can contribute to pneumonia characteristics. We set the group size to be 50 CT slices since an exact number of slices needs to be fed to the network. In the studied dataset, the number of slices ranges from 13 to 261, as mentioned in Section 2.1. Therefore, in case the number of slices for a patient was not divisible by 50: when there were more than 25 slices remaining, the last group of slices was augmented with padding of black images, and when there were fewer than 25 slices remaining, then the number of slices in the last two groups were downsampled to 50 using interpolation.
2.3. Deep Learning Model
In this study, CNNs were used to obtain feature maps of CT slices, and bidirectional LSTMs were used for classification. This framework was applied to CT Volumes consisting of multiple CT slices for each patient. CT groups generated from CT slices for each patient were fed to the bidirectional LSTM. Then, segmented and eliminated CT groups of each patient were processed by the framework.
Two separate steps of training were performed in an end-to-end pipeline. Initially, the slices were fed to the proposed Convolutional Neural Network block for extracting spatial features. Once the spatial features were extracted from each slice, the feature maps were given to the bidirectional LSTM. The bidirectional LSTM makes the classification for the CT group by exploiting the axial dependency in the input slices and transforming the spatial features to axial features. Finally, label-based majority voting was performed for classification outputs of multiple CT groups for a particular patient. The proposed framework was motivated by the detection of violence in video frames by Hanson et al. [28].
The proposed framework was trained on a machine with a 4 NVIDIA Tesla V100 GPU and implemented on the Python programming language using the Keras library with Tensorflow backend.
2.3.1. Convolutional Neural Network
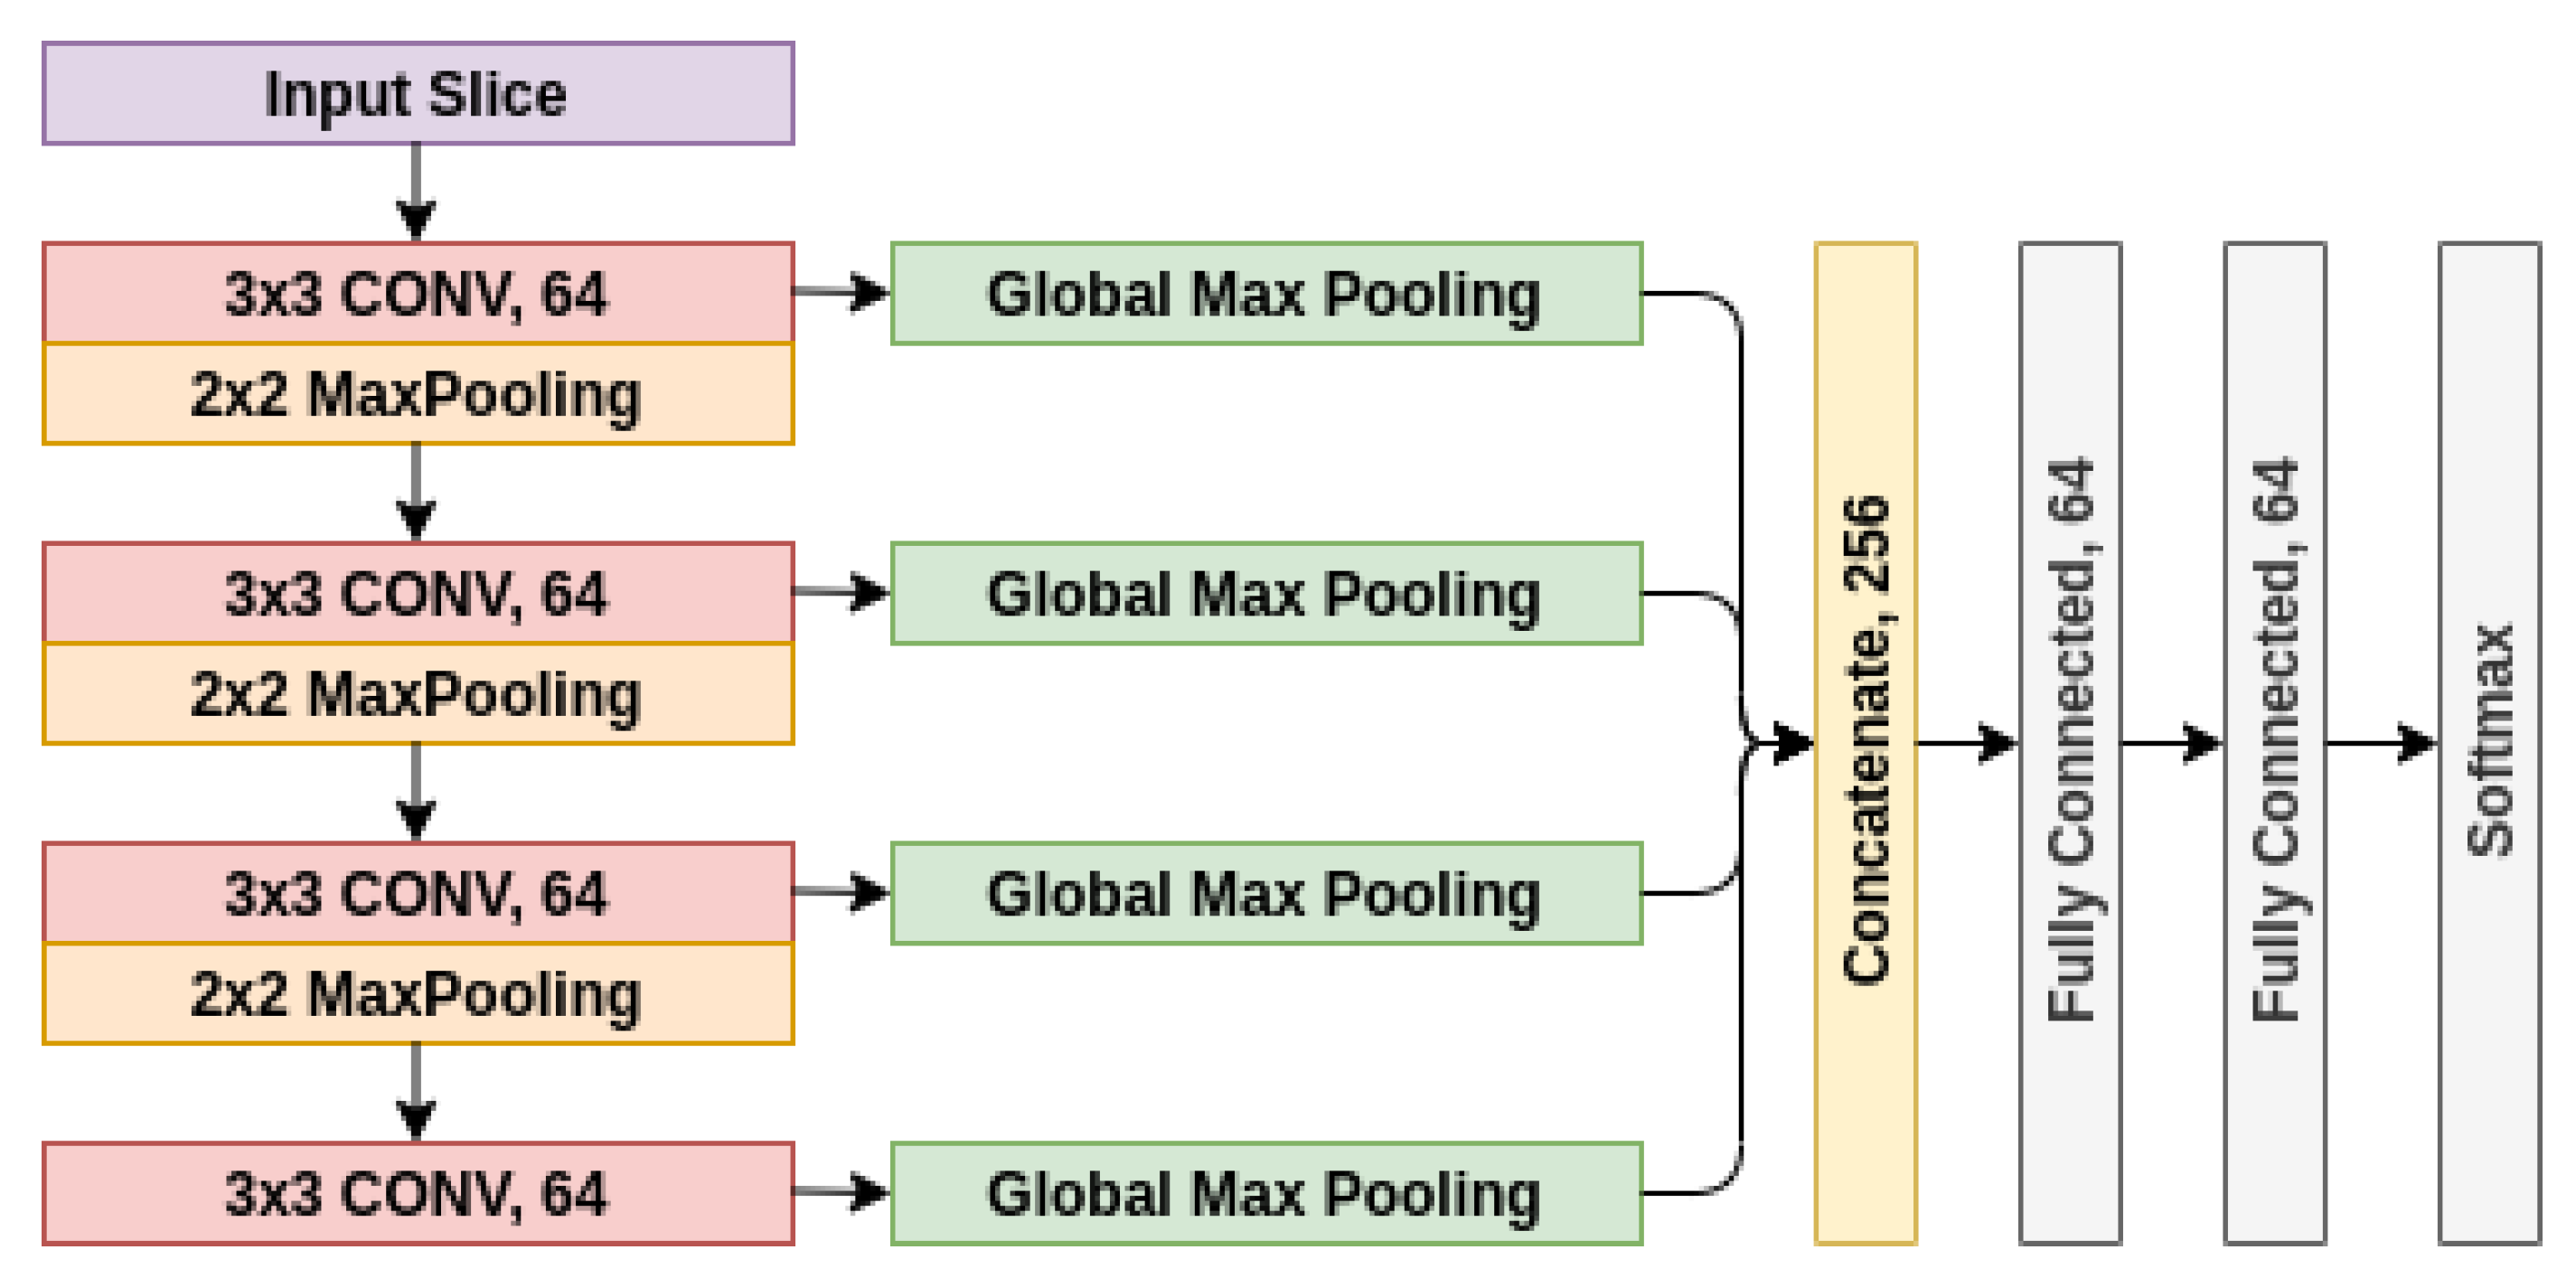
The proposed architecture was formed of 4 convolutional layers with ReLU activation function whose outputs were concatenated after applying Global Max Pooling operations. The architecture of the network is shown in Figure 2. This concatenation ensures that features from all layers are used equally.
Most of the related studies use pre-trained classification models [14,15,19,29]; however, these architectures are not particularly designed for the classification of CT volumes. The architectures such as ResNet [30] and Inception [31] are designed for the ImageNet dataset [32], where the images contain a wide variety of objects. For the ImageNet classification task, a large set of features must be learned for inference; hence, deeper networks need to be utilized. On the other hand, CT volumes can be inferred with smaller feature maps in comparison to ImageNet. The CNN encoder architecture is designed to be more efficient in terms of both memory and runtime inference.
The main purpose of training these CNN blocks is to obtain feature maps of ground glass opacities (GGO) which are prevalent in COVID pneumonia [7,33]. After training, the infection feature maps belonging to each slice were fed to the bidirectional LSTM to maintain the relationship between slices.
All layer weights were initialized randomly. The CNNs were trained for 100 epochs with an early stopping set to 25 epochs to avoid overfitting. The learning rate is set to 1e-4. The categorical cross-entropy loss function was used to calculate the loss between predictions and ground-truth labels. Rotating, flipping, blurring, and brightening were used as data augmentation techniques. A data generator augments data at each step in a random range with a randomly selected augmentation type to increase the generalization of the model.
2.3.2. Bidirectional LSTM Based Classifier
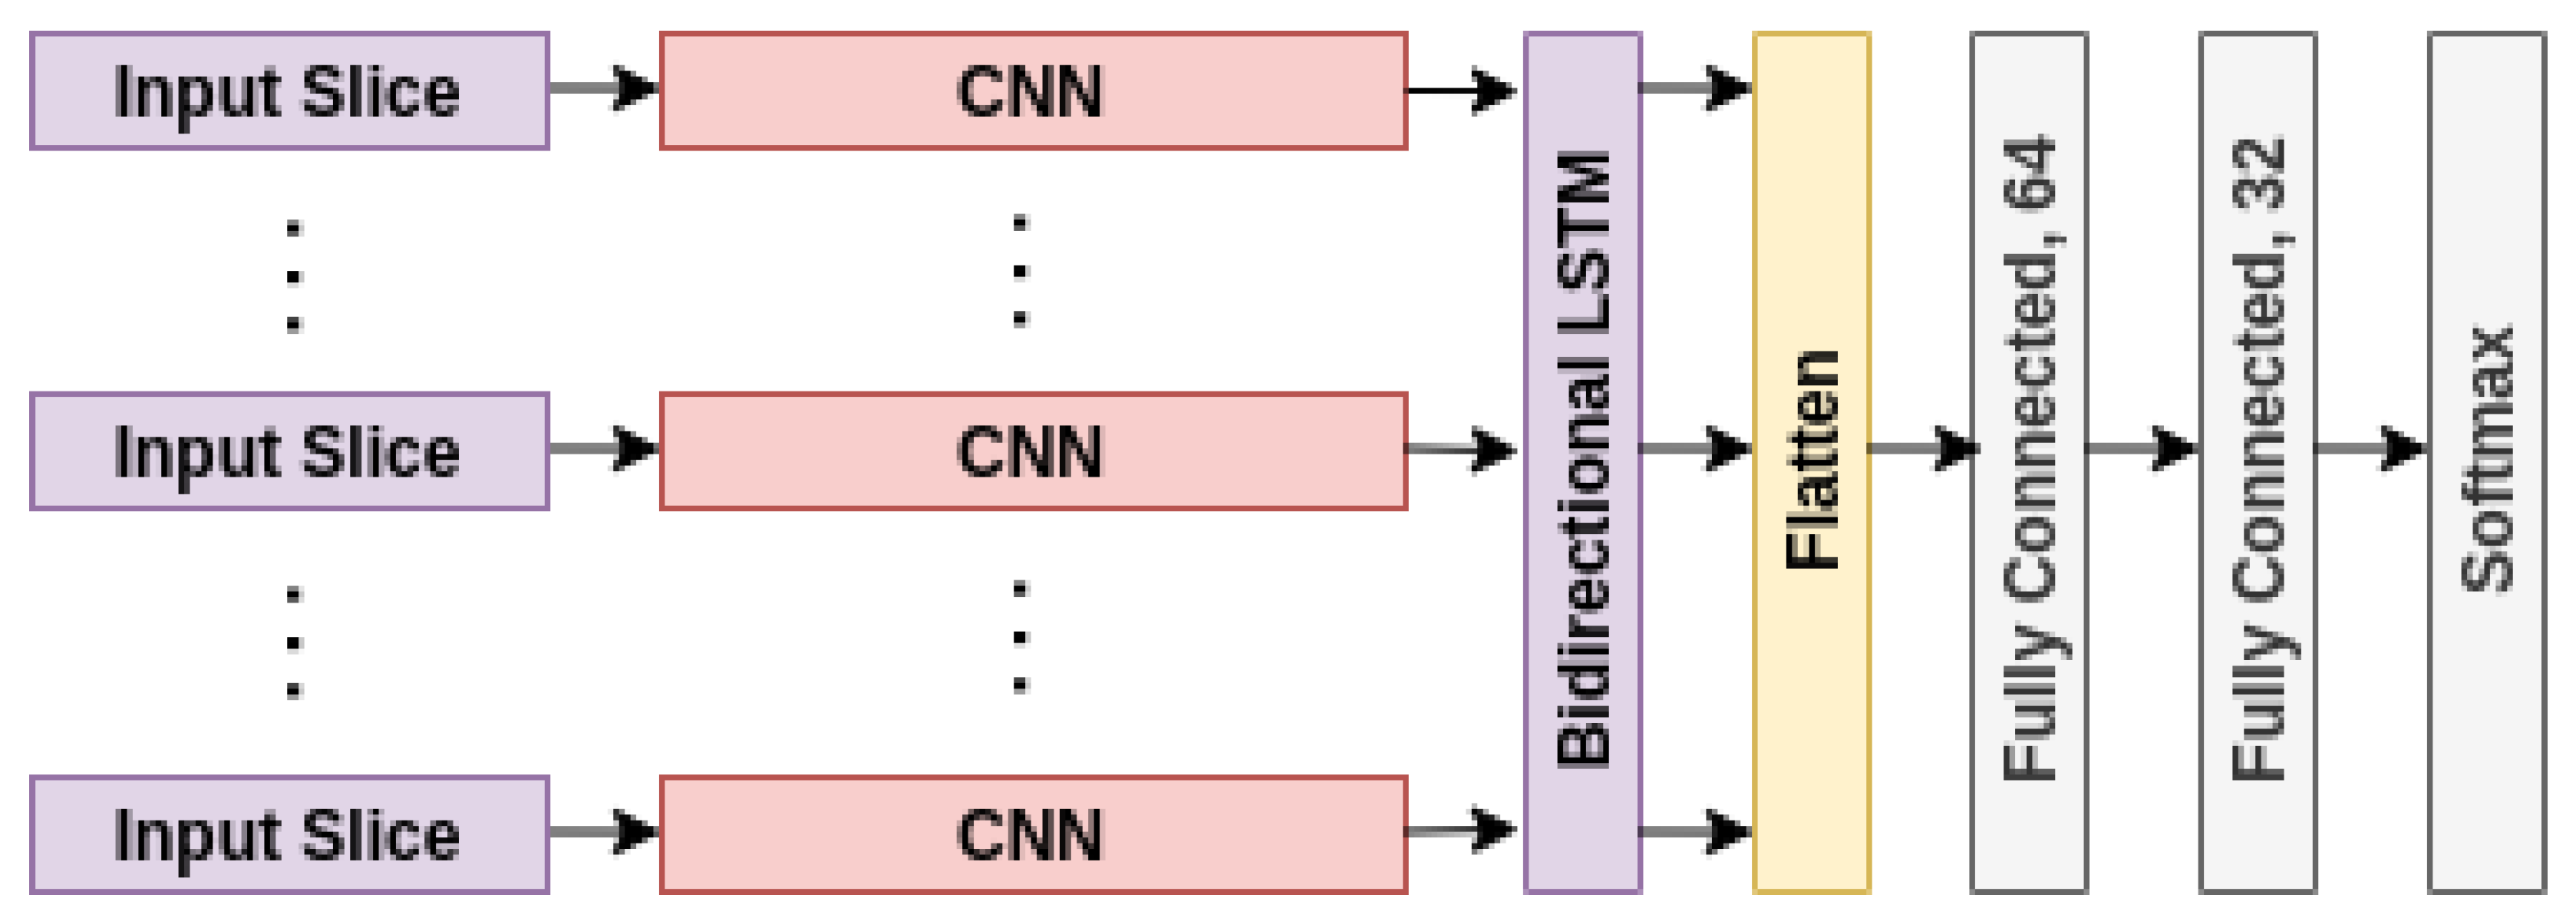
The concatenation of the output of CNN blocks for each CT slice was fed to bidirectional LSTM. The sequence model was used to emphasize the relationship between spatial feature maps of multiple and ordered CT slices. Since this relationship is both forward and backward, a bidirectional sequence model was used. The output of each bidirectional LSTM cell was preserved and flattened. It is assumed that each cell output has equal importance given the fact that spatial feature maps are agnostic in terms of the amount of infection in the lungs. The aggregated features obtained from bidirectional LSTM were then transferred to a dense layer with dropout. The obtained output of the final dense layer is a multi-class classifier of three classes for each CT group of a single patient. The architecture of the network is shown in Figure 3.
CNN blocks (explained in detail in Section 2.2.2) were initialized with the weights of feature extracting layers. CNN weights were frozen, and the rest were initialized randomly. The classifier was trained for 200 epochs with an early stopping set to 25 epochs to avoid overfitting. The same parameters used for the CNN were used for biLSTM (see Section 2.3.2).
2.4. Performance and Assessment
In the case of patients having more than one CT group, label-based majority voting was applied. First, the label with the highest classification probability for each group was selected. Next, the label having the majority vote was assigned to the label of the patient. When the output was healthy, and the group was classified as NCP or CP, the probability of non-healthy class was checked further. When the probability was greater than the predefined threshold (0.9), the label changed in favor of the non-healthy class.
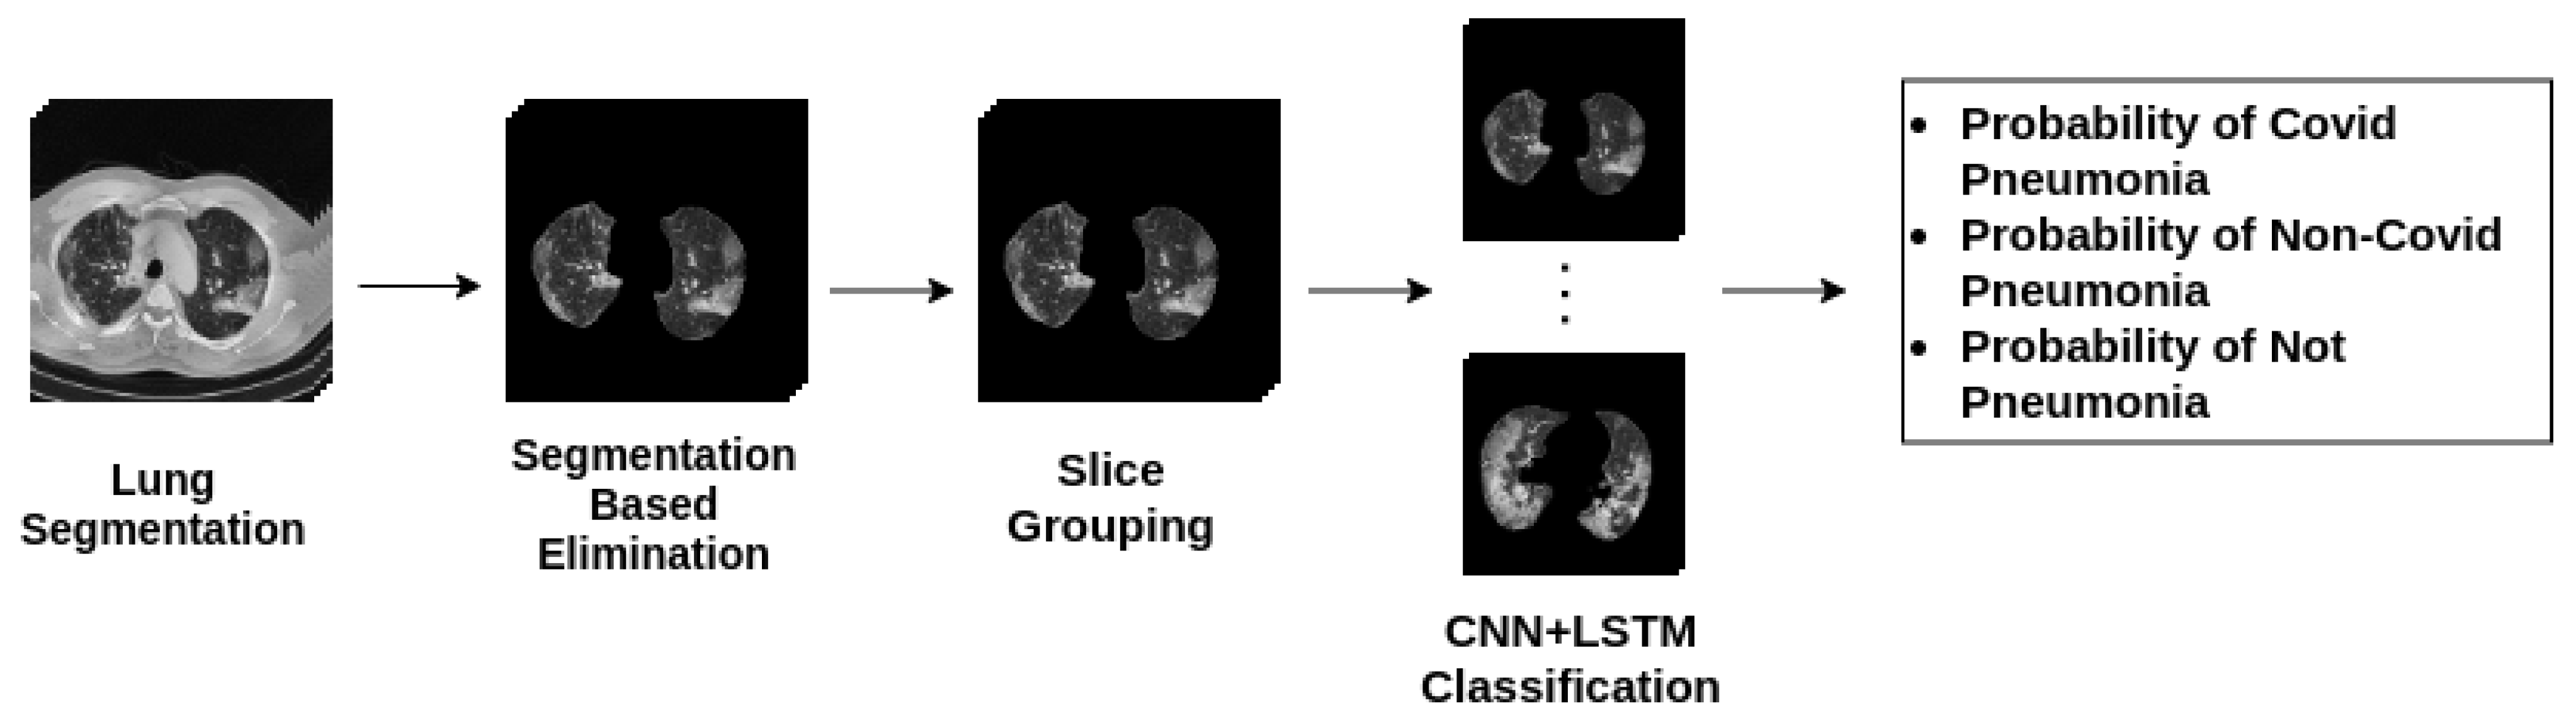
Accuracy, specificity, sensitivity, and f1-score were calculated from the label-based majority voting method outputs since pneumonia infections might not be apparent in all slices of a patient. The flowchart for the algorithm is illustrated in Figure 4.
3. Results
CT images collected from the PACS server were preprocessed then fed to the CNN + biLSTM network. CNN blocks were used for obtaining feature maps of ground glass opacities (GGO), then feature maps were fed to the biLSTM network, which maintained the relationship between spatial feature maps of multiple and ordered CT slices. The framework was designed to be efficient in runtime inference. As a result of this approach, the average inference runtime for each CT group in our test set is 0.106 s with a single NVIDIA RTX 2060 GPU and 0.409 s with an Intel i7-9750H CPU. The proposed network performance was evaluated on an independent test set. Accuracy, specificity, sensitivity, and f1-score for each class were calculated and summarized in Table 2.
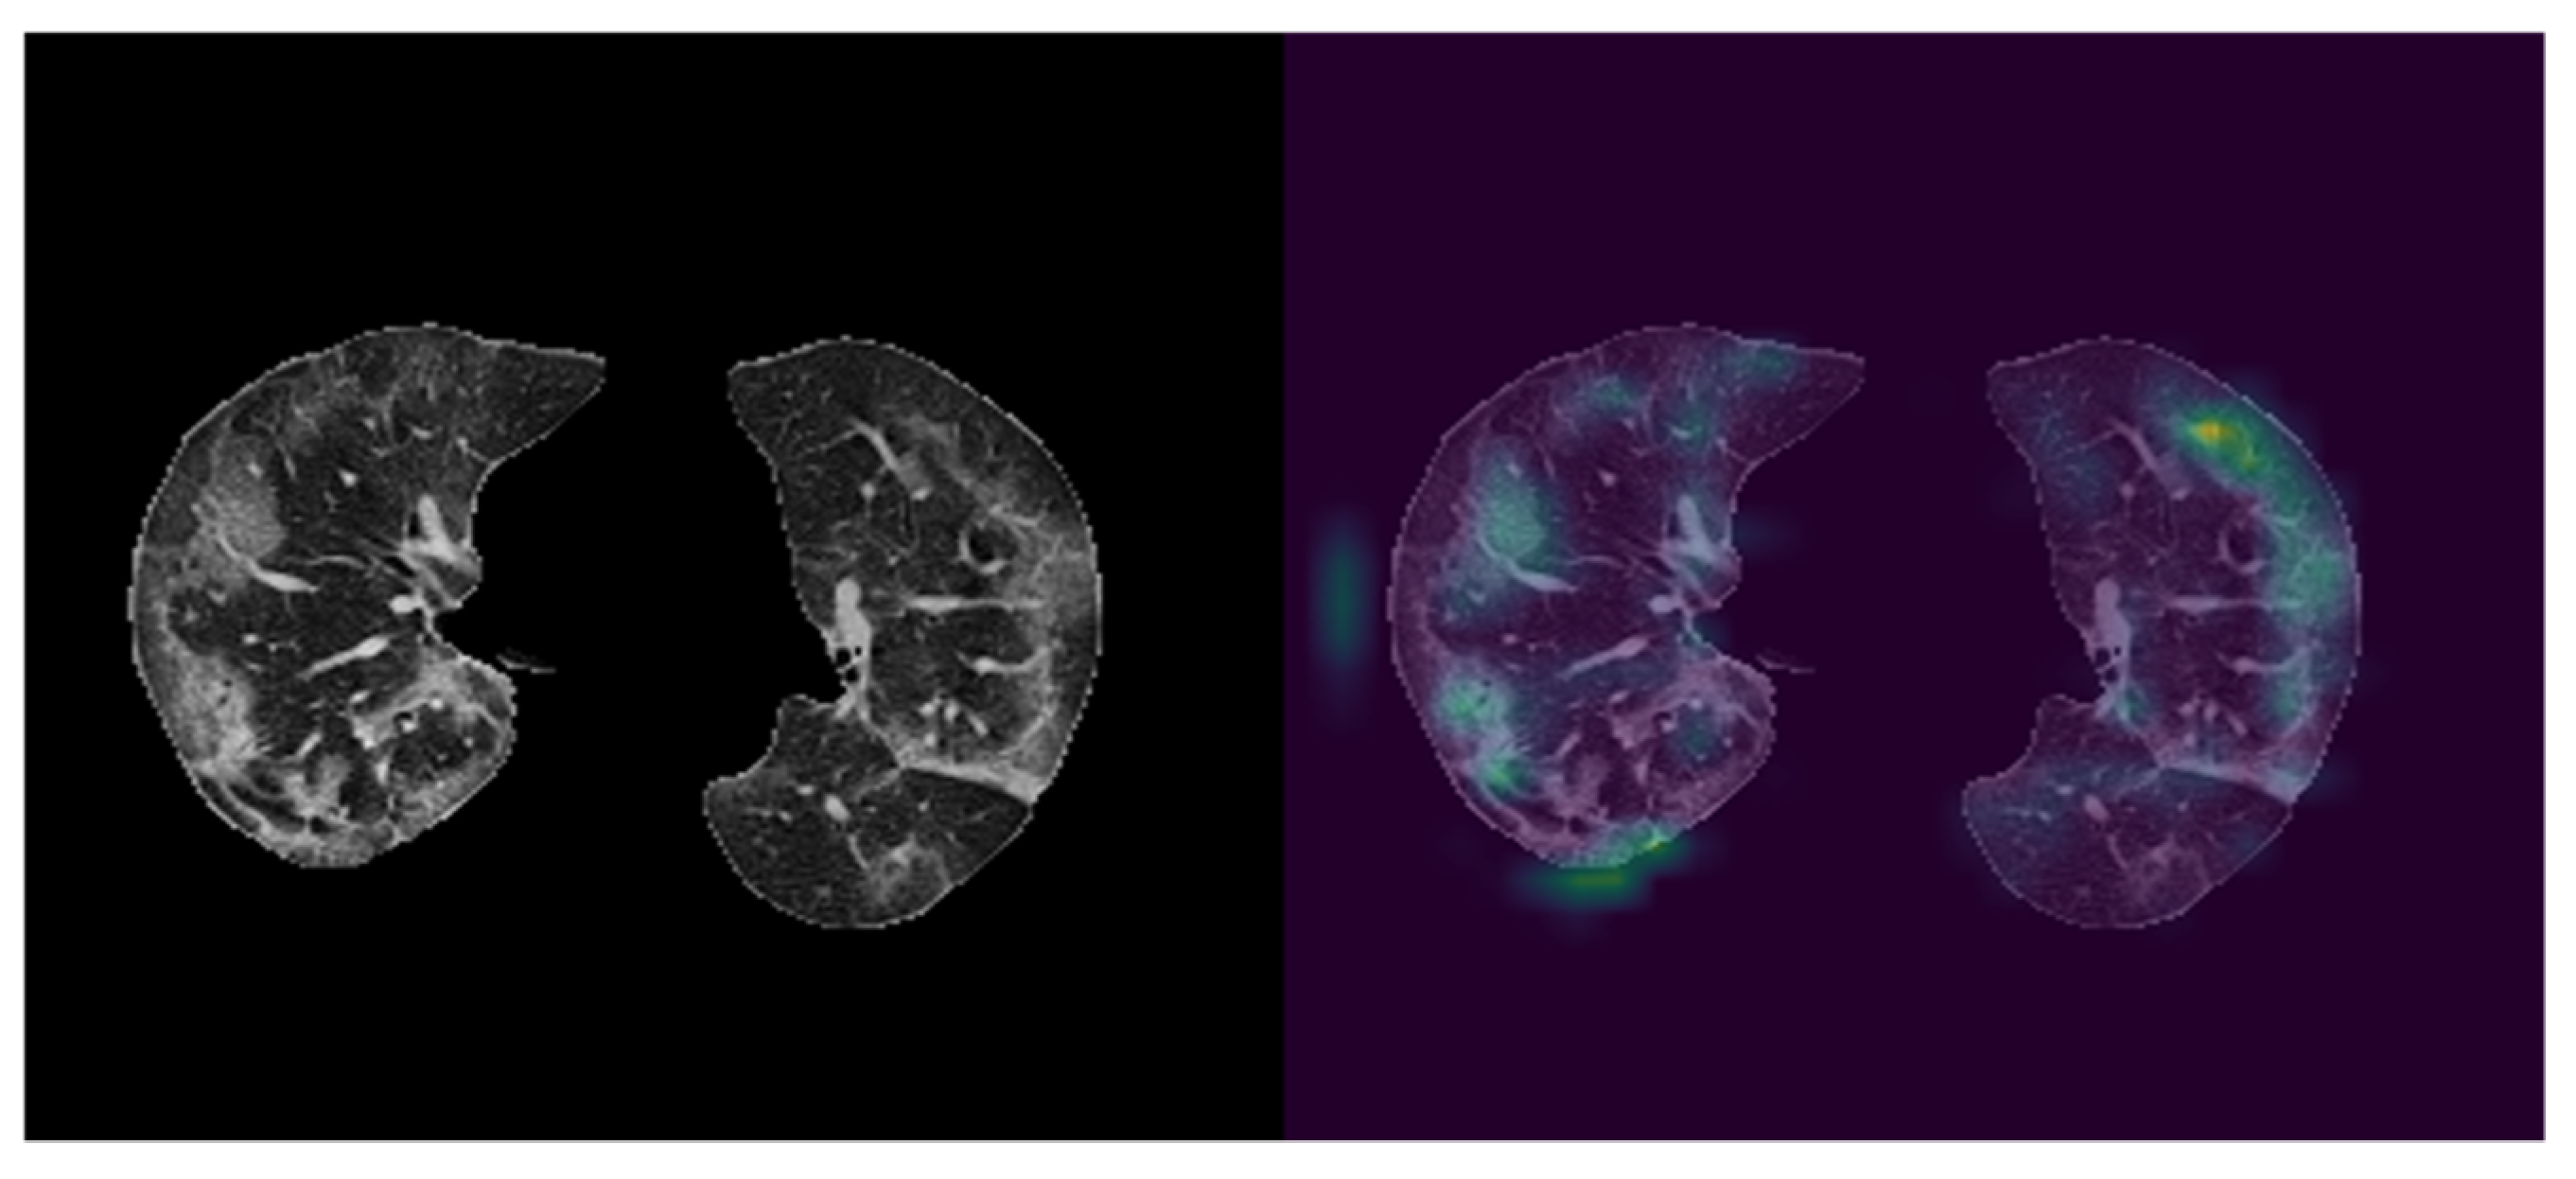
CNN blocks of the proposed network were utilized to obtain feature maps of ground glass opacities (GGO). To illustrate the effectiveness of the approach used in this study, the last class activation map (CAM) was visualized with the help of Grad-CAM (Figure 5). As it can be seen from Figure 5, features were primarily extracted from ground glass opacities.
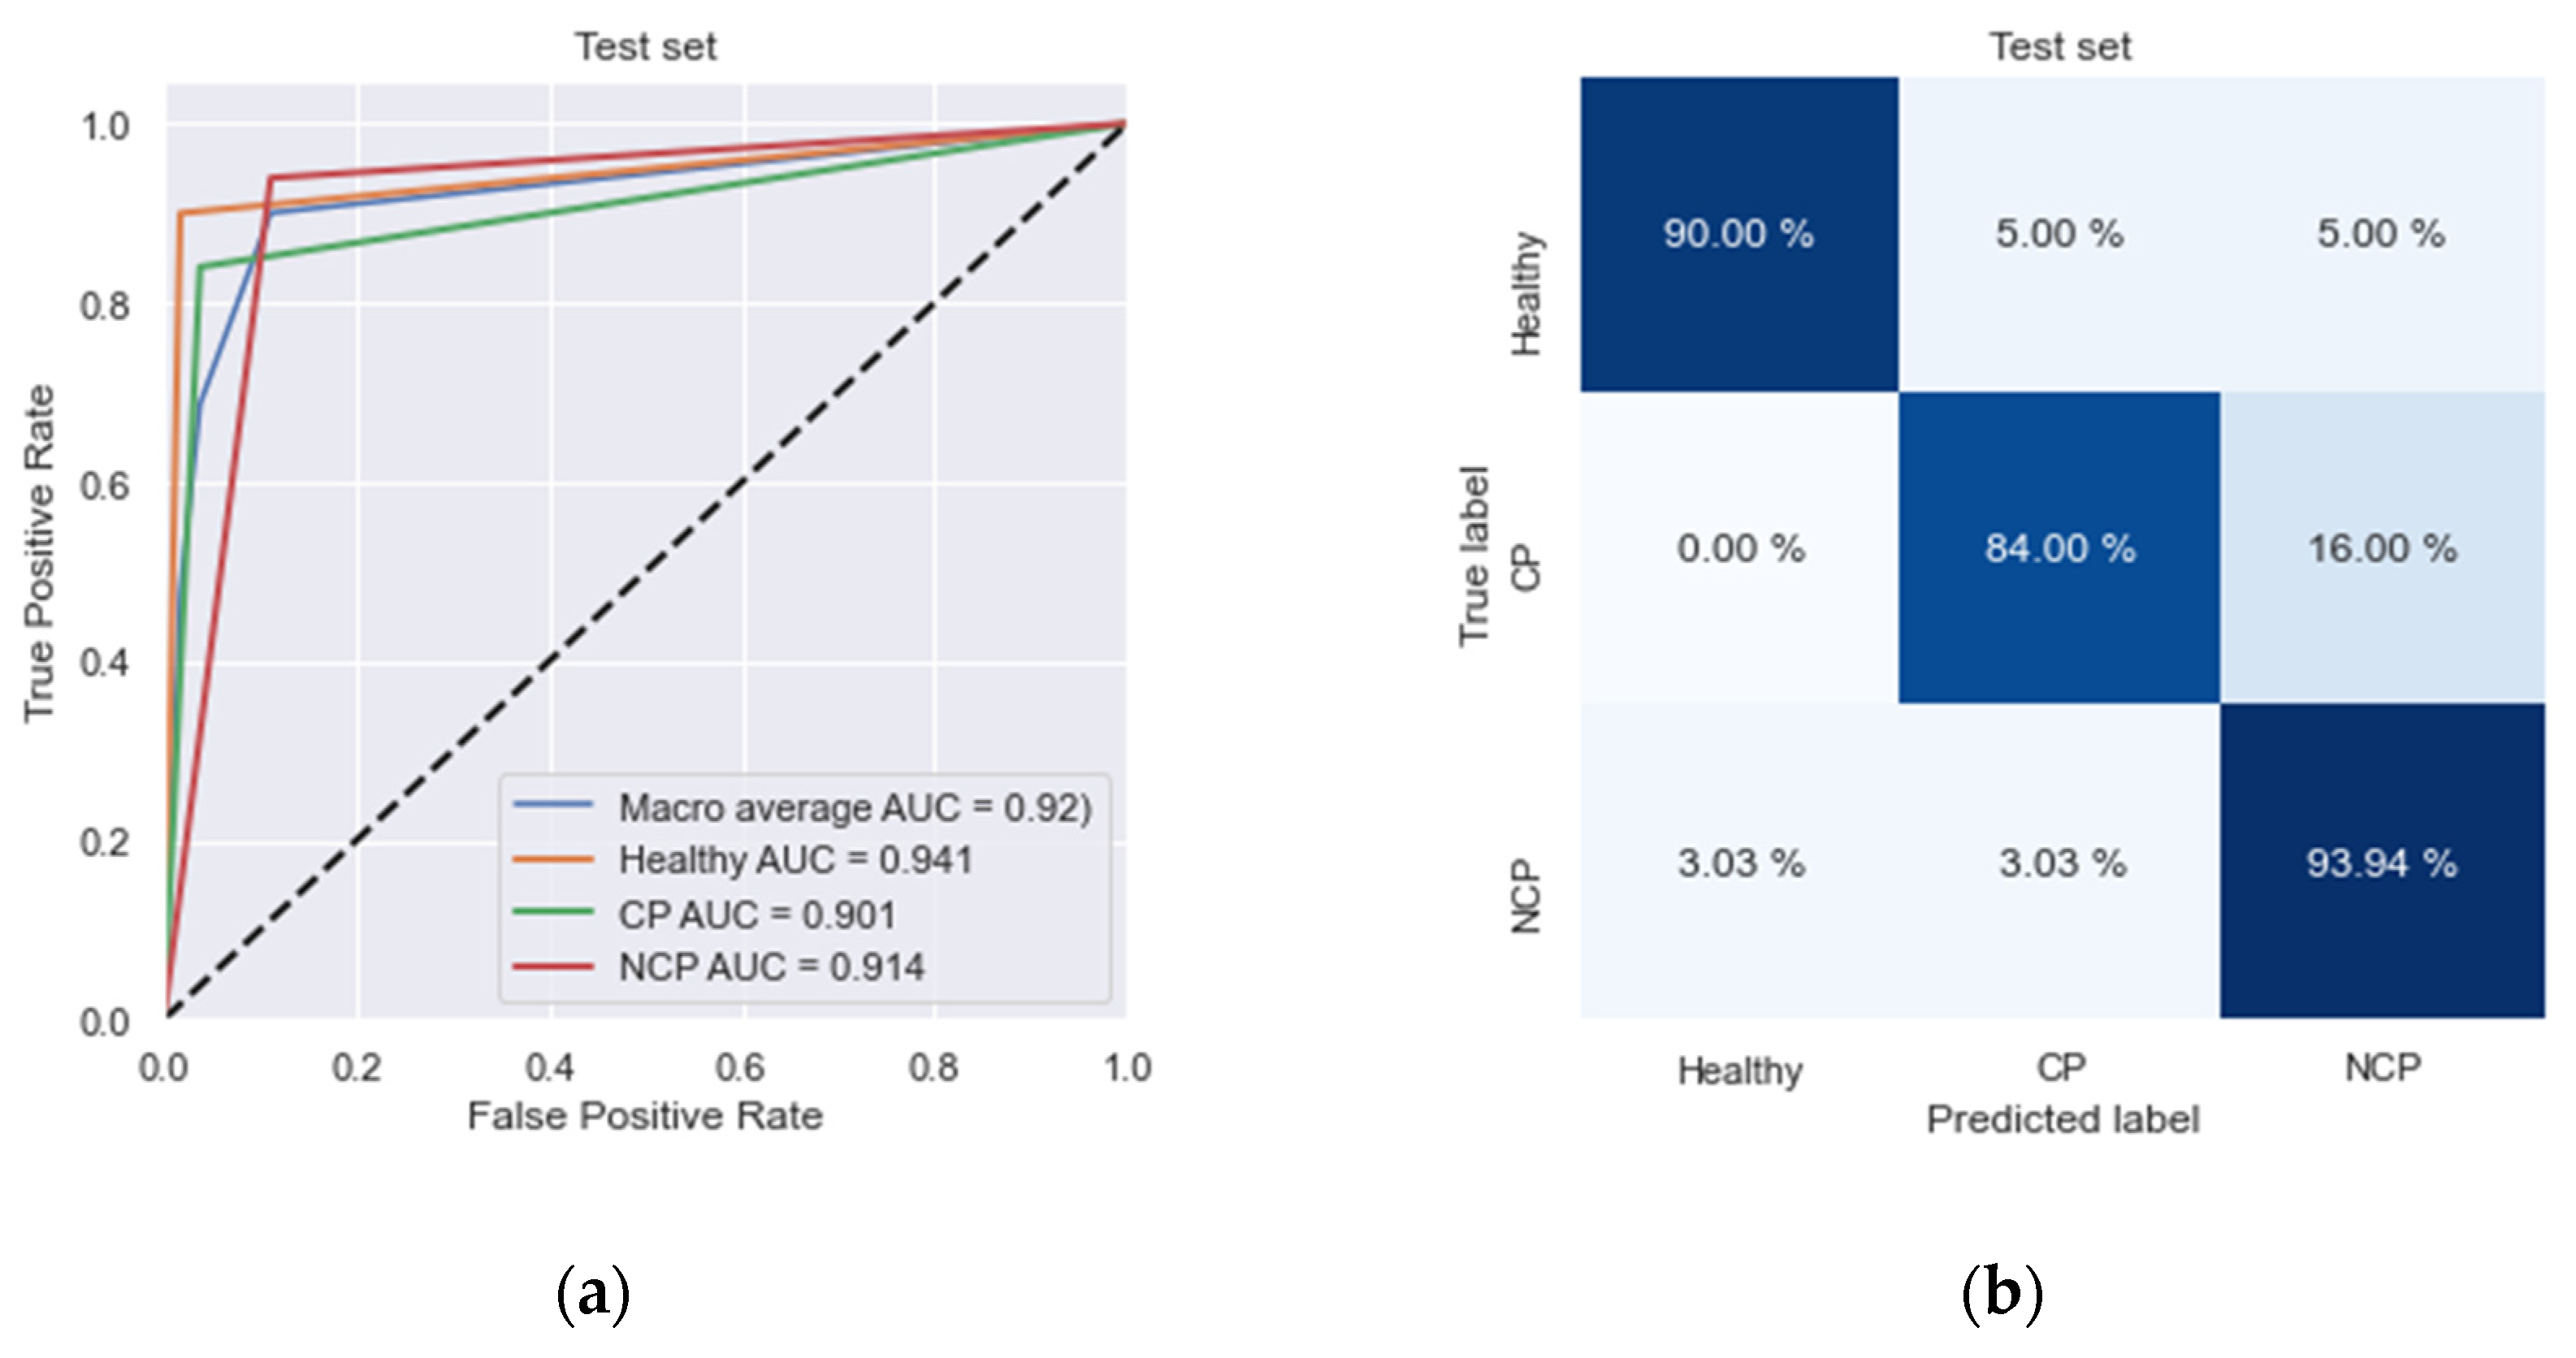
On an independent test dataset, we achieved high specificity (98.3%) and high sensitivity (84%) rates in the detection of COVID-19. Moreover, we obtained high specificity (96.2%) and high sensitivity (93.9%) rates in the detection of non-COVID-19 pneumonia as well (Table 2). The areas under receiver operating characteristics for COVID-19 and non-COVID-19 pneumonia were 0.90 and 0.91, respectively (Figure 6a).
The same algorithm (Figure 4) was applied for each patient in the test set and represented. By comparing the patients’ ground-truth labels, ROC curves and confusion matrix are plotted as shown in Figure 6. In the ROC curve, we obtained a macro average AUC value of 0.92. Table 2 shows the classification results of the patients. Our network classifies NCP patients more accurately (93.9%) than other labels, and its overall accuracy is 89.7%.
Specificity and sensitivity are mostly used for evaluating diagnosis applications. Our model’s specificity value for CP patients is 98.3%, and for NCP patients, it is 96.2%. These values show that our model can classify pneumonia-affected patients efficiently.
4. Discussion
In this work, we designed and implemented a two-staged deep learning model for the diagnosis of COVID-19 disease from chest CT volumes. Our model was able to assist the radiologists with its performance of high specificity (CP: 98.3%, NCP: 96.2%) and high sensitivity (CP: 84%, NCP: 93.9%) rates in the detection of COVID-19 pneumonia and non-COVID-19 pneumonia. This study offers a solution with reduced time and effort for diagnosing CP and NCP, as well as distinguishing healthy patients. This work was especially motivated to be easily implemented and used in the COVID-19 pandemic to manage the overwhelming workload.
We were able to collect a large number of chest CT scans from American Hospital in Turkey. The dataset included a total of 26,935 CT scans belonging to 348 distinct patients. We used patient-based labeling due to its effectiveness both in cost and time. Although slice-based labeling is advantageous for deep learning methods, these slice-based features can be obtained via CNNs. The use of slice-based or patient-based labeling was among the differences in the model architectures used in the related studies (see Table 3 for all compared features). We implemented a grouping method for the varying numbers of slices in the CT Volumes dataset. There are other methods like performing interpolations on CT Volumes or random selection of slices of a CT Volume; however, these cause information loss. Another advantage of the grouping method was exploiting every single slice of every patient. Since we grouped the CT slices of the patients, the evaluation of the class probabilities of groups was done by utilizing the majority-voting method.
In Table 3, we report a summary of the previous works that are focusing on multi-class classification on chest CT scans distinguishing COVID-19 pneumonia from community-acquired pneumonia and healthy patients. The only exception is the study from El-bana et al. [29], compartmentalizing community-acquired pneumonia by viral and bacterial. In this table, we compared the related studies with our work in terms of number and types of classes, sample size as well as architectures used for segmentation and feature extraction tasks. Furthermore, the use of pre-trained models was examined for both segmentation and feature extraction methods. The studies using sequence models to relate CT scans in a CT volume were also noted. Unlike other studies using prominent segmentation architectures, in this study, we trained on our dataset of chest CT scans since U-Net is not trained on chest CT scans.
We designed an efficient architecture to be readily used in every hospital. Since deeper architectures require high memory and high computing power, not every hospital has a suited infrastructure to fulfill those requirements. Our model utilizes inference tasks with moderate memory and computational power (0.409 s average runtime for each CT group on CPU). This work has several limitations. Foremost, we used a single dataset from a single hospital since this study was an immediate response to an urgent need. Correspondingly, this dataset is collected from a particular type of CT machine. It would be desirable to work with other datasets from other hospitals. Hence, we are in the process of collaborating with other hospitals. Nonetheless, we believe our study is a compatible and fast response to the hospitals in need. Our proposed framework can help relieve the burden on radiologists and reduce the time to diagnose COVID-19 pneumonia and non-COVID-19 pneumonia. In addition, our framework can decrease misdiagnosis of CP and NCP thanks to its high specificity and sensitivity rates.
Although explainability and interpretability are major concerns for deep learning models, there have been significant efforts in explaining the decisions of deep learning models used for medical diagnosis. Since the doctors are going to make decisions for patients relying on the AI system, it is useful to understand why the AI system makes one choice over another. There are many methods developed to explain deep learning methods trained on medical images [34], such as Grad-CAM [35]. With this in mind, we visualized the feature maps generated via Grad-CAM to provide insight into our framework.
We further evaluated Grad-CAM consistency by calculating the effect of different perturbations. We compared four perturbed states: clockwise rotated, counterclockwise rotated, 30 pixels x-axes and −15 pixels y-axes translated, and −20 pixels x-axes and 15 pixels y-axes translated (see Figure S1). We used cosine similarity (CS) to measure the effect of perturbations applied on the feature map of the original image () and the perturbed one () (see Supplementary Materials for the Equation). The average similarity between the feature map of the original image and the feature maps of the perturbed images was 0.98. The two vectorized maps are similar when CS is close to 1; therefore, calculated similarity indicates Grad-CAM consistency.
5. Conclusions
Fast and accurate diagnosis of COVID-19 forms a challenge for all countries. The available tests for fast diagnosis either have sensitivity or accuracy problems. In this regard, chest CT scans were found to be very effective in identifying COVID-19 patients. This method showed a superior practice over other methods by its power in identifying COVID-19 patients even who are at the very early stages of the disease or patients with no symptoms. In addition to this, there is a pronounced level of confirmed cases causing an additional demand for healthcare workers.
We built an AI system that can accurately differentiate COVID-19 pneumonia patients and non-COVID-19 pneumonia patients. The framework is implemented and ready for use to assist radiologists. Our two-staged deep learning classifier enables us to identify CP, NCP, and healthy patients from chest CT volumes. First, this framework is capable of learning pneumonic features in CT scans. Second, it can classify COVID-19 pneumonia and non-COVID-19 pneumonia with 84% and 93.9% accuracy. Our model achieves high specificity for CP: 98.3% and NCP: 96.2% and high sensitivity for CP: 84% and NCP: 93.9%. We have further analyzed the area under receiver operating characteristics curve (ROC-AUC) to demonstrate the effectiveness and efficiency of our proposed framework. We provide an AI system for automated, fast, and accurate diagnosis of COVID-19 using medical imaging technologies. Along with recent efforts in radiology, we demonstrate a promising COVID-19 pneumonia classification using chest CTs augmented with the help of deep learning methodologies. We showed that our system is assisting the radiologists. It is implemented in real-time in selected hospitals through a user interface.
As a next step, we showed that our framework is able to detect Ground Glass Opacities (GGO) in patients suffering from COVID-19 pneumonia via visualizations using Grad-CAM algorithm [35]. Image pixel attributions can be visualized upon calculating the gradient from the output to a given deeper layer. Grad-CAM reconstructs maps as a weighted combination of forward neuron activation, with weights based on global average pooling and backpropagation outputs to a target layer. This way, COVID-19 patients can be distinguished from the others by providing a demonstration of the proposed models with pneumonia indicating top features. Note that this framework identifies not only CP but also NCP owing to its capability to generate two-dimensional feature maps. This can be easily further compartmentalized for additional pneumonia types according to the needs of the hospitals and healthcare workers. Overall, our work offers an easily adaptable framework that has already been implemented and is being used. As such, it offers implementation in numerous hospitals with low computing powers.
Supplementary Materials
The following are available online at https://www.mdpi.com/article/10.3390/ai2030020/s1, Figure S1: Illustration of the original CT slices (left) and activation maps (right) of the original (A) and the perturbed images (B-E) based on Grad-CAM.
Author Contributions
M.K. conceptualized the framework, developed the methodology, implemented and validated the framework. S.A. provided the curated dataset. Z.Ö. performed the literature review and wrote the manuscript, and A.T. reviewed and edited it. All authors have read and agreed to the published version of the manuscript.
Funding
This research received no external funding.
Institutional Review Board Statement
Not applicable.
Informed Consent Statement
Not applicable.
Data Availability Statement
The raw image dataset generated or analyzed during this study is not publicly available due to the DICOM metadata containing information that could compromise patient privacy/consent.
Acknowledgments
This work was supported by the KoçDigital. The authors thank Baturalp Güner from American Hospital for providing the labeled data for this project. We thank Huawei Turkey for providing the servers. The authors gratefully acknowledge the support and guidance of Acar Erdinç on the development of the architecture. The authors also thank Kerem Ozkarakas for supporting the framework development.
Conflicts of Interest
The authors declare no conflict of interest. The funders had no role in the design of the study; in the collection, analyses, or interpretation of data; in the writing of the manuscript, or in the decision to publish the results.
Abbreviations
The following abbreviations are used in this manuscript:
| AI | Artificial Intelligence |
| AUC | Area Under Curve |
| biLSTM | bidirectional Long Short Term Memory |
| COVID-19 | Coronavirus Disease 2019 |
| CP | COVID-19 pneumonia |
| CNN | Convolutional Neural Network |
| CT | Computed Tomography |
| DICOM | Digital Imaging and Communications in Medicine |
| DL | Deep Learning |
| Grad-CAM | gradient-weighted class activation mapping |
| GGO | Ground Glass Opacities |
| PACS | Picture Archive and Communication System |
| ROC | Receiver Operating Characteristic |
| RT-PCR | Reverse Transcription-Polymerase Chain Reaction |
| NCP | non-COVID-19 pneumonia |
References
- Hui, D.S.; Azhar, E.I.; Madani, T.A.; Ntoumi, F.; Kock, R.; Dar, O.; Ippolito, G.; McHugh, T.D.; Memish, Z.A.; Drosten, C.; et al. The continuing 2019-nCoV epidemic threat of novel coronaviruses to global health—The latest 2019 novel coronavirus outbreak in Wuhan, China. Int. J. Infect. Dis. 2020, 91, 264–266. [Google Scholar] [CrossRef] [Green Version]
- WHO Covid-19. Available online: https://covid19.who.int/ (accessed on 22 February 2021).
- CDC Covid Data Tracker Weekly Review. Available online: https://www.cdc.gov/coronavirus/2019-ncov/covid-data/covidview/index.html (accessed on 23 February 2021).
- Xiao, A.T.; Tong, Y.X.; Zhang, S. False negative of RT-PCR and prolonged nucleic acid conversion in COVID-19: Rather than recurrence. J. Med. Virol. 2020, 92, 1755–1756. [Google Scholar] [CrossRef] [Green Version]
- Sumari, P.; Syed, S.J.; Abualigah, L. A Novel Deep Learning Pipeline Architecture based on CNN to Detect Covid-19 in Chest X-ray Images. Turk. J. Comput. Math. Educ. (TURCOMAT) 2021, 12, 2001–2011. [Google Scholar]
- Ozturk, T.; Talo, M.; Yildirim, E.A.; Baloglu, U.B.; Yildirim, O.; Rajendra Acharya, U. Automated detection of COVID-19 cases using deep neural networks with X-ray images. Comput. Biol. Med. 2020, 121, 103792. [Google Scholar] [CrossRef]
- Ai, T.; Yang, Z.; Hou, H.; Zhan, C.; Chen, C.; Lv, W.; Tao, Q.; Sun, Z.; Xia, L. Correlation of Chest CT and RT-PCR Testing for Coronavirus Disease 2019 (COVID-19) in China: A Report of 1014 Cases. Radiology 2020, 296, E32–E40. [Google Scholar] [CrossRef] [PubMed] [Green Version]
- Panwar, H.; Gupta, P.K.; Siddiqui, M.K.; Morales-Menendez, R.; Bhardwaj, P.; Singh, V. A deep learning and grad-CAM based color visualization approach for fast detection of COVID-19 cases using chest X-ray and CT-Scan images. Chaos Solitons Fractals 2020, 140, 110190. [Google Scholar] [CrossRef]
- Shi, H.; Han, X.; Jiang, N.; Cao, Y.; Alwalid, O.; Gu, J.; Fan, Y.; Zheng, C. Radiological findings from 81 patients with COVID-19 pneumonia in Wuhan, China: A descriptive study. Lancet Infect. Dis. 2020, 20, 425–434. [Google Scholar] [CrossRef]
- Moazzami, B.; Razavi-Khorasani, N.; Dooghaie Moghadam, A.; Farokhi, E.; Rezaei, N. COVID-19 and telemedicine: Immediate action required for maintaining healthcare providers well-being. J. Clin. Virol. 2020, 126, 104345. [Google Scholar] [CrossRef] [PubMed]
- Yousri, D.; Abd Elaziz, M.; Abualigah, L.; Oliva, D.; Al-Qaness, M.A.; Ewees, A.A. COVID-19 X-ray images classification based on enhanced fractional-order cuckoo search optimizer using heavy-tailed distributions. Appl. Soft Comput. 2021, 101, 107052. [Google Scholar] [CrossRef] [PubMed]
- Abualigah, L.; Yousri, D.; Abd Elaziz, M.; Ewees, A.A.; Al-qaness, M.A.; Gandomi, A.H. Aquila Optimizer: A novel meta-heuristic optimization Algorithm. Comput. Ind. Eng. 2021, 157, 107250. [Google Scholar] [CrossRef]
- Zhang, J.; Xie, Y.; Pang, G.; Liao, Z.; Verjans, J.; Li, W.; Sun, Z.; He, J.; Li, Y.; Shen, C. Viral Pneumonia Screening on Chest X-rays Using Confidence-Aware Anomaly Detection. IEEE Trans. Med. Imaging 2021, 40, 879–890. [Google Scholar] [CrossRef] [PubMed]
- Lee, E.H.; Zheng, J.; Colak, E.; Mohammadzadeh, M.; Houshmand, G.; Bevins, N.; Kitamura, F.; Altinmakas, E.; Reis, E.P.; Kim, J.K.; et al. Deep COVID DeteCT: An international experience on COVID-19 lung detection and prognosis using chest CT. NPJ Digit. Med. 2021, 4, 11. [Google Scholar] [CrossRef] [PubMed]
- Li, L.; Qin, L.; Xu, Z.; Yin, Y.; Wang, X.; Kong, B.; Bai, J.; Lu, Y.; Fang, Z.; Song, Q.; et al. Using Artificial Intelligence to Detect COVID-19 and Community-acquired Pneumonia Based on Pulmonary CT: Evaluation of the Diagnostic Accuracy. Radiology 2020, 296, E65–E71. [Google Scholar] [CrossRef] [PubMed]
- Zhang, K.; Liu, X.; Shen, J.; Li, Z.; Sang, Y.; Wu, X.; Zha, Y.; Liang, W.; Wang, C.; Wang, K.; et al. Clinically Applicable AI System for Accurate Diagnosis, Quantitative Measurements, and Prognosis of COVID-19 Pneumonia Using Computed Tomography. Cell 2020, 181, 1423–1433.e11. [Google Scholar] [CrossRef] [PubMed]
- Chen, J.; Wu, L.; Zhang, J.; Zhang, L.; Gong, D.; Zhao, Y.; Chen, Q.; Huang, S.; Yang, M.; Yang, X.; et al. Deep learning-based model for detecting 2019 novel coronavirus pneumonia on high-resolution computed tomography. Sci. Rep. 2020, 10, 19196. [Google Scholar] [CrossRef]
- Wang, X.; Deng, X.; Fu, Q.; Zhou, Q.; Feng, J.; Ma, H.; Liu, W.; Zheng, C. A Weakly-Supervised Framework for COVID-19 Classification and Lesion Localization From Chest CT. IEEE Trans. Med. Imaging 2020, 39, 2615–2625. [Google Scholar] [CrossRef]
- Mohammed, A.; Wang, C.; Zhao, M.; Ullah, M.; Naseem, R.; Wang, H.; Pedersen, M.; Cheikh, F.A. Weakly-Supervised Network for Detection of COVID-19 in Chest CT Scans. IEEE Access 2020, 8, 155987–156000. [Google Scholar] [CrossRef]
- Hasan, A.M.; Al-Jawad, M.M.; Jalab, H.A.; Shaiba, H.; Ibrahim, R.W.; Al-Shamasneh, A.R. Classification of Covid-19 Coronavirus, Pneumonia and Healthy Lungs in CT Scans Using Q-Deformed Entropy and Deep Learning Features. Entropy 2020, 22, 517. [Google Scholar] [CrossRef]
- Ahsan, M.M.; Gupta, K.D.; Islam, M.M.; Sen, S.; Rahman, M.L.; Shakhawat Hossain, M. COVID-19 Symptoms Detection Based on NasNetMobile with Explainable AI Using Various Imaging Modalities. Mach. Learn. Knowl. Extr. 2020, 2, 490–504. [Google Scholar] [CrossRef]
- Alshazly, H.; Linse, C.; Barth, E.; Martinetz, T. Explainable COVID-19 Detection Using Chest CT Scans and Deep Learning. Sensors 2021, 21, 455. [Google Scholar] [CrossRef]
- Ronneberger, O.; Fischer, P.; Brox, T. U-Net: Convolutional Networks for Biomedical Image Segmentation; Springer: Cham, Switzerland, 2018; pp. 234–241. [Google Scholar]
- Zhou, Z.; Siddiquee, M.M.R.; Tajbakhsh, N.; Liang, J. UNet++: A Nested U-Net Architecture for Medical Image Segmentation. Deep Learn. Med. Image Anal. Multimodal Learn. Clin. Decis Support. (2018) 2018, 11045, 3–11. [Google Scholar] [CrossRef] [PubMed] [Green Version]
- Chen, L.-C.; Papandreou, G.; Schroff, F.; Adam, H. Rethinking atrous convolution for semantic image segmentation. arXiv 2017, arXiv:1706.05587. [Google Scholar]
- Xie, S.; Girshick, R.; Dollár, P.; Tu, Z.; He, K. Aggregated Residual Transformations for Deep Neural Networks. In Proceedings of the 2017 IEEE Conference on Computer Vision and Pattern Recognition (CVPR), Hawaii, HI, USA, 21–26 July 2017; pp. 5987–5995. [Google Scholar]
- WHO Novel Coronavirus—China. Available online: http://www.who.int/csr/don/12-january-2020-novel-coronavirus-china/en/ (accessed on 19 January 2021).
- Hanson, A.; PNVR, K.; Krishnagopal, S.; Davis, L. Bidirectional Convolutional LSTM for the Detection of Violence in Videos; Springer: Cham, Switzerland, 2018; pp. 280–295. [Google Scholar]
- El-bana, S.; Al-Kabbany, A.; Sharkas, M. A multitask pipeline with specialized streams for classification and segmentation of infection manifestations in covid-19 scans. PeerJ Comput. Sci. 2020, 6, e303. [Google Scholar] [CrossRef] [PubMed]
- He, K.; Zhang, X.; Ren, S.; Sun, J. Deep residual learning for image recognition. In Proceedings of the IEEE Conference on Computer Vision and Pattern Recognition, Las Vegas, NV, USA, 27–30 June 2016; pp. 770–778. [Google Scholar]
- Szegedy, C.; Liu, W.; Jia, Y.; Sermanet, P.; Reed, S.; Anguelov, D.; Erhan, D.; Vanhoucke, V.; Rabinovich, A. Going deeper with convolutions. In Proceedings of the IEEE Conference on Computer Vision and Pattern Recognition, Boston, MA, USA, 7–12 June 2015; pp. 1–9. [Google Scholar]
- Russakovsky, O.; Deng, J.; Su, H.; Krause, J.; Satheesh, S.; Ma, S.; Huang, Z.; Karpathy, A.; Khosla, A.; Bernstein, M.; et al. ImageNet Large Scale Visual Recognition Challenge. Int. J. Comput. Vis. 2015, 115, 211–252. [Google Scholar] [CrossRef] [Green Version]
- Chung, M.; Bernheim, A.; Mei, X.; Zhang, N.; Huang, M.; Zeng, X.; Cui, J.; Xu, W.; Yang, Y.; Fayad, Z.A.; et al. CT Imaging Features of 2019 Novel Coronavirus (2019-nCoV). Radiology 2020, 295, 202–207. [Google Scholar] [CrossRef] [Green Version]
- Singh, A.; Sengupta, S.; Lakshminarayanan, V. Explainable Deep Learning Models in Medical Image Analysis. J. Imaging 2020, 6, 52. [Google Scholar] [CrossRef]
- Selvaraju, R.R.; Cogswell, M.; Das, A.; Vedantam, R.; Parikh, D.; Batra, D. Grad-CAM: Visual Explanations from Deep Networks via Gradient-Based Localization. Int. J. Comput. Vis. 2020, 128, 336–359. [Google Scholar] [CrossRef] [Green Version]
Figure 1.
Representative images of lung CT segmentation. Rows depict CT slices of patients with COVID pneumonia, no pneumonia, and non-COVID pneumonia, respectively. (A) Original CT slice images; (B) manually segmented CT slice images; (C) AI-based segmentation of CT slice images; (D) merged image of the segmentation mask and original CT slice images.

Figure 2.
CNN block architecture for learning feature maps.

Figure 3.
Illustration of the CNN-biLSTM classifier architecture. End-to-end pipeline for classification where segmented slices are fed to CNN blocks, and then CNN outputs are processed by bidirectional LSTM. Each state output is preserved, and every output is combined prior to dense layers and softmax layer.

Figure 4.
Flowchart diagram for the classification algorithm.

Figure 5.
Visualization of CNN outputs. left: Cropped CT image, right: visualized feature map of CNN output. The right image shows CNN blocks are capable of capturing Ground Glass Opacities in CT images.
Figure 5.
Visualization of CNN outputs. left: Cropped CT image, right: visualized feature map of CNN output. The right image shows CNN blocks are capable of capturing Ground Glass Opacities in CT images.

Figure 6.
Classification performance is represented with (a) Receiver operating characteristics (ROC) curves. (b) Normalized confusion matrix. In the ROC curve, the blue line denotes the macro-average area under the curve (AUC).
Figure 6.
Classification performance is represented with (a) Receiver operating characteristics (ROC) curves. (b) Normalized confusion matrix. In the ROC curve, the blue line denotes the macro-average area under the curve (AUC).


Table 1.
Distribution of CT image dataset in three studied cases.
| Image Dataset | Training | Testing |
|---|---|---|
| COVID-19 pneumonia cases (CP) | 95 | 25 |
| Other pneumonia cases (NCP) | 96 | 33 |
| Healthy cases | 79 | 20 |
Table 2.
Performance metrics (accuracy, specificity, sensitivity, f1-score) for each class of test set.
Table 2.
Performance metrics (accuracy, specificity, sensitivity, f1-score) for each class of test set.
| Accuracy | Specificity | Sensitivity | f1-Score | |
|---|---|---|---|---|
| CP | 0.840 | 0.983 | 0.840 | 0.875 |
| NCP | 0.939 | 0.962 | 0.939 | 0.899 |
| Healthy | 0.900 | 0.889 | 0.900 | 0.923 |
| Average | 0.897 | 0.949 | 0.893 | 0.899 |
Table 3.
Comparison of model architectures used in the related studies and this study.
| Study | Target Specifications | Patient-Level Labeling | Total Number of Images | Segmentation Model | Feature Extraction Model | Sequence Model | Segmentation-Feature Extraction Pretrained |
|---|---|---|---|---|---|---|---|
| Amyar 2020 | CP 1, Healthy, Other | no | 1369 | - | Multi-task U-net | - | N/A-no |
| Li 2020 | CP, NCP 2, Healthy | no | 4352 | U-net | Resnet50 | - | yes-yes |
| Zhang 2020 | yes | 617,775 | Deeplabv3 | 3d Resnet-18 | 3d Resnet-18 | no-no | |
| Wang 2020 | no | 104,009 | - | Conv2d | - | N/A-yes | |
| Hasan 2020 | no | N/A | Image processing | CNN and QDE | LSTM | N/A-no | |
| Lee 2021 | yes | 436,265 | - | Inception 3d | Inception 3d | N/A-yes | |
| This work | yes | 26,935 | U-net | Conv2d | biLSTM | no-no | |
| El-bana 2020 | CP, PV 3, PB 4, Healthy | no | 100 | - | Inception v3 | - | N/A-yes |
1 COVID Pneumonia, 2 Non-COVID Pneumonia, 3 Pneumonia Virus, 4 Pneumonia Bacteria.
Publisher’s Note: MDPI stays neutral with regard to jurisdictional claims in published maps and institutional affiliations. |
© 2021 by the authors. Licensee MDPI, Basel, Switzerland. This article is an open access article distributed under the terms and conditions of the Creative Commons Attribution (CC BY) license (https://creativecommons.org/licenses/by/4.0/).
Share and Cite
MDPI and ACS Style
Kara, M.; Öztürk, Z.; Akpek, S.; Turupcu, A. COVID-19 Diagnosis from Chest CT Scans: A Weakly Supervised CNN-LSTM Approach. AI 2021, 2, 330-341. https://doi.org/10.3390/ai2030020
AMA Style
Kara M, Öztürk Z, Akpek S, Turupcu A. COVID-19 Diagnosis from Chest CT Scans: A Weakly Supervised CNN-LSTM Approach. AI. 2021; 2(3):330-341. https://doi.org/10.3390/ai2030020
Chicago/Turabian StyleKara, Mustafa, Zeynep Öztürk, Sergin Akpek, and Ayşegül Turupcu. 2021. "COVID-19 Diagnosis from Chest CT Scans: A Weakly Supervised CNN-LSTM Approach" AI 2, no. 3: 330-341. https://doi.org/10.3390/ai2030020