
The Impact of COVID-19 on High-Speed Rail and Aviation Operations


City and Regional Planning, The Ohio State University, Columbus, OH 43210, USA
*
Author to whom correspondence should be addressed.
Sustainability 2022, 14(3), 1683; https://doi.org/10.3390/su14031683
Submission received: 9 December 2021
/
Revised: 20 January 2022
/
Accepted: 21 January 2022
/
Published: 1 February 2022
(This article belongs to the Special Issue Evaluating the Socioeconomic Impact of Infrastructure Investment in an Uncertain World)
Abstract
:Intercity transportation systems have experienced severe disruptions since the outbreak of COVID-19. However, it remains unclear how the operations of different systems were affected and whether the pandemic has influenced modal interaction. This paper provides an empirical assessment to address these questions using high-speed rail (HSR) and aviation in China as an example. The impact of COVID-19 on aviation and HSR operations was examined both temporally and spatially using a high-dimensional fixed-effect panel model. Using the big data with daily operational frequency for the period of January–June 2020, the study shows that the lockdown of Wuhan had varying effects on the operations of HSR and aviation. In addition, the correlation of operational services between HSR and aviation was found to vary both spatially and temporally during the pandemic. These research findings provide important implications for improving the adaptability of transportation systems and operational resilience.
1. Introduction
The severe acute respiratory syndrome caused by the coronavirus disease, COVID-19, has created severe socioeconomic consequences since its initial outbreak in Wuhan, China. In order to effectively control the spread of the virus, a series of epidemic prevention measures, such as travel bans and restrictions, social distancing, and centralized quarantine, were adopted by Chinese authorities [1,2,3]. In particular, a strict lockdown was implemented in the city of Wuhan on 23 January, which was shortly followed by strict travel restrictions in other Chinese cities in order to curb the spread of the virus. As a result, intercity transportation services, such as high-speed rail (HSR) and aviation, were severely affected. For instance, the total railway passenger transport volume has decreased by 39.8%, while the passenger transport turnover has reduced by 45.5% since the outbreak of COVID-19 when comparing the performance in 2020 and 2019. Similarly, the total aviation passenger volume and passenger turnover have decreased by 36.7% and 46.1%, respectively [4]. The travel restrictions substantially reduced service frequency and the number of stops, and the economic losses as a result of the disruptions were also far-reaching [5,6]. For example, compared with 2019, hotel room occupancy rates dropped by 89% due to the reduction of intercity passenger flow in China since the outbreak [7]. The direct revenue loss of the aviation sector in China was over CNY 74 billion (around USD 10.6 billion) during the first six months of 2020 [8].
The relationship between HSR and civil aviation has been extensively studied [9,10,11,12,13,14,15]. For example, HSR has an advantage over aviation in short-haul travel [11]. Modal substitution as an essential resilience strategy could make transportation more adaptive during disruptive events, such as terrorist attacks [10]. In addition, some studies have examined complementary or alternative relationships of HSR and aviation during extreme weather [12,15]. Furthermore, effective transportation planning can be helpful for sustainable supply chain performance [16]. Although some previous studies have attempted to examine the role of transportation in the face of infectious disease outbreaks from the demand-side of the system [17,18,19,20,21,22], few studies have examined the relationship between the operations of transportation modes, such as HSR and aviation, due to the disruption of an infectious disease from the supply-side perspective, with consideration of variations of service frequency. There is still a lack of understanding as to what extent the operations of different transportation modes are influenced by infectious disease outbreaks and how their competitive relationship may change before, during, and after a pandemic. Additionally, there is a lack of understanding of how to consider the interaction between different modes of transportation from the perspective of urban resilience broadly within a system, and how to establish a foundation for communication about policy-making between independent aviation and HSR sectors in China, in order to mitigate the damage caused by the COVID-19 pandemic to the transportation sector and achieve a more sustainable system.
To fill these gaps, this study evaluates the impact of COVID-19 on the schedule and frequency changes of HSR and domestic aviation services, using the Chinese systems as an example. Compared with previous research, our assessment has the following research highlights.
Firstly, this study provides a comprehensive and in-depth understanding of the impact of COVID-19 on the operations of HSR and aviation from the supply-side perspective. We include assessments at both the national and regional level, which help to understand the varying degrees of impact of the pandemic across the country due to different regional characteristics.
Secondly, our assessment was conducted based on detailed transportation performance big data, which reflects detailed daily variations in service scheduling. In addition, the assessment was conducted using the high-dimensional panel fixed-effect model, which controls for multiple time-invariant, individual-specific heterogeneities. Hence, the research findings are expected to be robust and reliable, as compared to previous similar studies.
Thirdly, the empirical evidence revealed in this research provides important implications for transportation operational agencies to enhance transportation resilience against future outbreaks. Additionally, the understanding of the relationship between HSR and aviation serving the same transportation corridors can help facilitate the future planning and development of intercity passenger transportation systems, in order to improve system flexibility in the face of extreme events.
The rest of this paper is organized as follows. Section 2 reviews other related literature, with a focus on relevant empirical research that assesses the interactions between HSR and aviation systems. Section 3 introduces data and methods, Section 4 presents and discusses the empirical results, Section 5 summarizes the findings and provides the conclusion, and finally, Section 6 indicates the limitations and future research.
2. Materials and Methods
The COVID-19 pandemic has presented unprecedented challenges to the global transportation system. Both aviation [23] and rail transportation systems [24] have suffered severely due to significant reductions in traffic since the outbreak. In the case of China, with strong and continuous support from the central government, it developed a national HSR system with more than 38,000 km by the end of 2020. The development of HSR has substantially improved the intercity travel experience on account of the improved onboard amenity and travel time savings; the system has been extensively utilized since its operation [12,25]. For instance, HSR now serves more than 60% of all rail passengers in China [26]. HSR greatly helps shorten intercity space and time [27], and the introduction of HSR reduced air travel by more than 50% [28]. Similarly, the introduction of HSR led to a decrease in conventional trains of more than 10% within 1000 km [29]. Compared to HSR, the intercity coach has a lower market share when the distance is greater than 200 km [30].
Based on these findings, some studies have examined the impact of COVID-19 on transportation system [17,18,31,32,33,34,35]. For instance, in the urban areas of Colombia, national policies and local decisions introduced due to COVID-19, such as social distancing, quarantine, and isolation, reduced the demand for cross-city motorized travel in terms of air, freight, and urban transportation [32]. The impact of COVID-19 on the global aviation industry was analyzed using airport and flight data and the results showed that China’s aviation system recovered faster than other countries [34]. The impact of COVID-19 on the volume of dry goods in food retail logistics primarily depended on the intensity quantified by the total number of new infections per day in Germany [35]. There is a strong linear correlation between COVID-19 cases in China and domestic air traffic [17,18]. In the northern Spanish city of Santander, public transport trips, on average, decreased by more than 90% in the first 16 days of the quarantine started on 15 March 2020 [31].
Extensive studies have attempted to evaluate the modal relationship between the HSR and aviation [9,10,11,12,15,22,36,37,38]. For instance, under normal circumstances, a substitutional relationship might exist between HSR and aviation as the rapid development of HSR recently in China [38]. As a result, the demand increase in one mode is likely to lead to the demand decrease of the alternative mode. However, if the two modes are complementary, cooperation may exist. In other words, the increase of one mode may not be necessarily associated with the decrease of the other mode, but instead, the demand of the other mode also experiences an increase [39].
Previous studies have also used the elasticity/cross elasticity to quantitatively examine the relationship between HSR and aviation [38,40,41,42,43,44,45]. For instance, through examining time elasticity and price elasticity, the level of the competition of HSR in air transportation is very low in the Madrid–Zaragoza corridor [42]. Some research analyzed the cross elasticity of demand and studied the impact of changes in HSR fares, train operating frequency, and access time on aviation demand, indicating that only 14% of passengers prefer to travel by air after the opening of the Gyeongbu line of the Korea Train Express (KTX) in 2004 [43]. The elasticity of market share was used to measure the competitive relationship between the HSR and the aviation in the London–Paris passenger market [40]. The estimated elasticity of changes in demand and supply was adopted through factors such as flight frequency and seat capacity to measure the level of competition between HSR and aviation for several city pairs in China [36].
It should be noted that air travel is the main focus of these studies; little attention has been paid to the impact of COVID-19 on HSR. While they do indicate that COVID-19 has had a significant negative impact on the transportation system overall, there are few studies that compare the varying impact of COVID-19 on different modes of transportation. The relevant studies, as summarized in Table 1, show that market interactions between HSR and aviation have been extensively studied. Most studies examined these interactions under normal circumstances, whereas a relatively small number of studies also examined them during unexpected events, such as weather emergencies and infectious disease outbreaks.
Aviation traffic is reduced due to direct competition from HSR, especially for short- and medium-distance routes (less than 800–1000 km) [36]. The development of HSR has had a substantial negative impact on China’s aviation transportation demand [38]. After the introduction of HSR, medium- and long-distance passengers had more choices, and the demand for air travel became more elastic. The introduction of HSR allows aviation to reduce the number of seats provided while reducing frequency as little as possible in order to compete with HSR [9]. The greater the connectivity and accessibility of HSR, the more serious its negative effect on aviation [37]. They also found that in addition to the competitive relationship, there is a complementary relationship between HSR and aviation transportation.
Although these studies have confirmed that there is a strong modal substitution between HSR and aviation transport, few people have paid attention to modal substitution analysis under destructive conditions (such as pandemics and extreme weather events). The airport tends to be much resilient to severe weather events if the city has an HSR service, which suggests that the introduction of HSR may improve the performance of aviation during extreme weather due to modal substitution [15]. In the four months after terrorist attacks in London, most of the decrease in passenger transportation (car, motorcycle, bicycle, and walking) is offset by the increase in alternative modes of transportation [10]. In other words, the modal substitution presents a strong resilience to help the systems maintain their functions when shocked. However, these unexpected events, in addition to creating “travel fear” [22], can also physically damage transportation systems.
Nevertheless, for infectious diseases such as COVID-19, the situation is somewhat different. COVID-19 has a high risk of spreading among public transportation passengers in confined spaces, such as train cabins [26]. Crowded public transportation might correlate with the occurrence of infectious diseases [20]. The risk of transmission increases with the length of travel time and proximity to the location of a healthcare clinic [47]. In China, compared with aviation services, HSR is concentrated on short-distance travel [36]. Because of these differences between aviation and rail, we believe that COVID-19 has impacted HSR and air travel differently. For instance, flight frequency is positively correlated with the number of confirmed cases at a 1% significance level, while an increase in HSR frequency by one unit causes a much smaller increase in cases [22].
3. Research Gaps
Although several studies have examined the relationship between HSR and aviation, little work has investigated the impact of COVID-19 on the operation of HSR and aviation and to what extent it has affected their competitive relationship. In addition, few previous studies have considered their research in a disaster planning context. Using the detailed big data reflecting transportation operation, our study intends to improve our understandings of the extent to which the operational performance of transportation services may vary under the pandemic, from the supply-side perspective. Such an understanding will provide new insights for future risk control and disaster planning of the transportation systems, particularly in terms of enhancing transportation resilience through a modal substitution.
4. Data and Methods
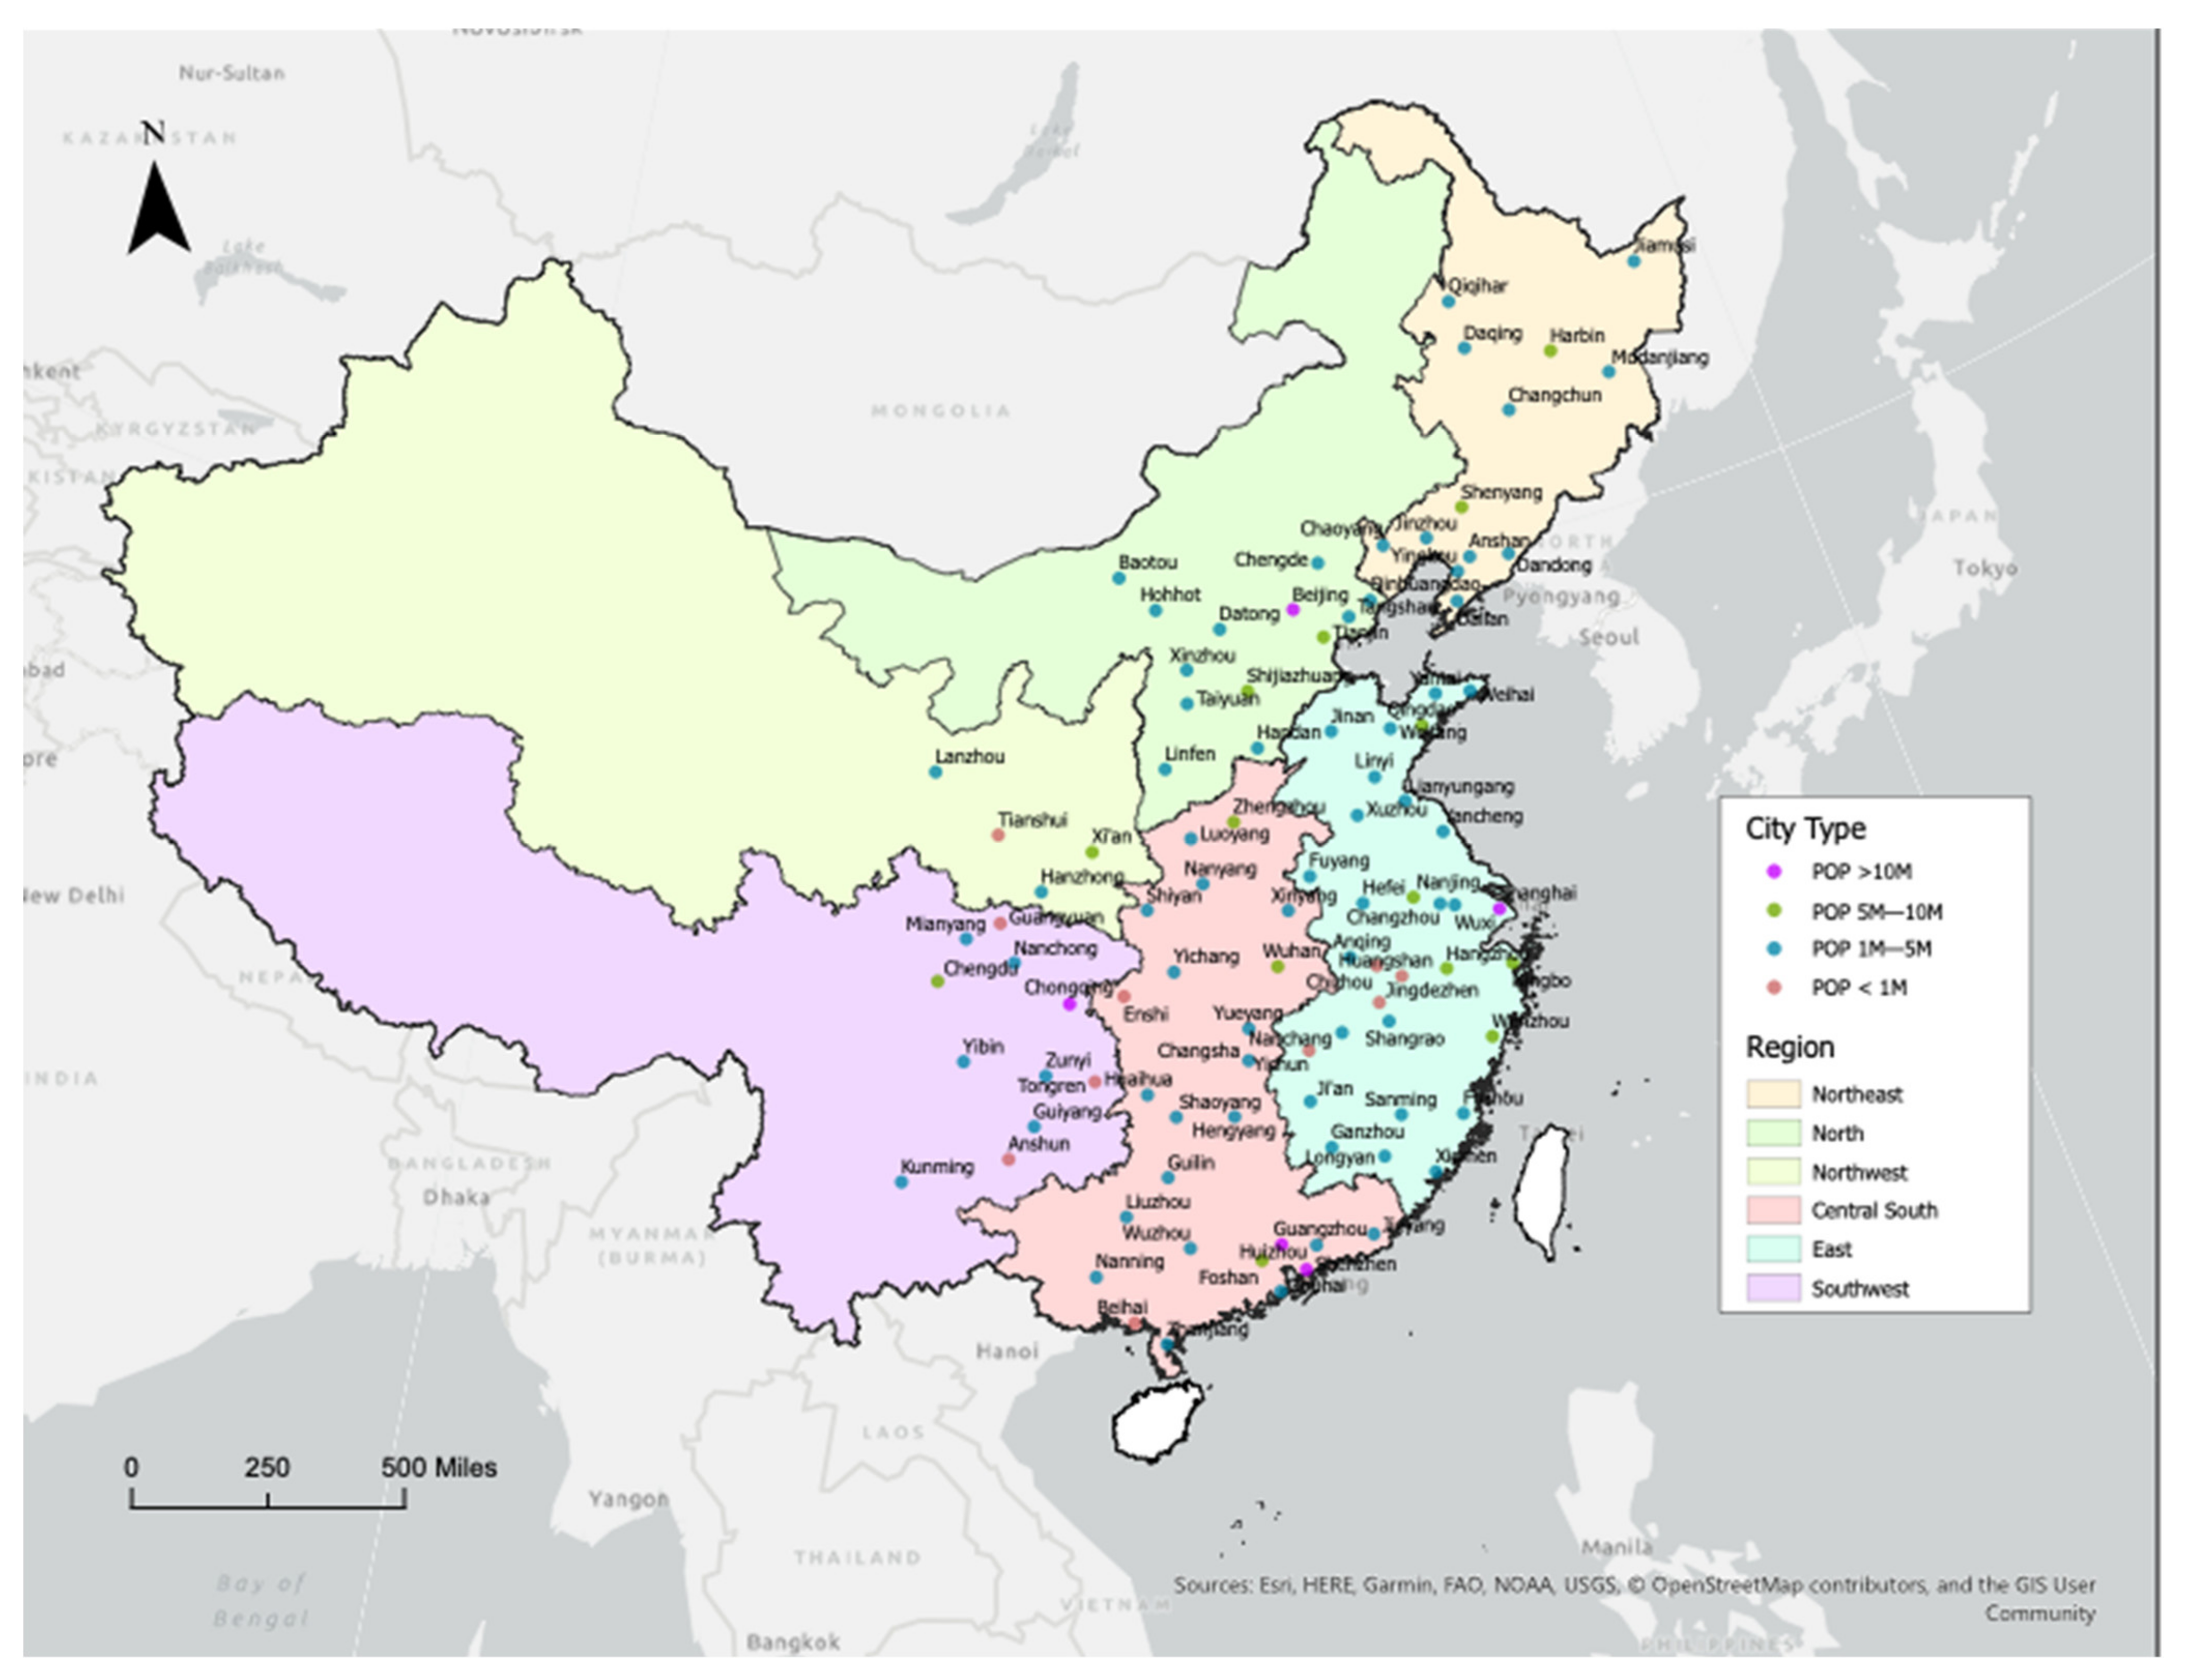
To fill these research gaps, an empirical assessment of the impact of COVID-19 on the operation of HSR and aviation in China was conducted. Our assessment consists of the following types of data: daily HSR frequency (measured in the number of trainsets), daily domestic flight service data, the period information of the Wuhan lockdown, information of travel restrictions, the daily number of confirmed COVID-19 cases, weather information, population, distance associated with each origin–destination city pairs, and the information of major holidays (Spring Festival, Tomb Sweeping Festival and International Worker’s Day). Specifically, daily HSR data was collected from the official website (www.12306.cn, accessed on 8 December 2021) of the China Railway Corporation. The available data contains the detailed HSR schedules in every city for the period of 15 January–30 June 2020. The daily flight service data was obtained from Flightradar24.com, which is a global flight tracking service. The flight data were collected from the largest ADS-B network in the world, with over 20,000 connected receivers. For our assessment, we only obtained the daily commercial aviation records serving the domestic air market in China. In addition, it should be noted that our assessment only focuses on passenger transportation, while freight transportation was not considered due to the data limitation. The data on the lockdown in Wuhan is based on a report from the Wuhan Municipal Health Commission. The information was used to develop a key dummy variable that measures the duration of the Wuhan lockdown, from 23 January to 9 April 2020. Our analysis also controls the variations that might be caused by the implementations of various local restriction policies that aim to curb the spread of the virus. Specifically, the data of the travel restrictions were collected from multiple sources of news from the government and public health agencies. In addition, we also collected data of the daily confirmed cases of COVID-19 from the China Data Lab. This dataset contains the number of new cases each day for every city in China. The daily weather information was collected from Tianqihoubao.com, a website that provides historical weather information for all the Chinese cities. The data of population was obtained from the China National Bureau of Statistics. The specific data selection and analysis were conducted in the following steps. Firstly, cities with both HSR stations and airports were selected to build the city pair for the assessment. As illustrated in Figure 1, we identified 97 cities that met such a criterion. Secondly, frequency data for both HSR and aviation serving the same city pairs were merged and reformatted into a panel data structure. In the end, there were 71,323 total valid records. Thirdly, specific daily weather data such as the highest and the lowest temperature, rainfall, and snowfall were merged with the service performance data. We also created variables that represent the average temperature and whether there was rain or snowfall on a certain day in order to control for the impact of weather conditions on the performance of the systems. Fourthly, ArcGIS Pro was utilized to calculate the shortest distance between city pairs in order to control for the effect of intercity trip distance. Finally, all the data were integrated into the aforementioned panel dataset.
One key task of comparing the service frequency of HSR and aviation was to appropriately select both HSR and aviation that served the exact same city pairs. However, the city pairs served by HSR may not be exactly the same as that of flight city pairs, given that aviation only provides direct service between two cities while HSR may serve numerous intermediate cities. To address this issue, we assume the origin–destination (OD) data of HSR services can be separated based on the city being served. For example, if a high-speed train travels between city A and C via intermediate city B, the city pairs that we considered include A–B, B–C, and A–C, as long as each city was also served by aviation.
Given that the impact of COVID-19 on HSR and aviation systems is likely to vary in regions and cities with different population sizes, our assessment was also conducted in sub-groups by region and population size. Specifically, in addition to the national level analysis, we also conducted an assessment with a focus on the following six regions: the northeast, North, Central and South China, east, northwest, and southwest. In terms of population size, the cities were classified into three groups, including major metropolitan cities with more than 10 million, provincial capitals and other major cities with a population ranging from 5 to 10 million, and medium and small cities with a population range between 1 and 5 million. Such a classification enables us to capture the heterogeneity of various regions and cities with different population sizes. In any given sub-group, each sample represents a city pair of which both the origin and destination cities are from this sub-group.
The evaluation consists of descriptive analysis and statistical regression analysis. The descriptive analysis helps us understand the variations in service frequencies of HSR and domestic aviation services among different regions and types of cities. We focus on the percentage changes of shares between HSR and aviation during the COVID-19 pandemic for the comparison instead of relying on the absolute number of passengers carried by the two transport modes, as it helps offset the unequal capacities between the two modes. The regression analysis examines the statistical association between HSR and aviation service frequency and environmental variables, such as the pandemic and various weather conditions. Specifically, the empirical model is illustrated as follows:
where the dependent variable Y refers to the share of the number of daily HSR trips to the sum of the number of rail trips and flights, or the proportion of daily HSR capacity to the total capacity of HSR and aviation. Among the independent variables, O and D represent the departure city and arrival city, respectively. is a dummy variable, which represents Wuhan and the corresponding time period when it experienced a lockdown. Due to the corresponding lockdown of all intercity passenger transport in Wuhan during the pandemic, all HSR and domestic aviation services that connected to Wuhan were canceled. indicates the daily number of newly diagnosed COVID-19 cases in a given city. is a dummy variable, which is introduced to control for the travel restrictions implemented in certain cities during the study period. The specific information of cities with a travel restriction is summarized in Appendix A Table A1. represents the Euclidian distance between a city pair, and represents weather-related and temporal event (e.g., holidays)-related control variables. To control the inherent differences between cities, we introduced the fixed effect to eliminate the differences caused by time-invariant characteristics in the regression model. In addition, the fixed effect was modeled in the form of the high-dimensional fixed effects (HDFE) regression model, which is expected to provide a much more robust estimate than the conventional panel regression model given that the unmeasured heterogeneity among more than each city is controlled. The conventional panel regression model is valid only when the variables reflect the characteristics of a single unit (which, in this case, the city), as the fixed effect can be eliminated. In this study, given that the fixed effects are likely to exist in both cities of an OD pair and the regional characteristics of any given two cities are likely to be relatively independent, the HDFE model is able to eliminate the fixed effects in two dimensions (in our case, the two cities in an OD pair), which thus may provide more reliable estimated outcomes than the conventional panel analysis.
In addition to Equation (1), to further examine the relationship between HSR and aviation, the second empirical model is illustrated as follows:
where the dependent variable Y represents the number of daily flights in city pairs. Using this model, we can investigate the substitution between HSR and aviation. Specifically, the period was divided in terms of the lockdown in Wuhan in order to examine the different impacts of COVID-19 on HSR and aviation.
The regression analysis was conducted using the share of HSR frequency and the actual daily frequency of HSR and aviation services as the dependent variables, respectively. The impacts of COVID-19 on the performance of HSR and aviation in different regions and cities were examined separately. The analyses of each group include nine models, which measure the outcomes based on a different subset of the sample. The descriptive statistics of each variable used in the models are summarized in Table 2.
5. Empirical Results
5.1. Descriptive Analysis
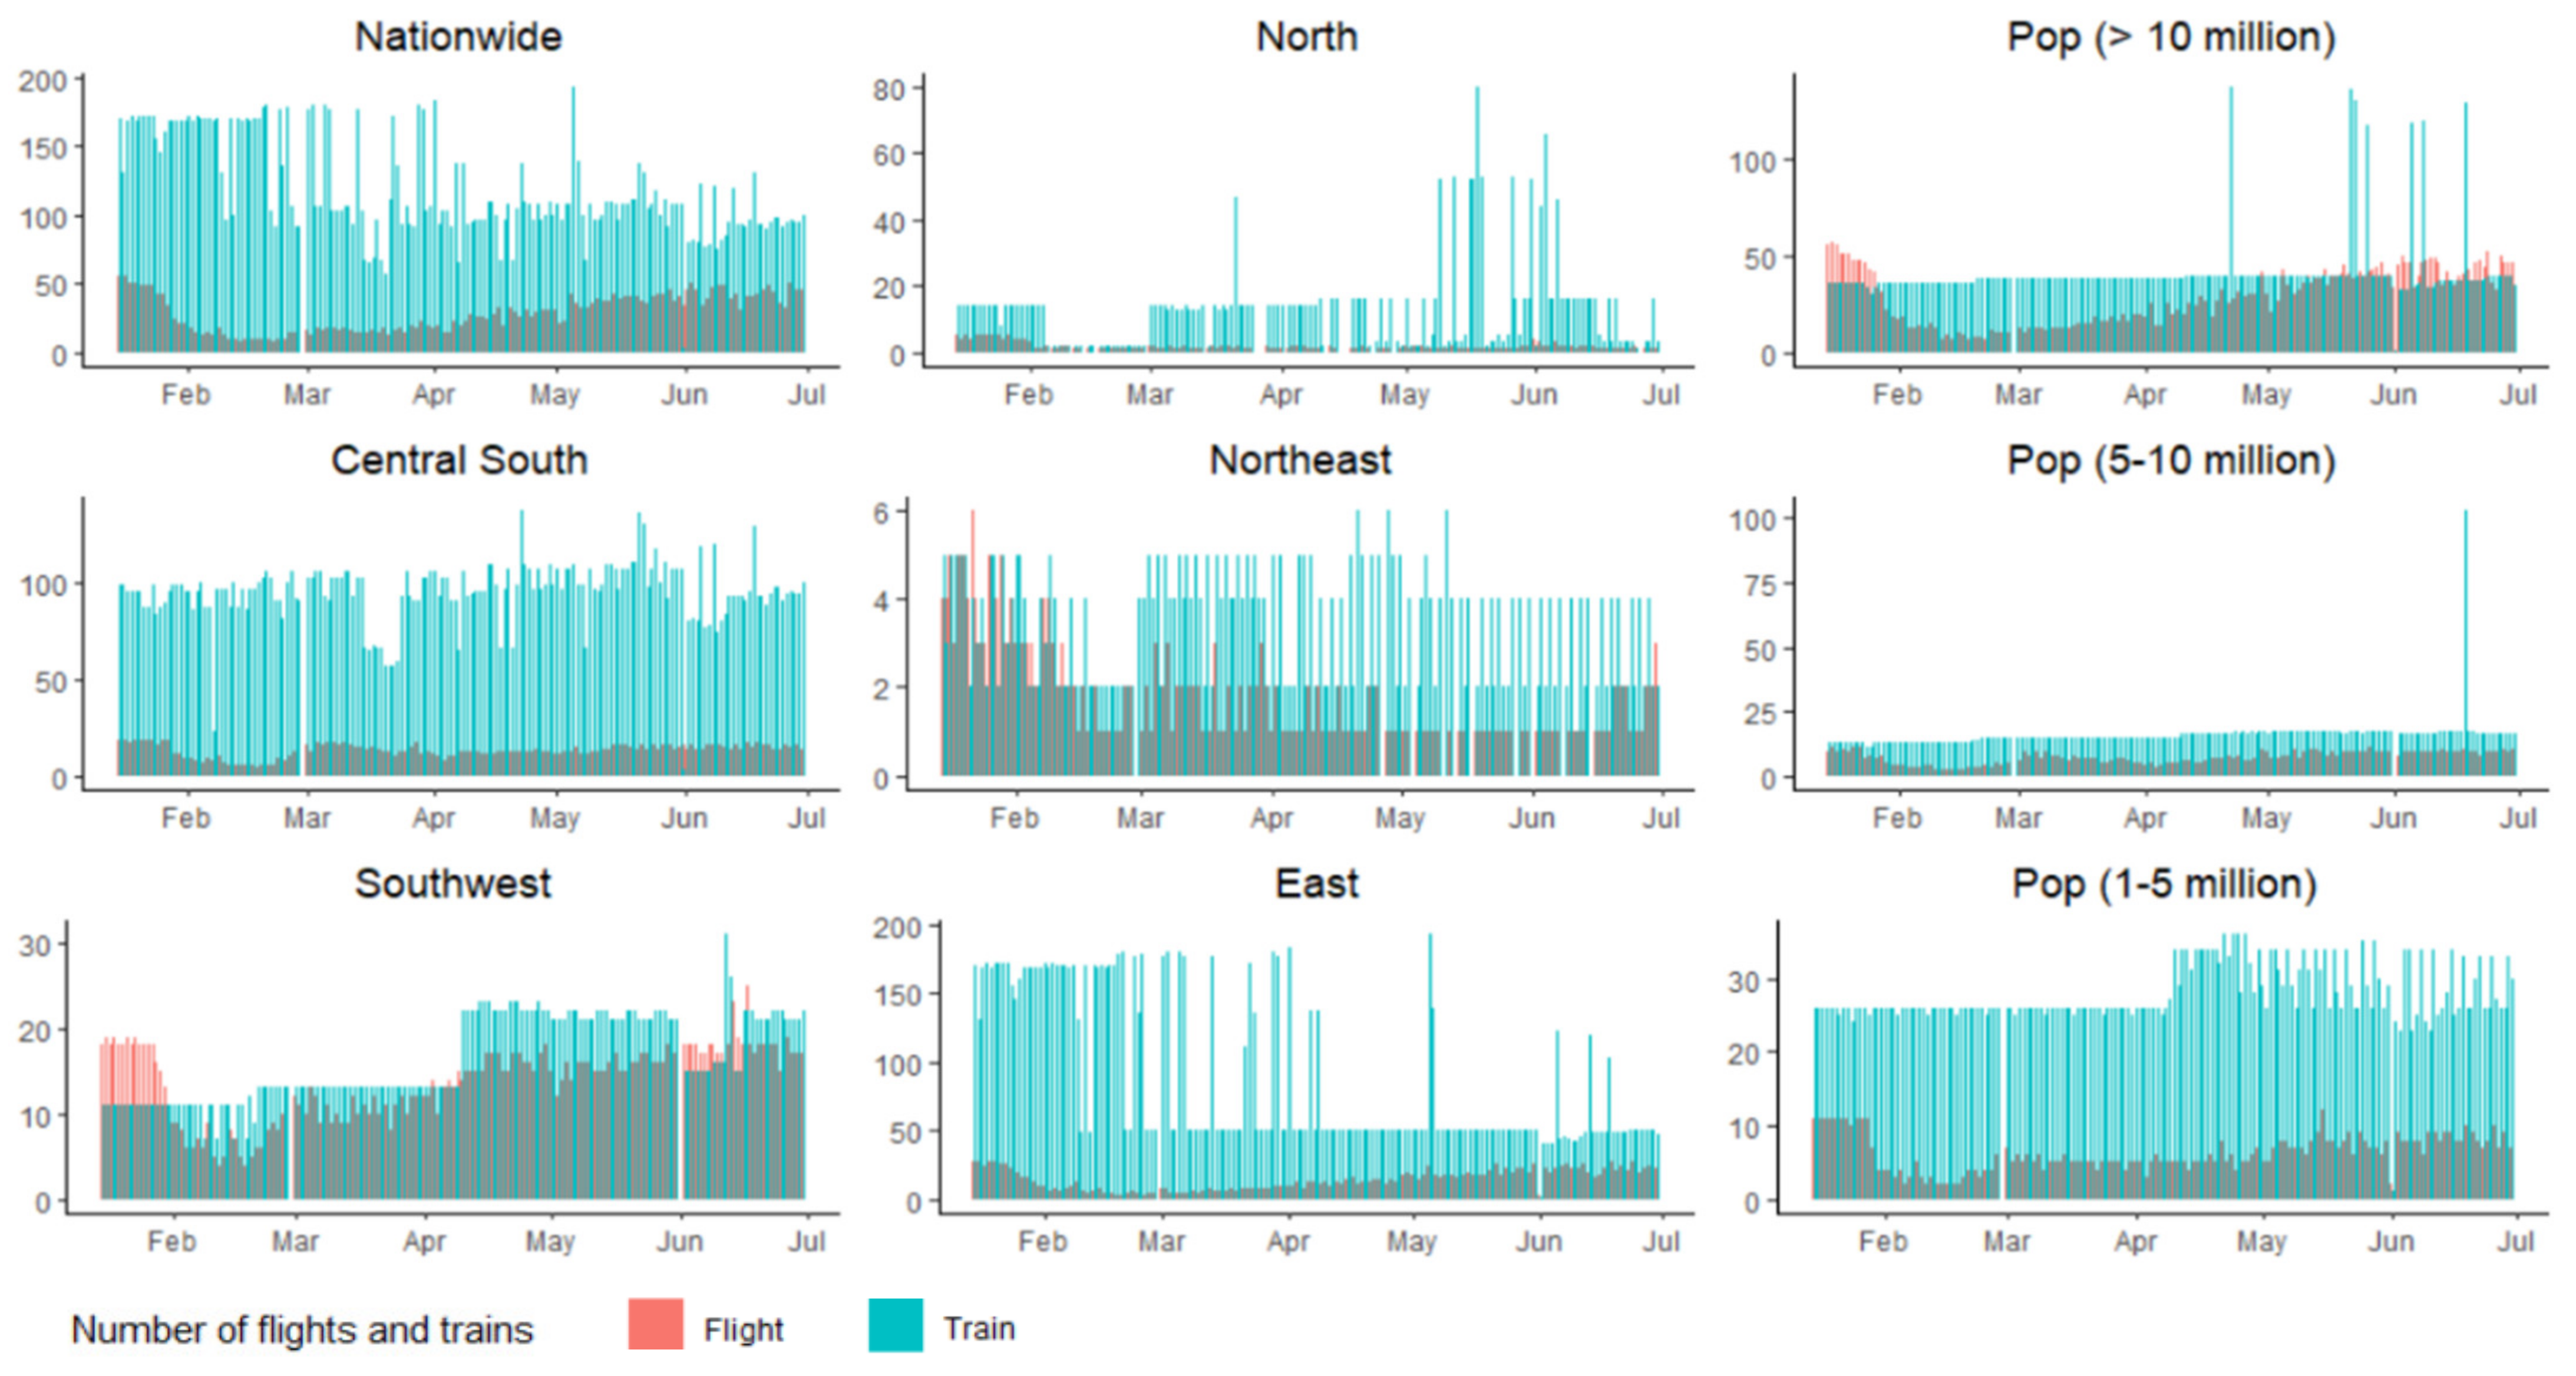
All data analysis was based on the panel data of 97 cities covering 15 January–30 June 2020. Figure 2 illustrates the total daily HSR trips and the number of flights in each region and among different cities. It is visible that the number of both HSR trips and flights began to reduce significantly at the end of January 2020. Specifically, as the total number of new daily COVID-19 cases surged in Wuhan and other cities, the service frequency of aviation, in particular, experienced a substantial decline.
Conversely, Figure 2 also reveals that the number of HSR trips is generally much higher than the number of flights serving the same OD pairs. In addition, service frequency varies significantly between regions. For instance, HSR service frequency is very high in the central–south and east regions of China, whereas it is relatively more minor than aviation in others (especially when comparing the performance before the outbreak of COVID-19). In general, the patterns show that the service frequency of HSR and aviation vary substantially between regions, which reflects the uneven demand for intercity transportation services. In addition, Figure 3 shows that the daily frequency of HSR and aviation varies by population size. For instance, the daily number of HSR trips was found to be much lower than flights among major metropolitan cities with a population of more than 10 million; on the contrary, HSR frequency was much higher than that of aviation in cities with relatively smaller population sizes (e.g., 1–5 million). In addition, the frequencies of HSR did not decrease substantially at the beginning of the pandemic, while the number of flights has decreased notably among different types of cities. Such a result suggests that the outbreak appears to have a much stronger dampening effect on the aviation system than HSR.
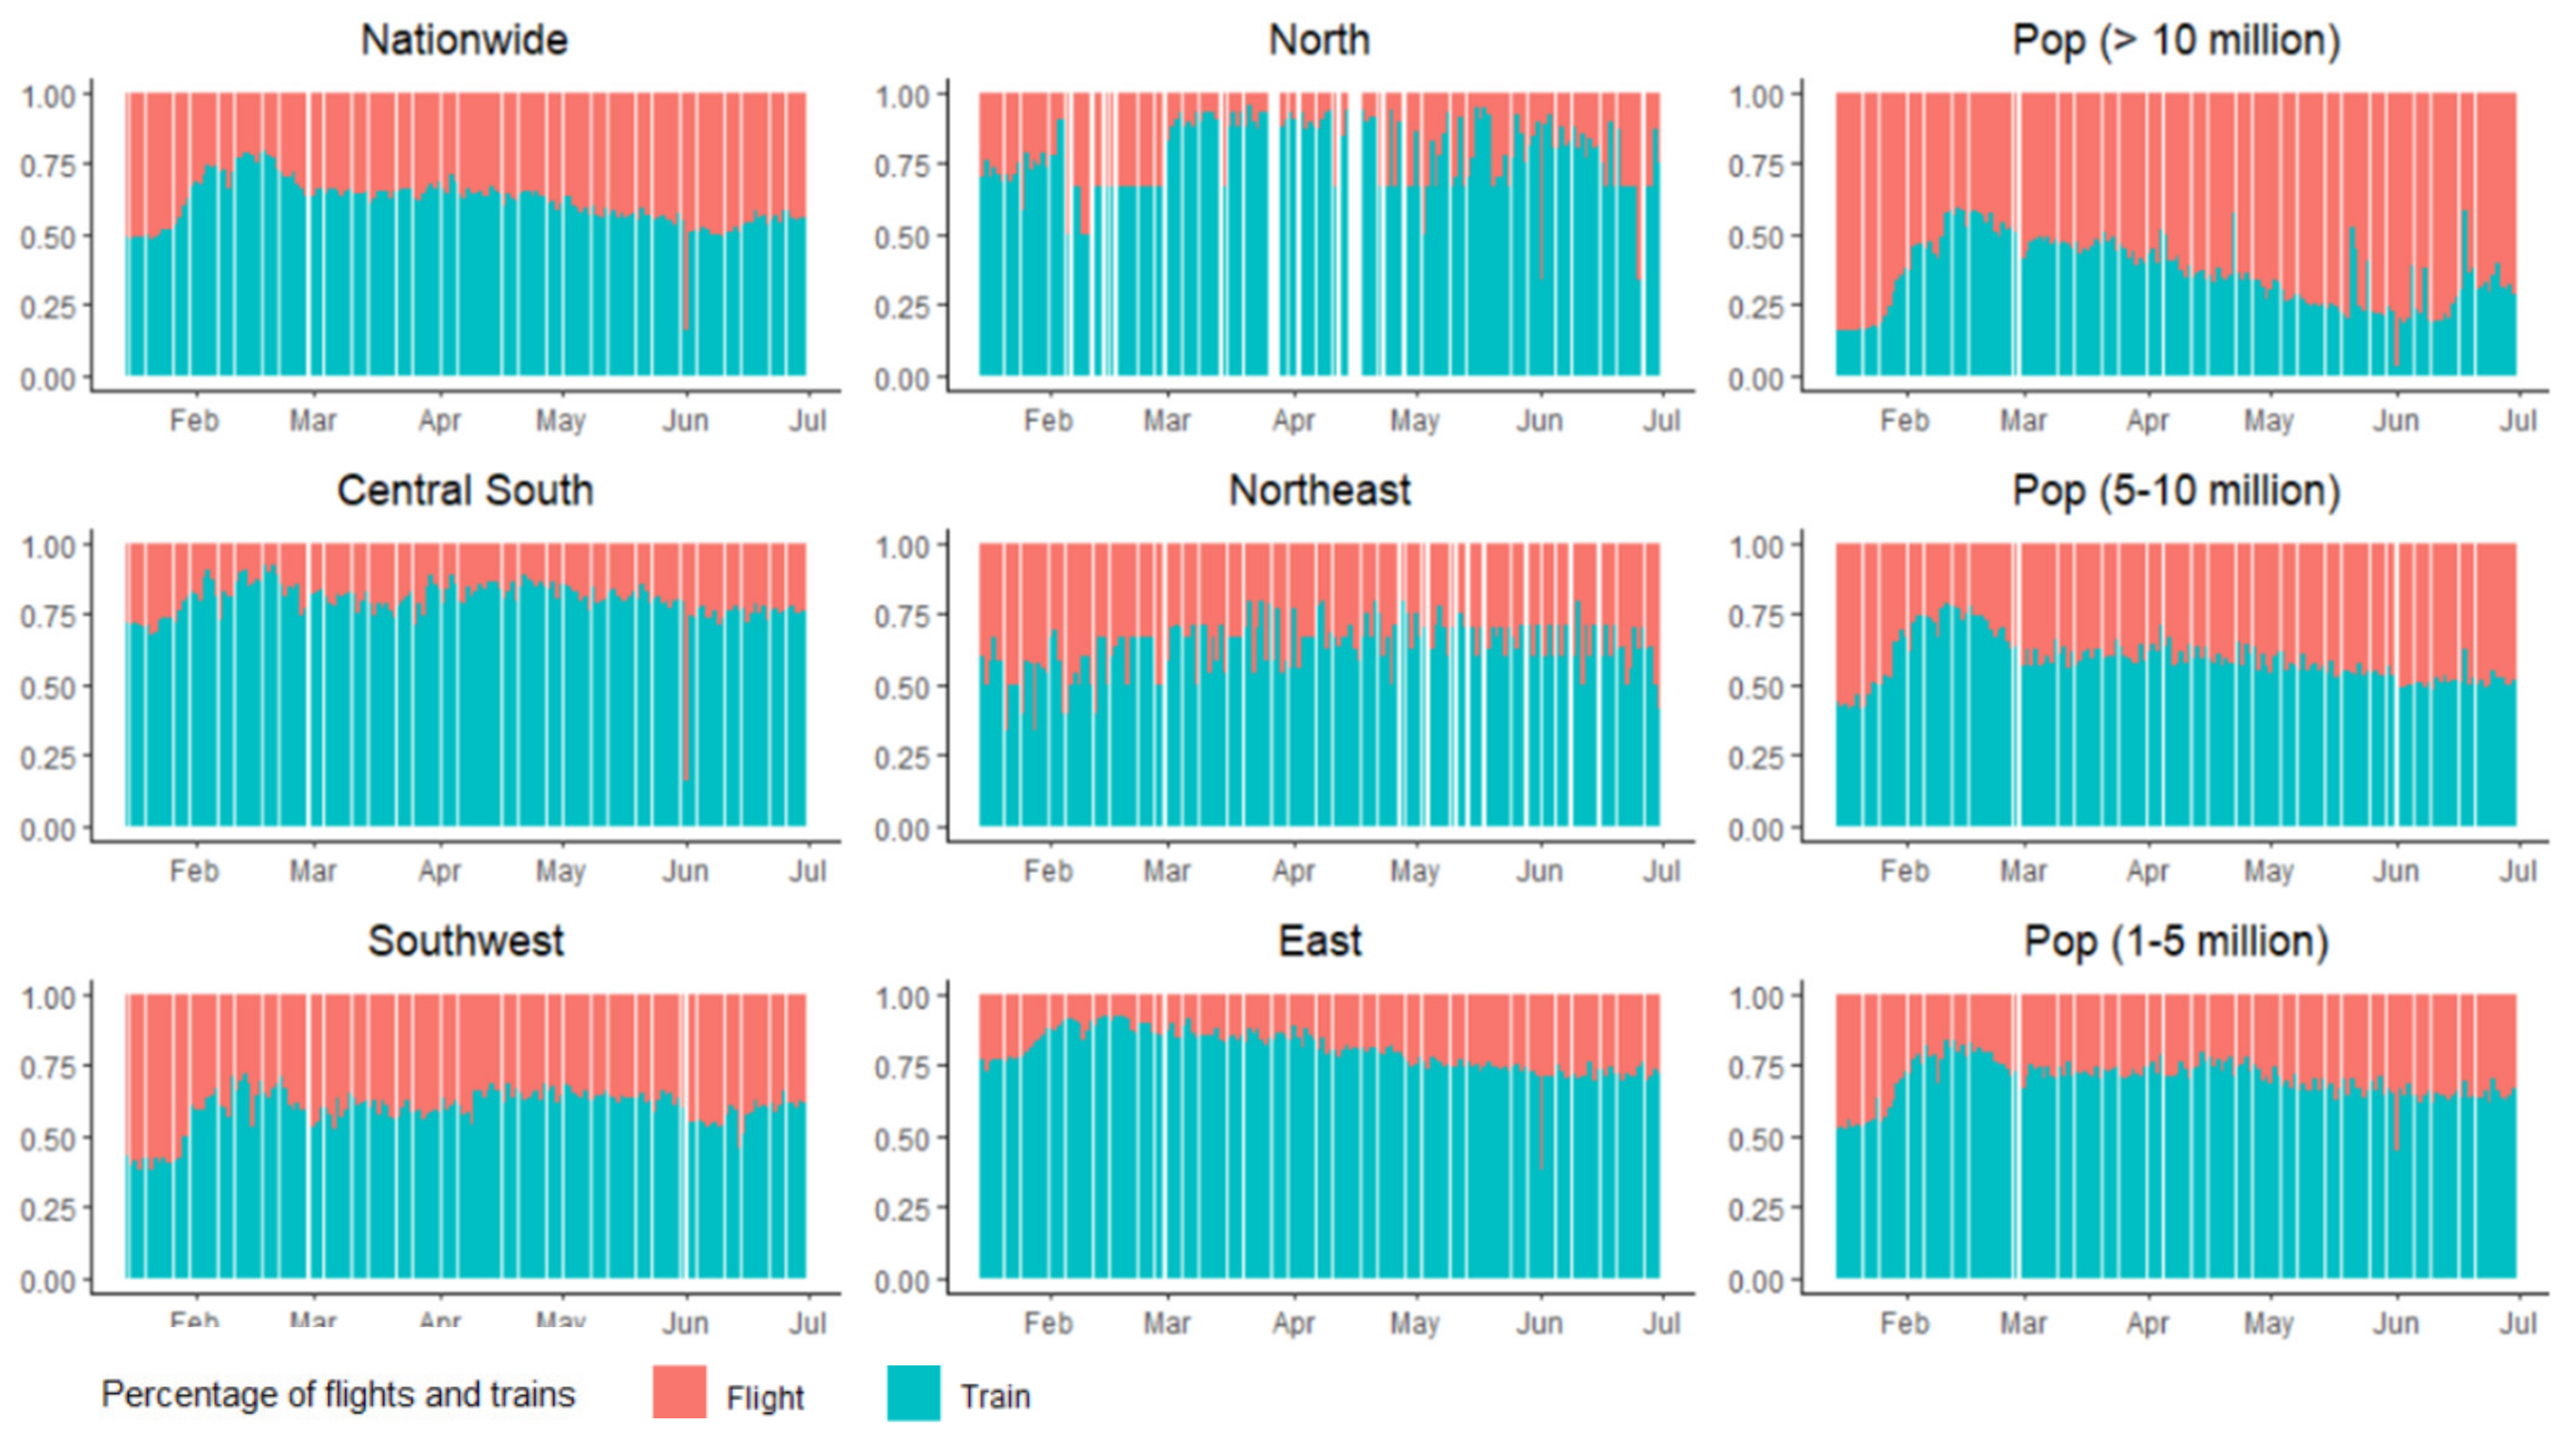
Figure 3 illustrates the shares of service frequency for HSR and aviation based on calculating the corresponding daily volume in each corridor. In general, the percentage of HSR service increased by approximately 25% during the outbreak of COVID-19, which can be attributed to the sharp decline in aviation service. In terms of regional comparisons, the results show that the share of HSR service is relatively higher in every region except for the southwest, where the share is relatively lower. Again, such patterns reveal the uneven spatial distribution of HSR services.
5.2. Regression Analysis
The regression results of the impact of COVID-19 on the share of HSR service, based on the frequency volume in each OD pair, are summarized in Table 3. The dependent variable measures the relative change in the daily service frequency of both transportation modes. The variable lock_d was adopted to measure whether the lockdown of Wuhan had a significant impact on the share of HSR service volume in different regions and types of cities. We only included the variable that represents Wuhan as the arriving city because, during the pandemic, the departing services such as air and rail were all suspended to curtail the spread of the virus, according to the requirement of the Wuhan Municipal Health Commission. Specifically, Model 1 was analyzed based on the entire sample, which shows, on average, that the lockdown had a statistically significant impact on the variation in the service share of HSR among the 97 OD pairs. The estimated coefficient −0.075 indicates that the mean share of HSR service frequency on average has dropped by 7.5% because of the lockdown in Wuhan. In addition, the estimates of the lockdown variable are found to be statistically significant in Models 3 and 5, which represent the subsamples of cities with a population between 5 and 10 million and those located in Central and South China. The estimated coefficients are −0.196 and −0.117, respectively, which can be interpreted as the share of HSR service frequency being associated with 19.6% and 11.7% decline among the OD city pairs during the Wuhan lockdown period, on average, ceteris paribus.
In contrast, travel restriction policies were found to have a positive association with the variation of the service share of HSR in different regions and types of cities. For instance, Model 1 shows, on average, that the travel restrictions across the nation had a statistically significant impact on the variation in the service share of HSR among the 97 OD city pairs with an estimated coefficient of 0.05. The result suggests that the implementations of the travel restrictions among the Chinese cities present a relatively higher dampening effect on aviation than that on HSR. As a result, the average daily share of HSR service is found to be associated 5% higher than that of aviation, ceteris paribus. In addition, the variable of travel restriction is found consistently positive and significant in three types of cities (shown in Model 2, 3, and 4) and in the central south and north of China (Model 5 and 7). In sum, the results suggest that the lockdown in Wuhan had a relatively stronger dampening effect on HSR service frequency than that on aviation during the pandemic, whereas the travel restriction policies implemented in other cities present a relatively stronger dampening effect on the frequency of aviation service.
In addition, the impact of daily confirmed cases of COVID-19 on the share of HSR service in the corresponding cities was also examined. The results reveal that the number of daily confirmed cases had a significant impact on cities that have a population of more than 10 million or are located in the southwest and eastern regions. For example, each additional ten daily confirmed cases increase in the OD cities with more than 10 million people was found to be associated with a 0.759% and 0.993% increase in the share of HSR service, respectively, suggesting that a more severe COVID-19 outbreak in large cities is likely to lead to a more substantial negative impact on aviation service than HSR. Similarly, each ten additional daily confirmed case increase in the OD cities in the southwest region was found to be associated with increases in the shares of HSR service of 4.73% and 1.94%, respectively. Again, such a pattern suggests that the outbreak had a relatively larger negative influence on the frequency cut of aviation services than that of the HSR system in the southwest. Conversely, the estimated coefficient of the OD cities located in the eastern region was found to be negative and statistically significant, which suggests that the frequency share cut of HSR services is more dramatic than that of the aviation system, ceteris paribus. This pattern makes sense given that most intercity travel demand in East China is heavily served by HSR, as the network is substantially developed and well-connected in that region. Hence, the negative impact of COVID-19 on service operations was found much stronger on HSR than on the aviation system.
One should note that the results regarding the relationship between the frequencies of intercity traffic and daily confirmed cases of COVID-19 are interpreted as statistical association instead of causation. For instance, the frequencies of intercity transportation services (e.g., HSR, aviation and coach services) are significantly associated with the number of confirmed cases [22]. Therefore, one should note that our estimates might be biased in favor of the conclusion the previous studies have.
Our assessment also confirmed that weather characteristics and the distance between OD pairs have statistically significant influences on the variations in service frequency changes of both aviation and HSR. In particular, the impact of the average temperature of cities in different regions varies greatly, and the negative impact of snow in the central and south regions was found to be much greater on aviation than HSR. Such a finding is consistent with earlier studies that evaluated similar issues using different data and modeling frameworks, such as [12,15].
Given that high-speed trains and aircrafts have different capacities, in order to examine the robustness of the results, the assessment was also conducted using the different share of HSR and air capacity as the dependent variables. Specifically, we assume that the maximum seat capacity of a high-speed train from a certain city to any other destination city is 500, with an average passenger capacity of 53 (The 500-seat capacity was based on the eight-carriage specification of a high-speed trainset. The average passenger capacity was calculated using the estimated seat capacity of the entire high-speed rail services divided by the total number of HSR stations). The seating capacity of the corresponding air service was calculated based on information such as aircraft type and seat capacity. In addition, the calculation also includes a ratio of 0.75, given that the social distancing requirements implemented by The Civil Aviation Administration of China state that the maximum capacity of all flights cannot exceed 75% of the original capacity. Appendix A Table A2 and Table A3 summarize the regression results based on the average capacity and maximum capacity of the share of HSR and air service, respectively. The results were found to be generally consistent with previous results.
To examine whether the outbreak of COVID-19 has influenced the modal relationship between HSR and aviation, the assessment was also conducted using the daily volume of HSR and aviation as dependent variables, respectively. Specifically, the analyses were again conducted for the nine sample cases. We use the lockdown to divide the period so that each case consists of three sub-sample groups representing the periods before (Phase 1), during (Phase 2), and after (Phase 3) the lockdown in Wuhan. In total, the assessments consist of 36 regression models.
We define that air and HSR present a substitutional relationship when the statistical association of the frequency change between two modes is negative. In other words, given the control of various external factors affecting the frequency adjustment, the change service frequency of one mode is negatively associated with that of the other mode. Likewise, we consider air and HSR to present a complementary relationship if the statistical association of the frequency change between two modes is positive. In other words, the frequency adjustments of both modes are in the same direction. Our analysis does not capture the minor substitutional relationship that may present as the different levels of changes even the adjustments occur in the same direction. In addition, given that the examination covers a relatively short time period and the fare of HSR is primarily determined by China Railway Corporation instead of the market, our analysis does not consider the influences of fare on the relationship between the two modes. One should note that the way that we examine the modal relationship is different from the classical economic approach, which tends to focus on identifying the change of demand as a response to price, subject to a fixed level of utility. Instead, we intend to understand the modal relationship from the perspective of supply through the examination of the statistical association between the frequency changes of different modes. The objective is to investigate to what extent the relative adjustments of service frequency of HSR and aviation vary under various temporal and spatial conditions.
For ease of presentation, the key estimated coefficients of the frequency changes of HSR and aviation services are summarized in Table 4. Given that both the dependent and independent variables reflecting the daily frequency of air and HSR service, respectively, are in the logarithmic form, the estimated coefficients can be interpreted as the elasticity of modal frequency adjustment. Note that the elasticity of modal substitution was estimated based on the corresponding frequencies of HSR and aviation serving the same OD pairs in various contexts, ceteris paribus. The multiple model IDs represent models with different scenarios in terms of regions and types of cities. The table mainly reflects service frequency adjustments associated with the various external environmental conditions. The detailed results are included in Appendix A Table A4.
The results reveal that the overall elasticity value is −0.104, which confirms that the frequency change of HSR had a negative association with that of aviation during the study period. In particular, during Phases 1, 2, and 3, the elasticity rates were −0.165, −0.078, and −0.115, respectively, suggesting that the level of substitution has reduced by half during the Wuhan lockdown (comparing the estimate between Phase 1 and 2) but slightly recovered relatively during the recovery stage (Phase 3). From a regional perspective, the service relationship varied substantially among different regions and types of cities. For instance, among the cities with more than 10 million people, the elasticity rate was found to be at 0.056, which is lower than the national average. Interestingly, during the lockdown period, the elasticity rate increased to 0.385, which suggests that HSR presents a strong alternative when most domestic aviation services are suspended or canceled. Conversely, the assessment also revealed that in certain regions and cities, the relationship between HSR and aviation was complementary rather than a substitution. For instance, in the central south region, the elasticity rates were found to be 0.098 and 0.139 during Phase 1 and Phase 3, respectively. Similarly, positive rates were also found among cities with populations of 1–5 million during Phases 1 and 2, suggesting that the service frequency changes of HSR and aviation tend to be in the same direction.
Such a result confirms that the competition between HSR and air transportation varies substantially between the different regions of China. In particular, the negative statistical association was found to be especially strong in cities with a population size of 5–10 million and in East China, which suggests that a strong substitution of HSR for air service may exist in cities with a relatively high intercity travel demand and a well-developed HSR system. In terms of temporal variation, the results show that while the level of substitution between HSR and air reduced among most regions and cities during the Wuhan lockdown period, in other cities or regions, for instance, the smaller cities with a population size of 1–5 million, and those cities located in the southwest, HSR service presents a strong complementary relationship with aviation, especially during the lockdown period. Such a pattern suggests that the outbreak of COVID-19 had a relatively strong negative impact on intercity mobility among these regions, perhaps due to the lack of modal substitution, as the shocks from COVID-19 had led to a large frequency cut in both HSR and aviation services.
6. Conclusions
6.1. Key Findings
In the context of the COVID-19 pandemic, this study utilizes China’s HSR and aviation systems as examples to address two key research questions related to the performance of intercity transportation systems: to what extent the pandemic has affected the service frequency of HSR and aviation, and how it has influenced the competitive relationship of HSR and aviation.
Overall, our assessment found that HSR and aviation operations were both severely impacted by the outbreak of COVID-19. While the service frequency of both transportation modes reduced significantly after the initial outbreak, intercity transportation services, in general, experienced a rapid bounce back, albeit the speed of recovery varied between regions and different types of cities due to the competitive relationships between the two modes.
In particular, the lockdown of Wuhan had a relatively larger negative impact on the service frequency of HSR serving the central–southern region and in cities with populations between 5–10 million than that of the aviation system. Such a result is not surprising, given that Wuhan is located in the center of the central and south region of China, which serves as a major HSR hub under normal circumstances. It is clear that the lockdown of Wuhan had a much more significant negative impact on HSR than aviation. This is due to the fact that despite the temporary suspension of commercial aviation services, aviation continued to be extensively used for charter services to transport medical staff and equipment from various provinces to Wuhan, in order to help support a speedy recovery of the city. Hence, the overall dampening effects were found to be less disruptive to the aviation system. However, the impacts of the travel restrictions across the nation had a noticeably positive impact on the service frequency of HSR in different regions and types of cities. This is in part because the aircraft mainly serves long-distance travel. During the pandemic, the virus infection is transmitted through the air and will inevitably place people in relatively close contact with others and increase the risk of infection. HSR’s main services are for relatively medium and short trips, which can meet people’s travel needs while maintaining the risk of infection at a relatively lower level.
In addition, the number of daily confirmed cases was found to have a relatively higher dampening effect on the aviation system than on HSR, especially in large cities with a population of more than 10 million and cities located in the southwest region. Conversely, the negative impacts were found to be relatively larger on HSR than aviation in East China. These heterogeneous impacts can be attributed to the different quality of service among various regions in terms of transport connectivity and accessibility.
Lastly, the study confirms that while HSR generally has a strong substitution effect on the aviation system, the level of substitutions varied both spatially and temporally during the outbreak. Specifically, while a strong substitution effect was observed in more developed areas such as the eastern region and large cities with populations greater than 10 million, even during the lockdown, the HSR-serving cities with smaller populations of less than 5 million and those located in the southwest were found to have a strong complementary relationship with air service, especially during the Wuhan lockdown period. Such a pattern suggests that the outbreak of COVID-19 had a relatively substantial, negative impact on intercity mobility among these regions in consequence of the lack of modal substitution.
6.2. Implications
This research contributes to the planning and management decision-making of transportation in the following aspects. Firstly, due to different travel behaviors, regional characteristics, and infrastructure availability, the substitution of HSR and aviation were found to differ significantly. Given that modal substitution is one of the key resilience tactics to achieving a speedy recovery of both the transportation system and the economic system [48], more efforts should be provided to improve the substitution between HSR and aviation. For instance, transportation planning and operational agencies need to improve collaboration in order to facilitate a more seamless modal substitution among different modes of transportation. In addition, given that travel restriction and the increase in the number of cases were found to have a direct influence on HSR and aviation services, transportation planning agencies need to develop more effective strategies, such as enabling more timely and flexible service schedule adjustments and the implementation of stringent hygiene measures in order to improve travel safety and maintain the essential function of intercity transportation services, as well as to achieve a rapid recovery when future pandemics occur.
6.3. Limitations and Future Research
One should note that this study has several limitations, which should be improved in future research endeavors. Firstly, our examination focused on statistical association instead of causation. However, given that the frequency adjustment of intercity transportation services may also influence the spread of the diseases, as confirmed in previous studies [22,49,50], future research should control for the simultaneous effect between the confirmed cases and frequency of transportation services, so that the analysis can better reveal the causal responses. Secondly, the data used in this study is limited as it only covers six months of 2020. Hence, it should be noted that the research findings revealed in this study may be limited. The study could be expanded by extending the temporal coverage of the data so that the research findings could be further validated. Thirdly, the research only provides an assessment from the supply side, as there is a lack of data reflecting the variations in actual passenger flow. In particular, one should note that the discussion of the modal relationship was primarily based on the statistical estimate from the corresponding frequency adjustment. Future research can also be expanded by using data from either passenger surveys or passively generated demand data so that the impact of disasters such as pandemics can also be evaluated on the demand side.
Author Contributions
Conceptualization, Z.C.; methodology, S.Y.; software, S.Y.; validation, S.Y., Z.C.; formal analysis, S.Y.; investigation, S.Y. and Z.C.; resources, S.Y. and Z.C.; data curation, S.Y.; writing—original draft preparation, S.Y. and Z.C.; writing—review and editing, Z.C.; visualization, S.Y.; supervision, Z.C.; project administration, Z.C. All authors have read and agreed to the published version of the manuscript.
Funding
This research received no external funding.
Institutional Review Board Statement
Not applicable.
Informed Consent Statement
Not applicable.
Data Availability Statement
Data available on request from the authors.
Conflicts of Interest
The authors declare no conflict of interest.
Appendix A

Table A1.
List of cities with travel restriction policies.
| City | Restriction Start (daynum) | Restriction End (daynum) | Restriction Start Date | Restriction End Date |
|---|---|---|---|---|
| Anqing | 22 | 39 | 5 February 2020 | 22 February 2020 |
| Anshun | 24 | 32 | 7 February 2020 | 15 February 2020 |
| Beijing | 20 | 167 | 3 February 2020 | 29 June 2020 |
| Changchun | 23 | 38 | 6 February 2020 | 21 February 2020 |
| Changsha | 11 | 77 | 25 January 2020 | 31 March 2020 |
| Changzhou | 21 | 40 | 4 February 2020 | 23 February 2020 |
| Chengdu | 24 | 42 | 7 February 2020 | 25 February 2020 |
| Chizhou | 22 | 25 | 5 February 2020 | 8 February 2020 |
| Chongqing | 18 | 25 | 1 February 2020 | 8 February 2020 |
| Enshi | 12 | 71 | 26 January 2020 | 25 March 2020 |
| Foshan | 25 | 41 | 8 February 2020 | 24 February 2020 |
| Fuyang | 22 | 25 | 5 February 2020 | 8 February 2020 |
| Fuzhou | 21 | 39 | 4 February 2020 | 22 February 2020 |
| Guangyuan | 24 | 42 | 7 February 2020 | 25 February 2020 |
| Guangzhou | 24 | 41 | 7 February 2020 | 24 February 2020 |
| Guilin | 22 | 36 | 5 February 2020 | 19 February 2020 |
| Guiyang | 24 | 32 | 7 February 2020 | 15 February 2020 |
| Hangzhou | 21 | 34 | 4 February 2020 | 17 February 2020 |
| Hanzhong | 25 | 38 | 8 February 2020 | 21 February 2020 |
| Harbin | 21 | 38 | 4 February 2020 | 21 February 2020 |
| Hefei | 22 | 39 | 5 February 2020 | 22 February 2020 |
| Hohhot | 29 | 38 | 12 February 2020 | 21 February 2020 |
| Huangshan | 22 | 39 | 5 February 2020 | 22 February 2020 |
| Huizhou | 25 | 41 | 8 February 2020 | 24 February 2020 |
| Jinan | 22 | 35 | 5 February 2020 | 18 February 2020 |
| Jingdezhen | 21 | 38 | 4 February 2020 | 21 February 2020 |
| Kunming | 22 | 38 | 5 February 2020 | 21 February 2020 |
| Lanzhou | 24 | 38 | 7 February 2020 | 21 February 2020 |
| Lianyungang | 24 | 40 | 7 February 2020 | 23 February 2020 |
| Linyi | 21 | 48 | 4 February 2020 | 2 March 2020 |
| Luoyang | 21 | 38 | 4 February 2020 | 21 February 2020 |
| Mianyang | 25 | 42 | 8 February 2020 | 25 February 2020 |
| Nanchang | 22 | 38 | 5 February 2020 | 21 February 2020 |
| Nanchong | 24 | 42 | 7 February 2020 | 25 February 2020 |
| Nanjing | 21 | 40 | 4 February 2020 | 23 February 2020 |
| Nanning | 22 | 38 | 5 February 2020 | 21 February 2020 |
| Nanyang | 21 | 38 | 4 February 2020 | 21 February 2020 |
| Ningbo | 21 | 34 | 4 February 2020 | 17 February 2020 |
| Qingdao | 22 | 48 | 5 February 2020 | 2 March 2020 |
| Shanghai | 10 | 36 | 24 January 2020 | 19 February 2020 |
| Shenyang | 21 | 34 | 4 February 2020 | 17 February 2020 |
| Shenzhen | 24 | 41 | 7 February 2020 | 24 February 2020 |
| Shijiazhuang | 22 | 38 | 5 February 2020 | 21 February 2020 |
| Shiyan | 10 | 71 | 24 January 2020 | 25 March 2020 |
| Taiyuan | 23 | 48 | 6 February 2020 | 2 March 2020 |
| Tangshan | 24 | 37 | 7 February 2020 | 20 February 2020 |
| Tianjin | 26 | 36 | 9 February 2020 | 19 February 2020 |
| Tongren | 24 | 32 | 7 February 2020 | 15 February 2020 |
| Weifang | 22 | 48 | 5 February 2020 | 2 March 2020 |
| Weihai | 22 | 48 | 5 February 2020 | 2 March 2020 |
| Wenzhou | 19 | 34 | 2 February 2020 | 17 February 2020 |
| Wuhan | 9 | 85 | 23 January 2020 | 8 April 2020 |
| Wuxi | 20 | 40 | 3 February 2020 | 23 February 2020 |
| Xiamen | 21 | 39 | 4 February 2020 | 22 February 2020 |
| Xi’an | 19 | 26 | 2 February 2020 | 9 February 2020 |
| Xinyang | 21 | 48 | 4 February 2020 | 2 March 2020 |
| Xuzhou | 21 | 40 | 4 February 2020 | 23 February 2020 |
| Yancheng | 22 | 40 | 5 February 2020 | 23 February 2020 |
| Yantai | 22 | 48 | 5 February 2020 | 2 March 2020 |
| Yibin | 24 | 42 | 7 February 2020 | 25 February 2020 |
| Yichang | 10 | 71 | 24 January 2020 | 25 March 2020 |
| Zhanjiang | 25 | 41 | 8 February 2020 | 24 February 2020 |
| Zhengzhou | 21 | 48 | 4 February 2020 | 2 March 2020 |
| Zhuhai | 23 | 41 | 6 February 2020 | 24 February 2020 |
| Zunyi | 24 | 32 | 7 February 2020 | 15 February 2020 |
Source: The Ministry of Transport of the People’s Republic of China.
Table A2.
Regression results of the HDFE model (based on the share of the average capacity of HSR in each corridor).
Table A2.
Regression results of the HDFE model (based on the share of the average capacity of HSR in each corridor).
| Variable | Model 10 | Model 11 | Model 12 | Model 13 | Model 14 | Model 15 | Model 16 | Model 17 | Model 18 |
|---|---|---|---|---|---|---|---|---|---|
| All | POP > 10 | POP 5–10 | POP 1–5 | Ctr_sth | Southwest | North | Northeast | East | |
| lock_d | −0.032 | −0.115 | −0.071 *** | ||||||
| (−0.68) | (−1.57) | (−2.85) | |||||||
| kcase_o | −0.052 | 0.642 ** | −0.114 | −0.347 | −0.082 | 6.637 *** | 0.399 | 2.847 | −1.485 *** |
| (−0.43) | (2.46) | (−1.30) | (−0.42) | (−1.21) | (4.47) | (0.57) | (0.33) | (−3.03) | |
| kcase_d | −0.104 | 0.967 *** | −0.447 | −0.367 | −0.650 | 3.208 *** | 0.289 | 10.105 * | −1.283 *** |
| (−0.44) | (2.90) | (−0.95) | (−0.37) | (−1.16) | (2.69) | (0.44) | (1.79) | (−2.79) | |
| ktemp_o | 2.516 *** | 0.004 | 2.402 | 1.923 *** | 5.505 *** | −0.100 | 11.791 *** | −8.004 *** | 6.430 *** |
| (7.97) | (0.00) | (1.51) | (4.33) | (5.55) | (−0.03) | (2.71) | (−3.80) | (6.72) | |
| ktemp_d | 2.652 *** | 1.702 | 1.895 | 2.180 *** | 4.148 *** | 13.998 *** | 15.261 *** | −11.360 *** | −0.928 |
| (7.88) | (0.75) | (1.19) | (4.20) | (3.70) | (3.20) | (3.59) | (−5.95) | (−1.23) | |
| ktemp2_o | −0.073 *** | −0.028 | −0.068 * | −0.053 *** | −0.085 *** | 0.008 | −0.204 ** | 0.084 | −0.181 *** |
| (−8.38) | (−0.52) | (−1.90) | (−4.15) | (−3.07) | (0.07) | (−2.14) | (0.81) | (−7.36) | |
| ktemp2_d | −0.070 *** | −0.078 | −0.072 * | −0.012 | −0.060 ** | −0.288 ** | −0.296 *** | 0.213 ** | 0.014 |
| (−7.15) | (−1.34) | (−1.90) | (−0.83) | (−2.19) | (−2.37) | (−3.09) | (2.16) | (0.67) | |
| snow_o | −0.003 | −0.002 | −0.000 | 0.018 | 0.062 *** | 0.028 | −0.097 | 0.025 | 0.007 |
| (−0.37) | (−0.12) | (−0.00) | (1.33) | (2.78) | (0.68) | (−1.57) | (1.00) | (0.24) | |
| snow_d | −0.001 | 0.024 | 0.002 | 0.023 | 0.065 *** | −0.091 *** | 0.003 | 0.026 | −0.038 |
| (−0.11) | (0.97) | (0.06) | (1.44) | (4.23) | (−4.97) | (0.04) | (1.05) | (−1.38) | |
| rain_o | 0.002 | 0.016 *** | 0.006 | −0.001 | 0.008 * | −0.014 * | 0.020 * | 0.003 | 0.004 |
| (1.37) | (2.82) | (1.19) | (−0.24) | (1.79) | (−1.72) | (1.75) | (0.07) | (0.80) | |
| rain_d | −0.001 | 0.014 *** | 0.002 | −0.000 | 0.002 | −0.011 | 0.005 | 0.008 | 0.000 |
| (−0.48) | (2.65) | (0.45) | (−0.02) | (0.44) | (−1.08) | (0.40) | (0.25) | (0.03) | |
| diskkm | −0.371 *** | −0.704 *** | −0.773 *** | −0.321 *** | −0.487 *** | 0.847 *** | 2.645 *** | −0.730 *** | |
| (−155.71) | (−46.51) | (−58.71) | (−66.93) | (−12.64) | (14.87) | (3.99) | (−55.51) | ||
| restrictions | 0.042 *** | 0.029 *** | 0.033 * | 0.038 *** | 0.078 *** | −0.006 | 0.218 *** | −0.021 | |
| (8.88) | (3.26) | (1.84) | (5.60) | (6.05) | (−0.16) | (12.49) | (−1.51) | ||
| constant | 0.702 *** | 1.063 *** | 1.121 *** | 0.660 *** | 0.718 *** | −0.074 | 0.166 * | −1.969 *** | 0.987 *** |
| (86.53) | (26.39) | (34.40) | (55.37) | (19.20) | (−0.97) | (1.93) | (−3.17) | (42.21) | |
| N | 71,323 | 1829 | 5113 | 12,359 | 5329 | 2039 | 487 | 365 | 8004 |
| R2 | 0.476 | 0.878 | 0.671 | 0.687 | 0.737 | 0.827 | 0.951 | 0.925 | 0.580 |
Notes: 1. t statistics in parentheses. 2. * p < 0.10, ** p < 0.05, *** p < 0.01. 3. POP is short for population. POP > 10 means the population of a city is more than 10 million. Ctr_sth is short for central south. 4. Other factors including the dummy variables representing different stages of the pandemic, and the major holidays are excluded in the results because they are automatically removed from the HDFE model given these factors did not change among different city pairs. Source: Authors’ calculation.
Table A3.
Regression results of the HDFE model (based on the share of the maximum capacity of HSR in each corridor).
Table A3.
Regression results of the HDFE model (based on the share of the maximum capacity of HSR in each corridor).
| Variable | Model 19 | Model 20 | Model 21 | Model 22 | Model 23 | Model 24 | Model 25 | Model 26 | Model 27 |
|---|---|---|---|---|---|---|---|---|---|
| All | POP > 10 | POP 5–10 | POP 1–5 | Ctr_sth | Southwest | North | Northeast | East | |
| lock_d | −0.085 *** | −0.186 *** | −0.097 *** | ||||||
| (−2.79) | (−3.45) | (−7.52) | |||||||
| kcase_o | −0.053 | 0.695 | −0.154 | −0.599 | −0.061 | 2.410 *** | 0.073 | 3.369 | −0.644 *** |
| (−0.61) | (1.32) | (−1.07) | (−1.19) | (−1.17) | (3.05) | (0.21) | (0.42) | (−2.78) | |
| kcase_d | −0.069 | 0.880 * | −0.314 | −0.503 | −0.475 | 0.490 | 0.052 | 8.876 * | −0.682 *** |
| (−0.37) | (1.67) | (−0.97) | (−0.80) | (−1.53) | (0.63) | (0.16) | (1.66) | (−2.87) | |
| ktemp_o | 2.264 *** | 3.291 * | 0.713 | 1.242 *** | 4.747 *** | −3.851 | −0.907 | −8.489 *** | 2.773 *** |
| (7.55) | (1.92) | (0.52) | (3.81) | (7.54) | (−1.16) | (−0.37) | (−4.04) | (4.65) | |
| ktemp_d | 2.102 *** | 7.237 *** | 0.284 | 0.261 | 3.595 *** | 2.154 | −0.000 | −9.518 *** | −0.440 |
| (6.63) | (4.38) | (0.21) | (0.66) | (6.08) | (0.62) | (−0.00) | (−5.03) | (−0.99) | |
| ktemp2_o | −0.063 *** | −0.056 | −0.003 | −0.038 *** | −0.099 *** | 0.146 | 0.063 | 0.106 | −0.069 *** |
| (−7.97) | (−1.22) | (−0.08) | (−4.03) | (−5.26) | (1.58) | (1.25) | (1.02) | (−5.23) | |
| ktemp2_d | −0.056 *** | −0.148 *** | −0.008 | 0.021 ** | −0.078 *** | −0.012 | 0.036 | 0.227 ** | 0.013 |
| (−7.17) | (−3.32) | (−0.26) | (2.27) | (−4.58) | (−0.13) | (0.75) | (2.34) | (1.32) | |
| snow_o | 0.002 | 0.027 * | −0.011 | 0.005 | 0.038 *** | 0.059 * | −0.033 | 0.001 | −0.001 |
| (0.19) | (1.89) | (−0.38) | (0.33) | (5.06) | (1.79) | (−1.11) | (0.05) | (−0.05) | |
| snow_d | 0.005 | 0.050 *** | 0.011 | 0.010 | 0.032 *** | −0.030 | 0.013 | 0.005 | −0.009 |
| (0.57) | (2.66) | (0.49) | (0.50) | (2.83) | (−0.83) | (0.36) | (0.19) | (−0.68) | |
| rain_o | 0.001 | 0.016 ** | 0.004 | −0.000 | 0.005 * | −0.006 | 0.015 * | 0.007 | 0.005 ** |
| (0.96) | (2.38) | (1.04) | (−0.22) | (1.68) | (−0.95) | (1.90) | (0.26) | (2.00) | |
| rain_d | −0.001 | 0.013 * | 0.004 | 0.000 | −0.000 | −0.000 | 0.003 | 0.009 | 0.003 |
| (−0.31) | (1.92) | (1.03) | (0.16) | (−0.11) | (−0.03) | (0.33) | (0.35) | (1.42) | |
| diskkm | −0.287 *** | −0.754 *** | −0.610 *** | −0.190 *** | −0.239 *** | 0.760 *** | 1.494 ** | −0.302 *** | |
| (−105.05) | (−44.72) | (−59.80) | (−56.10) | (−10.76) | (25.92) | (2.53) | (−31.97) | ||
| restrictions | 0.046 *** | 0.068 *** | 0.023 | 0.031 *** | 0.032 *** | 0.019 | 0.083 *** | −0.003 | |
| (11.16) | (6.64) | (1.55) | (7.22) | (4.31) | (0.91) | (9.95) | (−0.42) | ||
| constant | 0.973 *** | 1.255 *** | 1.330 *** | 0.928 *** | 0.911 *** | 0.441 *** | 0.807 *** | −0.531 | 1.017 *** |
| (108.35) | (33.27) | (51.42) | (107.16) | (41.72) | (7.67) | (15.87) | (−0.97) | (60.83) | |
| N | 71,323 | 1829 | 5113 | 12,359 | 5329 | 2039 | 487 | 365 | 8004 |
| R2 | 0.507 | 0.940 | 0.603 | 0.611 | 0.692 | 0.813 | 0.927 | 0.840 | 0.640 |
Notes: 1. t statistics in parentheses. 2. * p < 0.10, ** p < 0.05, *** p < 0.01. 3. POP is short for population. POP > 10 means the population of a city is more than 10 million. Ctr_sth is short for central south. 4. Other factors including the dummy variables representing different stages of the pandemic, and the major holidays are excluded in the results because they are automatically removed from the HDFE model given these factors did not change among different city pairs. Source: Authors’ calculation.
Table A4.
Regression results based on the share of the daily frequency of aviation service.
| Sample | All Sample Model | Cities with a Population of over 10 Million (M) | Cities Population Ranging from 5 M to 10 M | Cities with a Population Ranging from 1 M to 5 M | Central_South | Central_South | Southwest Region | North Region | Northeast Region | East Region | ||||||||||||||||||||||||||
|---|---|---|---|---|---|---|---|---|---|---|---|---|---|---|---|---|---|---|---|---|---|---|---|---|---|---|---|---|---|---|---|---|---|---|---|---|
| Model ID | Model 28 | Model 29 | Model 30 | Model 31 | Model 32 | Model 33 | Model 34 | Model 35 | Model 36 | Model 37 | Model 38 | Model 39 | Model 40 | Model 41 | Model 42 | Model 43 | Model 44 | Model 45 | Model 46 | Model 47 | Model 48 | Model 49 | Model 50 | Model 51 | Model 52 | Model 53 | Model 54 | Model 55 | Model 56 | Model 57 | Model 58 | Model 59 | Model 60 | Model 61 | Model 62 | Model 63 |
| Data Period | Phase 1 | Phase 2 | Phase 3 | All Period | Phase 1 | Phase 2 | Phase 3 | All Period | Phase 1 | Phase 2 | Phase 3 | All Period | Phase 1 | Phase 2 | Phase 3 | All Period | Phase 1 | Phase 2 | Phase 3 | All Period | Phase 1 | Phase 2 | Phase 3 | All Period | Phase 1 | Phase 2 | Phase 3 | All Period | Phase 1 | Phase 2 | Phase 3 | All Period | Phase 1 | Phase 2 | Phase 3 | All Period |
| ln_HSRvol | −0.165 *** | −0.078 *** | −0.115 *** | −0.104 *** | −0.026 | −0.098 | −0.018 | 0.056 *** | −0.389 *** | −0.191 *** | −0.376 *** | −0.314 *** | 0.099 *** | 0.051 *** | −0.021 * | 0.003 | 0.098 *** | −0.023 | 0.139 *** | 0.080 *** | −0.131 | 0.463 *** | −0.528 *** | −0.187 ** | −0.657 *** | −0.118 | −0.239 ** | −0.110 | 0.057 | 1.006 ** | −0.199 *** | −0.080 *** | −0.315 *** | −0.148 *** | ||
| (−66.28) | (−13.86) | (−37.71) | (−35.82) | (−0.32) | (−0.64) | (−1.13) | -3.2 | (−10.95) | (−8.54) | (−24.97) | (−23.21) | −4.18 | −4.19 | (−1.93) | −0.33 | −5.74 | (−1.02) | −6.79 | −6.04 | (−0.34) | −4.17 | (−2.89) | (−2.51) | (−4.20) | (−0.87) | (−2.11) | (−0.26) | −0.23 | −2.01 | (−14.47) | (−7.74) | (−10.68) | (−13.74) | |||
| kcase_o | 0.471 *** | 0.375 * | −3.017 | 0.416 | −6.364 | 5.582 ** | −8.326 | −3.034 | −0.006 | −0.740 * | −1.038 *** | −0.073 | −28.645 | −2.988 | 25.994 | −3.983 | 0.2 | 0.218 ** | −0.434 *** | 0.417 | 34.288 | −7.621 | 46.661 * | −13.803 ** | 70.514 | −77.789 | 0.326 | −0.624 | 151.551 | −16.010 | 17.442 | −17.289 | −2.081 | 4.986 *** | 0.795 | 8.559 *** |
| −3.81 | −1.8 | (−1.47) | −1.03 | (−1.65) | −2.61 | (−1.35) | (−1.27) | (−0.01) | (−1.70) | (−6.95) | (−0.10) | (−1.29) | (−1.14) | −0.46 | (−1.44) | −0.47 | −2.32 | (−2.79) | −1.35 | −0.82 | (−1.19) | −1.87 | (−2.31) | −1.89 | (−1.25) | −0.1 | (−0.19) | −1.77 | (−0.29) | −0.34 | (−0.42) | (−0.66) | −2.96 | −0.7 | −3.84 | |
| kcase_d | 0.167 | 0.327 | −3.085 | 0.471 | −4.669 | 4.391 ** | −9.759 | −4.301 * | −0.230 | 1.615 | −1.228 *** | 2.588 | 3.593 | 0.6 | 773.825 *** | −3.509 | 0.285 | −2.912 | −0.404 ** | 2.746 | 15.234 | −0.145 | 16.991 | −13.482 *** | 34.623 | −75.152 | 0.447 | −1.274 | 703.217 | −52.039 ** | 443.500 *** | −41.894 | −2.133 | 2.349 | 0.007 | 7.591 *** |
| −0.65 | −0.3 | (−1.55) | −0.46 | (−1.48) | −2.52 | (−1.56) | (−1.66) | (−0.29) | −0.98 | (−8.54) | −1.22 | −0.15 | −0.17 | −14.55 | (−0.96) | −0.97 | (−1.47) | (−2.14) | −1.24 | −0.27 | (−0.03) | −0.81 | (−2.89) | −1.02 | (−1.19) | −0.15 | (−0.38) | −1.6 | (−2.41) | −5.72 | (−1.46) | (−0.61) | −1.52 | 0 | −3.58 | |
| ktemp_o | −0.514 | −15.550 *** | 2.528 | −11.801 *** | −12.124 | −38.385 *** | 97.894 *** | −34.708 *** | 0.772 | −65.495 *** | 20.023 * | −7.637 | 7.517 | −14.617 *** | −5.135 | −13.125 *** | −4.494 | 28.855 *** | −48.397 *** | −22.189 *** | 315.679 * | 29.602 | −28.198 | −10.332 | 142.642 * | −11.283 | −4.929 | −62.848 *** | 45.878 | 54.534 | −13.401 | 41.630 *** | 8.301 | 3.809 | 11.186 | −2.570 |
| (−0.13) | (−8.38) | −0.57 | (−7.57) | (−1.34) | (−5.19) | −4.06 | (−4.43) | −0.04 | (−4.21) | −1.82 | (−1.16) | −0.72 | (−5.60) | (−1.10) | (−7.11) | (−0.14) | −3.37 | (−3.92) | (−4.38) | −2.16 | −0.9 | (−1.02) | (−0.64) | −2.11 | (−0.18) | (−0.12) | (−3.07) | −0.77 | −1.59 | (−0.34) | −4.1 | −0.67 | −1 | −1.03 | (−0.81) | |
| ktemp_d | 0.859 | −12.407 *** | 0.538 | −9.239 *** | −12.746 | −38.496 *** | 58.031 ** | −38.109 *** | 5.419 | −69.675 *** | 34.052 ** | −6.431 | 9.416 | 2.768 | −1.167 | −1.582 | −12.532 | 19.440 ** | −47.477 *** | −23.459 *** | 105.913 | 27.518 | −33.969 | 16.95 | 101.550 * | −6.051 | −1.520 | −59.225 *** | −38.319 | 77.161 ** | −18.006 | 55.041 *** | 14.333 | 8.387 ** | 22.172 ** | 1.018 |
| −0.18 | (−5.17) | −0.13 | (−5.33) | (−1.47) | (−5.37) | −2.25 | (−4.98) | −0.22 | (−4.27) | −2.36 | (−0.93) | −1.32 | −0.89 | (−0.23) | (−0.87) | (−0.55) | −2.4 | (−3.51) | (−4.31) | −1.15 | −0.92 | (−1.12) | −0.92 | −1.92 | (−0.13) | (−0.04) | (−2.97) | (−0.49) | −2.52 | (−0.53) | −6.08 | −1.59 | −2.05 | −2.34 | −0.35 | |
| ktemp2_o | 0.084 | 0.599 *** | −0.045 | 0.282 *** | 0.364 | 0.883 *** | −2.000 *** | 0.794 *** | 0.435 | 3.107 *** | −0.210 | 0.381 ** | −0.656 * | 0.559 *** | 0.054 | 0.333 *** | −0.128 | −0.813 *** | 0.920 *** | 0.430 *** | −22.064 ** | −1.015 | 0.843 | 0.451 | 10.740 * | 1.209 | −0.506 | 0.860 * | 0.511 | 1.718 | 0.916 | −0.474 | 0.12 | −0.055 | −0.254 | 0.07 |
| −0.64 | −10.25 | (−0.41) | −7.2 | −1.35 | −3.76 | (−3.38) | −3.22 | −0.5 | −4.64 | (−0.87) | −2.37 | (−2.04) | −5.56 | −0.53 | −7.23 | (−0.08) | (−2.81) | −3.44 | −2.98 | (−2.42) | (−0.90) | −1.19 | −0.98 | −2.01 | −0.52 | (−0.55) | −1.83 | −0.3 | −1.09 | −0.62 | (−0.94) | −0.23 | (−0.37) | (−1.06) | −0.94 | |
| ktemp2_d | 0.035 | 0.447 *** | −0.017 | 0.212 *** | 0.211 | 0.812 *** | −1.045 * | 0.919 *** | 0.369 | 3.202 *** | −0.595 * | 0.296 * | −0.340 | −0.054 | −0.056 | −0.005 | 0.238 | −0.569 ** | 0.867 *** | 0.433 *** | −6.320 | −0.744 | 1.056 | −0.110 | 9.910 * | 1.788 | −0.498 | 0.943 ** | −3.410 | 0.723 | 1.213 | −1.125 ** | −0.203 | −0.225 | −0.561 *** | −0.079 |
| −0.24 | −6.32 | (−0.17) | −5.28 | −0.74 | −3.51 | (−1.71) | −3.89 | −0.33 | −4.92 | (−1.95) | −1.74 | (−0.69) | (−0.47) | (−0.48) | (−0.10) | −0.2 | (−2.06) | −3.07 | −2.94 | (−1.03) | (−0.72) | −1.36 | (−0.22) | −1.98 | −1 | (−0.54) | −2.03 | (−1.14) | −0.47 | −0.92 | (−2.36) | (−0.97) | (−1.56) | (−2.85) | (−1.23) | |
| snow_o | −0.015 | −0.013 | −0.150 *** | −0.013 | −0.113 | −0.042 | 0.079 | −0.079 | −0.011 | −0.042 | −0.090 | 0.069 | −0.025 | −0.021 | 0.06 | −0.352 *** | 0.005 | 0.022 | 0 | 0.610 ** | 0.477 | 0.021 | −0.210 | −0.074 | −0.037 | 0.013 | −0.030 | −0.067 | ||||||||
| (−0.52) | (−0.21) | (−3.29) | (−0.27) | (−1.01) | (−0.46) | −1.36 | (−0.34) | (−0.07) | (−1.04) | (−0.85) | −1.2 | (−0.33) | (−0.33) | −0.4 | (−2.97) | −0.02 | −0.07 | −2.17 | −1.52 | −0.49 | (−1.23) | (−1.06) | (−0.28) | −0.11 | (−0.33) | (−0.71) | ||||||||||
| snow_d | −0.002 | −0.007 | −0.047 | −0.001 | −0.125 | −0.051 | 0.153 ** | −0.146 | −0.026 | −0.001 | −0.021 | −0.002 | −0.101 | −0.042 | −0.374 *** | 0.419 *** | 0.438 *** | 0.319 | 0.127 | 0.062 | −0.165 | −0.048 | 0.016 | 0.017 | −0.008 | |||||||||||
| (−0.08) | (−0.10) | (−0.78) | (−0.03) | (−1.01) | (−0.47) | −2.58 | (−0.56) | (−0.16) | (−0.03) | (−0.15) | (−0.02) | (−1.57) | (−0.25) | (−3.55) | −2.72 | −4.05 | −1.16 | −0.42 | −1.15 | (−0.82) | (−0.36) | −0.24 | −0.17 | (−0.10) | ||||||||||||
| rain_o | −0.024 *** | 0 | −0.015 * | −0.007 | 0.064 * | −0.143 *** | −0.088 *** | −0.087 | −0.114 ** | −0.018 | −0.024 | −0.078 *** | −0.008 | −0.007 | −0.003 | −0.011 | −0.041 | −0.008 | −0.022 | −0.097 | −0.099 | 0.02 | 0.009 | −0.178 ** | −0.161 *** | −0.022 | −0.040 | −0.014 | 0.008 | −0.008 | −0.006 | |||||
| (−8.17) | −0.02 | (−1.74) | (−0.86) | −1.92 | (−3.78) | (−2.67) | (−1.77) | (−2.13) | (−0.90) | (−1.22) | (−3.58) | (−0.33) | (−0.82) | (−0.32) | (−0.28) | (−1.26) | (−0.38) | (−1.18) | (−0.58) | (−1.10) | −0.69 | −0.31 | (−2.46) | (−2.69) | (−0.16) | (−0.27) | (−0.16) | −0.24 | (−0.55) | (−0.37) | ||||||
| rain_d | 0.018 | 0.004 | −0.009 | −0.002 | 0.053 * | −0.109 *** | −0.071 ** | −0.070 | −0.094 | −0.024 | −0.028 | −0.063 * | −0.010 | −0.005 | −0.002 | 0.003 | −0.025 | 0.012 | 0.004 | −0.207 | −0.156 | 0.029 | 0.01 | −0.158 ** | −0.147 ** | −0.016 | −0.062 | 0.077 *** | 0.004 | −0.003 | −0.003 | |||||
| −1.28 | −0.3 | (−1.09) | (−0.21) | −1.78 | (−2.90) | (−2.32) | (−1.55) | (−1.36) | (−1.16) | (−1.40) | (−2.03) | (−0.38) | (−0.54) | (−0.20) | −0.06 | (−0.81) | −0.55 | −0.23 | (−1.30) | (−1.43) | −0.7 | −0.24 | (−2.30) | (−2.56) | (−0.12) | (−0.44) | −3.83 | −0.13 | (−0.16) | (−0.17) | ||||||
| diskkm | 0.541 *** | 0.445 *** | 0.325 *** | 0.377 *** | −1.665 *** | −4.494 *** | 0.849 *** | 0.994 *** | −0.267 | −0.416 *** | −0.659 *** | −0.503 *** | 0.991 *** | 0.452 *** | 0.290 *** | 0.354 *** | 1.335 *** | 1.624 *** | 1.308 *** | 1.298 *** | 1.443 | −4.473 *** | −5.766 *** | −5.314 *** | −3.746 ** | −11.161 * | 2.419 *** | 1.171 *** | 0.777 *** | 1.013 *** | ||||||
| −37.36 | −28.3 | −37.7 | −39.98 | (−4.62) | (−4.58) | −4.64 | −4.51 | (−1.02) | (−3.03) | (−9.85) | (−9.35) | −17.6 | −13.04 | −10.9 | −15.05 | −10.15 | −12.57 | −6.99 | −11.02 | −1.72 | (−10.30) | (−18.32) | (−21.85) | (−2.10) | (−1.85) | −32.3 | −17.79 | −10.14 | −17.46 | |||||||
| restrictions | −0.189 *** | 0.646 *** | −0.262 *** | −0.203 *** | 0.774 *** | −0.295 *** | −0.094 | 0.752 *** | −0.025 | −0.032 | −0.133 *** | 0.021 | 0.671 *** | −0.156 *** | −0.184 * | −0.186 | −0.907 *** | 0.079 * | 0.038 | |||||||||||||||||
| (−9.59) | −18 | (−11.80) | (−5.60) | −12.82 | (−5.85) | (−1.39) | −19.7 | (−0.30) | (−1.01) | (−5.41) | −0.39 | −26.38 | (−3.24) | (−1.69) | (−1.63) | (−11.98) | −1.91 | −0.69 | ||||||||||||||||||
| constant | 0.970 *** | 0.624 *** | 0.672 *** | 0.907 *** | 6.045 *** | 9.132 *** | −0.641 | 2.069 *** | 2.027 *** | 1.917 *** | 1.348 *** | 1.805 *** | −0.114 | −0.035 | 0.397 *** | 0.296 *** | 0.153 | −0.996 *** | 0.768 ** | 0.152 | −0.456 | 2.138 *** | 5.062 *** | 3.656 *** | 0.920 *** | 2.454 *** | 0.966 | 2.569 *** | 0.883 | 0.526 | 3.430 * | 9.530 * | −0.302 ** | −0.217 ** | 0.438 * | 0.265 ** |
| −18.96 | −15.94 | −6.85 | −18.81 | −11.96 | −6.25 | (−0.99) | −6.01 | −7.68 | −8.37 | −4.79 | −13.04 | (−0.72) | (−0.64) | −4.11 | −5.23 | −1.41 | (−5.52) | −2.14 | −1.07 | (−0.51) | −4.05 | −8.05 | −11.65 | −17.33 | −3.16 | −1.09 | −5.39 | −1.24 | −1.49 | −1.79 | −1.81 | (−3.08) | (−2.51) | −1.81 | −2.56 | |
| N | 4047 | 26,489 | 40,781 | 71,323 | 80 | 763 | 986 | 1829 | 294 | 1732 | 3087 | 5113 | 654 | 4202 | 7501 | 12359 | 379 | 1790 | 3159 | 5329 | 90 | 797 | 1152 | 2039 | 35 | 109 | 342 | 487 | 38 | 155 | 172 | 365 | 488 | 3196 | 4320 | 8004 |
| R2 | 0.781 | 0.627 | 0.723 | 0.682 | 0.984 | 0.918 | 0.812 | 0.865 | 0.7 | 0.598 | 0.762 | 0.703 | 0.855 | 0.53 | 0.684 | 0.622 | 0.781 | 0.709 | 0.742 | 0.703 | 0.95 | 0.853 | 0.855 | 0.845 | 0.985 | 0.813 | 0.569 | 0.809 | 0.992 | 0.757 | 0.627 | 0.727 | 0.739 | 0.58 | 0.723 | 0.617 |
Notes: t statistics in parentheses. * p < 0.10, ** p < 0.05, *** p < 0.01. Source: Authors’ calculation.
References
- Chinazzi, M.; Davis, J.T.; Ajelli, M.; Gioannini, C.; Litvinova, M.; Merler, S.; Piontti, A.P.Y.; Mu, K.; Rossi, L.; Sun, K. The effect of travel restrictions on the spread of the 2019 novel coronavirus (COVID-19) outbreak. Science 2020, 368, 395–400. [Google Scholar] [CrossRef] [PubMed] [Green Version]
- Kraemer, M.U.G.; Yang, C.-H.; Gutierrez, B.; Wu, C.-H.; Klein, B.; Pigott, D.M.; Open Covid-19 Data Working Group; du Plessis, L.; Faria, N.R.; Li, R.; et al. The effect of human mobility and control measures on the COVID-19 epidemic in China. Science 2020, 368, 493–497. [Google Scholar] [CrossRef] [Green Version]
- Maier, B.F.; Brockmann, D. Effective containment explains subexponential growth in recent confirmed COVID-19 cases in China. Science 2020, 368, 742–746. [Google Scholar] [CrossRef] [PubMed] [Green Version]
- NBSC (National Bureau of Statistics of China). Statistical Bulletin of National Economic and Social Development (2021). Available online: http://www.stats.gov.cn/tjsj/zxfb/202102/t20210227_1814154.html (accessed on 8 December 2021).
- Chen, Z.; Rose, A.Z.; Prager, F.; Chatterjee, S. Economic consequences of aviation system disruptions: A reduced-form computable general equilibrium analysis. Transp. Res. Part A Policy Pract. 2017, 95, 207–226. [Google Scholar] [CrossRef]
- Ueda, T.; Koike, A.; Iwakami, K. Economic damage assessment of catastrophe in high speed rail network. In Proceedings of the 1st workshop for “Comparative Study on Urban Earthquake Disaster Management”, Kobe, Japan, 18–19 January 2001; pp. 13–19. [Google Scholar]
- Nicola, M.; Alsafi, Z.; Sohrabi, C.; Kerwan, A.; Al-Jabir, A.; Iosifidis, C.; Agha, M.; Agha, R. The socio-economic implications of the coronavirus pandemic (COVID-19): A review. Int. J. Surg. 2020, 78, 185–193. [Google Scholar] [CrossRef] [PubMed]
- Czerny, A.I.; Fu, X.; Lei, Z.; Oum, T.H. Post pandemic aviation market recovery: Experience and lessons from China. J. Air Transp. Manag. 2021, 90, 101971. [Google Scholar] [CrossRef]
- Albalate, D.; Bel, G.; Fageda, X. Competition and cooperation between high-speed rail and air transportation services in Europe. J. Transp. Geogr. 2015, 42, 166–174. [Google Scholar] [CrossRef]
- Cox, A.; Prager, F.; Rose, A. Transportation security and the role of resilience: A foundation for operational metrics. Transp. Policy 2011, 18, 307–317. [Google Scholar] [CrossRef]
- Clewlow, R.R.L.; Sussman, J.M.; Balakrishnan, H. Interaction of high-speed rail and aviation: Exploring air–rail connectivity. Transp. Res. Rec. 2012, 2266, 1–10. [Google Scholar] [CrossRef]
- Chen, Z.; Wang, Y. Impacts of severe weather events on high-speed rail and aviation delays. Transp. Res. Part D Transp. Environ. 2019, 69, 168–183. [Google Scholar] [CrossRef]
- Givoni, M.; Dobruszkes, F.; Lugo, I. Uncovering the Real Potential for Air–Rail Substitution: An Exploratory Analysis. In Energy, Transport, & the Environment: Addressing the Sustainable Mobility Paradigm; Inderwildi, O., King, S.D., Eds.; Springer: London, UK, 2012; pp. 495–512. [Google Scholar] [CrossRef]
- Yang, H.; Dobruszkes, F.; Wang, J.; Dijst, M.; Witte, P. Comparing China’s urban systems in high-speed railway and airline networks. J. Transp. Geogr. 2018, 68, 233–244. [Google Scholar] [CrossRef]
- Zhou, L.; Chen, Z. Measuring the performance of airport resilience to severe weather events. Transp. Res. Part D Transp. Environ. 2020, 83, 102362. [Google Scholar] [CrossRef]
- Goswami, M.; De, A.; Habibi, M.K.K.; Daultani, Y. Examining freight performance of third-party logistics providers within the automotive industry in India: An environmental sustainability perspective. Int. J. Prod. Res. 2020, 58, 7565–7592. [Google Scholar] [CrossRef]
- Lau, H.; Khosrawipour, V.; Kocbach, P.; Mikolajczyk, A.; Ichii, H.; Zacharski, M.; Bania, J.; Khosrawipour, T. The association between international and domestic air traffic and the coronavirus (COVID-19) outbreak. J. Microbiol. Immunol. Infect. 2020, 53, 467–472. [Google Scholar] [CrossRef]
- Lau, H.; Khosrawipour, V.; Kocbach, P.; Mikolajczyk, A.; Schubert, J.; Bania, J.; Khosrawipour, T. The positive impact of lockdown in Wuhan on containing the COVID-19 outbreak in China. J. Travel Med. 2020, 27, taaa037. [Google Scholar] [CrossRef] [Green Version]
- Li, T.; Rong, L.; Zhang, A. Assessing regional risk of COVID-19 infection from Wuhan via high-speed rail. Transp. Policy 2021, 106, 226–238. [Google Scholar] [CrossRef]
- Musselwhite, C.; Avineri, E.; Susilo, Y. Editorial JTH 16 —The Coronavirus Disease COVID-19 and implications for transport and health. J. Transp. Health 2020, 16, 100853. [Google Scholar] [CrossRef]
- Wu, J.T.; Leung, K.; Leung, G.M. Nowcasting and forecasting the potential domestic and international spread of the 2019-nCoV outbreak originating in Wuhan, China: A modelling study. Lancet 2020, 395, 689–697. [Google Scholar] [CrossRef] [Green Version]
- Zhang, Y.; Zhang, A.; Wang, J. Exploring the roles of high-speed train, air and coach services in the spread of COVID-19 in China. Transp. Policy 2020, 94, 34–42. [Google Scholar] [CrossRef]
- Nižetić, S. Impact of coronavirus (COVID-19) pandemic on air transport mobility, energy, and environment: A case study. Int. J. Energy Res. 2020, 44, 10953–10961. [Google Scholar] [CrossRef]
- Tardivo, A.; Martín, C.S.; Zanuy, A.C. Covid-19 impact in Transport, an essay from the Railways’ system research perspective. Pract. Pipeline 2020, in press. [Google Scholar] [CrossRef]
- Chen, Z.; Haynes, E.K.; Zhou, Y.; Dai, Z. High Speed Rail and China’s New Economic Geography: Impact Assessment from the Regional Science Perspective; Edward Elgar: Cheltenham, UK, 2019. [Google Scholar]
- Hu, M.; Lin, H.; Wang, J.; Xu, C.; Tatem, A.J.; Meng, B.; Zhang, X.; Liu, Y.; Wang, P.; Wu, G. Risk of coronavirus disease 2019 transmission in train passengers: An epidemiological and modeling study. Clin. Infect. Dis. 2021, 72, 604–610. [Google Scholar] [CrossRef]
- Spiekermann, K.; Wegener, M. The Shrinking Continent: New Time—Space Maps of Europe. Environ. Plan. B Plan. Des. 1994, 21, 653–673. [Google Scholar] [CrossRef]
- Li, H.; Strauss, J.; Lu, L. The impact of high-speed rail on civil aviation in China. Transp. Policy 2019, 74, 187–200. [Google Scholar] [CrossRef]
- Li, H.; Wang, K.; Yu, K.; Zhang, A. Are conventional train passengers underserved after entry of high-speed rail? Evidence from Chinese intercity markets. Transp. Policy 2020, 95, 1–9. [Google Scholar] [CrossRef]
- Wang, J.; Du, D.; Huang, J. Inter-city connections in China: High-speed train vs. inter-city coach. J. Transp. Geogr. 2020, 82, 102–619. [Google Scholar] [CrossRef]
- Aloi, A.; Alonso, B.; Benavente, J.; Cordera, R.; Echániz, E.; González, F.; Ladisa, C.; Lezama-Romanelli, R.; López-Parra, Á.; Mazzei, V.; et al. Effects of the COVID-19 lockdown on urban mobility: Empirical evidence from the city of Santander (Spain). Sustainability 2020, 12, 3870. [Google Scholar] [CrossRef]
- Arellana, J.; Márquez, L.; Cantillo, V. COVID-19 outbreak in Colombia: An analysis of its impacts on transport systems. J. Adv. Transp. 2020, 2020, 8867316. [Google Scholar] [CrossRef]
- Huang, J.; Wang, H.; Fan, M.; Zhuo, A.; Sun, Y.; Li, Y. Understanding the Impact of the COVID-19 pandemic on transportation-related behaviors with human mobility data. In Proceedings of the 26th ACM SIGKDD International Conference on Knowledge Discovery & Data Mining, Virtual, 6–10 July 2020; pp. 3443–3450. [Google Scholar] [CrossRef]
- Sun, X.; Wandelt, S.; Zhang, A. How did COVID-19 impact air transportation? A first peek through the lens of complex networks. J. Air Transp. Manag. 2020, 89, 101928. [Google Scholar] [CrossRef]
- Loske, D. The impact of COVID-19 on transport volume and freight capacity dynamics: An empirical analysis in German food retail logistics. Transp. Res. Interdiscip. Perspect. 2020, 6, 100165. [Google Scholar] [CrossRef] [PubMed]
- Chen, Z. Impacts of high-speed rail on domestic air transportation in China. J. Transp. Geogr. 2017, 62, 184–196. [Google Scholar] [CrossRef] [PubMed]
- Liu, S.; Wan, Y.; Ha, H.-K.; Yoshida, Y.; Zhang, A. Impact of high-speed rail network development on airport traffic and traffic distribution: Evidence from China and Japan. Transp. Res. Part A Policy Pract. 2019, 127, 115–135. [Google Scholar] [CrossRef]
- Zhang, Q.; Yang, H.; Wang, Q. Impact of high-speed rail on China’s Big Three airlines. Transp. Res. Part A Policy Pract. 2017, 98, 77–85. [Google Scholar] [CrossRef]
- Givoni, M.; Banister, D. Airline and railway integration. Transp. Policy 2006, 13, 386–397. [Google Scholar] [CrossRef]
- Behrens, C.; Pels, E. Intermodal competition in the London–Paris passenger market: High-speed rail and air transport. J. Urban Econ. 2012, 71, 278–288. [Google Scholar] [CrossRef] [Green Version]
- Castillo-Manzano, J.I.; Pozo-Barajas, R.; Trapero, J.R. Measuring the substitution effects between High Speed Rail and air transport in Spain. J. Transp. Geogr. 2015, 43, 59–65. [Google Scholar] [CrossRef]
- Román, C.; Espino, R.; Martín, J.C. Analyzing competition between the high speed train and alternative modes. the case of the Madrid-Zaragoza-Barcelona Corridor. J. Choice Model. 2010, 3, 84–108. [Google Scholar] [CrossRef] [Green Version]
- Park, Y.; Ha, H.-K. Analysis of the impact of high-speed railroad service on air transport demand. Transp. Res. Part E Logist. Transp. Rev. 2006, 42, 95–104. [Google Scholar] [CrossRef]
- Jiang, C.; Zhang, A. Effects of high-speed rail and airline cooperation under hub airport capacity constraint. Transp. Res. Part B Methodol. 2014, 60, 33–49. [Google Scholar] [CrossRef]
- Yao, E.; Morikawa, T.A. Study of on integrated intercity travel demand model. Transp. Res. Part A Policy Pract. 2005, 39, 367–381. [Google Scholar] [CrossRef]
- Gu, H.; Wan, Y. Can entry of high-speed rail increase air traffic? Price competition, travel time difference and catchment expansion. Transp. Policy 2020, 97, 55–72. [Google Scholar] [CrossRef]
- Browne, A.; St-Onge Ahmad, S.; Beck, C.R.; Nguyen-Van-Tam, J.S. The roles of transportation and transportation hubs in the propagation of influenza and coronaviruses: A systematic review. J. Travel Med. 2016, 23, tav002. [Google Scholar] [CrossRef] [PubMed] [Green Version]
- Chen, Z.; Rose, A. Economic resilience to transportation failure: A computable general equilibrium analysis. Transportation 2018, 45, 1009–1027. [Google Scholar] [CrossRef]
- Chen, Z.; Yu, M.; Wang, Y.; Zhou, L. The effect of the synchronized multi-dimensional policies on imported COVID-19 curtailment in China. PLoS ONE 2021, 16, e0252224. [Google Scholar] [CrossRef] [PubMed]
- Yu, M.; Chen, Z. The effect of aviation responses to the control of imported COVID-19 cases. J. Air Transp. Manag. 2021, 97, 102140. [Google Scholar] [CrossRef]
Figure 1.
Cities included in the assessment. Notes: POP is short for the population. POP > 10 means the population of a city is more than 10 million. Source: Authors’ calculation.
Figure 1.
Cities included in the assessment. Notes: POP is short for the population. POP > 10 means the population of a city is more than 10 million. Source: Authors’ calculation.

Figure 2.
Distribution of the daily frequency of HSR and aviation among different samples.

Figure 3.
The variations of service share of HSR and aviation among different samples.

Table 1.
Summary of the relevant literature examining the HSR and aviation performance.
| Paper | Unexpected Events | Data | Method | Results |
|---|---|---|---|---|
| [46] | No | Route-level performance data | Multivariate econometric regression | Air traffic volume tends to increase after the HSR enters when the HSR travel time is more than 5 h longer than the air travel time. Otherwise, air traffic tends to decrease. |
| [22] | Yes | Weekly frequency from Wuhan to each city in 2018 and 2019 | Multivariate econometric regression | COVID-19 confirmed cases have a negative impact on the performance of HSR and aviation transport. |
| [15] | Yes | Route-level performance data | Multivariate econometric regression | The recovery speed of air service was found to be 22.9% faster if HSR service was available in the city. |
| [12] | Yes | Route-level record data | Multivariate econometric regression | Weather conditions do have a significant impact on the performance of HSR and aviation transport. |
| [37] | No | Route-level panel data, 2007–2015 | Multivariate econometric regression | The existence of HSR service has both negative and positive impacts on aviation transport. |
| [36] | No | Flight frequencies and seat capacities, 2001–2014 | Multivariate econometric regression | The existence of HSR service has a strong negative impact on aviation transport demand. |
| [38] | No | Quarterly route level panel data, 2010–2013 | Multivariate econometric regression | The introduction of HSR has a strong negative impact on aviation transport demand. |
| [9] | No | Flight frequencies, 2002–2010; flight seat, 2002–2009 | Multivariate econometric regression | HSR service has a negative impact on aviation transport (seat reductions). |
| [11] | No | Route-level cross-sectional data, May and June 2011 | Multiple-case design | The existence of HSR service has both negative and positive impacts on aviation transport. |
| [10] | Yes | Passenger journey data, 2005 | Time-series analysis | After the terrorist attacks, much of the decline in passenger traffic was offset by an increase in complementary modes of transport. |
Source: Authors’ calculation.
Table 2.
Descriptive statistics of the key variables.
| Variable | Note | Mean | Std. Dev. | Min. | Max. |
|---|---|---|---|---|---|
| percent | The share of HSR service frequency (num_trains/(num_trains + num_flights)) | 0.52 | 0.24 | 0.02 | 0.99 |
| lock_d | Lockdown in Wuhan as the arrival city | 0.00 | 0.02 | 0.00 | 1.00 |
| kcase_o * | Daily COVID-19 confirmed cases in a departure city | 0.00 | 0.01 | −0.06 | 1.92 |
| kcase_d * | Daily COVID-19 confirmed cases in an arrival city | 0.00 | 0.01 | −0.06 | 0.89 |
| ktemp_o * | Average temperature in a departure city | 0.02 | 0.01 | −0.02 | 0.03 |
| ktemp_d * | Average temperature in an arrival city | 0.02 | 0.01 | −0.02 | 0.03 |
| ktemp2_o * | The square of average temperature in a departure city | 0.38 | 0.28 | 0.00 | 1.09 |
| ktemp2_d * | The square of average temperature in an arrival city | 0.38 | 0.28 | 0.00 | 1.09 |
| snow_o | Snow in a departure city | 0.01 | 0.09 | 0.00 | 1.00 |
| snow_d | Snow in an arrival city | 0.01 | 0.09 | 0.00 | 1.00 |
| rain_o | Rain in a departure city | 0.15 | 0.36 | 0.00 | 1.00 |
| rain_d | Rain in an arrival city | 0.15 | 0.36 | 0.00 | 1.00 |
| diskkm | Distance between a city pair (1000km) | 1.03 | 0.38 | 0.09 | 2.01 |
| num_trains | Number of daily trains between a city pair | 5.92 | 11.12 | 1.00 | 193.00 |
| num_flights | Number of daily flights between a city pair | 4.01 | 4.74 | 1.00 | 57.00 |
| restrictions | Travel restrictions among all cities | 0.23 | 0.42 | 0.00 | 1.00 |
| phase1 | Time period before the lockdown of Wuhan (15 January–22 January 2020) | 0.06 | 0.23 | 0.00 | 1.00 |
| phase2 | Time period during the lockdown of Wuhan (23 January–7 April 2020) | 0.37 | 0.48 | 0.00 | 1.00 |
| phase3 | Time period after the lockdown of Wuhan (8 April–30 June 2020) | 0.57 | 0.49 | 0.00 | 1.00 |
| springfes | Spring Festival (24 January–2 February 2020) | 0.06 | 0.24 | 0.00 | 1.00 |
| tombsw | Tomb Sweeping Festival (4–6 April 2020) | 0.01 | 0.10 | 0.00 | 1.00 |
| workersday | International Worker’s Day (1–5 May 2020) | 0.03 | 0.18 | 0.00 | 1.00 |
Notes: 1. * represents that the variable is divided by 1000 to create a more easily comprehensible presentation of the estimated coefficients. 2. The minimum value of confirmed cases is negative is because of correction. It means subtracting some number of cases that was previously counted. For the variables of the confirmed case, 1 represents 1000 cases. Source: Authors’ calculation.
Table 3.
Regression results of the HDFE model (based on the share of HSR service frequency in each corridor).
Table 3.
Regression results of the HDFE model (based on the share of HSR service frequency in each corridor).
| Variable | Model 1 | Model 2 | Model 3 | Model 4 | Model 5 | Model 6 | Model 7 | Model 8 | Model 9 |
|---|---|---|---|---|---|---|---|---|---|
| All | POP > 10 | POP 5–10 | POP 1–5 | Ctr_sth | Southwest | North | Northeast | East | |
| lock_d | −0.075 * | −0.196 ** | −0.117 *** | ||||||
| (−1.71) | (−2.57) | (−5.81) | |||||||
| kcase_o | −0.053 | 0.759 * | −0.167 | −0.487 | −0.063 | 4.725 *** | −0.006 | 4.001 | −1.180 *** |
| (−0.44) | (1.88) | (−1.39) | (−0.64) | (−0.94) | (3.56) | (−0.01) | (0.41) | (−2.97) | |
| kcase_d | −0.092 | 0.993 ** | −0.500 | 0.014 | −0.649 | 1.943 * | 0.068 | 9.566 | −1.077 *** |
| (−0.38) | (2.56) | (−1.02) | (0.01) | (−1.37) | (1.74) | (0.13) | (1.47) | (−2.88) | |
| ktemp_o | 2.725 *** | 0.483 | 1.729 | 1.742 *** | 7.479 *** | −4.716 | 5.456 | −9.985 *** | 5.344 *** |
| (8.39) | (0.26) | (1.00) | (4.19) | (8.61) | (−1.14) | (1.44) | (−4.17) | (6.50) | |
| ktemp_d | 2.732 *** | 3.386 * | 1.480 | 1.281 *** | 5.958 *** | 7.549 * | 6.229 * | −12.633 *** | −0.832 |
| (7.81) | (1.79) | (0.92) | (2.67) | (6.47) | (1.70) | (1.79) | (−5.92) | (−1.26) | |
| ktemp2_o | −0.076 *** | −0.014 | −0.032 | −0.051 *** | −0.141 *** | 0.163 | −0.042 | 0.103 | −0.144 *** |
| (−8.43) | (−0.31) | (−0.81) | (−4.19) | (−5.62) | (1.37) | (−0.54) | (0.86) | (−6.98) | |
| ktemp2_d | −0.071 *** | −0.085 * | −0.040 | 0.006 | −0.114 *** | −0.113 | −0.080 | 0.254 ** | 0.017 |
| (−7.22) | (−1.77) | (−1.05) | (0.48) | (−4.76) | (−0.92) | (−1.06) | (2.27) | (0.95) | |
| snow_o | −0.002 | 0.007 | −0.011 | 0.014 | 0.066 *** | 0.034 | −0.065 | 0.007 | 0.001 |
| (−0.17) | (0.46) | (−0.26) | (0.86) | (6.99) | (0.71) | (−1.22) | (0.21) | (0.02) | |
| snow_d | 0.001 | 0.035 * | 0.001 | 0.017 | 0.061 *** | −0.063 ** | 0.012 | 0.011 | −0.029 |
| (0.09) | (1.81) | (0.03) | (0.91) | (5.56) | (−2.52) | (0.19) | (0.36) | (−1.24) | |
| rain_o | 0.002 | 0.013 ** | 0.004 | −0.002 | 0.008 * | −0.014 | 0.030 *** | 0.012 | 0.004 |
| (1.24) | (2.42) | (0.88) | (−0.59) | (1.89) | (−1.63) | (2.63) | (0.34) | (1.15) | |
| rain_d | −0.001 | 0.011 ** | 0.004 | −0.001 | 0.001 | −0.006 | 0.017 | 0.017 | 0.001 |
| (−0.31) | (2.11) | (0.82) | (−0.24) | (0.24) | (−0.63) | (1.59) | (0.51) | (0.33) | |
| diskkm | −0.365 *** | −0.822 *** | −0.819 *** | −0.293 *** | −0.298 *** | 1.015 *** | 2.576 *** | −0.532 *** | |
| (−173.00) | (−65.09) | (−69.16) | (−67.36) | (−9.31) | (20.40) | (3.47) | (−41.52) | ||
| restrictions | 0.050 *** | 0.052 *** | 0.039 ** | 0.043 *** | 0.062 *** | 0.000 | 0.158 *** | −0.006 | |
| (10.47) | (6.26) | (2.08) | (6.70) | (5.80) | (0.01) | (12.34) | (−0.54) | ||
| constant | 0.847 *** | 1.288 *** | 1.319 *** | 0.810 *** | 0.710 *** | 0.081 | 0.488 *** | −1.703 ** | 1.007 *** |
| (97.08) | (37.39) | (40.28) | (74.04) | (22.47) | (1.06) | (6.05) | (−2.46) | (47.19) | |
| N | 71,323 | 1829 | 5113 | 12,359 | 5329 | 2039 | 487 | 365 | 8004 |
| R2 | 0.496 | 0.937 | 0.655 | 0.654 | 0.732 | 0.806 | 0.950 | 0.899 | 0.598 |
Notes: 1. t statistics in parentheses. 2. * p < 0.10, ** p < 0.05, *** p < 0.01. 3. POP is short for the population. POP > 10 means the population of a city is more than 10 million. Ctr_sth is short for central south. 4. Other factors, including the dummy variables representing different stages of the pandemic and the major holidays, are excluded in the results because they are automatically removed from the HDFE model, given these factors did not change among different city pairs. Source: Authors’ calculation.
Table 4.
Estimated elasticity of modal frequency adjustment between HSR and aviation.
| Model | Phase 1 | Model ID | Phase 2 | Model ID | Phase 3 | Model ID | All | Model ID |
|---|---|---|---|---|---|---|---|---|
| All | −0.165 *** | 28 | −0.078 *** | 29 | −0.115 *** | 31 | −0.104 *** | 31 |
| (−66.28) | (−13.86) | (−37.71) | (−35.82) | |||||
| Pop 10 | −0.026 | 32 | −0.098 | 33 | −0.018 | 34 | 0.056 *** | 35 |
| (−0.32) | (−0.64) | (−1.13) | (3.20) | |||||
| Pop 5–10 | −0.389 *** | 36 | −0.191 *** | 37 | −0.376 *** | 38 | −0.314 *** | 39 |
| (−10.95) | (−8.54) | (−24.97) | (−23.21) | |||||
| Pop 1–5 | 0.099 *** | 40 | 0.051 *** | 41 | −0.021 * | 42 | 0.003 | 43 |
| (4.18) | (4.19) | (−1.93) | (0.33) | |||||
| Central-south | 0.098 *** | 44 | −0.023 | 45 | 0.139 *** | 46 | 0.080 *** | 47 |
| (5.74) | (−1.02) | (6.79) | (6.04) | |||||
| Southwest | −0.131 | 48 | 0.463 *** | 49 | −0.528 *** | 50 | −0.187 ** | 51 |
| (−0.34) | (4.17) | (−2.89) | (−2.51) | |||||
| North | 52 | −0.657 *** | 53 | −0.118 | 54 | −0.239 ** | 55 | |
| (−4.20) | (−0.87) | (−2.11) | ||||||
| Northeast | 56 | −0.110 | 57 | 0.057 | 58 | 1.006 ** | 59 | |
| (−0.26) | (0.23) | (2.01) | ||||||
| East | −0.199 *** | 60 | −0.080 *** | 61 | −0.315 *** | 62 | −0.148 *** | 63 |
| (−14.47) | (−7.74) | (−10.68) | (−13.74) |
Notes: 1. t statistics in parentheses. 2. * p < 0.10, ** p < 0.05, *** p < 0.01. 3. POP is short for the population. POP > 10 means the population of a city is more than 10 million. 4. The model “All” represents the 97 cities across the nation. 5. Phase 1: 15 January–22 January 2020, Phase 2: 23 January–7 April 2020, and Phase 3: 8 April–30 June 2020. Source: Authors’ calculation.
Publisher’s Note: MDPI stays neutral with regard to jurisdictional claims in published maps and institutional affiliations. |
© 2022 by the authors. Licensee MDPI, Basel, Switzerland. This article is an open access article distributed under the terms and conditions of the Creative Commons Attribution (CC BY) license (https://creativecommons.org/licenses/by/4.0/).
Share and Cite
MDPI and ACS Style
Yang, S.; Chen, Z. The Impact of COVID-19 on High-Speed Rail and Aviation Operations. Sustainability 2022, 14, 1683. https://doi.org/10.3390/su14031683
AMA Style
Yang S, Chen Z. The Impact of COVID-19 on High-Speed Rail and Aviation Operations. Sustainability. 2022; 14(3):1683. https://doi.org/10.3390/su14031683
Chicago/Turabian StyleYang, Shan, and Zhenhua Chen. 2022. "The Impact of COVID-19 on High-Speed Rail and Aviation Operations" Sustainability 14, no. 3: 1683. https://doi.org/10.3390/su14031683
Note that from the first issue of 2016, this journal uses article numbers instead of page numbers. See further details here.