Article

Identifying and Characterizing the Propagation Scale of COVID-19 Situational Information on Twitter: A Hybrid Text Analytic Approach

1
School of Information Engineering, Zhengzhou University, Zhengzhou 450001, China
2
School of Software, Zhengzhou University, Zhengzhou 450001, China
*
Authors to whom correspondence should be addressed.
Appl. Sci. 2021, 11(14), 6526; https://doi.org/10.3390/app11146526
Submission received: 31 May 2021 / Revised: 1 July 2021 / Accepted: 8 July 2021 / Published: 15 July 2021
(This article belongs to the Section Computing and Artificial Intelligence)

Abstract

:
During the recent pandemic of COVID-19, an increasing amount of information has been propagated on social media. This situational information is valuable for public authorities. Therefore, this study characterized the propagation scale of situational information types by harnessing the power of natural language processing techniques and machine learning algorithms. We observed that the length of the post has a positive correlation with type 1 information (announcements), and negative words were mostly used in type 5 information (criticizing the government), whereas anxiety-related words have a negative effect on the amount of retweeted type 0 (precautions) and type 2 (donations) information. This type of research study not only contributes to the situational information literature by comprehensively defining categories but also provides data-oriented practical insights into information so that management authorities can formulate response strategies after the pandemic. Our approach is one of its kind and combines Twitter content features, user features and LIWC linguistic features with machine learning algorithms to analyze the propagation scale of situational information, and it achieved 77% accuracy with SVM while classifying the information categories.

1. Introduction

Machine learning (ML) has been proven to be an important field of study recently as it is able to find solutions to many real-world problems in the context of healthcare, autonomous vehicles, natural language processing, data-oriented applications, climate forecasting, social computing, image processing and crisis data modeling. Such as in healthcare domain; the authors of [1] applied utilized machine learning to track, monitor and analyze human behavior patterns of daily routine activities. In the field of natural language processing, researchers in [2] leveraged machine learning algorithms using text and emoticon features for accurate sentiment analysis of Twitter data. In the context of autonomous vehicles, researchers in [3] present an automated machine learning model for risk prediction used in decision making for autonomous vehicles, their model consists of clustering, XGboost feature engineering and an bayesian optimization algorithm. In image processing, image classification is one of the important aspects; in a research study, [4], they used an SVM algorithm with a radial basis function kernel to classify images for breast cancer diagnosis. Crises such as COVID-19 have been a hot topic for researchers recently; a study [3] forecasts COVID-19 in terms of upcoming cases, deaths, and recoveries. They used SVM and linear regression algorithms to forecast these factors. In forecasting climate perspective, a study presents a conjunction model for daily precipitation forecasting; their conjunction model combines a discrete wavelet transform and SVM algorithm [5] to forecast daily precipitation in Turkey. During emergency situations such as the COVID-19 pandemic, people look for real time and fast information; therefore, they tend to use modern world communication platforms such as social media to obtain information [6]. They want real-time situational information through social media about the crisis going on, so they learn about the situation and obtain information about what steps the government is taking in response to the crisis. In the social computing perspective, on social networks, there is a lot of information of different nature such as public opinion, breaking news about any events or disasters, public health-related information and also situation-related information which assist the authorities to understand the situation and find out ways to solve and fulfil public needs [7,8]. Researchers in [9] developed a framework to extract and analyze the public sentiments for different events on the basis of various type of communities. The situation-related information includes information about certain situations such as health announcements, donations, help needed etc. [10,11]. To detect these types of situational information and determine their propagation scale can help the relevant government authorities to assist them in decision making in response to COVID-19. By identifying these types of situational information and determining their propagation scale, relevant authorities and agencies can sense the public sentiments and take proper action on that [12].
There is no such proper agreement on situational information definition; some researchers such as in [13] they defined it as help-seeking, some identified it as emotional support but they ignore the other aspects of information like public criticism that implies the public concern and emotional support that is related to empathy for affected people, because the public gives an opinion in forms of criticism whether it be positive or negative, and also public gives opinion related to empathy by showing emotional support for others [14]. Therefore, it is important to properly define the situation-related information. For example, information about criticism can assist the relevant authorities to respond quickly by analyzing the public sentiments about the situation. Emotional support-type information could assist them to understand the social media users’ usage and take advantage of social services such as voluntary services by social media users [15]. By identifying the donation-related information, they can analyze what (non-government organizations) NGOs or voluntary services agencies are going to give in donations for COVID-19-affected people, they can then manage their funds and also assist them in properly distributing the donations to persons in need because governments and concerned authorities have a record of accurate information about affected people. Moreover, it is very important to detect and predict the key features that can analyze the propagation scale of different types of situational information. For example, researchers in [16] have stated that the content emotions affect the propagation scale of information. In this way, it would help the authorities to publish the information according to the need for information of the public. To fill these research gaps, this research aims to answer the following research questions:
1.
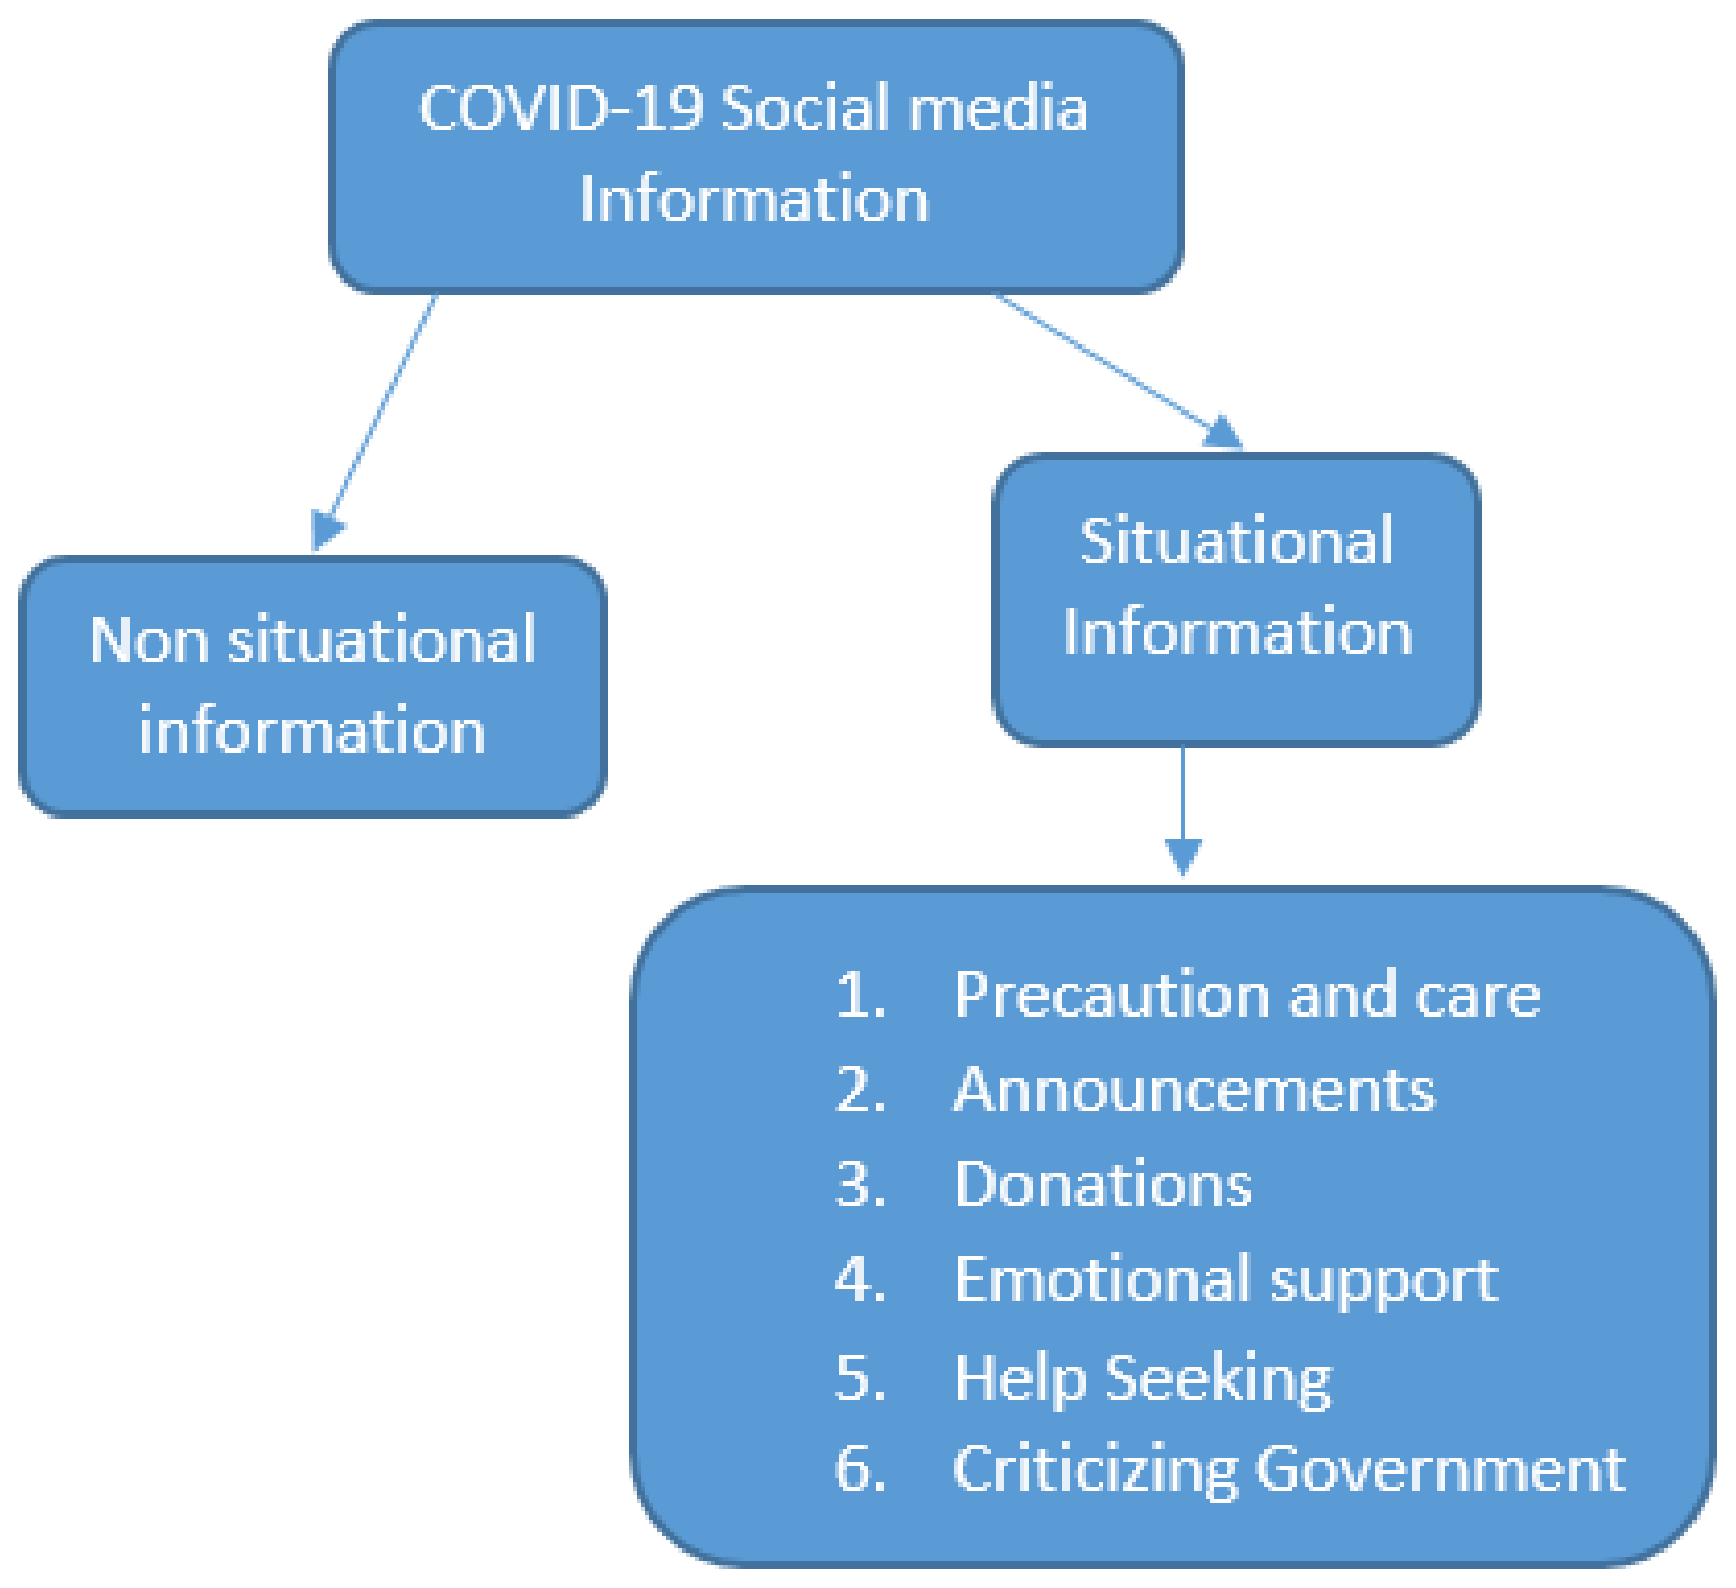
RQ1. How to identify and classify the situational information on Twitter?
2.
RQ2. What will be the features with which to predict the propagation scale of these types of information and what will be the predictability nature of those features?
3.
RQ3. How the results of the propagation scale of situational information can assist the relevant authorities in decision making?
To address these research questions, we proposed a framework that classified COVID-19-related discussions on Twitter, identified situational information and characterized the propagation scale by combining content-related, user-related and linguistic inquiry and word count (LIWC) features leveraging machine learning algorithms and natural language processing techniques on datasets and contexts from the US as it was the most hit country by COVID-19 in terms of cases in the American continent region, currently (https://covid.cdc.gov/covid-data-tracker (accessed on 20 April 2020)). The framework was mainly based on natural language processing techniques by incorporating a set of features along with machine learning algorithms. This research study makes following contributions:
1.
The dataset is collected and the situational information identified from COVID-19 Twitter data.
2.
A novel framework is proposed combining machine learning and LIWC lexicon to characterize the propagation scale of situational information.
3.
Each and every aspect of the framework is analyzed with different evaluations of the information scale in the Results and Discussion section.
The rest of the paper is organized as follows: Section 2 contains related work, Section 3 contains the proposed framework with details. In Section 4, characterization of the propagation scale of situational information is presented, Section 5 contains discussion, Section 6 contains the implications of the research study and the end Section 7 contains conclusions and future work.

2. Related Work

2.1. Social Media in Situational Information

Twitter is a well established source from which we can obtain real time information during crisis events [17]. Its messages are called blog posts or tweets containing 140 characters (now 280). Search parameters are used to find information in all posts (tweets). By incorporating Twitter data or Twitter streams into various research studies, researchers can produce various important public health information that can be used to analyze health predictions and trends. By allowing researchers to depend on user-generated information, researchers can detect and identify different online trends [18]. This type of information can be helpful in various ways, such as understanding the emotions of the public by identifying the tweets’ sentiments during disasters; posts are classified in various ways, such as researchers classifying the sentiments of tweets during disasters through bayesian networks [19]. Situational information is generated and disseminated rapidly by users on social media. People make use of social media to give an opinion on something happening currently that is regarded as a hot trend in social media terms. As far as crises are concerned, during these helpful and situation-related information is disseminated by social media users in any form [10,11].
Different authors categorized situational information from different points of view. For example, ref. [13] defined situational information as information that gives notification of the cases, casualties or victims of disasters or voluntary work, and categorized sympathizing with the victims, acknowledging voluntary work, providing relief packages, or donations into non situational information. However, in the study by [20], they classified the tweets’ information by relevancy as relevant or non-relevant posts during disasters by applying the random forest algorithm for relevance classification; they called their approach contextual relevance classification of social media posts during crises or emergency situations. Tweets sometimes carry no hash-tags that are sometimes considered to be human labels, and most of the time fail to use the relevant keywords (e.g., COVID-19, “coronavirus”, ”COVID”, etc.). So, in spite of related work on the situational information topic, we doubt that the current work or results are affected by complete absence of critical content of the context of interest (we are not implying that information is not present, we are just implying here that it is hard to detect this type of information in the first place) [21]. Situational information on social media makes it easy for decision-making authorities to prioritize, invest in and deploy supplies (food, water, and donations), services (emergency health cares, medical aid), and rapid response to emergencies like the COVID-19 Pandemic.
To act in response to this type of situational information requires obtaining the details about affected areas, the number of cases (in COVID-19 context), and hospital capacities with the aim of creating an accurate representation of the situational information in specified areas in which it happened. This high level information is called situational awareness information [21]. Some researchers categorized this information into seven categories such as precautions/advice, casualties and damage, donations of money, goods, or services, people missing, found, or seen, and information sources [22]. In one study [11], they categorized 10 types of situational information such as voluntary work, information about the disaster, updates about the situation, criticizing, counter rumours, offers of help, sympathy with victims, donations, self support and preparations.
Based on the views of the authors of [23], “the text that contains the trending topics during the disaster time and right after the disaster time, that means the trending topic on Twitter during the disaster, classified as situational information, because it gives relevancy about the current event that is going on”.
Based on definitions given by researchers in [8,15], we categorized six types of COVID-19-related situational information on Twitter and any other information was considered non situational information. The categories were: (1) caution and advice (2) notifications or measures that have been taken (3) donations (4) emotional support (5) help-seeking (6) criticizing the government or government agencies. Figure 1 presents the types of content of situational and non situational information (information that does not fall into any of the six situational information categories).
When we go into further detail, caution and advice information notifies the public about precautions on how to make yourself safe from the virus; it also includes information about emergency aid and care that are necessary during COVID-19. Notifications and measures include notifications about damages like the number of people/person with COVID-19, recovered persons, hospital capacities. This type of information helps the public learn the situation and help others ease anxiety created by false information and from not having enough information. When we talk about donations information it means offering help whether in form of money or goods and services voluntarily as well as by government authorities. This type of information helps the public, especially helping those who need to learn what kind of help is available and from which agencies or volunteers, so they utilize this information to fulfil their situational needs during a pandemic. Emotional support is showing empathy or positive support to affected people and it has a positive impact on people who are victims of the virus and helps them to recover from the virus quickly. Furthermore, sharing this type of information helps people to obtain accumulative support and feel sympathy that they are receiving [15].
Help-seeking information is information which is about offering immediate help from relevant authorities, volunteers, any donations, aid or any type of help related to COVID-19 that helps people to obtain the relevant information. In this way, they find out and filter people by utilizing this information, and reach out to people to help them; they can also analyze, using the historical trends of this information, what help they can provide in the future. This information assists individuals in obtaining help from the authorities [15]. People give opinions, sentiments and talk about the performance of governments, whether they are doing the right things during the pandemic, or what goes wrong if they are not doing well; they expect the government to do better and successfully tackle the pandemic. These opinions, sentiments and discussions all fall into our situational category of criticizing the government. Moreover, they discuss any political attachment, its causes and affects for the crisis, and sharing this type of information helps others verify the validity of information or makes them aware of the situation [15,24,25].

2.2. Twitter during Natural Disasters

Different research studies have shown that Twitter is a rich source of information and researchers can use this information to predict the trends, identify the information demands and analyze situations during disasters [15,26]. The study by [27] discussed the role of Twitter in the dissemination of medical information and misinformation during COVID-19. Data scientists use Twitter data by applying machine learning algorithms and natural language processing techniques to extract comprehensive results for decision-makers. Researchers in [18] use Twitter to predict seasonal influenza; they built a multilingual system called Tweetfluenza that can predict the influenza outbreak using Twitter data. They classified English and Arabic tweets separately based on different keywords. They built a context-aware classifier, where words of the same root and different meanings were removed. They applied machine learning algorithms such as SVM to process the tweets to forecast flu trends. Another research proposed a framework based on a machine learning method to detect the influenza trend in China by collecting a dataset from Weibo, which is similar to Twitter in the context of China [28].
In a case study, Catherine et al. investigate the usage analysis of the Twitter handle of the Mayor of Houston during the hurricanes Sandy and Harvey in August and September of 2017 [29]. In another study, researchers compared machine learning algorithms in the extraction of geo-tagged tweets during emergencies; they used 10 machine learning classifiers on location-oriented disaster-related tweets [30]. A seasonal influenza surveillance system was built on the basis of topics extracted from Twitter [31]. Similarly, a study proposed a multiple layer perceptron with a back propagation model to analyze and predict flu activities from real time data from Twitter [32]. In another study, researchers proposed a hybrid system to extract the salient features of drug abuse health-related tweets by applying linguistic patterns and machine learning classifiers [33].
Twitter-related research studies used user profiles, keywords and hash-tags to extract the data so that better decisions can be made and the loss of different resources can be minimized. Bilingual language analysis of tweets is performed in the study to check the effectiveness of topic identification and sentiment analysis; they used the COVID-19-related tweets from US and Brazil [34]. Disaster-related information dissemination and exchange is very critical and important. Researchers in [35] proposed a model based on social media usage to predict health trends in the context of the Zika virus outbreak during 2015–2016. They investigated and analyzed the Twitter usage of the government (state, federal and local level). In their paper, they used a mixed methods approach to analyze the social media usage of elected officials of governments and relevant authorities. Several deep learning and transformers-based methods are also utilized to analyze the content. Researchers in [36] similarly used a Bert-based LSTM classifier for classification of tweets of Nebraska floods into nine categories. In [37], the study classified disaster-related tweets into informative and non informative categories using an LSTM model and CNN VGG-16 model by leveraging images and content features. A neural-based approach is developed using a transformers-based Roberta model and feature-based methods for identifying situational and non situational tweets during disasters [38].

2.3. Propagation of Crisis Information in Social Media

The information propagation pattern is one of they key aspects in social media which describes how information is generated and spread among people that carry different aspects and sentiments, and practitioners use these aspects to detect different patterns and analyze them for predictive use. Rongsheng et al. analyze the information propagation aspects in their research article. They formulated definitions of information propagation as a Weibo information flow (WIF) and have applied it to the empirical analysis of Sina Weibo (which is equivalent to Twitter in China) by extracting the dataset from Weibo related to earthquake disasters. His main goal was to present a framework that extracts the underlying hidden social aspects of social media which actually represent the information flow and exchange of information among users during the disaster [39]. Prior research studies employed a different set of features to predict the propagation scale of social media information in crises, mostly the content features and user features, such as done by researchers in [16,40] utilized the hashtags, creating time of content, URLs and hashtags to check the re-tweeted amount of social media content. From the perspectives of user-related features, followers, following and verified users are used to check the propagation scale of information by [41,42]. Moreover, in case of disasters, people are more likely to re-tweet information that is from eyewitness users and from users located near to the event; therefore, the location feature is also used by researchers in [43] to analyze the propagation scale. We have seen prior studies utilizing different features to predict the propagation scale, and diffusion of social media information; therefore, as compared to prior studies in crisis information, our method is novelistic and efficient in a way that it (1) utilized automated semi supervised classification of situational information by using machine learning algorithms, (2) combining a more set of features from content, user-related, LIWC emotions and cognitive features to characterize situational information propagation scale and (3) given that no research study has combined ML algorithms and LIWC features to characterize the situational information in the context of COVID-19 epidemic.
We noticed that the usage of social media in recent times has been so common during crisis and disasters, or pandemics, as shown by [44] which captured Twitter data to detect the emotion dynamics and flow of behavioral users during the COVID-19 pandemic during different time intervals of the pandemic. Another study during the hurricane Harvey disaster leveraged Twitter data to uncover the propagation scale and sentiments of contextual tweets through re-tweet patterns and sentiments of those situational tweets from the perspective of location [45]. Similarly, Twitter streams are classified using the scholarly abstracts from PubMed and tweets from Twitter by applying word2vec and skip gram model feature extraction techniques during the Ebola and Zika virus pandemics [46].

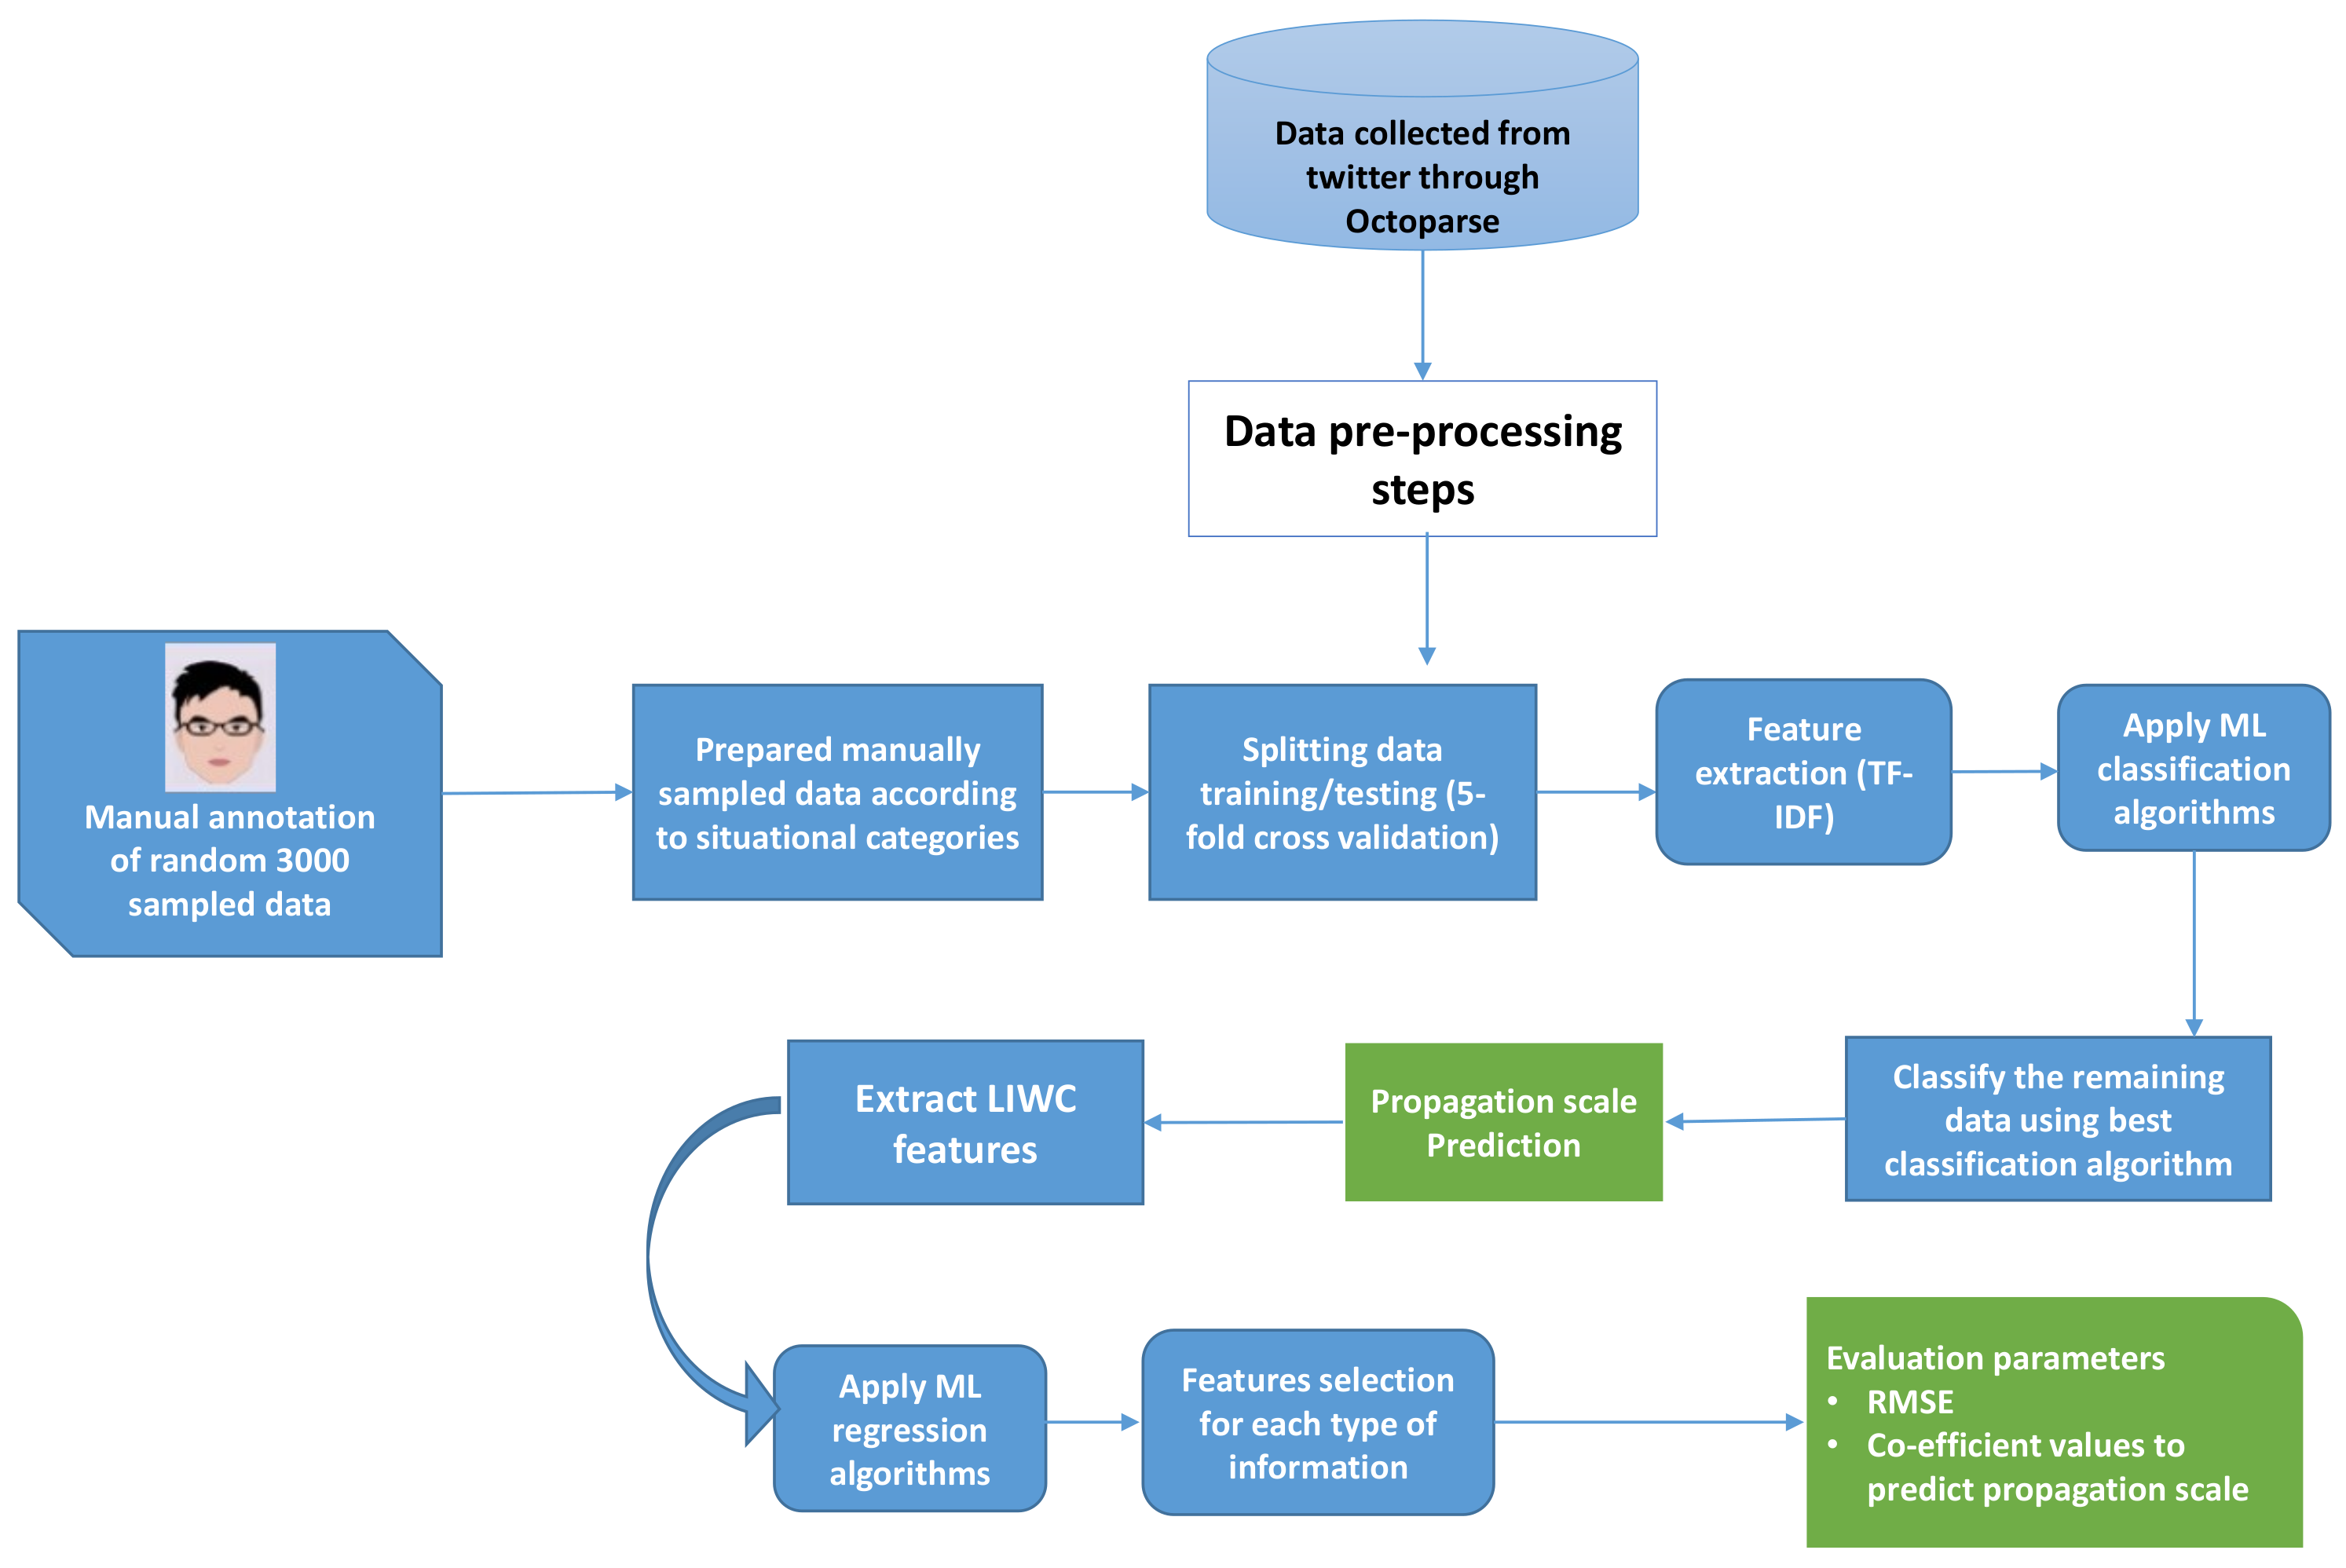
3. Proposed Framework

Figure 2 shows the framework that we aimed to build to predict the propagation scale of situational information. The framework consists of the following tasks:
1.
Collecting the COVID-19-related datasets consisting of tweets.
2.
Applying pre-processing steps to remove noisy data.
3.
Manually annotating the random 3000 tweets by different annotators according to different situational information categories.
4.
Feature extraction through TF-IDF, as machine learning classifiers need data in the form of feature vectors.
5.
Applying supervised machine learning classifiers and obtaining accuracy scores to check the classification performance of different classifiers.
6.
Choosing the classifiers with the highest classification accuracy score to label the remaining data.
7.
Extracting content, user-related linguistic and cognitive features to predict the propagation scale.
8.
Applying Machine learning regression algorithms to predict the retweeted amount of every situational information separately.
9.
Presenting the results to analyze the propagation scale through ML regression algorithms evaluation parameters such as co-efficient values of all features.

3.1. Data Collection and Description

Twitter’s basic standard API gives limited access and also limited results. With the Twitter Search API, the developer’s query (or poll) tweets that have occurred are limited by Twitter’s rate limits. For an individual user, the maximum number of tweets you can receive is the last 3200 tweets, regardless of the query criteria. You are further limited by the number of requests you can make in a certain period. The Twitter request limits have changed over the years but currently are limited to 180 requests in 15 min (https://developer.twitter.com/en/products/twitter-api (accessed on 22 March 2020)). We wanted to explore more historical data and analyze that data so that better results can be achieved to determine the accurate evaluation of the situational information. So, for the data collection, we approached the automatic web extraction tool company Octoparse. Octoparse is a well automated and easy to use web extraction tool used to extract data from websites and social networks. It has built-in templates and custom templates in which you can extract data based on your demands; in social media data extraction you just have to give search parameters and specific date parameters on the octoparse interface for a specific social media site and then octoparse servers collect data for you and that can be downloaded in excel files and json format for further processing. We used the custom Twitter template of Octoparse to retrieve the historical data using search phrases and date parameters from Twitter. In short, we bought their premium template services to extract data from Twitter (https://helpcenter.octoparse.com/hc/en-us/articles/900000659063-Lesson-0-Octoparse-Basics (accessed on 25 April 2020)).
In the template we set three parameters: keywords, language, and location. We extracted the data based on keywords, “COVID-19”, “coronavirus”, “COVID”, “SARS-Cov2”, “coronavirusoutbreak”, “coronaviruspandemic”; the reason for including these keywords was because this set of keywords was largely used by many prior research studies. For instance, researchers in [47,48] used these keywords to extract COVID-19-related data from Twitter; therefore, taking inspiration from these studies, we decided to select these keywords for our study. We set the date from 30 January 2020 to 30 June 2020 and we extracted only US location data as we set these parameters in our template. The reason for choosing this time frame was because the WHO declared the health emergency around the world on 30 January 2020.
We extracted 83k tweets from Twitter using the Octoparse template. We extracted them only from the US; in addition, we set some restrictions so that we obtain only relevant data such as only extracting English language tweets, only the tweets in which the location of tweeting user is given. The dataset excluded the tweets in which location was not given. The data collection and its data organization was conducted by ourselves to suit the requirements of the study, and the following are the attributes and data description from the Twitter data from 30 January 2020 to 30 June 2020: (1) content attributes such as the creation time of a tweet post when the tweet was posted, the actual content of the tweet, the total no. of re-tweets of that particular tweet, the total no. of likes of that particular tweet, (2) user attributes such as the verified status of the account that posted that tweet, how many followers the user has who posted the tweet, total no. of accounts that particular account is following and the location of that particular user from the user profile. These were the specific attributes of tweets that we extracted to classify the situational information.

3.2. Data Pre-Processing

Social media data are raw and noisy data at first when considering processing in machine learning algorithms; these raw data need pre-processing and cleaning so that they can be fed into machine learning algorithms, so we pre-processed and cleaned the collected tweets using the Natural Language Toolkit (NLTK) in Python [49] and also utilized the Spacy function with the core English model for lemmatization (https://spacy.io/usage/models (accessed on 1 June 2020)). Pre-processing involves different steps such as removal of stop words from the tweet text, punctuation removal such as commas, exclamations, full stops and question marks as they do not have any significance in the machine learning context. Removal of stop words such as, ‘the’, ‘is’, ‘at’, ‘on’, etc. Furthermore, URLs were removed as we did not need that in our dataset. As numbers such as 22, 456, and 12 hold no meaning in the tweet text, so we removed these types of numbers. The next step was to remove the special symbols from texts such as ‘@’, ‘$’, ‘∖’, etc. Then all the tweets were converted into lower-case letters; next, we checked the tweets for miss-spellings and auto-corrected the spelling mistakes in tweets expressed in the English language through lemmatization. After doing the above pre-processing steps we had 69k tweets that we used for annotation and classification of situational information further.

3.2.1. Tokenization and Lemmatization

In this process, we split our tweet text into separate words or chunks; for example the emergency alert in the state of Alabama because of COVID was converted into ‘emergency’, ‘alert’, ‘in’, ‘the’, ‘state’, ‘of’, ‘Alabama’, ‘because’, ‘of’, ‘covid’. We used NLTK method word_tokenize() to split a sentence into words; we utilized the Spacy function with the core English language model for lemmatization (https://spacy.io/usage/models (accessed on 1 June 2020)). The beauty of this Spacy function is that it gives you part of the speech detail of every sentence, and you can chose from that which part of speech you need for further processing in the specific context. Spacy is capable of also giving sentence dependencies in case you need them while performing graph embedding. After tokenization, we need to see which part of the sentence we need and also need to extract the words into their original forms. Both the lemmatization process and the stemming process are used for this purpose. Many typical text classification techniques use stemming with the help of a port stemmer, and snowball stemmer, with which the words ‘compute’, ‘computer’, ‘computing’, ‘computed’ would be reduced into the word ‘comput’; a little draw back with stemming is that it reduces the word into its root form without looking into if the word is found in dictionary of that specific language or not, as you can see ‘comput’ is not a dictionary word. This is where the lemmatization is used; with Spacy we performed the lemmatization. Lemmatization also reduced the word into its root form but whilst keep in mind the dictionary database. With lemmatization, the above examples of words (‘compute’, ’computer’, ‘computed’, ‘computing’) would be reduced to root form as (‘compute’, ‘computer’, ‘computed’, ‘computing’), respectively by keep in in mind the dictionary.

3.2.2. TF-IDF (Term Frequency—Inverse Document Frequency)

In this paper, TF-IDF was applied to transform the text into numerical feature vectors which are then considered as input to supervised machine learning algorithms. We used TF-IDF at the word level. The reason for choosing the TF-IDF method is the nature of our data and framework as we needed word/feature relevancy and importance to apply our regression algorithms later on to check the propagation scale, so TF-IDF was better suited to reflect the importance of words in the entire corpus and in our context.
Equation of TF:
t f ( t , d ) = no. of times term t appears in a document d/total no. of terms t in a document d,
The inverse document frequency measures how important a word is in a whole document. The equation of IDF:
i d f ( t ) = l o g ( N / ( d f + 1 ) )
The Tf-idf combined equation would be:
t f i d f ( t , d ) = t f ( t , d ) * l o g ( N / ( d f + 1 ) )
The parameters and symbols would be as follows:
df = document frequency;
tf = term frequency; idf = inverse document frequency;
N = total number of documents;
df + 1 = docs containing terms;

3.2.3. Annotation and Classification of Situational Information

For annotation purposes, we randomly selected 3000 tweets as a sample set from the collected dataset and labeled them according to the seven categories of situational information that we defined earlier. The annotation of data took 4 weeks to label all the 3000 samples of data tweets. The data were labelled by three research assistant post graduate students majoring in computer sciences with research areas in natural language processing, and then we calculated the Cohen’s Kappa value of annotators, which was 0.84, which indicates the satisfactory nature of the labeling results. Table 1 presents the labeling results and definitions of each type of situational information. In the table, we can see that type 2 information notifications and measures have the highest number of posts when we label the 3000 random posts manually, followed by posts criticizing the government. The category count can be analyzed graphically in Table 1. We defined and described the situational information categories by following the definitions in prior studies [8,15].
After manually labeling the posts, machine learning classifiers were performed on labelled data by using five-fold cross validation as a train–test split to check the accuracy of each classifier. Machine learning classifiers only process numbers and the nature of our data is purely textual, so to apply and train the algorithms we had to transform the textual data into feature vectors and transform the data into numbers; in machine learning, there are different ways to do this, such as bag of words [50], term frequency(TF) and TF-IDF [51] to transform the data from text into numbers, and ultimately into vectors. We used the TF-IDF feature extraction method in this paper. The TF-IDF value increases with an increase in the frequency of a particular word the corpus of text. To balance the high frequency of the most common words, the term frequency is cut down by the overall frequency in the corpus. Term frequency measures how important a word is in a given text [52].

3.2.4. Machine Learning Classifiers

After transforming data into numerical vectors, in order to examine our approach in classification perspective, we employed k-fold cross validation on training data. We randomly divided the data into five-fold CV cross validation; we applied different machine learning classifiers to classify the information into seven categories, which we defined in detail previously in Section 3.2.3. The major advantage of k-fold cross validation is that every observation of data has a chance of appearing in the training and testing sets. The machine learning classifiers used were: SVM (Support vector machine) with the linear kernel, with the radial basis kernel and with the sigmoid kernel; RF (Random forest); multinomial naive Bayes; KNN (k-nearest neighbor) and the Logistic regression classifier. Typically, classification algorithms have accuracy, F1 measure, precision and recall measures to measure the performance of classifiers. Accuracy is a measure used to identify all correctly classified categories; we determine the classification accuracy of each fold on our datasets, and evaluate the average classification accuracy at the end. Precision is a measure used to identify the positive class from all predicted positive classes, while recall is a measure to correctly identify positive class from actual positive classes, and F1 is a harmonic mean of precision and recall [53], (https://medium.com/analytics-vidhya/accuracy-vs-f1-score-6258237beca2 (accessed on 10 July 2020)). The average accuracy, F1 score, precision, and recall score of each classifier are given in Table 2. The results indicate that SVM with the radial basis kernel setting performs best among all. In the different situations on textual data, different classification algorithms give different results, while in the context of our data, in which we use it to label the data by using classifiers, among all the supervised algorithms, the support vector machine (with radial basis kernel) performs better in terms of classification performance, compared to the other classifiers applied to the same dataset; therefore, we chose this classifier to automatically label the remaining dataset, using 3000 sampled labeled data.
We summarized the six attributes of every type of information in Table 3 to represent what it actually is the public need generally. The attributes include the total (average) number of tweets, the verified user amount (the proportion of verified users), the total (average) amount of followers and following of the users who posted tweets, the total (average) number of retweets of tweets, and the total (average) amount of likes on tweets in each type of information. If we analyze the average amounts, we can see that, during the COVID-19 pandemic, the verified users were mostly involved in dissemination of Type 1 information (notifications and measures), so verified users dominated in the context of this type of information.

4. Situational Information Propagation Level Prediction

Until now we have seen the general idea of the necessity of information of the public by analyzing the total and average values of each type of information. To more precisely predict the propagation scale (retweeted amount) of situational information, we need key features from our dataset and we extracted different types of features to accurately predict the retweeted amount. We selected the retweeted attribute for propagation because, on Twitter, it means sharing the content further; it is the attribute that satisfies our need to accurately predict the propagation scale of each category of situational information.
The extracted key features to predict the propagation scale are as follows:
1.
Emotional-related features: effect, positive emotion (posemo), negative emotion (negemo), anxiety (anx), anger and sadness (sad) words in the posts.
2.
Perception type features: perception, seeing, hearing and feeling in the posts.
3.
Affiliation type features: driving, affiliation, achievements, power, rewards and risk in the posts.
4.
Cognitive processes features: certainty(certain) and differentiation(diff).
5.
User-related features: if users are verified or not, followers (log) amount, following (log) amount and NearState.
6.
Content-related features: length of the post (word count), number of retweets (log) and likes on the posts.
Specifically, the linguistic information features are extracted from Linguistic Inquiry and Word Count (LIWC); this is the mostly used software created by researchers [54]. It is used to extract the linguistic information from text related to different psychological factors [55]. It reveals the psychological, negative, emotional, and cognitive perspectives that people describe in the text data. This linguistic information shows the people;s emotions and sentiments in th specific context; they express themselves more freely on social media, which could reveal their perceptions about certain situations and about how they think [55].
The values of following and followers were log transformed to avoid zeros during analysis and these two features were directly calculated from the dataset; verified users values also come from the dataset. As we have already described, our data context is the US, so the location attribute was also available in the dataset, and the NearState attribute was obtained by the following definition: whether the location showed the hardest-hit state, which is California according to data by center of disease control and prevention (CDC) (https://covid.cdc.gov/covid-data-tracker (accessed on 20 April 2020)); if location showed California, then we assigned it a value of one, otherwise we assigned it a value of zero.
As far as content features are concerned, they also come from the dataset, specifically from the tweet content and its parameters; there is a feature word count category option that counts the words of each post, so we use that feature and obtained the WC (word count) in terms of length and count of likes already available in our dataset, so we obtained this from our dataset. The like attribute contains how many likes a specific post receives.
Table 4 shows the summary of all the extracted features, their LIWC values and log-transformed values of features from the dataset that we computed, for all types of situational information.
By using the above-defined features of each type of situational information, we first selected the features using random forest (RF) and linear regression and, by comparing performance of the selected features, we found out that linear regression performs better and we finally choose this method. In addition to this, multiple linear regression and negative binomial regression were implemented to predict the amount of re-tweets (log-transformed) of each type of information using the selected features. The reason for choosing the negative binomial regression model as one of the model is because our predicted dependent variable have a counted no. of values; simply saying it is a counter variable and negative binomial regression is better in predicting counter variables and we can see the effect of this in the root mean square error (RMSE) value table which show that the negative binomial is better compared to the multiple linear regression model.
Table 5 shows the Root mean square error value of each model; as in the regression models, the root mean square error is the most important metric. We check the model efficiency by using this, as negative binomial regression gives lower RMSE values; therefore, we finally choose the negative binomial regression to predict the retweeted amount of COVID-19-related Twitter posts to analyze the propagation scale of each type of situational information.

5. Discussion

Table 6 shows the effect of the selected features for all categories. Specifically, it shows the selected features that are selected based on the regression model with good evaluation measure scores and their effects on the left column for each type of situational information. For example, seven features are selected for type 1 situational information, named: likes, verified, length, negemo, NearState, percept, and follower. Moreover, feature effects are determined by analyzing the coefficients of features using the best regression model which is negative binomial regression. Table 6 shows the following detail:
For Type 1 (notifications or measures were taken), Type 3 (emotional support), and Type 4 (help seeking) information; the more the verified users promote a tweet, the more it enlarges the number of retweets, so it indicates that verified users have an impact on these specific types of situational information and authorities need to pay attention to the verified users, specifically for their greater influence. These might be even local government people who might be seeking help in the form of emergency medical equipment and human resources.
Type 5 information (criticizing the government and government agencies) receives a larger number of retweets for unverified users, which shows most common people affect this type of information; also, the usage of the negative words enlarge this type of information. It implies that there is mostly common public and residents from hardest-hit state criticizing the government for their performance in response to COVID-19. From the perspective of authorities, they should pay attention to these rationally thinking criticizers, because, while developing COVID-19 response strategies, their opinions might be valuable.
For Type 2 (donations: goods, money, and services), it comes from users who have a large number of followers and are from California state, which was the hardest-hit state and which is considered to be one of the most developed states in the US; this will enlarge the amount of retweets. If government authorities want to expand the dissemination scale of this type of situational information and want to check who are the volunteers, NGO’S and common public donating for people and assisting the government in the COVID-19 crisis response are, then it is better to target accounts who have a high number of followers and comes from this state. They can also interact with them by mentioning and replying to their opinions and queries. Furthermore, posts of this information type receive more likes, which indicate that this type of information has a more likable attitude during crises.
By analyzing the table, it is certain that for all types of information except Type 5 (criticizing the government and government authorities), the length of the post is critical; the more the words the tweet post contains, the larger its amount of retweets. For all categories of situational information, except Type 5 situational information, increasing the length of the post will enlarge the propagation scale, as for Type 5 (criticizing the government or government agencies), length does not matter, because it is a type of information that criticizes, whether it is in a negative way or in a positive way; some users criticize in a single word, e.g., ‘pathetic’, some use three to four words like ‘govt should pay attention’, etc. So we need to expand the sample data to assess whether it is good to use a single word or a few words to enlarge the propagation scale of this type of situational information.
As far as Type 0 situational information (caution and advice) is concerned, more likes, higher word counts, less anxiety (Anx, Anger) words and more followers are the main variables that enlarge a tweet’s amount of retweets, as this information is related to caution and advice so it mostly contains smooth words and a calm way of encouraging the public to relax in the crisis situation (COVID-19). It is the government authority’s responsibility to disseminate this type of information, as it contains caution and giving advice related to COVID-19, so that people pay attention to it in order to save themselves from the virus.
In a nutshell, our research results could be a useful reference for understanding the public health information needs, such as how they think, what they need, what aspects of COVID-19-related health information can fulfil their needs, and what the attitude of the public is towards governments and current pandemic response strategies. In addition, specifically, this study can help people to acquire what they need, by seeing the donations, help-seeking, and notifications available or measure types of situational information results. Public health authorities could utilize this research article’s results to improve the health information publishing strategies at government level in teh near future, as pandemics are long term and take time to end. So, in future, the results of this research article could be beneficial to the authorities.
Regarding our RQ1, first we formulated the situational information definitions, on the basis of definitions and description of situational information given in research studies by [8,15]; then, we implemented the machine learning classifiers to accurately classify information into categories. To search the ideal features for propagation scale was the main aim of RQ2, we extracted six types of features: emotional, perception, affiliation, cognitive, user-related, and content -elated. All these features are from content; the detail of how these features are constructed is given in the Section 4. Then, in the end, all the results in the Table 6 of situational information types, its propagation scale and its discussions on implications, and on the main information types with specific features that enlarge the amount of retweets is a comprehensive response to RQ3. There are some research studies such as [15], in which they proposed a framework for propagation scale but their context is Chinese social media data from services such as Weibo; therefore, to the best of the authors’ knowledge, no similar work has been conducted yet on COVID-19 Twitter data. The presented and discussed results uphold the immense potential and relevance of the framework for the development of situational information and its propagation scale in the context of social media data analytics.

6. Implications

6.1. Theoretical Implications

Our findings contribute to the theory in different ways. First, by comprehensively defining definitions of situational information that will be useful for researchers and also enrich the existing literature, even though some prior studies have paid attention to disaster-related information in a healthcare context, but these studies focused on one or two aspects of information while neglecting the other aspects of situational information [13]. So, our study expanded the prior research and examined the each aspect of information during the healthcare crisis with more fine-grained analysis, and put it into situational information types. Different studies approached natural disasters by analyzing only emotional response [56], or just investigating the help/aid information [57], and evidence-based disaster information [17]. However, we suggest the characterization of every type of COVID-19 pandemic situational information along with word and linguistic patterns that people use in their tweets; such linguistic patterns uncover the information needs and sentiments of people. These linguistic patterns imply the need to utilize different types of information sharing strategies for different types of situational information. The observed descriptive findings of this research imply that this framework can be applied in different contexts of natural disasters and for crisis response strategies. Some notable empirical findings are: type 1 (announcements or measures) has largest amount of verified users involved in the spreading of this type of information, which confirms the validity and authenticity of this type of information, especially in COVID-19 pandemic situation, while type 4 (help seeking) information attracted the largest numbers of retweets which indicate people want to help each other by sharing more of this information type.

6.2. Practical Implications

This study’s findings also have some substantial practical implications for government authorities or practitioners who aim to understand the attitudes and sentiments of the public during the COVID-19 pandemic and towards the COVID-19 response strategies via social media platforms. First, authorities could apply the results of this article to improve the current pandemic response strategies by amplifying the donations, help seeking, notifications, cautions/advice types of information that are needed by the public. Second, as suggested by the results of the study, tweets related to donations come from users wit a large number of followers and more positive words and have a large number of retweets. In contrast, tweets related to criticizing the government have more negative words and come from more unverified account users (the most common users of Twitter), propagate most. These results can assist practitioners and authorities to formulate surveillance strategies of public sentiments, so that their opinions can be taken into account, because these users can be rational thinkers and have greater influence on social media. Eventually, these users may clarify the truth and express more anger on social media. Furthermore, this study’s findings also indicate that, if authorities want to enlarge the propagation scale of all situational information types, they could focus on the length of tweets because, in all types of situational information except type 5 (criticizing the government), the length of tweets has more impact on retweets.
Additionally, by analyzing the anger-, anxiety- and sad words-related tweets we found out that they have less or no affect on type 0 (caution and advice) information, and also the existence of a more likable (variable like count) attitude from public; therefore, if authorities want to ease the anxiety of the public during pandemic, they should focus not only on tweet posts with words not only related to anxiety but also on tweet posts with more likes in the type 0 (caution and advice) situational information type. In this way, practitioners or authorities will comfort the sadness of the public during the pandemic and they can also enlarge the propagation scale of this type of information by utilizing this finding.

7. Conclusions and Future Work

Identifying the situational information during natural disasters is the main aim of authorities and practitioners. The unparalleled use of social media by the public provides opportunities for authorities and data scientists to leverage social media platforms to analyze and enhance their response. We combined machine learning algorithms and natural language techniques to take advantage of this opportunity. In this work, we leveraged Twitter data to classify the information into situational information categories. We employed different ML classifiers and the highest accuracy achieved was 77%, and the lowest performing classifiers achieved 54% accuracy; the best performing classifier (SVM) was then used to label the remaining datasets, after which we identified different linguistic, content and user features, then predicted the number of retweets to characterize the propagation scale of situational information by using the selected features. We observed that emotional features have negative correlations with the number of retweets for almost all types of information. User, cognitive and content features have positive relations with the propagation scale of the number of retweets.
The data-oriented insights from this article indicate the need for utilizing information publishing strategies for different types of situational information. The authorities could also learn how to manage the COVID-19-related posts to enlarge or decrease the number of retweets of their posts using the selected feature results. Hence, practitioners can use this study to develop information dissemination strategies during the COVID-19 pandemic. This novel approach to applying machine learning classifiers and regression algorithms to multiple categories of the same data paved a new way to analyze the data of this nature.
The first limitation of this approach is relatively a medium-sized dataset. Another is the fact that we only trained machine learning classifiers that give achievable results; however, in future we will use more deep learning methods and apply them to a bigger datasets to achieve better results in terms of accuracy by collecting more data from other countries as well [58]. Human-annotated labels give more assured results, but it takes time, so in future we will apply automatic labeling to our situational information data to achieve better efficiency in terms of time cost and better annotation. The results support this new framework of identifying situational information categories, thereby indicating the necessity of extending the study to different types of natural disasters such as floods, earthquakes, hurricanes, other languages and other countries.

Author Contributions

Conceptualization, J.A.W. and Y.G. and L.S.; methodology, J.A.W., Y.G. and L.S.; investigation, J.A.W. and S.H.; validation, B.Y., Y.T. and L.W.; writing—original draft preparation, J.A.W. and L.S.; writing— review and editing, Y.G., B.Y. and L.W.; visualization—charts and tables, J.A.W., S.H., Y.T.; supervision, L.S., Y.G.; funding acquisition, L.S.; resources, B.Y., L.W., Y.T. All authors have read and agreed to the published version of the manuscript.

Funding

This work was supported in part by National Key R&D Program of China 2018 and Key Scientific and Technological Research Projects in Henan Province of China under grant number 192102310216. This work was supported in part by the National Key Technologies R&D Program (2020YFB1712401, 2018YFB1701401), in part by the Nature Science Foundation of China (62006210), and in part by the major project of Zhengzhou Collaborative Innovation (20XTZX-009, 20XTZX-X010). the National Key R&D Program of China (2018******02).

Institutional Review Board Statement

Not applicable.

Informed Consent Statement

Not applicable.

Data Availability Statement

Not applicable.

Conflicts of Interest

The authors declare no conflict of interest.

References

  1. Thakur, N.; Han, C.Y. An Ambient Intelligence-Based Human Behavior Monitoring Framework for Ubiquitous Environments. Information 2021, 12, 81. [Google Scholar] [CrossRef]
  2. Ullah, M.A.; Marium, S.M.; Begum, S.A.; Dipa, N.S. An algorithm and method for sentiment analysis using the text and emoticon. ICT Express 2020, 6, 357–360. [Google Scholar] [CrossRef]
  3. Rustam, F.; Reshi, A.A.; Mehmood, A.; Ullah, S.; On, B.; Aslam, W.; Choi, G.S. COVID-19 Future Forecasting Using Supervised Machine Learning Models. IEEE Access 2020, 8, 101489–101499. [Google Scholar] [CrossRef]
  4. Adel, M.; Kotb, A.; Farag, O.; Darweesh, M.S.; Mostafa, H. Breast Cancer Diagnosis Using Image Processing and Machine Learning for Elastography Images. In Proceedings of the 2019 8th International Conference on Modern Circuits and Systems Technologies (MOCAST), Thessaloniki, Greece, 13–15 May 2019; pp. 1–4. [Google Scholar] [CrossRef]
  5. Kisi, O.; Cimen, M. Precipitation Forecasting by Using Wavelet-Support Vector Machine Conjunction Model. Eng. Appl. Artif. Intell. 2012, 25, 783–792. [Google Scholar] [CrossRef]
  6. Wu, J.T.; Leung, K.; Leung, G.M. Nowcasting and forecasting the potential domestic and international spread of the 2019-nCoV outbreak originating in Wuhan, China: A modelling study. Lancet 2020, 395, 689–697. [Google Scholar] [CrossRef] [Green Version]
  7. Burnap, P.; Williams, M.L.; Sloan, L.; Rana, O.; Housley, W.; Edwards, A.; Knight, V.; Procter, R.; Voss, A. Tweeting the terror: Modelling the social media reaction to the Woolwich terrorist attack. Soc. Netw. Anal. Min. 2014, 4, 206. [Google Scholar] [CrossRef] [Green Version]
  8. Vieweg, S.; Hughes, A.L.; Starbird, K.; Palen, L. Microblogging during Two Natural Hazards Events: What Twitter May Contribute to Situational Awareness. In Proceedings of the SIGCHI Conference on Human Factors in Computing Systems, Atlanta, GA, USA, 10–15 April 2010; Association for Computing Machinery: New York, NY, USA, 2010; pp. 1079–1088. [Google Scholar] [CrossRef]
  9. Jarwar, M.A.; Abbasi, R.A.; Mushtaq, M.; Maqbool, O.; Aljohani, N.R.; Daud, A.; Alowibdi, J.S.; Cano, J.R.; García, S.; Chong, I. CommuniMents: A framework for detecting community based sentiments for events. Int. J. Semant. Web Inf. Syst. (IJSWIS) 2017, 13, 87–108. [Google Scholar] [CrossRef]
  10. Martínez-Rojas, M.; del Carmen Pardo-Ferreira, M.; Rubio-Romero, J.C. Twitter as a tool for the management and analysis of emergency situations: A systematic literature review. Int. J. Inf. Manag. 2018, 43, 196–208. [Google Scholar] [CrossRef]
  11. Mukkamala, A.; Beck, R. The Role of Social Media for Collective Behavior Development in Response to Natural Disasters. Research Papers. AIS e Library. 2018. p. 109. Available online: https://aisel.aisnet.org/ecis2018_rp/109 (accessed on 20 April 2020).
  12. Yan, L.L.; Pedraza-Martinez, A.J. Social Media for Disaster Management: Operational Value of the Social Conversation. Prod. Oper. Manag. 2019, 28, 2514–2532. [Google Scholar] [CrossRef]
  13. Rudra, K.; Ghosh, S.; Ganguly, N.; Goyal, P.; Ghosh, S. Extracting Situational Information from Microblogs during Disaster Events: A Classification-Summarization Approach. In Proceedings of the 24th ACM International on Conference on Information and Knowledge Management CIKM ’15, Melbourne, Australia, 18–23 October 2015; Association for Computing Machinery: New York, NY, USA, 2015; pp. 583–592. [Google Scholar] [CrossRef]
  14. Vieweg, S.E. Situational Awareness in Mass Emergency: A Behavioral and Linguistic Analysis of Microblogged Communications. Ph.D. Thesis, University of Colorado, Boulder, CO, USA, 2012. [Google Scholar]
  15. Li, L.; Zhang, Q.; Wang, X.; Zhang, J.; Wang, T.; Gao, T.; Duan, W.; Tsoi, K.K.; Wang, F. Characterizing the Propagation of Situational Information in Social Media During COVID-19 Epidemic: A Case Study on Weibo. IEEE Trans. Comput. Soc. Syst. 2020, 7, 556–562. [Google Scholar] [CrossRef]
  16. Li, L.; Zhang, Q.; Tian, J.; Wang, H. Characterizing information propagation patterns in emergencies: A case study with Yiliang Earthquake. Int. J. Inf. Manag. 2018, 38, 34–41. [Google Scholar] [CrossRef]
  17. Zahra, K.; Imran, M.; Ostermann, F.O. Automatic identification of eyewitness messages on twitter during disasters. Inf. Process. Manag. 2020, 57, 102107. [Google Scholar] [CrossRef]
  18. Alkouz, B.; Aghbari, Z.A.; Abawajy, J.H. Tweetluenza: Predicting flu trends from twitter data. Big Data Min. Anal. 2019, 2, 273–287. [Google Scholar] [CrossRef] [Green Version]
  19. Ruz, G.A.; Henríquez, P.A.; Mascareño, A. Sentiment analysis of Twitter data during critical events through Bayesian networks classifiers. Future Gener. Comput. Syst. 2020, 106, 92–104. [Google Scholar] [CrossRef]
  20. Kaufhold, M.A.; Bayer, M.; Reuter, C. Rapid relevance classification of social media posts in disasters and emergencies: A system and evaluation featuring active, incremental and online learning. Inf. Process. Manag. 2020, 57, 102132. [Google Scholar] [CrossRef]
  21. Saleem, H.M.; Xu, Y.; Ruths, D. Novel Situational Information in Mass Emergencies: What does Twitter Provide? Procedia Eng. 2014, 78, 155–164. [Google Scholar] [CrossRef] [Green Version]
  22. Imran, M.; Elbassuoni, S.; Castillo, C.; Diaz, F.; Meier, P. Extracting information nuggets from disaster—Related messages in social media. In Proceedings of the ISCRAM 10th International Conference on Information Systems for Crisis Response and Management, Baden-Baden, Germany, 12–15 May 2013; Karlsruher Institut fur Technologie: Karlsruhe, Germany, 2013; pp. 791–801. [Google Scholar]
  23. Fan, C.; Jiang, Y.; Yang, Y.; Zhang, C.; Mostafavi, A. Crowd or Hubs: Information diffusion patterns in online social networks in disasters. Int. J. Disaster Risk Reduct. 2020, 46, 101498. [Google Scholar] [CrossRef]
  24. Takahashi, B.; Tandoc, E.C.; Carmichael, C. Communicating on Twitter during a disaster: An analysis of tweets during Typhoon Haiyan in the Philippines. Comput. Hum. Behav. 2015, 50, 392–398. [Google Scholar] [CrossRef]
  25. Bhuvana, N.; Arul Aram, I. Facebook and Whatsapp as disaster management tools during the Chennai (India) floods of 2015. Int. J. Disaster Risk Reduct. 2019, 39, 101135. [Google Scholar] [CrossRef]
  26. Karami, A.; Shah, V.; Vaezi, R.; Bansal, A. Twitter speaks: A case of national disaster situational awareness. J. Inf. Sci. 2020, 46, 313–324. [Google Scholar] [CrossRef] [Green Version]
  27. Rosenberg, H.; Syed, S.; Rezaie, S. The Twitter pandemic: The critical role of Twitter in the dissemination of medical information and misinformation during the COVID-19 pandemic. Can. J. Emerg. Med. 2020, 22, 418–421. [Google Scholar] [CrossRef] [Green Version]
  28. Zhang, F.; Luo, J.; Li, C.; Wang, X.; Zhao, Z. Detecting and Analyzing Influenza Epidemics with Social Media in China. In Advances in Knowledge Discovery and Data Mining; Tseng, V.S., Ho, T.B., Zhou, Z.H., Chen, A.L.P., Kao, H.Y., Eds.; Springer International Publishing: Cham, Switzerland, 2014; pp. 90–101. [Google Scholar]
  29. Vera-Burgos, C.M.; Griffin Padgett, D.R. Using Twitter for crisis communications in a natural disaster: Hurricane Harvey. Heliyon 2020, 6, e04804. [Google Scholar] [CrossRef] [PubMed]
  30. Eligüzel, N.; Çetinkaya, C.; Dereli, T. Comparison of different machine learning techniques on location extraction by utilizing geo-tagged tweets: A case study. Adv. Eng. Inform. 2020, 46, 101151. [Google Scholar] [CrossRef]
  31. Kagashe, I.; Yan, Z.; Suheryani, I. Enhancing Seasonal Influenza Surveillance: Topic Analysis of Widely Used Medicinal Drugs Using Twitter Data. J. Med. Internet Res. 2017, 19, e315. [Google Scholar] [CrossRef] [Green Version]
  32. Lee, K.; Agrawal, A.; Choudhary, A. Forecasting Influenza Levels Using Real-Time Social Media Streams. In Proceedings of the IEEE International Conference on Healthcare Informatics (ICHI), Park City, UT, USA, 23–26 August 2017; pp. 409–414. [Google Scholar] [CrossRef]
  33. Jenhani, F.; Gouider, M.S.; Said, L.B. Hybrid System for Information Extraction from Social Media Text: Drug Abuse Case Study. Procedia Comput. Sci. 2019, 159, 688–697. [Google Scholar] [CrossRef]
  34. Garcia, K.; Berton, L. Topic detection and sentiment analysis in Twitter content related to COVID-19 from Brazil and the USA. Appl. Soft Comput. 2021, 101, 107057. [Google Scholar] [CrossRef]
  35. Hagen, L.; Neely, S.; Scharf, R.; Keller, T.E. Social Media Use for Crisis and Emergency Risk Communications During the Zika Health Crisis. Digit. Gov. Res. Pract. 2020, 1. [Google Scholar] [CrossRef]
  36. Romascanu, A.; Ker, H.; Sieber, R.; Greenidge, S.; Lumley, S.; Bush, D.; Morgan, S.; Zhao, R.; Brunila, M. Using deep learning and social network analysis to understand and manage extreme flooding. J. Contingencies Crisis Manag. 2020, 28, 251–261. [Google Scholar] [CrossRef]
  37. Kumar, A.; Singh, J.P.; Dwivedi, Y.K.; Rana, N.P. A deep multi-modal neural network for informative Twitter content classification during emergencies. Ann. Oper. Res. 2020, 1–32. [Google Scholar] [CrossRef]
  38. Madichetty, S.; Sridevi, M. A Neural-Based Approach for Detecting the Situational Information From Twitter During Disaster. IEEE Trans. Comput. Soc. Syst. 2021, 1–11. [Google Scholar] [CrossRef]
  39. Dong, R.; Li, L.; Zhang, Q.; Cai, G. Information Diffusion on Social Media During Natural Disasters. IEEE Trans. Comput. Soc. Syst. 2018, 5, 265–276. [Google Scholar] [CrossRef]
  40. Tsur, O.; Rappoport, A. What’s in a hashtag? Content based prediction of the spread of ideas in microblogging communities. In In Proceedings of the Fifth ACM International Conference on Web Search and Data Mining, Seattle, WA, USA, 8–12 February 2012; pp. 643–652. [Google Scholar]
  41. Hofer, M.; Aubert, V. Perceived bridging and bonding social capital on Twitter: Differentiating between followers and followees. Comput. Hum. Behav. 2013, 29, 2134–2142. [Google Scholar] [CrossRef]
  42. Stern, M.J.; Adams, A.E.; Elsasser, S. Digital inequality and place: The effects of technological diffusion on Internet proficiency and usage across rural, suburban, and urban counties. Sociol. Inq. 2009, 79, 391–417. [Google Scholar] [CrossRef]
  43. Lima, A.C.E.; de Castro, L.N.; Corchado, J.M. A polarity analysis framework for Twitter messages. Appl. Math. Comput. 2015, 270, 756–767. [Google Scholar] [CrossRef]
  44. Kaur, S.; Kaul, P.; Zadeh, P.M. Monitoring the Dynamics of Emotions during COVID-19 Using Twitter Data. Procedia Comput. Sci. 2020, 177, 423–430. [Google Scholar] [CrossRef]
  45. Chen, S.; Mao, J.; Li, G.; Ma, C.; Cao, Y. Uncovering sentiment and retweet patterns of disaster-related tweets from a spatiotemporal perspective—A case study of Hurricane Harvey. Telemat. Inform. 2020, 47, 101326. [Google Scholar] [CrossRef]
  46. Fan, C.; Esparza, M.; Dargin, J.; Wu, F.; Oztekin, B.; Mostafavi, A. Spatial biases in crowdsourced data: Social media content attention concentrates on populous areas in disasters. Comput. Environ. Urban Syst. 2020, 83, 101514. [Google Scholar] [CrossRef]
  47. Banda, J.M.; Tekumalla, R.; Wang, G.; Yu, J.; Liu, T.; Ding, Y.; Artemova, K.; Tutubalina, E.; Chowell, G. A large-scale COVID-19 Twitter chatter dataset for open scientific research—An international collaboration. arXiv 2020, arXiv:2004.03688. [Google Scholar]
  48. Chen, E.; Lerman, K.; Ferrara, E. Tracking social media discourse about the covid-19 pandemic: Development of a public coronavirus twitter data set. JMIR Public Health Surveill. 2020, 6, e19273. [Google Scholar] [CrossRef]
  49. Bilal, M.; Israr, H.; Shahid, M.; Khan, A. Sentiment classification of Roman-Urdu opinions using Naïve Bayesian, Decision Tree and KNN classification techniques. J. King Saud Univ. Comput. Inf. Sci. 2016, 28, 330–344. [Google Scholar] [CrossRef] [Green Version]
  50. Zhang, Y.; Jin, R.; Zhou, Z.H. Understanding bag-of-words model: A statistical framework. Int. J. Mach. Learn. Cybern. 2010, 1, 43–52. [Google Scholar] [CrossRef]
  51. Qaiser, S.; Ali, R. Text mining: Use of TF-IDF to examine the relevance of words to documents. Int. J. Comput. Appl. 2018, 181, 25–29. [Google Scholar] [CrossRef]
  52. Tripathy, A.; Agrawal, A.; Rath, S.K. Classification of sentiment reviews using n-gram machine learning approach. Expert Syst. Appl. 2016, 57, 117–126. [Google Scholar] [CrossRef]
  53. Elhadad, M.K.; Badran, K.M.; Salama, G.I. A novel approach for ontology-based feature vector generation for web text document classification. Int. J. Softw. Innov. (IJSI) 2018, 6, 1–10. [Google Scholar] [CrossRef]
  54. Pennebaker, J.W.; Francis, M.E.; Booth, R.J. Linguistic Inquiry and Word Count: LIWC 2001; Lawrence Erlbaum Association: Mahway, NJ, USA, 2001; Volume 71. [Google Scholar]
  55. Tausczik, Y.R.; Pennebaker, J.W. The Psychological Meaning of Words: LIWC and Computerized Text Analysis Methods. J. Lang. Soc. Psychol. 2010, 29, 24–54. [Google Scholar] [CrossRef]
  56. Li, L.; Wang, Z.; Zhang, Q.; Wen, H. Effect of anger, anxiety, and sadness on the propagation scale of social media posts after natural disasters. Inf. Process. Manag. 2020, 57, 102313. [Google Scholar] [CrossRef]
  57. Suh, B.; Hong, L.; Pirolli, P.; Chi, E.H. Want to be Retweeted? Large Scale Analytics on Factors Impacting Retweet in Twitter Network. In In Proceedings of the 2010 IEEE Second International Conference on Social Computing, Minneapolis, MN, USA, 20–22 August 2010; pp. 177–184. [Google Scholar] [CrossRef]
  58. Li, C.; Yi, J.; Lv, Y.; Duan, P. A hybrid learning method for the data-driven design of linguistic dynamic systems. IEEE/CAA J. Autom. Sin. 2019, 6, 1487–1498. [Google Scholar] [CrossRef]
Figure 1. COVID-19 situational information on Twitter.
Applsci 11 06526 g001
Figure 2. A graphical workflow of the proposed framework describing all the steps to determine the propagation scale of situational information.
Applsci 11 06526 g002
Table 1. Category Names, definitions, manual label numbers, and number of tweets of each category.
Names and DefinitionsManual LabelCounts
Precautions and care: precautions from the public healthcare authorities to explain the pace of the epidemic, such the need to pay attention to different aspects of the containment measure, such as going out much less, using sanitizers to wash hands, wearing masks in public and responding to the government announcements.0199
Announcements or Measures: pandemic announcements such as hospital conditions, the number of cases (recovered, infected or dead), measures taken by health departments, medical equipment reserves and the city and state wise tally of cases.1946
Donated money, goods or services: donations from governments, government-relevant authorities who want to donate goods, money, or services for pandemic prevention and control, healthcare NGO- and health- related volunteer services announcements of donations are also include in this category.263
Emotional support to victims: shows of sympathy by public medical teams and health organizations who are supporting people in the US.3199
Help Seeking: (a) medical institutions, public health care authorities, individuals, etc. seeking support such as demanding human resources in the form of medical workers and individuals seeking medical aid kits, virus test kits etc. (b) Patients want emotional support such as those seeking comfort and who express depression, etc.4279
Criticizing authorities: criticizing or questioning the government on their performance in handling the pandemic so far, questioning the government’s initiatives or criticizing members of the public who mislead others such as blind supporters of specific political parties, etc.5763
Non Situational Information: information that does not fall into any of the above stated and defined categories is classified as non situational information.6551
Table 2. Comparison of classification measures of different algorithms which were used to classify the manually labelled sampled data, the value in bold values indicate the highest scores achieved by specified algorithm.
Name of AlgorithmMean AccuracyF1PrecisionRecall
SVM67%69%69%66%
SVM (linear kernel)70%69%71%68%
SVM (radial basis kernel)77%76%77%73%
SVM (Sigmoid Kernel)57%59%62%59%
Random Forest56%61%63%60%
Multinomial Naïve Bayes55%57%60%56%
K-nearest neighbor54%56%59%55%
Logistic Regression Classifier56%57%60%55%
Table 3. Mean values of extracted dataset features of each information category, and bold values indicates the highest values in that specific column.
TypesTweets
Frequency
Verified
Frequency
Follower FrequencyFollowing
Frequency
RT
Frequency
Like
Frequency
Type 0: Precaution and Care6120610 (9.96%)9,104,201 (2266)6.131831e +08 (190,183. 549)139,431 (51.955)440,375 (167)
Type 1: Announcements or Measures33,8304660 (12.1%)79,371,572 (5171)6.418501e +09 (262,889 0.172)1,701,310 (103.765)6,172,700 (313)
Type 2: Donations4720535 (11.33%)7,316,652 (4159)5.059554e +08 (159,384 0.823)187,212 (87.31)631,910 (267)
Type 3: Emotional support4120459 (11.14%)4,549,173 (3863)7.197526e +08 (390,513 0.864)257,310 (127.86)1,071,331 (497)
Type 4: Help Seeking2217229 (10.33%)3,325,963 (4221)2.318969e +03 (170,904 0.651)247,310 (213.146)968,137 (771)
Type 5: Criticizing the Government7561529 (7.00%)9,833,219 (3746)6.758479e +03 (180,936. 129)210,221 (170.531)1,193,404 (278)
Type 6: Non Situational Information97631397 (14.1%)13,713,097 (3831)12.938331e +08 (260,121. 006043)893,071 (177.34)2,479,301 (810)
Table 4. Full Summary of Attributes (features) of each Type of Situational Information.
FeaturesType 0Type 1Type 2Type 3Type 4Type 5
affect4.913.543.723.674.484.78
posemo1.881.81.941.813.041.92
negemo1.941.721.841.912.893.05
anx0.30.260.270.260.280.31
anger0.60.60.590.60.670.77
sad0.340.310.350.330.380.34
certain1.030.991.080.941.040.99
differ1.581.561.581.71.931.69
percept1.341.381.341.341.211.43
see0.580.640.660.590.560.69
hear0.50.480.450.490.410.51
feel0.210.190.150.210.180.17
affiliation1.41.391.461.51.721.56
achieve1.091.061.261.221.161.04
power2.672.532.642.72.662.86
reward0.840.780.730.770.820.8
risk0.740.680.730.690.780.73
drives6.145.826.076.166.476.29
Likes7.135.435.047.732.467.31
Verified0.1230.330.2100.1880.180.16
Followers (Log)11.8379.62110.76510.21310.3419.321
Following (Log)14.31216.2114.21213.21115.12216.623
Near State0.0390.0360.0490.0360.0490.058
length107.3102.1283.269.5378.283.4
Table 5. Root Mean Square Error Values of Regression Algorithms for Prediction.
RMSEType 0Type 1Type 2Type 3Type 4Type 5
Linear Regression6.853.872.206.291.861.56
Negative Binomial Regression0.620.670.800.740.770.72
Table 6. Coefficients of all Features for the best Regression model of Each Type of Situational Information, and bold values in columns indicate the importance of the values and these values also indicate higher impact than other variables on the re-tweet variable.
FeaturesType 0Type 1Type 2Type 3Type 4Type 5
affect−6.939 −3.608
posemo0.11 1.943 1.7761.11
negemo −0.11 −2.8422.63
anx−2.082 −1.11
anger−1.249 −1.804 −2.35
sad 2.350
certain2.673 −1.388
differ −2.9840.776
percept 0.3180.163
see−4.441 −1.11−1.111.44
hear −3.331 1.99
feel −1.943−1.111.44
affiliation1.527 −3.469−1.18
achieve −1.35−4.09
power 1.55
reward −3.469
risk −1.735 −4.30
drives−1.665 1.457 1.41
Likes (Log)2.432.1233.6681.13.5711.107
Verified (Log)−1.4432.789−1.4996.272.054−5.829
Followers (Log)0.340.070.720.510.070.001
Following (Log) 2.002.00 2.000
Near State0.280.480.490.27 0.22
length2.0419.4812.124.319.853
Publisher’s Note: MDPI stays neutral with regard to jurisdictional claims in published maps and institutional affiliations.

