 Honglv Xu1†Yi Zhang2,3†
 Min Yuan4Liya Ma2,3Meng Liu2,3Hong Gan2,3Wenwen Liu2,3Gillian Gianna Anne Lum5
 Fangbiao Tao2,3,4*
- 1School of Medicine, Kunming University, Kunming, China
- 2Key Laboratory of Population Health Across Life Cycle, Ministry of Education of the People's Republic of China, Anhui Medical University, Hefei, China
- 3Department of Maternal, Child and Adolescent Health, School of Public Health, Anhui Medical University, Hefei, China
- 4School of Health Service Management, Center for Big Data Science in Health, Anhui Medical University, Hefei, China
- 5The Colonial War Memorial Hospital, Suva, Fiji
Objective: The aim of this study is to analyze the latent class of basic reproduction number (R0) trends of the 2019 novel coronavirus disease (COVID-19) in the major endemic areas of China.
Methods: The provinces that reported more than 500 cases of COVID-19 till February 18, 2020 were selected as the major endemic areas. The Verhulst model was used to fit the growth rate of cumulative confirmed cases. The R0 of COVID-19 was calculated using the parameters of severe acute respiratory syndrome (SARS) and COVID-19. The latent class of R0 was analyzed using the latent profile analysis (LPA) model.
Results: The median R0 calculated from the SARS and COVID-19 parameters were 1.84–3.18 and 1.74–2.91, respectively. The R0 calculated from the SARS parameters was greater than that calculated from the COVID-19 parameters (Z = −4.782 to −4.623, p < 0.01). Both R0 can be divided into three latent classes. The initial value of R0 in class 1 (Shandong Province, Sichuan Province, and Chongqing Municipality) was relatively low and decreased slowly. The initial value of R0 in class 2 (Anhui Province, Hunan Province, Jiangxi Province, Henan Province, Zhejiang Province, Guangdong Province, and Jiangsu Province) was relatively high and decreased rapidly. Moreover, the initial R0 value of class 3 (Hubei Province) was in the range between that of classes 1 and 2, but the higher R0 level lasted longer and decreased slowly.
Conclusion: The results indicated that the overall R0 trend is decreased with the strengthening of comprehensive prevention and control measures of China for COVID-19, however, there are regional differences.
Introduction
Of particular concern is the 2019 novel coronavirus disease (COVID-19) outbreak in Wuhan, Hubei province at the end of 2019, it is quickly spread to all over the country of China (1, 2). COVID-19 is an infectious disease caused by 2019-nCoV that can be transmitted through droplets, aerosols, and contact (3, 4). The main clinical features of the case are fever, dry cough, and fatigue. There are also mild features as well as asymptomatic pathogen carriers (5, 6). Evidence demonstrates that COVID-19 is extremely infectious even during the incubation period, and the entire population is susceptible (7, 8). It has a higher case-fatality rate and poses great threats to public health, and as a result it has attracted enormous concerns (9). According to previous studies, in the USA, the case-fatality rate for COVID-19 varies markedly by age, ranging from 0.3 death per 1,000 cases among patients aged from 5 to 17 years to 304.9 deaths per 1,000 cases among patients aged 85 years or older in the USA (10). Among the hospitalized patients in the intensive care units, the case fatality increases up to 40% (10). In addition, Yang et al. (9) reported that Wuhan had higher case fatality than other cities. Overall, a difference of the case-fatality rates was observed between different age groups, cities, and counties, at the rates more than 15% (11). At present, COVID-19 has become widespread around the globe (12, 13). For a new infectious disease, it is important to identify the epidemic characteristics and transmission dynamics of the disease, to implement appropriately for the prevention and control measures (14).
It is generally known that the basic reproduction number (R0) is an important parameter that studies the dynamics of infectious disease transmission by describing the ability to spread an infectious source (15, 16). R0 is defined as the average number of secondary cases produced by an infected subject over his/her infectious period in a susceptible and an uninfected population (17). There has been an increasing concern that the R0 of COVID-19 is used to assess the spread of infectious diseases, to predict epidemic trends and to evaluate the effectiveness of the prevention and control measures that have been established (18, 19). Although a few previous studies have investigated the R0 of COVID-19, the results of these previous studies on the R0 of COVID-19 were inconsistent (20–23). For instance, Wu et al. (20) used susceptible-exposed-infectious-recovered metapopulation model to analyze the confirmed cases from December 31, 2019 to January 28, 2020, the results reported that the R0 of COVID-19 was 2.68 (95%CI: 2.47–2.86); Zhao et al. (21) used an intrinsic growth rate (γ) to the analyzed R0 of the confirmed cases from January 10, 2020 to January 24, 2020, the results reported that the R0 of COVID-19 was in the range of 2.24–3.58 (21). Moreover, there is no research to explore the variance in the R0 of COVID-19 in the different regions of China. Consequently, this study analyzed the latent class of R0 of COVID-19 in the major endemic areas of China that reported more than 500 cases. The results of this study can evaluate the effectiveness of the prevention and control measures of China against COVID-19 to a certain extent and provide a support for previously related studies and a reference for other countries to learn from the prevention and control measures of China. In addition, it provides a basis for further prevention and control of COVID-19 and other emerging infectious diseases.
Materials and Methods
Materials
The major endemic areas of COVID-19 were defined as the areas where the cumulative number of cases of COVID-19 with more than 500 has been diagnosed within 24 h on February 18, 2020. These areas include Guangdong Province, Jiangxi Province, Hunan Province, Chongqing Municipality, Sichuan Province, Hubei Province, Anhui Province, Zhejiang Province, Jiangsu Province, Henan Province, and Shandong Province. We collected the cumulative number of cases of COVID-19 from official health commission websites, with the data on the main prevention and control measures for COVID-19 within these areas and sourced from provincial government websites.
Methods
The Verhulst model was used to fit the growth rate of the cumulative number of cases (24, 25). The Verhulst curvilinear equation is as follows:
where a, b, and c are the parameter constants and r is the growth rate. We calculated the R0 of COVID-19 using the following equation (26):
where r is the growth rate, IP is the incubation period, SI is the serial interval from the onset of case i to the infection of case ii. We calculated R0 based on the IP and SI of COVID-19 (reported by the Chinese Center for Disease Control and Prevention) and severe acute respiratory syndrome (SARS). The IP and SI of COVID-19 are 5.2 and 7.5, respectively (4). The IP and SI of SARS are 6.0 and 8.4, respectively (27). We described the changing trend of R0 with time in each province, and analyzed the latent class according to the trend of R0. Moreover, we gathered the major prevention and control measures for COVID-19 in each endemic area.
Statistical Analyses
All statistical analyses were performed using R (R-3.5.1, R Core Team) and Mplus (Mplus version 7.4). The methods used for an analysis included the descriptive statistical analysis method and the model estimation method. The Verhulst model was used to fit the growth rate of the cumulative number of cases and to calculate R0 in the R software. We used the range between minimum and maximum values, the 25th percentile (P25), the 50th percentile (P50), and the 75th percentile (P75) to describe the distribution of R0. The Wilcoxon signed-rank test was used to compare the differences of R0 calculated from the COVID-19 parameter and the SARS parameter. A latent profile analysis (LPA) was used to analyze the latent class of the R0 trend in the Mplus software.
Results
The Trend of the Cumulative Number of Cases
Figure 1 shows the trend of the cumulative number of COVID-19 It shows an S-shaped growth. The Hubei Province has the largest cumulative number of cases and the fastest growth. The trends of the cumulative number of cases in several other provinces except the case of Hubei Province were observed in the phenomenon of classification. The number of cases in class 1 (Henan Province, Zhejiang Province, and Guangdong Province) was relatively large and has increased rapidly. The number of cases in class 2 (Anhui Province, Hunan Province, and Jiangxi Province) and the growth rate were at a medium level. The number of cases in class 3 (Shandong Province, Jiangsu Province, Sichuan Province, and Chongqing Municipality) and the growth rate were relatively low. In general, the major endemic areas except the case of Hubei Province of COVID-19 in China reached the highest peaks of the “S” curve around February 15, 2020.
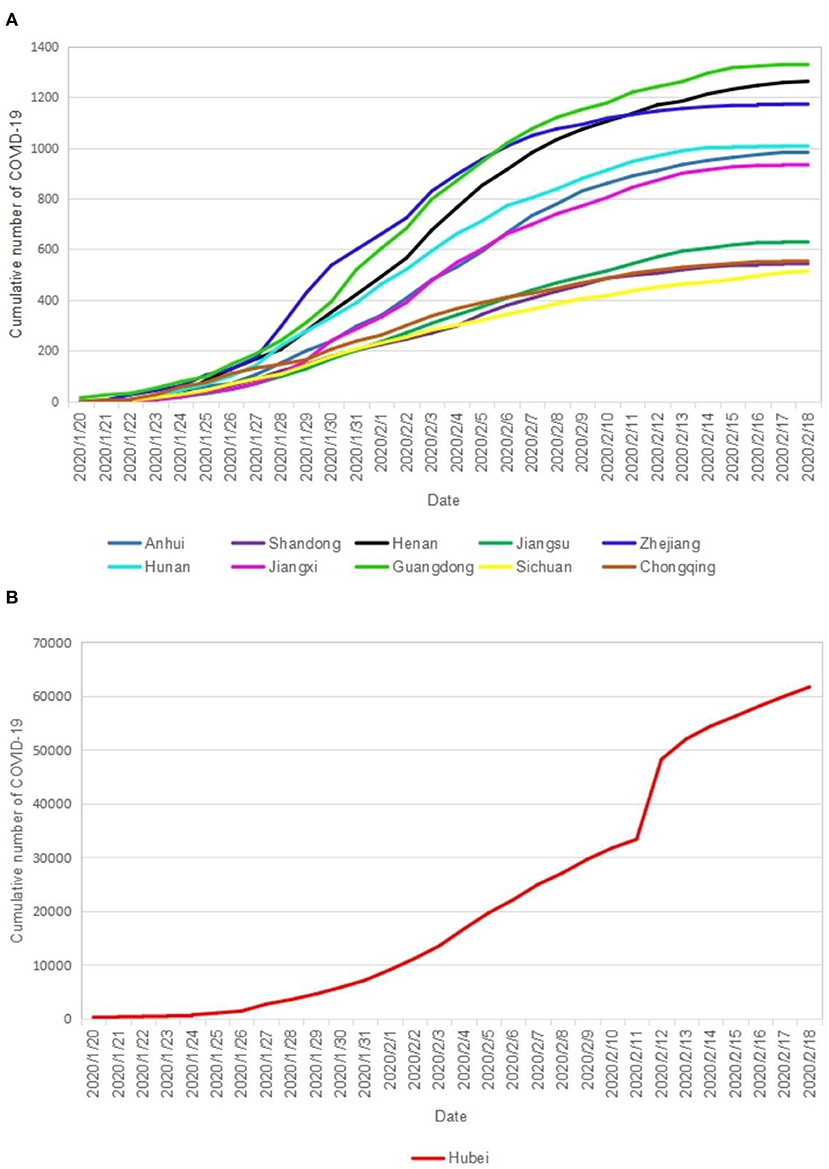
Figure 1. The cumulative number of COVID-19 in the major epidemic areas of China. (A) Cumulative number of COVID-19 in each province; (B) Cumualtive nember of COVID-19 everyday.
The Growth Rate Trend of the Cumulative Number of Cases
The growth rate of the cumulative number of COVID-19 in Hubei Province is 0.03–0.20. Especially, the growth rate of 0.24 continued until January 26, 2020, whereas the growth rate of 0.23–0.22 continued until January 31, 2020. Then, the growth rate shows a clear downward trend in Hubei Province. The initial growth rates (0.25–0.32) of all other provinces except the cases of Chongqing Municipality, Sichuan Province, and Shandong Province (the growth rates were 0.14–0.20) were higher than those of Hubei Province, however, these rates started to decline rapidly after 2–3 days (Figure 2).
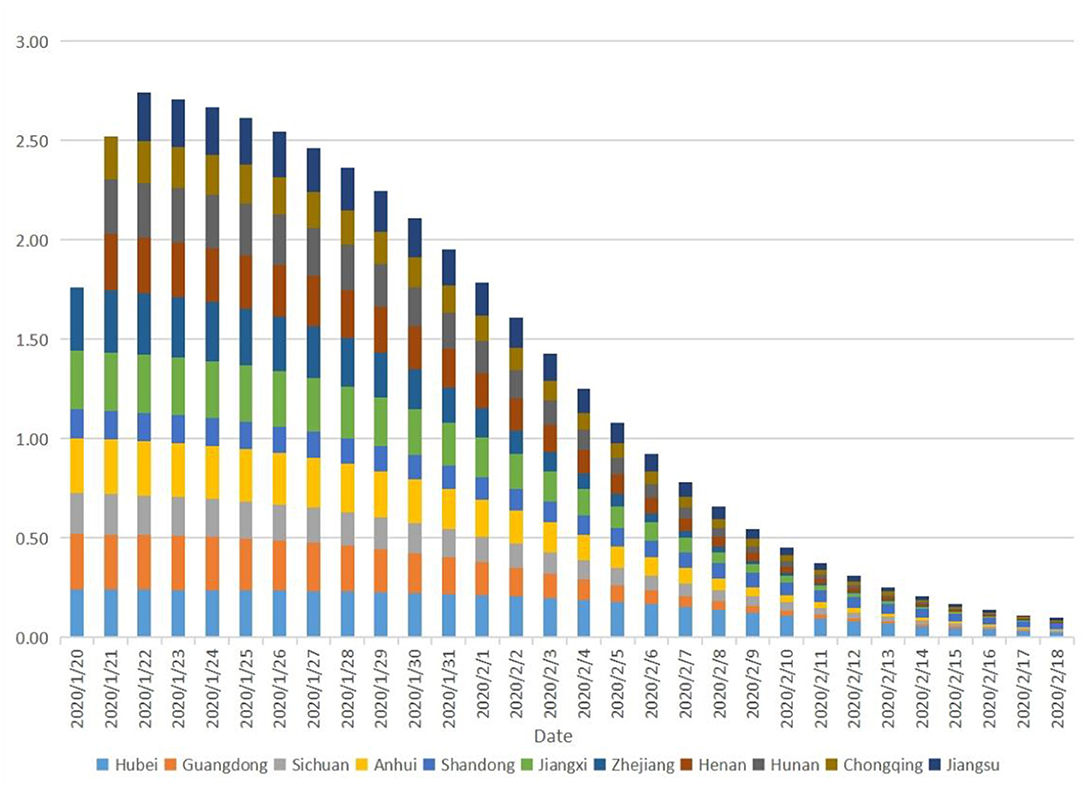
Figure 2. The growth rate of cumulative number of COVID-19.
The R0 Trend of COVID-19
Table 1 shows the distribution of R0. The median R0 calculated from the SARS parameters is 1.84–3.18, and the R0 calculated from the COVID-19 parameters is 1.74–2.91. Overall, the former is greater than the latter (Z=−4.782 to −4.623, p < 0.01). Figure 3 shows the R0 trend collected from the COVID-19 and SARS parameters. The trends of R0 calculated from the two parameters are basically consistent. It showed a gradual downward trend of R0 in each province from January 20, 2020 to February 18, 2020. The R0 in Hubei Province showed a slow decline before January 31, 2020, then showing a significant downward trend. The initial R0 in all other provinces except the cases of Chongqing Municipality, Sichuan Province, and Shandong Province was higher than that of Hubei Province, however, but the declining rate of R0 in all other provinces except the cases of Chongqing Municipality, Sichuan Province, and Shandong Province is higher than that of Hubei Province. As of February 18, 2020, except the cases of Hubei Province (R0 = 1.20) and Shandong Province (R0 = 1.21), R0 (1.01–1.06) were approximately equal to 1 in all other provinces.
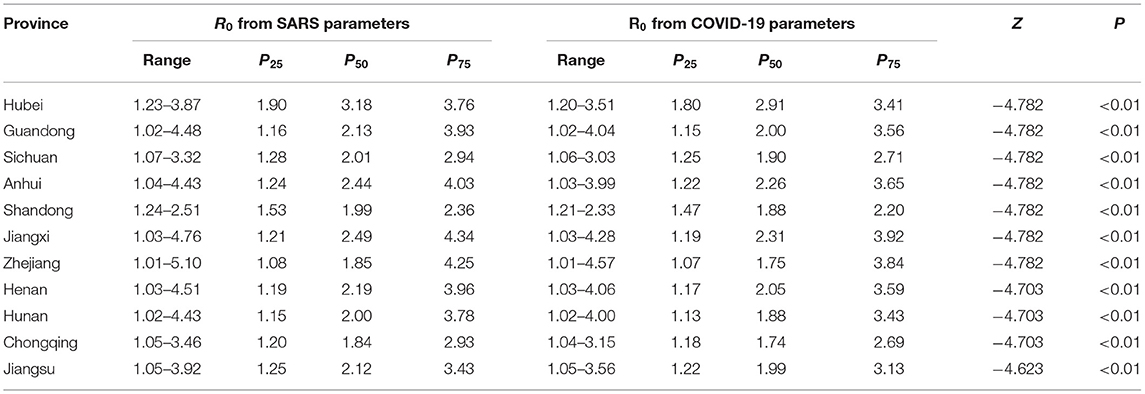
Table 1. The distribution of R0 of 2019 novel coronavirus disease (COVID-19).
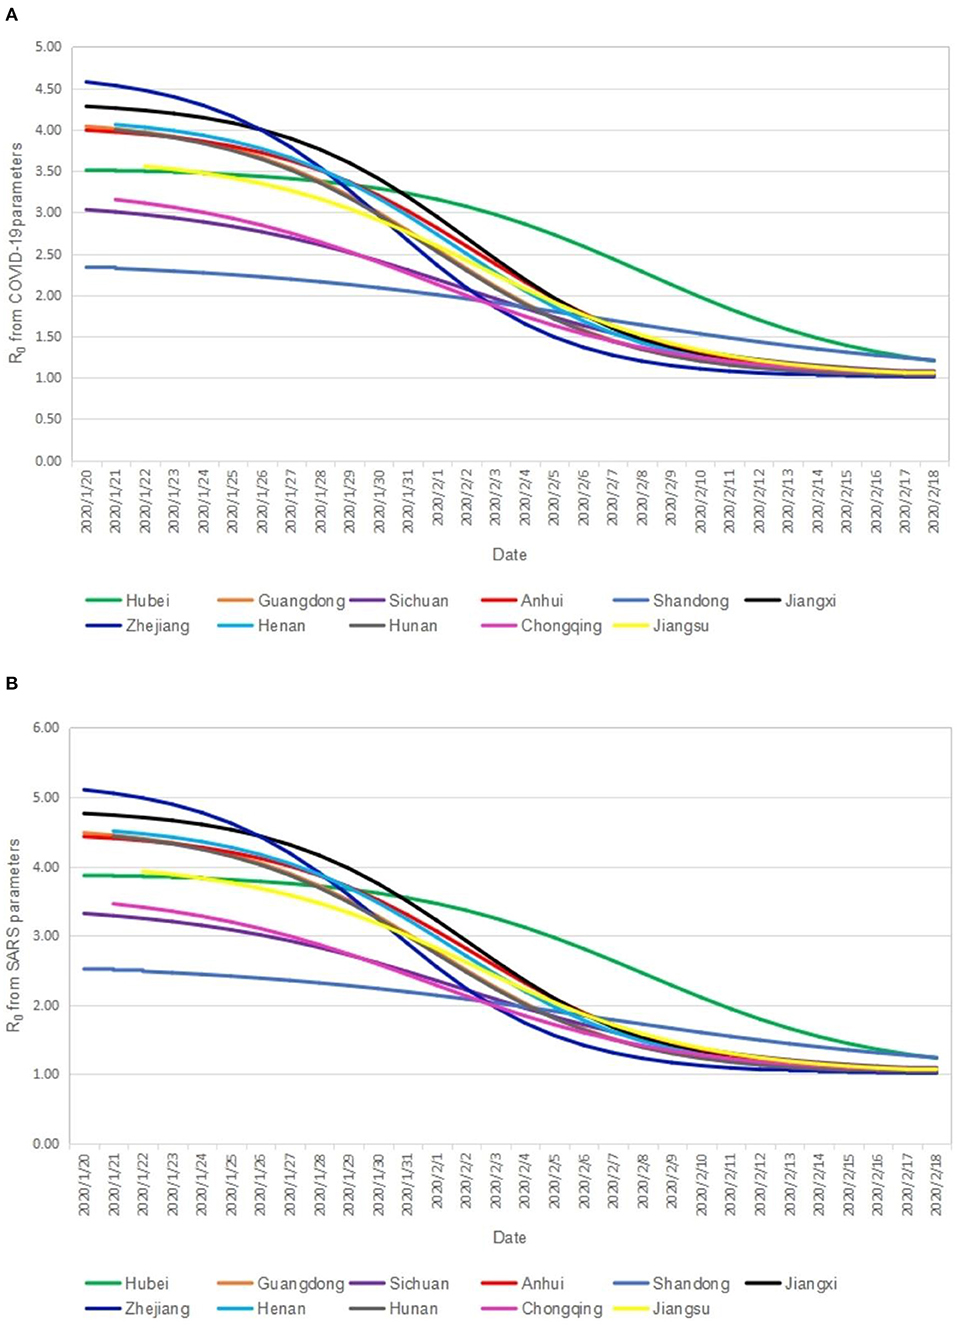
Figure 3. The R0 trend from COVID-19 and SARS parameters. (A) Cumulative number of COVID-19 in each province; (B) Cumualtive nember of COVID-19 everyday.
The Latent Class of R0
We constructed five latent class models in the LPA. The three-class model was finally selected according to the model fitting index, latent class probability, and the interpretability of the model. Table 2 presents the fitting index and latent class probability of the model. There are three latent classes of the R0 calculated from the SARS parameters and COVID-19 parameters. Class 1 includes Shandong Province, Sichuan Province, and Chongqing Municipality. Class 2 includes Anhui Province, Hunan Province, Jiangxi Province, Henan Province, Zhejiang Province, Guangdong Province, and Jiangsu Province. Class 3 includes Hubei Province. Figure 4 shows the R0 trend in different latent classes. The initial value of class 1 R0 was relatively low and decreased slowly. The initial value of class 2 R0 was relatively high and decreased rapidly. The initial value of class 3 R0 was in the range between classes 1 and 2, but high R0 levels lasted longer and declined slowly.
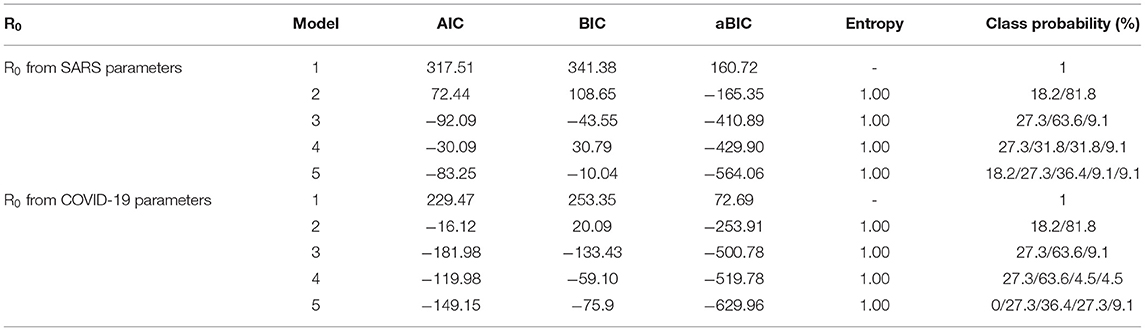
Table 2. The fitting index and latent class probability of the model.
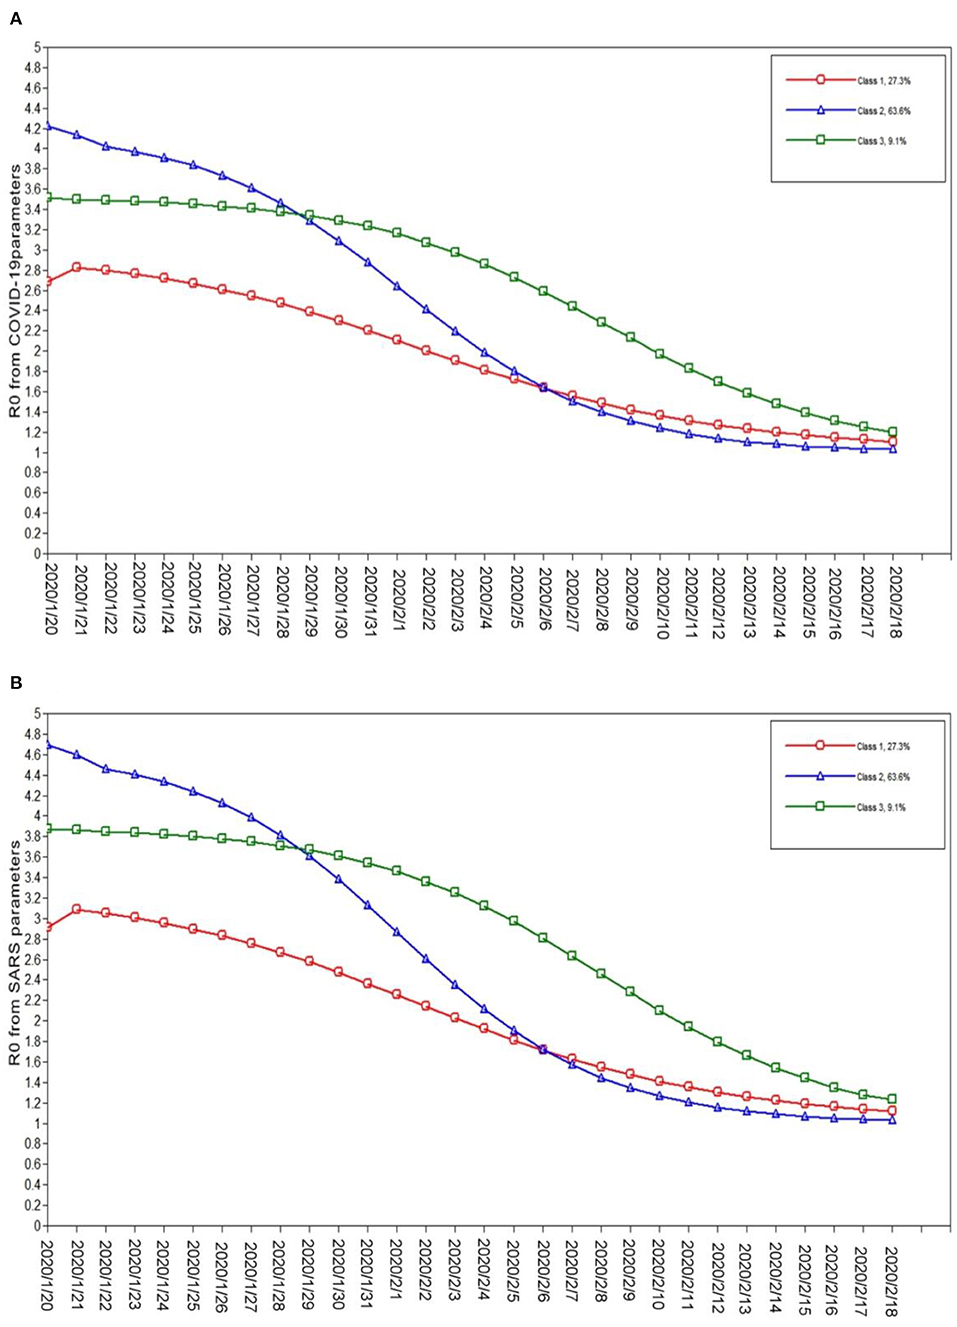
Figure 4. The latent class of R0 from COVID-19 and SARS parameters. (A) R0 from COVID-19 parameters everyday; (B) R0 from SARS parameters everyday.
Discussion
The present study suggests that the R0 of COVID-19 calculated from the SARS parameters is greater than the R0 calculated from the COVID-19 parameters (the medians of R0 are 1.84–3.18 and 1.74–2.91, respectively). Our findings may indicate that the epidemiological characteristics of COVID-19 and SARS are different. Coronavirus has caused three large-scale epidemics within the human population in the past 20 years, including SARS in 2002, Middle East respiratory syndrome (MERS) in 2012, and COVID-19 in 2019 (28, 29). From the number of infections, deaths, and endemic areas, COVID-19 threatens human health more than SARS and MERS (30–32). The R0 of COVID-19 in our study is lower than that of SARS (3.1–4.2) and MERS (2.0–6.7) (17, 33, 34). These findings are consistent with previous studies, which also demonstrate that the infection capacity of COVID-19 is lower than that of SARS and MERS (23). Additionally, the R0 calculated from the COVID-19 parameters in this work is similar to the R0 (2. 38–2.72 and 2.47–2.86) estimated in other studies in China (20, 35). In addition, it is also similar to the R0 (2.4–2.8) of COVID-19 in Japan (36). Nevertheless, our calculated R0 is lower than the estimated R0 using the epidemic values observed in the early epidemic period of COVID-19 within Wuhan (R0 = 1.4–3.9), Hubei Province (R0 = 2.80–4.48), and China as a whole (2.8–3.3) (23, 37).
Overall, the R0 of COVID-19 in each province is gradually decreasing. It is believed that the combined prevention and control measures adopted for COVID-19 by the Chinese government have brought about these obvious effects. We believe these combined prevention and control measures for COVID-19, which are put in place by the Chinese Government, can provide a reference for other countries in their fight against the deadly virus. These measures include activating first-level public health emergency response, wearing masks, conducting epidemiological investigations, screening of key populations, temporary traffic control, closing public places (e.g., cinemas, internet cafe, etc.), monitoring body temperature, symptom screening, medical observation, the “four early” measures (early detection, early reporting, early isolation, and early treatment), the “four concentrated” treatment measures (concentrated cases, concentrated experts, concentrated resources, and concentrated treatment), quarantine oneself, lockdown a city, disinfection in public areas, etc. There is substantial evidence that implementing these combined measures could significantly reduce the number of cases found within a country (38, 39). A study conducted in Singapore showed that these combined interventions will reduce the estimated number of infections in comparison with the baseline scenario by 99.3%, 93.0%, and 78.2% when R0 was 1.5, 2.0, and 2.5, respectively (39). Some researchers suggest that the isolation of cases, contact tracing, and social distancing can control outbreaks of infectious diseases (38). Specifically, contact tracing is believed to be a key factor in reducing the spread of the epidemic. A new study from the UK suggests that to control the majority of COVID-19 outbreaks, for an R0 of 3.5 more than 90% of the contacts had to be traced, and for an R0 of 2.5 more than 70% of the contacts had to be traced (40).
The results of the LPA reported that there are three latent classes of R0, and the trends of R0 in each latent class have their own unique characteristics. The observed findings indicate that although the Chinese government has adopted the overall prevention and control measures of “a board of chess in China, suit one's measures to local conditions,” the effects are not entirely consistent. Specifically, the initial value of R0 in class 1 was relatively low and had a slow decline. The possible explanations are that these areas have taken active measures after the COVID-19 epidemic in Wuhan, and the spread of COVID-19 was well controlled from the beginning. The initial R0 value in class 2 was relatively high and was even higher than that of Hubei Province. However, R0 declined rapidly, and the decline rate was the fastest among the three latent classes. The possible reason is that the measures adopted at the beginning of the epidemic of COVID-19 were not effective. Then, the epidemic was effectively controlled after quickly adjusting the measures in these areas, thus the infection capacity of COVID-19 decreased rapidly. The initial R0 value in class 3 (Hubei Province) was observed to be between that of types 1 and 2, but this higher R0 level lasted longer and decreased slowly. Wuhan city, Hubei Province, is the first area in China where COVID-19 was found to be endemic. Due to the lack of understanding of the emerging infectious disease pathogens, transmission routes, susceptible populations, disease characteristics, epidemic characteristics, and other unknown reasons, the R0 of COVID-19 lasted longer at higher levels in Hubei Province. In other words, before January 31, 2020, Hubei Province COVID-19 was strongly infective. Therefore, our findings agree that the adoption of active prevention and control measures at the beginning of the epidemic can effectively control the spread of COVID-19.
What is more, the R0 of COVID-19 in Hubei Province and Shandong Province were approximately 1.2 by February 18, 2020, presenting that there is still a certain risk of transmission within these provinces. The R0 (1.01–1.06) in other provinces were approximately equal to 1 or greater than 1. It is widely recognized that R0 can reflect the endemic trend of infectious diseases. When R0 > 1, the greater the R0, the greater the infectious ability of these diseases, and the greater the number of cases. When R0 < 1, it means that the epidemic of infectious diseases will gradually come to an end. The optimal target of effective interventions is to control the R0 at a value < 1 (41). At present, because the population of China has gradually resumed work and school, population movement and crowd accumulation make it difficult to properly implement prevention and control measures, which ultimately increase the risks of COVID-19 transmissions within the country and also the difficulty of prevention and control. Furthermore, COVID-19 is an epidemic that has spread to many countries around the world, with international import cases giving rise to the possibility of a secondary epidemic (42, 43). Consequently, China also needs to continue to strengthen its prevention and control for COVID-19.
In this study, the R0 of COVID-19 was simulated by searching the confirmed cases and objective case data from the provinces closely related to Hubei Province (such as provinces with major transportation hubs and provinces with migrant workers moving within them) and to combine the methods mentioned in previous studies with the latent category method. The results of the three categories also show that the population distribution and economic conditions of different cities (20) also determine the infection rate and transmission rate of COVID-19. Despite the identification of human-to-human transmission and the reporting of exponential increases in the number of cases, forecasting is critical for national and international public health planning and control. At present, there is no good treatment available, however, timely understanding of the prevalence of COVID-19 with public awareness on preventative measures will help. Our study can provide the government with a more comprehensive chart of the epidemic trend and corresponding measures, and also provide side information for the storage of medical resources and clinical diagnosis and treatment. In China, COVID-19 in the regions other than Hubei Province showed a substantial control of the virus transmission rates. However, the possibility of imported infection and transmission was higher than before, in addition, because, at the time of this work, there was neither a vaccine nor a specific drug treatment for COVID-19, a range of public health (non-pharmaceutical) interventions has been used to control the epidemic (44).
The present study has several strengths and limitations. The main strength of this work was to calculate the R0 based on the epidemic data of major endemic areas of China as of February 18, 2020. However, previous research on R0 was mostly predicted and estimated based on the limited epidemiological data of COVID-19 in Wuhan in the early days. Another strength was an analysis of the latent class of R0 and explored the regional differences in prevention and control effects. The findings presented in this study have implications for the preliminary evaluation of the effectiveness of prevention and control measures for COVID-19 adopted in China. In addition, the research results can provide knowledge for other countries on how to respond to COVID-19, and also provide a support for previous prediction studies. There are several limitations to our study. Firstly, the calculation of R0 was affected by multiple parameters and various factors (41). And yet, the factors considered are relatively single in this study. Additional research is necessary to confirm the accuracy of R0, considering the large uncertainties around the estimates of R0 and the duration of infectiousness (45, 46). Secondly, there are many methods for calculating R0 in the world (18), but this study did not use multiple methods to compare the results. In the susceptible-exposed-infected-removed model, the R0 of COVID-19 was a little higher than that of SARS (23). Wang et al. (37) used the exponential growth method to estimate R0, the results showed that the R0 of COVID-19 was 2.95 (95%CI: 2.86–3.03) after taking control measures. One study used a susceptible-exposed-infectious-recovered metapopulation model to simulate the R0 for COVID-19, which was 2.68 (95%CI: 2.47–2.86) (20). In our study, we choose a new-structure gray Verhulst model that has a better structure and stronger modeling ability; overcoming the shortcomings of traditional Verhulst model, including parameter dislocation and unreasonable selection of initial values. We used another method to supplement the previous study, which laterally validated and supplemented the previous results. However, it should be noted that if other methods are used to calculate R0 in this study, the results may be different. Thirdly, although this study discusses the prevention and control measures for COVID-19 in the major endemic areas of China, it is difficult to quantitatively evaluate the effects of various measures.
Conclusion
Overall, we found that the R0 of COVID-19 shows a downward trend in the major endemic areas of China, and there are regional differences (three latent classes). Actively adoption of combined prevention and control measures in the early stages of the epidemic can effectively control COVID-19.
Data Availability Statement
The datasets presented in this study can be found in online repositories. The names of the repository/repositories and accession number(s) can be found in the article/Supplementary Material.
Ethics Statement
Ethical approval was not required as this study is an analysis of public case data. The patients/participants provided their written informed consent to participate in this study.
Author Contributions
FT designed the study. HX took primary responsibility for writing the manuscript, managed the literature searches and analyses, and undertook the statistical analysis. MY, LM, ML, YZ, WL, and HG undertook the acquisition of the data. YZ revised the manuscript. GL edited the English Version of this manuscript. All authors contributed to and approved the final manuscript.
Funding
This work was supported by the Anhui Medical University Emergency Key Research Project for Novel Coronavirus Pneumonia (YJGG202001) and Emergency Research Project, Anhui Provincial Department of Science and Technology, Anhui Provincial Health Commission (202004a07020002).
Conflict of Interest
The authors declare that the research was conducted in the absence of any commercial or financial relationships that could be construed as a potential conflict of interest.
Publisher's Note
All claims expressed in this article are solely those of the authors and do not necessarily represent those of their affiliated organizations, or those of the publisher, the editors and the reviewers. Any product that may be evaluated in this article, or claim that may be made by its manufacturer, is not guaranteed or endorsed by the publisher.
Acknowledgments
This manuscript has been released as a pre-print at medRxiv (https://doi.org/10.1101/2020.04.13.20060228).
Supplementary Material
The Supplementary Material for this article can be found online at: https://www.frontiersin.org/articles/10.3389/fpubh.2021.575315/full#supplementary-material
References
1. Liu K, Fang YY, Deng Y, Liu W, Wang MF, Ma JP, et al. Clinical characteristics of novel coronavirus cases in tertiary hospitals in Hubei Province. Chin Med J. (2020) 133:1025-31. doi: 10.1097/CM9.0000000000000744
2. Lu R, Zhao X, Li J, Niu P, Yang B, Wu H, et al. Genomic characterisation and epidemiology of 2019 novel coronavirus: implications for virus origins and receptor binding. Lancet. (2020) 395:565–74. doi: 10.1016/S0140-6736(20)30251-8
3. Chen N, Zhou M, Dong X, Qu J, Gong F, Han Y, et al. Epidemiological and clinical characteristics of 99 cases of 2019 novel coronavirus pneumonia in Wuhan, China: a descriptive study. Lancet. (2020) 395:507–13. doi: 10.1016/S0140-6736(20)30211-7
4. Li JY, You Z, Wang Q, Zhou ZJ, Qiu Y, Luo R, et al. The epidemic of 2019-novel-coronavirus (2019-nCoV) pneumonia and insights for emerging infectious diseases in the future. Microbes Infect. (2020) 22:80–5. doi: 10.1016/j.micinf.2020.02.002
5. Guo YR, Cao QD, Hong ZS, Tan YY, Chen SD, Jin HJ, et al. The origin, transmission and clinical therapies on coronavirus disease 2019 (COVID-19) outbreak - an update on the status. Mil Med Res. (2020) 7:11. doi: 10.1186/s40779-020-00240-0
6. Huang C, Wang Y, Li X, Ren L, Zhao J, Hu Y, et al. Clinical features of patients infected with 2019 novel coronavirus in Wuhan, China. Lancet. (2020) 395:497–506. doi: 10.1016/S0140-6736(20)30183-5
7. Nishiura H, Linton NM, Akhmetzhanov AR. Serial interval of novel coronavirus (COVID-19) infections. Int J Infect Dis. (2020) 93:284-6. doi: 10.1101/2020.02.03.20019497
8. Thompson RN. Novel coronavirus outbreak in Wuhan, China, 2020: intense surveillance is vital for preventing sustained transmission in new locations. J Clin Med. (2020) 9:498. doi: 10.3390/jcm9020498
9. Yang S, Cao P, Du P, Wu Z, Zhuang Z, Yang L, et al. Early estimation of the case fatality rate of COVID-19 in mainland China: a data-driven analysis. Ann Transl Med. (2020) 8:128. doi: 10.21037/atm.2020.02.66
10. Wiersinga WJ, Rhodes A, Cheng AC, Peacock SJ, Prescott HC. Pathophysiology, transmission, diagnosis, and treatment of coronavirus disease 2019 (COVID-19): a review. JAMA. (2020) 324:782–93. doi: 10.1001/jama.2020.12839
11. Bulut C, Kato Y. Epidemiology of COVID-19. Turkish J Med Sci. (2020) 50:563–70. doi: 10.3906/sag-2004-172
12. Sommer P, Lukovic E, Fagley E, Long D, Sobol J, Heller K, et al. Initial clinical impressions of the critical care of COVID-19 patients in Seattle, New York City, and Chicago. Anesth Analg. (2020) 131:55–60. doi: 10.1213/ANE.0000000000004830
13. Sorbello M, El-Boghdadly K, Di Giacinto I, Cataldo R, Esposito C, Falcetta S, et al. The Italian COVID-19 outbreak: experiences and recommendations from clinical practice. Anaesthesia. (2020) 75:724–32. doi: 10.1111/anae.15049
14. Kannan S, Shaik SAP, Sheeza A, Hemalatha K. COVID-19 (Novel Coronavirus 2019) - recent trends. Eur Rev Med Pharmacol Sci. (2020) 24:2006–11. doi: 10.26355/eurrev_202002_20378
15. Ganyani T, Faes C, Chowell G, Hens N. Assessing inference of the basic reproduction number in an SIR model incorporating a growth-scaling parameter. Stat Med. (2018) 37:4490–506. doi: 10.1002/sim.7935
16. Sato K. Basic reproduction number of SEIRS model on regular lattice. Math Biosci Eng. (2019) 16:6708–27. doi: 10.3934/mbe.2019335
17. Chang HJ. Estimation of basic reproduction number of the Middle East respiratory syndrome coronavirus (MERS-CoV) during the outbreak in South Korea, (2015). Biomed Eng Online. (2017) 16:79. doi: 10.1186/s12938-017-0370-7
18. Chowell G, Nishiura H, Bettencourt LM. Comparative estimation of the reproduction number for pandemic influenza from daily case notification data. J R Soc Interface. (2007) 4:155–66. doi: 10.1098/rsif.2006.0161
19. Park SW, Bolker BM. A note on observation processes in epidemic models. Bull Math Biol. (2020) 82:37. doi: 10.1007/s11538-020-00713-2
20. Wu JT, Leung K, Leung GM. Nowcasting and forecasting the potential domestic and international spread of the 2019-nCoV outbreak originating in Wuhan, China: a modelling study. Lancet. (2020) 395:689–97. doi: 10.1016/S0140-6736(20)30260-9
21. Zhao S, Lin Q, Ran J, Musa SS, Yang G, Wang W, et al. Preliminary estimation of the basic reproduction number of novel coronavirus (2019-nCoV) in China, from 2019 to 2020: a data-driven analysis in the early phase of the outbreak. Int J Infect Dis. (2020) 92:214–7. doi: 10.1101/2020.01.23.916395
22. Zhao S, Chen H. Modeling the epidemic dynamics and control of COVID-19 outbreak in China. Quant Biol. (2020) 8:1–9. doi: 10.1007/s40484-020-0199-0
23. Zhou T, Liu Q, Yang Z, Liao J, Yang K, Bai W, et al. Preliminary prediction of the basic reproduction number of the Wuhan novel coronavirus 2019-nCoV. J Evid Based Med. (2020) 13:3–7. doi: 10.1111/jebm.12376
24. Tang L, Lu Y. Study of the grey Verhulst model based on the weighted least square method. Phys A Stat Mech App. (2020) 545:123615. doi: 10.1016/j.physa.2019.123615
25. Zeng B, Tong M, Ma X. A new-structure grey Verhulst model: Development and performance comparison. Appl math model. (2020) 81:522–37. doi: 10.1016/j.apm.2020.01.014
26. Wallinga J, Lipsitch M. How generation intervals shape the relationship between growth rates and reproductive numbers. Proc Biol Sci. (2007) 274:599–604. doi: 10.1098/rspb.2006.3754
27. Lipsitch M, Cohen T, Cooper B, Robins JM, Ma S, James L, et al. Transmission dynamics and control of severe acute respiratory syndrome. Science. (2003) 300:1966–70. doi: 10.1126/science.1086616
28. Dye C, Gay N. Epidemiology. Modeling the SARS epidemic. Science. (2003) 300:1884–5. doi: 10.1126/science.1086925
29. Zaki AM, van Boheemen S, Bestebroer TM, Osterhaus AD, Fouchier RA. Isolation of a novel coronavirus from a man with pneumonia in Saudi Arabia. N Engl J Med. (2012) 367:1814–20. doi: 10.1056/NEJMoa1211721
30. Memish ZA, Perlman S, Van Kerkhove MD, Zumla A. Middle East respiratory syndrome. Lancet. (2020) 395:1063-77. doi: 10.1016/S0140-6736(19)33221-0
31. Sayed AS, Malek SS, Abushahba MF. Seroprevalence of Middle East respiratory syndrome coronavirus virus in dromedaries and their traders in upper Egypt. J Infect Dev Ctries. (2020) 14:191–8. doi: 10.3855/jidc.10862
32. Wilder-Smith A, Chiew CJ, Lee VJ. Can we contain the COVID-19 outbreak with the same measures as for SARS? Lancet Infect Dis. (2020) 20:e102-7. doi: 10.1016/S1473-3099(20)30129-8
33. Wallinga J, Teunis P. Different epidemic curves for severe acute respiratory syndrome reveal similar impacts of control measures. Am J Epidemiol. (2004) 160:509–16. doi: 10.1093/aje/kwh255
34. Majumder MS, Rivers C, Lofgren E, Fisman D. Estimation of MERS-coronavirus reproductive number and case fatality rate for the spring 2014 Saudi Arabia outbreak: insights from publicly available data. PLoS Curr. (2014) 6:1–11.
35. Geng H, Xu A, Wang X, Zhang Y, Yin X, Ma M, et al. Analysis of the role of current prevention and control measures in the epidemic of new coronavirus based on the SEIR model. J Jinan Univ. (2020) 41:1–7.
36. Kuniya T. Prediction of the epidemic peak of coronavirus disease in Japan, (2020). J Clin Med. (2020) 9:789. doi: 10.3390/jcm9030789
37. Wang Y, You XY, Wang YJ, Peng LP, Du ZC, Gilmour S, et al. Estimating the basic reproduction number of COVID-19 in Wuhan, China. Chin J Epidemiol. (2020) 41:476–9. doi: 10.3760/cma.j.cn112338-20200210-00086
38. Anderson RM, Heesterbeek H, Klinkenberg D, Hollingsworth TD. How will country-based mitigation measures influence the course of the COVID-19 epidemic? Lancet. (2020) 395:931–4. doi: 10.1016/S0140-6736(20)30567-5
39. Koo JR, Cook AR, Park M, Sun Y, Sun H, Lim JT, et al. Interventions to mitigate early spread of SARS-CoV-2 in Singapore: a modelling study. Lancet Infect Dis. (2020) 20:678–88. doi: 10.1016/S1473-3099(20)30162-6
40. Hellewell J, Abbott S, Gimma A, Bosse NI, Jarvis CI, Russell TW, et al. Feasibility of controlling COVID-19 outbreaks by isolation of cases and contacts. Lancet Glob Health. (2020) 8:e488–96. doi: 10.1016/S2214-109X(20)30074-7
41. Delamater PL, Street EJ, Leslie TF, Yang YT, Jacobsen KH. Complexity of the basic reproduction number (R0). Emerg Infect Dis. (2019) 25:1–4. doi: 10.3201/eid2501.171901
42. Lai CC, Shih TP, Ko WC, Tang HJ, Hsueh PR. Severe acute respiratory syndrome coronavirus 2 (SARS-CoV-2) and coronavirus disease-2019 (COVID-19): the epidemic and the challenges. Int J Antimicrob Agents. (2020) 55:105924. doi: 10.1016/j.ijantimicag.2020.105924
43. Palacios CM, Santos E, Velazquez CM, Leon JM. COVID-19, a worldwide public health emergency. Rev Clin Esp. (2020) 221:55–61. doi: 10.1016/j.rceng.2020.03.001
44. Tian H, Liu Y, Li Y, Wu CH, Chen B, Kraemer M, et al. An investigation of transmission control measures during the first 50 days of the COVID-19 epidemic in China. Science. (2020) 368:638–42. doi: 10.1126/science.abb6105
45. Rebuli NP, Bean NG, Ross JV. Estimating the basic reproductive number during the early stages of an emerging epidemic. Theor Popul Biol. (2018) 119:26–36. doi: 10.1016/j.tpb.2017.10.004
Keywords: 2019 novel coronavirus disease, basic reproduction number, latent categories, trends, epidemiology
Citation: Xu H, Zhang Y, Yuan M, Ma L, Liu M, Gan H, Liu W, Lum GGA and Tao F (2021) Basic Reproduction Number of the 2019 Novel Coronavirus Disease in the Major Endemic Areas of China: A Latent Profile Analysis. Front. Public Health 9:575315. doi: 10.3389/fpubh.2021.575315
Received: 03 September 2020; Accepted: 11 August 2021;
Published: 14 September 2021.
Edited by:
Joao Sollari Lopes, National Statistical Institute of Portugal, PortugalCopyright © 2021 Xu, Zhang, Yuan, Ma, Liu, Gan, Liu, Lum and Tao. This is an open-access article distributed under the terms of the Creative Commons Attribution License (CC BY). The use, distribution or reproduction in other forums is permitted, provided the original author(s) and the copyright owner(s) are credited and that the original publication in this journal is cited, in accordance with accepted academic practice. No use, distribution or reproduction is permitted which does not comply with these terms.
*Correspondence: Fangbiao Tao, taofangbiao@126.com
†These authors have contributed equally to this work