
Soft computing and image processing techniques for COVID-19 prediction in lung CT scan images
Abstract
COVID-19 is a contagious respiratory illness that can be passed from person to person. Because it affects the lungs, damages blood arteries, and causes cardiac problems, COVID-19 must be diagnosed quickly. The reverse transcriptase polymerase chain reaction (RT-PCR) is a method for detecting COVID-19, but it is time consuming and labor expensive, as well as putting the person collecting the sample in danger. As a result, clinicians prefer to use CT scan and Xray images. COVID-19 classification can be done manually, however AI makes the process go faster. AI approaches include image processing, machine learning, and deep learning. An AI model is required to diagnose COVID-19, and a dataset is necessary to train that model. A dataset consists of the information from which the model is trained. This paper consists of the review of different image processing, machine learning and deep learning papers proposed by different researchers. As well as models based on deep learning and pretrained model using gradient boosting algorithm The goal of this paper is to provide information for future researchers to work with.

1.Introduction
Humans have encountered many contagious diseases throughout history, resulting in pandemics and epidemics [1]. There were no advanced answers to these difficulties in the past, which resulted in several negative human consequences. COVID-19 [2] is a novel disease kind that has arisen. It’s a member of the SARS family [3]. According to WHO, there were 198,778,175 confirmed cases of COVID-19 as of mid-August 2021, with 4,235,559 deaths and a total of 3,886,112,928 vaccination doses [4]. However, unlike in the past, there are now significantly more effective methods for detecting and diagnosing COVID-19, including RTPCR [5]. However, RT-PCR is not only time expensive, but it also has a high false negative rate [6]. As the prevalence of covid 19 grows, a better approach is required to address these issues. This is where AI [7] comes in. In the past, AI has proven to be extremely beneficial in the medical field [8]. AI has come a long way. In [147]. Elleuch Mohamed et al. employed a pre-trained VGG-16 architecture to recognise characteristics in plant leaves in agricultural fields. Valappil et al. applied CNN-SVM machine learning method [148] for vehicle detection utilising Unmanned aerial vehicles (UAVs). For Arabic word detection from natural photos, Oulladji et al. used ensemble learning approaches such as Support Vector Machine, Neural Networks, and Adaboost boosting algorithm in [149]. However, because AI alone cannot solve the problem, CT scan and X-ray images are used. Using CT scan images and transfer learning techniques, Souza et al. utilized Mask R-CNN for lung segmentation in 2021 [150]. In the medical industry, CT scan and CXR images are employed for a variety of purposes [9, 10]. Deep Learning [11], Machine Learning [12], and Image Processing [13] are some of the AI technologies that can be utilised to distinguish COVID-19 patients from CAP (Community Acquired Patients) [14].
This paper discusses a few ways for detecting COVID-19 in CT scan and X-ray images utilising Machine Learning, Image Processing, and Deep Learning techniques. The models that we implemented using Deep Learning and Pretrained models are also included in this work [15]. Websites such as IEEE Xplore, SpringerLink, and Arvix were used to choose the papers. Google Scholar was utilised to find papers, and the key words used were COVID-19, CNN, Machine Learning, Image Processing, Deep Learning Techniques, Pretrained model and Datasets. The purpose of this publication is to give future scholars with knowledge about COVID-19 prediction via AI techniques and also predict COVID-19 with different AI technique. To work with these models, there should be a suitable dataset; the dataset should be divided into training and testing sets at a ratio of 10:90, but this might vary depending on the model. ImageNet is one of the datasets which has over 10 million images [112]. The data that is used to train the model, also known as seen data, is data that is processed repeatedly in order to enhance the model’s accuracy. The data used to evaluate whether the model is performing properly or not is known as testing data or unseen data. To minimise overfitting, the dataset is sometimes segregated into validation data, which is used to validate the data after using the testing data to ensure that the model is not becoming accustomed to the testing data. It occurs as a result of the model being trained in the training data for an excessive amount of time. It removes irrelevant data from the training data and adjusts the model’s memory to be as near to it as possible. Overfitting is caused by a low error rate in training data and a high error rate in testing data. Underfitting refers to when a model is unable to create a relationship in the model, resulting in a high error rate in both training and testing data. It is caused by a model that is too simplistic, has been trained insufficiently, or has a dataset with insufficient characteristics. It is also created by forcing the model to end training in order to minimise overfitting. This procedure is known as early stopping. To prevent the issues of underfitting and overfitting, the machine learning algorithm should ensure that the data fits the model perfectly. The first section of this paper consists of Introduction, the second section provides information about different research papers of deep learning techniques, the third section provides information about different studies which have used image processing technique, fourth section mentions the different papers that have been used in this study using machine learning techniques. Fifth section is about our COVID-19 prediction pretrained model. Sixth section is about our deep learning model for COVID-19 prediction, seventh section is the comparison table of different papers. Eight section is conclusion and Ninth Section is References.
2.Methods for deep learning technique
Neural networks are the most common deep learning method. Deep learning is utilized in image recognition, speech recognition, and other applications. It’s also used to categorize things. Deep learning is a subset of machine learning, in which basic concepts are employed to train the model, whereas artificial neural networks are utilized to mimic human behaviour in deep learning. The number of layers in an ANN indicates how deep the network is. The neural network works in a similar fashion to the brain. Artificial neural networks, like neurons in the brain, include nodes that carry signals. Thousands of these nodes are connected to each other and carry the signals all over the place. Deep learning, as a result, necessitates the use of sophisticated hardware. When there are several output categories, the dataset should be labelled dataset. Because the dataset being used is so enormous, training takes a long time, sometimes even weeks. As a result, several researchers apply transfer learning techniques to overcome the time problem. Transfer learning is the act of taking an existing model that has previously been trained for a short period of time and then inputting new data into the model that the researchers want to model by making modest changes to the network. The time it takes to train the model is reduced to hours or potentially a few days because the model has already been taught for a while and does not have to start from scratch. Deep learning is used for feature extraction, and the performance of deep learning models can be improved by using GPUs.
1. Convolutional Neural Networks (CNN) [16] – Convolution layers, pooling layers, and fully connected layers are among the building components of the CNN architecture. A typical design comprises of one or more completely linked layers followed by a stack of many convolution layers and a pooling layer. Forward propagation refers to the process of transforming input data into output data using these layers. Because a feature can appear anywhere in the image, CNNs are extremely efficient for image processing. Extracted features can evolve hierarchically and progressively more complicated as one layer feeds its output into the next layer. Training is the process of adjusting parameters like kernels in order to reduce the disparity between outputs and ground truth labels using optimization algorithms like backpropagation and gradient descent, among others.
2. DenseNet [17] – DenseNets takes advantage of the network’s potential by reusing features, resulting in condensed models that are simple to train and extremely parameter efficient. Concatenating feature-maps learned by distinct layers improves efficiency and enhances variety in the input of following levels.
3. MobileNet [18] – MobileNets are built on a simplified design that builds light weight deep neural networks using depth-wise separable convolutions. With the exception of the final fully connected layer, which has no nonlinearity and feeds into a softmax layer for classification, all layers are followed by batchnorm and ReLU nonlinearity.
4. Xception [19] – A linear stack of depthwise separable convolution layers with residual connections makes up the Xception architecture. This makes it very simple to specify and adjust the architecture.
5. Inception [20] – The Inception module’s goal is to make this process easier and more efficient by breaking it down into a set of operations that look at cross-channel correlations and spatial correlations separately.
6. ResNet [21] – Residual learning frameworks are simple to train and cope with overfitting concerns in networks that are significantly deeper than those employed in prior techniques. They are used as the backbone of the majority of systems. It is a deep CNN architecture with the idea of layer skipping, also known as identity shortcut connection.
7. VGG [22] – These are pretrained models i.e., models are already trained, VGG16 has 16 layers (13 convolutional and 3 fully connected layers) and VGG19 which has 19 layers (16 convolutional and 3 fully connected layers).
8. Lenet-5 [23] – It is a pretrained model which has 5 layers.
9. EfficientNet [24] – EfficientNets are a family of models that use neural architecture to create a new baseline network and scale it up to achieve considerably greater accuracy and efficiency than prior ConvNets [25].
10. AlexNet [27] – First architecture that used Convolutional layers.
11. GoogleNet [28] – It is an google architecture.
12. U-Net [29] – The U-Net design is made up of two paths: a contracting path and an expansive path, with the layers from the contracting path concatenated to the expansive path. It has a U-shape to it.
Zhao et al. suggested [119] in 2020. They provided datasets and used DenseNet to create their model, which had an accuracy of 84.7 and precision of 97 using CT scan pictures. In 2020, Hilmizen et al. proposed [31] for covid 19 detection using CT scan and X-ray images. They used various models such as ResNet, DenseNet, and others, but the best results were obtained by combining ResNet50 and VGG16, as well as by combining Densenet121 and MobileNet. Both methods had a similar accuracy of 99.87 and sensitivity of 99.74. Islam and Matin proposed [32] in 2020 that they employed Lenet CNN for COVID-19 detection and achieved accuracy of 86.06 percent and precision of 85 percent with CT Scan images. Anwar and Zakir proposed [33] in 2020 that they used EfficientNet b4 with CT Scan pictures to detect COVID-19. They employed three learning rates: plateau, cyclic, and constant, however plateau produced the best results, with an accuracy of 0.90. Sari et al. proposed [34] in 2020, using CNN with CT scan pictures to achieve a precision of 98.0 and an accuracy of 97.57. Tabik et al. suggested [37] in 2020, using COVID-SDNET, which combines many approaches such as ResNet, U-Net, FuCiTNET [38], and CNN, to achieve an accuracy of 81.00 percent. In 2020, Khan et al. employed inflated Inception and ResNet50 with CT scan images for COVID-19 detection [39], with an accuracy of 0.84. They used two separate datasets, CC-19 and Covid-CT. In 2020 [40], James and Sunyoto employed CLAHE (Contrast Limited Adaptive Histogram Equalization) [41] in conjunction with CNN to achieve an accuracy of 83.28 percent and precision of 81.57 percent. In 2020, Dastider et al. proposed [42] that they used Otsu Thresholding [43] and CNN in their work for not only COVID-19 detection but also for distinguishing between normal, COVID-19, Viral Pneumonia, Bacterial Pneumonia, and Mycoplasma Pneumonia patients using CT scan images while also working with ResNet152V2 as backbone for their ResCovNet architecture. In 2020, Mohammed et al. applied CNN and updated ResNet in COVID-19 detection using CT scan images, achieving a precision of 0.819 and accuracy of 0.776 [44]. Wang et al. used 3D U-net [45] and 3D ResNet combined with CNN for COVID-19 identification in 2020 [46], achieving 93.3 percent accuracy and 87.6 percent sensitivity. In 2020, Cia et al. proposed [47] using CT scan images to diagnose COVID-19. They utilised CNN and ResNet and obtained an accuracy of 0.94 and precision of 0.97. Tabarisaadi et al. used a Bayesian approach for COVID-19 identification using CT scan in 2020 [48], along with three Bayesian algorithms, CNN and VGG16 in their work, and the results for regularised ensemble learning were 82.6 accuracy and 0.84 precision. Seum et al. proposed [49] in 2020, using several variations of ResNet and DenseNet, as well as VGG16 and VGG19, to detect COVID-19 in CT scan images. In DenseNet201, they had the best overall performance, with an accuracy of 89.92 percent and precision of 92.74 percent. For COVID-19 detection CT scan pictures, Kaya et al. [50] employed a variety of algorithms, including CNN, VGG16, EfficientNetB3, ResNet50, and Mo-bileNetV2, however EfficientNetB3 produced the best results, with an accuracy of 0.97 and sensitivity of 0.97. Padma and Kumari proposed employing CNN for COVID-19 detection using X-ray imaging in 2020 [51]. They achieved a precision of 100 percent and accuracy of 98.3 percent. In 2020, Qaqos and Kareem proposed [52] for COVID-19 detection using X-ray images. They used CNN for their work, and they divided the research into four classes, with the fourth class distinguishing between normal, COVID-19, Pneumonia, and Tuberculosis patients. They obtained an accuracy of 94.53 and precision of 92.67, 95.83, 95.97, and 95.65 for normal, COVID-19, Pneumonia and Tuberculosis patients respectively. Yener and Oktay proposed [53] in 2020 that they employed VGG16, VGG19, and Xception for COVID-19 detection using CT scan pictures, and that VGG16 had the best results with a learning rate of 10-4, accuracy of 0.91, and precision of 0.94. In 2021 Bougourzi et al. used algorithms such as ResneXt-50, Densenet-151, Inception-V3, WideResneXt for patient level and slice level classification for distinguishing normal, COVID-19, and CAP (Community Acquired Pneumonia) patients using CT scan images in 2021 [54], with an overall accuracy of 87.75 percent and sensitivity of 95.83 percent, 96.36 percent, and 52.63 percent. Chaudhary et al. employed EfficientNet to detect COVID-19 and CAP in 2021 [55], with stage 1 accuracy of 97.7% for COVID-19 and 94.7 for CAP, and stage 2 accuracy of 89.3%. In 2021, Wu et al. proposed [56] a Joint Classification and Segmentation (JCS) based diagnosis system to deliver diagnosis findings for COVID-19 detection. They employed ResNet and achieved a sensitivity of 95% and a specificity of 93%. In 2021, Jiang et al. proposed a Siamese network-based model for COVID-19 identification utilising Xception with CT scan images [57], with an accuracy of 0.8040
3.Methods for image processing technique
This section contains details on the various machine learning and image processing techniques utilized in the research articles presented here. Image processing is a technique for extracting or obtaining usable information from an image, such as characteristic features, by performing operations on it. An algorithm is used to convert the low-resolution image to a higher-resolution image. It was originally implemented in 1960 with the sole objective of improving image quality. In 1972, British engineer EMI Hounsfield invented x-ray computed tomography for head diagnosis utilizing image processing. Feature extraction, categorization, and pattern recognition are the most basic image processing applications. The purpose of image processing is to locate areas of greyscale. There are two types of image classification: supervised classification and unsupervised classification. In supervised categorization, particular training data is used with the use of “training sites” to determine what information is known. The huge unknown data with natural groupings is employed in unsupervised classification.
1. Ground Level Co-occurrence Matrix (GLCM) [69] – Textural characteristics based on gray tone spatial dependencies are presented, along with examples of their use in three different types of image data categorization tasks.
2. Local Binary Pattern (LBP) [70] – The texture categorization model LBP was first described in 1990. It divides the image’s pixels by the nearby pixels, yielding a binary number. As LBP, image data for texture classification is represented in a histogram. Uniform patterns are utilized to shorten the length of the feature. In LBP, a pattern is considered a uniform pattern if it has two bitwise transitions from 0 to 1 or vice versa when traversed in a circle. Patterns that are uniform and non-uniform are labeled individually.
3. Histogram of gradients (HOG) [71] – Robert K. McConnell first described HOG, a feature extraction model used in image processing, in 1996. To evaluate well-normalized local histograms of image gradient orientations, the approach uses a dense grid.
4. Grey Level Run Length Matrix (GLRLM) [72] – It is similar to Ground Level Co-occurrence Matrix (GLCM). The Gray Level Run Length Matrix is a technique for obtaining statistical texture properties of higher order.
5. Grey Level Size Zone Matrix (GLSZM) [73] – It is concerned with the total number of grey zones in the given image.
6. Local Directional Pattern (LDP) [74] – It labels each pixel in a picture by comparing its P-neighbor values to the center value and then converting the result to a binary integer.
Luqy Nailur Rohmah and Alhadi Bustaman [75] proposed a study in 2020 about classification using image processing techniques to identify COVID-19. They utilized various combinations of GLCM, HOG, and LBP, as well as PCA and SVM, and reached accuracy of 99.4 using CT scan pictures and 97 using x-ray images. Zebari et al. proposed a paper in 2020 [76] for detecting COVID-19 by extracting different features from images and then feeding into classifiers. They used FD, GLCM, and LBP for feature extraction and KNN, ANN, and SVM for classifiers, and the best results were obtained using ANN and KNN, with an accuracy of 96.91 and precision of 95.77. Mucahid Barstugan, Umut Ozkaya and Saban Ozturk published a paper [77] in 2020 about classification of COVID-19 using feature extraction and machine learning. They used GLCM, LDP, GLRLM, GLSZM, and DWT [86] for image processing and SVM for machine learning. They divided the dataset into 5 parts in terms of subset while obtaining the results. The findings of the 76 non-infected and 106 infected patients were included in the fifth subset. Using the DWT feature extraction approach, they extracted 1024 features and performed 10-fold cross validation to get a best result of 97.28
4.Methods for machine learning technique
This Machine learning is a data science approach that improves over time without requiring the usage of computer code. It develops itself by incorporating various user inputs. In general, machine learning in AI is used to replicate human thinking by using data provided by people. Big firms like Facebook and Google build and enhance their apps by asking consumers a variety of questions and incorporating their responses. It takes the inputs and processes them in order to predict new values. supervised machine learning, unsupervised machine learning, semi-supervised machine learning, and reinforcement machine learning are the four types of machine learning. To acquire its findings, supervised machine learning employs labelled datasets; it’s utilized for classification, and some of the methods employed include linear regression, naive bayes, and support vector machines, among others. The employment of algorithms to deal with unlabeled data is known as unsupervised learning. It can be beneficial in locating hidden elements in data. It’s utilized for both picture and voice recognition. Neural networks, KNN, and other approaches are employed in the algorithm. Semi-supervised learning is a combination of supervised and unsupervised learning. The train data used is small labelled data whereas the testing data is used in large unlabeled clustered data, it is sued to solve the problem of the having less training data. Reinforcement learning is like supervised learning but instead of using supervised learning it uses constant trial and error and with each successful outcome it reinforces the data and thus the name reinforcement learning. Machine learning helps in business and provide market. Applications of machine learning include image recognition, speech recognition, whether predictions, etc. Ensemble learning [79] is also a machine learning technique which combines different machine learning techniques in order to make a better model. Ensemble learning increases the performance of the model by achieving greater accuracy also makes the model robust.
1. Support vector machine (SVM) [80] – Solving a restricted quadratic optimization problem is used to train SVM. This means, among other things, that each set of SVM parameters has a unique optimum solution. This is in contrast to other learning machines, such as backpropagation-trained Neural Networks.
2. Principal Component analysis (PCA) [81] – PCA is a method for lowering the dimensionality of such datasets, boosting interpretability while minimizing information loss.
3. K-Nearest Neighbor [82] – The k-Nearest- Neighbors (kNN) technique of classification is a basic yet effective method. The two most significant disadvantages of kNN are (1) its poor efficiency (being a lazy learning approach precludes it from being used in many applications, such as dynamic web mining for a big repository) and (2) its reliance on the selection of a “good value” for k.
4. Random Forest (RF) [83] – Because it can tolerate missing values and can handle continuous, categorical, and binary data, the Random Forest is ideal for high-dimensional data modelling. Random Forest is robust enough to overcome the concerns of overfitting thanks to the bootstrapping and ensemble technique, therefore there is no need to trim the trees.
5. Support Vector Clustering (SVC) [84] – Because SVC was created as an expansion of H.264/AVC, the majority of H.264/components AVC’s are employed as stated in the standard. Motion compensation, intra prediction, transform and entropy coding, the deblocking filter, and Network Abstraction Layer (NAL) unit packetization are all included.
6. Artificial Neural Network (ANN) [85] – The use of artificial neural networks (ANNs) helps researchers to partially overcome some of the constraints of standard statistical approaches in their research. The use of ANNs, for example, does not require specific assumptions about the distributions of the system variables and their reciprocal relationships.
7. Gradient Boosting Decision Tree (GDBT) [87] – It is a boosting algorithm similar to random forest and xgboosting algorithm.
8. Adaboost [88] – Without any prior knowledge of learner learning, the Adaboost (adaptive boosting) method operates by altering weight. The AdaBoost method has mostly been studied and applied to classification problems.
9. Multilayer perceptron (MLP) [89] – The signals are only sent in one way inside the network: from input to output. There is no loop since each neuron’s output has no effect on the neuron itself.
10. Randaugment [90] – RandAugment’s main purpose is to eliminate the requirement for a separate search phase on a proxy task. RandAugment has a much smaller search field, allowing it to be trained directly on the target job without the requirement for a proxy task.
11. Long Short-term Memory Model [91] – The LSTM technique is quite similar to the gradient boosting approach. It was created to eliminate back-flow errors.
12. Logistic Regression [92] – Logistic model outperforms an intercept-only model, it is considered to provide a superior fit to the data (also called the null model). Because it contains no predictors, an intercept-only model is a suitable baseline. As a result, this model predicts that all observations will fall into the greatest out-come category.
13. Linear Regression [93] – A statistical approach for estimating the value of a dependent variable from an independent variable is linear regression. The relationship between two variables is measured using linear regression. It’s a type of modelling in which one or more independent variables are used to predict a dependent variable.
14. K-Means [94] – K-means is an iterative, numerical, unsupervised, non-deterministic approach. It is easy and quick; hence it has shown to be a very useful strategy for producing good clustering results in many practical situations. However, it’s ideal for making globular clusters.
Annisa Utama Berliana and Alhadi Bustamam suggested [95] a method for ensemble learning for categorization of COVID-19 in 2020. They employed SVC, KNN, and RF to obtain a 99 percent accuracy. X-rays have a precision of 98 percent and a recall of 100 percent, whereas CT scans have a precision of 97 percent and a recall of 97 percent. Tabrizchi et al. proposed a paper [96] in 2020 for using various machine learning, ensemble learning, and neural networks, such as SVM, Nave Bayes, CNN, MLP, Adaboost, and GDBT, to find an intelligent and accurate solution for COVID-19 detection, and they discovered that SVM and CNN outperformed all of them, with accuracy of 0.9920 and 0.9670, and precision of 0.9819 and 0.9724. Sharma submitted research [97] in 2020 that looked at CT images of 200 infected individuals and utilized machine learning to detect COVID-19. They used ResNet and Gradcam [36] and got a 91 percent accuracy rate. In 2020, Luca Brunese, Fabio Martinelli, Francesco Mercaldo, and Antonella Santona published a study [98] that employed machine learning approaches to detect COVID-19 patients. They used KNN and obtained a precision of 0.968 for COVID-19 patients and 0.955 for other patients. In 2020, Rezaee et al. proposed [99] a hybrid deep transfer approach for COVID-19 identification, which used both machine learning and deep learning. They employed SVM, CNN-CaffeNet, AlexNet, VeggF, KNN, and MLP to achieve a precision of 0.995 and accuracy of 0. 994. An ensemble learning approach for diagnosing COVID-19 using CT scan images was suggested by Bingyang Li, Qi Zhang, Yinan Song, Zhicheng Zhao, Zhu Meng, and Fei Su in a publication [100]. They achieved accuracy of 86.73 percent and sensitivity of 87.27 percent for COVID-19 patients, 68.42 percent for CAP patients, and 100 percent for normal patients using flip-and-shift augmentation, RandAugment, AdaBoost, EfficientNet, K-means, and ImageNet. A review study on machine learning approaches was offered by Siddiqui et al. in 2021 [101]. SVM, KNN, Logistic regression, and LSTM were the machine learning algorithms employed. They discovered that LSTM surpasses them all, with an accuracy of 99.68 percent, whereas SVM, KNN, and logistic regression only managed 96.20 percent, 95.30 percent, and 97.20 percent, respectively. A review study [102] by Ameer Sardar Kwekha Rashid, Heamn N. Abduljabbar, and Bilal Alhayani on covid- analysis of 19 They looked at 14 publications, five of which were about logistic regression, three were about ANN, and two were about CNN. They also looked at one study each about linear regression, K means, and KNN.
5.Prediction using pretrained model
In this study, a Pretrained model was used to identify COVID-19. Pretrained models are those who have previously been trained by someone else. As a result, rather of creating a model from scratch, one might use an existing model to solve their problem. Transfer learning is commonly used by pretrained models since it relies on prior information to tackle present problems. Feature and parameter transfer are both part of the pretraining process. In feature transfer, pre-train effective feature representations are used to improve the model’s performance. Parameter transfer methods work on the assumption that source and target tasks can exchange model parameters or previous distributions of hyper-parameters. The capacity to work with less data, the removal of the requirement to construct a model because one already exists, and the ability to attain high performance in a short amount of time are all advantages of using a pretrained model. We employed the VGG16 model, which had been pre-trained. Zisserman and Simonyan “VERY DEEP CONVOLUTIONAL NETWORKS FOR LARGE-SCALE IMAGE RECOGNITION” [22] was suggested in 2015. They used the ConvNet (Convolutional Neural Network) Model in that study to improve the model and raise its accuracy. They used their model in the ILSVRC competition. In 2014, they won with a 25.3 percent loss. They implemented VGG Net-D (16 layers) and VGG Net-E (19 layers), and their picture classification results were 89.7 mean AP in VOC-2007, 89.3 mean AP in VOC-2012, 92.7 0.5 mean class recall in Caltech-101, and 86.2 0.3 mean class recall in Caltech-256 [104]. For picture levee classification, we use Xgboost [103], which can also be done using deep learning, however deep learning takes a large amount of data, often millions to thousands of photographs. However, if that much data isn’t accessible, deep learning models produce poor outcomes and underperform. Boosting techniques such as Xgboost, Adaboost, random forest, and others are better to employ at that time. Because employing boosting algorithms instead of a deep learning model will yield far better outcomes.
5.1Model
VGG16 uses a 224 by 224 RGB picture with a fixed size. With the filters set to 33%, the picture is processed through a convolutional (conv.) layer stack. Padding is 1 pixel for 3
Because there are 16 layers in total, 13 convolutional layers, and three completely linked layers, it’s called VGG16. In the first and second blocks, there are two convolutional layers followed by a maxpooling layer. In the next three blocks, three convolutional layers are followed by a maxpooling layer, and the last block comprises three fully connected layers.
5.2Dataset
There were a total of 1526 photos utilized, including 700 Covid images and 700 non-COVID-19 images. [105] provided a few photos of COVID-19. A few more COVID-19 patient photos were collected from [106], which also included normal images, so that the model could differentiate between COVID-19 and normal patients. The dataset was split into two parts: 88% for training and 12% for testing. The photographs are organized into two folders: one for training and the other for testing. There are two more folders in those folders that separate Covid and Non-Covid.
5.3Architecture
To import the VGG16 model, we utilized the Keras API in conjunction with the TensorFlow machine learning platform. For plotting, we imported numpy, matplotlib, and seaborn. The image’s size was set to 256 pixels. Later, lists were used to specify training data and labels. Because pictures are utilized, a path should be supplied, followed by converting lists to arrays and repeating the testing/validation data. Importing the sklearn preprocessing so that the photos are encoded in one-to-one values. We divided the data by 255.0 to rescale the pixel values from 0 to 1. One hot encoding is used for dense layers. To load the model, we utilized ImageNet weights with VGG16, and the top value is false since we didn’t use a dense layer and simply used VGG16 for feature extraction. Also provided is a 256
5.4Performance metrics
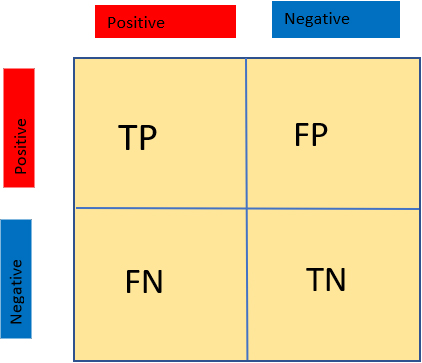
For getting the performance of the model and confusion matrix we imported ‘sklearn.metrics’, it shows the results in true positives (TP), true negatives (TN), false negatives (FN) and false positives (FP). Let TN stand for COVID-19 negative photos that have been correctly categorized, TP for COVID-19 positive images that have been correctly classified, FN for COVID-19 positive images that have been wrongly classified, and FP for COVID-19 negative images that have been incorrectly classed.
Table 1
Result table of our pretrained model
| Model | Algorithm | Accuracy | Precision | Recall | Specificity | F1Score |
|---|---|---|---|---|---|---|
| Proposed | VGG16 | 98% | 98% | 97% | 97% | 98% |
| [44] | Updated ResNet | 78.8% | 81.9% | 97.5% | 83.4% | 79.3% |
| [46] | 3D U-Net 3D ResNet | 93.3% | 87.6% | 95.5% | 88.4% | 87.8% |
Confusion matrix shows the value in TP, TN, FP and FN (see Fig. 1).
Figure 1.
A confusion matrix of true positive, true negative, false positive and false negative.
Accuracy-Accuracy is the how much correct predictions obtained divided by the total prediction.
Accuracy
Recall (Sensitivity) – is the correct predictions divided by the total prediction of that class i.e., COVID-19 which will include the correct COVID-19 prediction and Incorrect COVID-19 prediction.
Recall
Precision – is the correct prediction divided by the total positive prediction, which include all the prediction that the model thinks is COVID-19.
Precision
F1 score – F1 score takes account of both false positive prediction and false negative predictions. Thus, it takes the values of both precision and recall.
F1 Score
Specificity – is the incorrect predictions divided by the total prediction of that class. Thus, it shows the correct detection on Non COVID-19.
Specificity
5.5Result
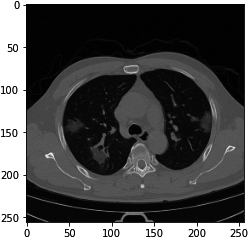
We used Vgg16 model for image classification along with Xgboost boosting algorithm. The results depend on the total number of images used. The higher the number of images the more accurate the results are. For comparison, we compared our model to that of [44], who utilized ResNet, and [46], who used 3D U-Net and 3D ResNet. Results are provided in Table 1. We got overall good results with accuracy, precision and f1 score of 98%. We got 97% of recall and specificity. Model presented the COVID-19 infected patient image (see Fig. 2).
Figure 2.
A COVID-19 infected image displayed by the model.
6.Prediction using deep learning model
We also used a deep learning model based on the U-Net architecture to detect COVID-19. Olaf Ronneberger, Philipp Fischer, and Thomas Brox proposed the U-Net architecture in 2015 [29], which is based on data augmentation. Data augmentation refers to methods for enhancing the amount of data available by adding slightly modified copies of existing data or synthesizing new data from existing data.
Figure 3.
U-Net model that we employed.
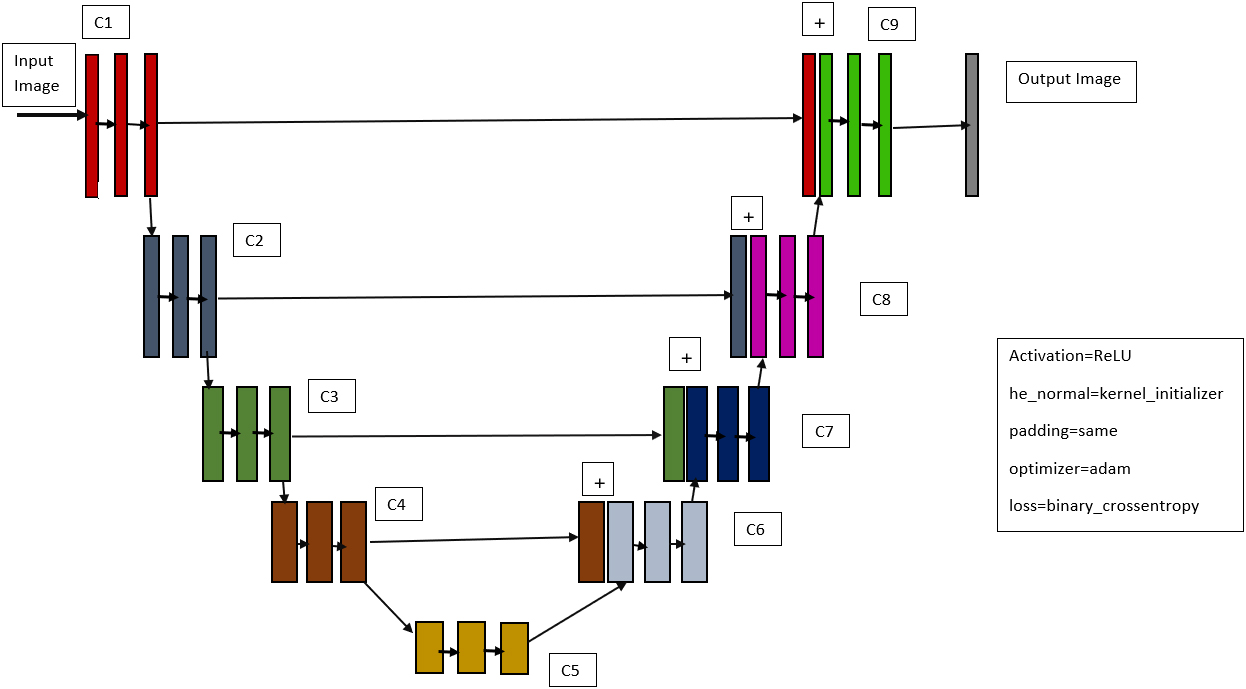
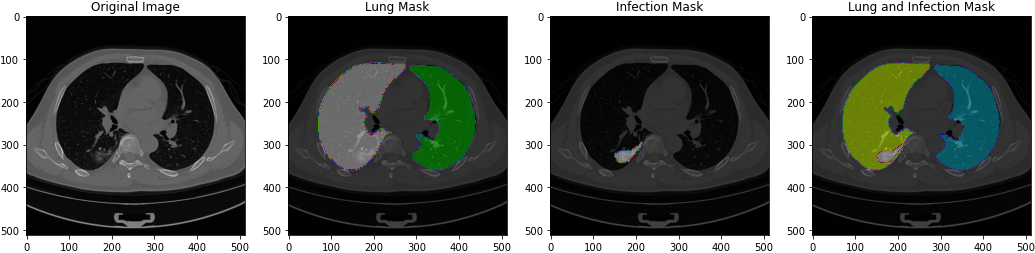
Figure 4.
Images when loaded to preview of original image, lung mask, infection mask and lung and infection mask.
6.1Model
U-net is an image segmentation architecture that, like many other deep learning models, consists of a combination of convolutional and maxpooling layers that are structured in such a way that they provide a result. Even though they employ the same layers that are included in all deep learning models, the arrangement and number of layers for each model will be different, resulting in variability in each design. The input layer is processed first, which will have a certain height, width, and channel size, such as 224
Table 2
Result table of our deep learning model
| Model | Algorithm | Accuracy | Precision | Recall | Loss | F1Score | AUC |
|---|---|---|---|---|---|---|---|
| Proposed | U-Net | 99.86% | 90.90% | 88.88% | 0.039% | 89.82% | |
| 99.87% | |||||||
| [44] | LeNet | 86.06% | 85% | 89% | 0.369% | 87% | 86% |
| [46] | CNN | 99.2% | 100% | 99.91% | 0.3% | – | – |
Figure 5.
Performance metrics of the model compared to their validation.
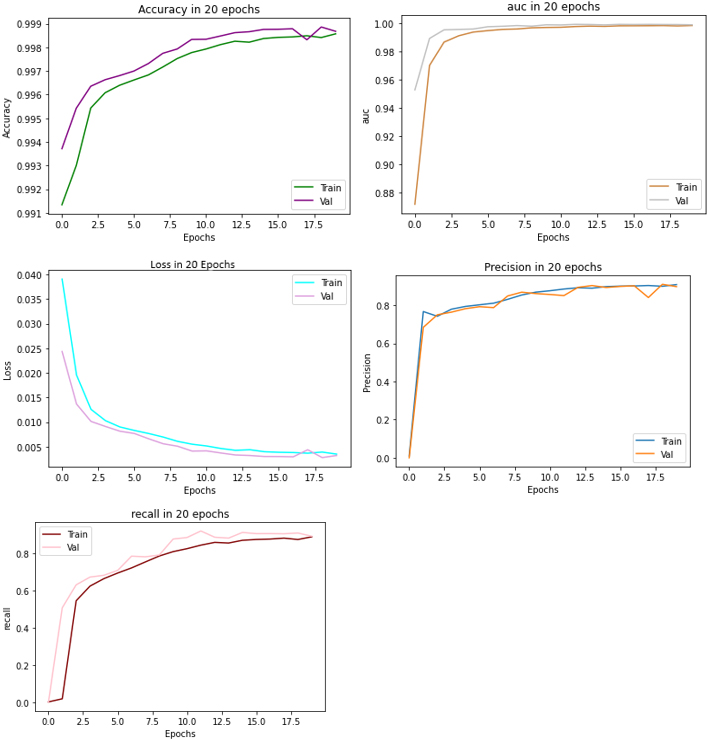
Table 3
Review of image processing, machine learning and deep learning papers
| References | Dataset references | Image processing techniques | Machine learning and deep learning techniques | Result |
|---|---|---|---|---|
| [75] | [106], [109] | GLCM, HOG LBP | SVM, PCA | CT Scan Accuracy |
| [95] | [106], [109] | KNN, RF, SVC, ANN | CT Scan AUC | |
| [76] | [110] | GLCM, FB, LBP | SVM.ANN.KNN | Accuracy |
| [96] | [111], [112] | SVM, NB, LBP, GDBT, AdaBoost, CNN | SVM CNN Accuracy 0.99 0.97 Precision 0.98 0.97 Recall 1.00 0.97 F1 0.99 0.97 MCC 0.98 0.95 | |
| [97] | [113], [114], [115], [116] | ResNet (CNN), Gradcam | Accuracy | |
| [77] | [113] | GLCM, LDP, GLRLM, GLSZM, DWT | SVM | DWT (10-Fold) Accuracy |
| [98] | [117] | KNN | FP Rate | |
| [99] | – | SVM, CNN (CaffeNet, AlexNet, and Vegg-F), KNN, MLP | Accuracy-0.995 Precision-0.994 Recall-0.993 F1 score-0.991 Specicivity-0.995 | |
| [100] | [111], [112] | d flip-and-shift augmentation, Rand Augment, AdaBoost, EfficientNet, K-means, ImageNet | Accuracy | |
| [101] | – | SVM, KNN, LSTM, Logistic Regression | Accuracy |
|
Table 3, continued | ||||
|---|---|---|---|---|
| References | Dataset references | Image processing techniques | Machine learning and deep learning techniques | Result |
| [102] | – | Logistic Regression, ANN, CNN, Linear Regression, Naive Bayes, K Means, KNN | Out of 14 articles (86% classification, 7% regression and 7% clustering). Methods used (5 Logistic regession, 3 ANN, 2 CNN, 1 Linear Regression, 1 Naive Bayes, 1 K Means and 1 KNN). | |
| [78] | [117], [118], [119] | GLCM, LBP, LE | SVM, KNN, CNN | SVM CNN Accuracy 0, 91 0, 92 Sensitivity 0, 91 0, 92 Specificity 1, 00 0, 98 F1 0, 92 0, 92 AUC 0, 98 0, 99 |
| [119] | [120], [121], [122] | DenseNet | Accuracy-84.7 Precision-97.0 Recall-76.2 F1 score-85.3 Area under ROC curve (AUC)-82.4 | |
| [31] | [106], [123], [124] | DenseNet, MobileNet, Xception, Inception, ResNet, VGG | Accuracy | |
| [32] | [119] | LeNet-CNN | Accuracy-86.06% Loss-0.369 F1-87%, Precision-85% Recall-89% Area under ROC curve (AUC)-0.86 | |
| [33] | [119], [112] | EfficientNet b4 | (Plateau LR) Accuracy-0.90 Precision-0.90 Recall-0.89 F1 score-0.90 Area under ROC curve (AUC)-0.90 | |
| [34] | [125] | CNN | Accuracy-97.57 Precision-98.0 Recall-98.0 F1 score-98.0 | |
| [37] | [118], [126], [127],[128], [129] | COVID-SDNet | Negative Specificity-85.20 Negative Precision-79.94 Positive Sensitivity-76.80 Positive Precision-84.23 Accuarcy-81.00 | |
| [39] | [130], [119] | Inflated inception (Stream 13D) Resnet-50 | CC-19 Accuracy | |
| [40] | [123] | Contrast Limited Adaptive Histogram Equalization (CLAHE), CNN | Accuracy | |
| [42] | [131] | CNN architecture, ResCovNet153V2 ImageNet | Accuracy-0.881 Sensitivity-0.821 F1 score-0.758 Specicivity-0.899 | |
| [44] | [118] | CNN ResNet+ (Upgraded ResNet) | Accuracy-0.788 Precision-0.819 Sensitivity-0.975 F1 score-0.834 Specivity-0.793 | |
|
Table 3, continued | ||||
|---|---|---|---|---|
| References | Dataset references | Image processing techniques | Machine learning and deep learning techniques | Result |
| [46] | – | 3D-Unet 3D-ResNets CNN | Accuracy-93.3 | |
| [47] | [119], [132] | CNN Resnet | Accuracy-0, 943 Precision-0.971 Sensitivity-0.941 F1 score-0.942 Specificity-0.973 AUC-0.985 | |
| [48] | [119] | CNN Three Bayesian Algorithm ImageNet VGG16(OxfordNet) | Accuracy-83.9 Precision-0.83 Recall-0.86 F1 score-0.84 Specificity-0.77 Sensitivity-0.886 | |
| [49] | [106] | AlexNet, VGG16, VGG19, ResNet18, ResNet50, ResNet101, ResNet152, DenseNet121, DenseNet169, DenseNet201, Inception_v3 and GoogleNet | (DenseNet201) Accuracy-89.92% Precision-92.74% Sensitivity-86.80% F1 score-89.67% Specivity-93.09% | |
| [50] | [133] | CNN VGG-16 EfficientNetB3 ResNet-50 MobileNetV2 | (EfficientNetB3) Accuracy-0.9792 Sensitivity-0.9722 F1 score-0.98 Specivity-0.9861 | |
| [51] | [118] | CNN | Accuracy-98.3% Precision-100% Sensitivity-99.1% Loss-0.3 Specivity-98.8% | |
| [52] | [109], [134] | CNN | (COVID-19 4 classes) Accuracy-94.53 Precision-95.83 Sensitivity-80.23% F1 score-87.33% Specivity-99.65% | |
| [53] | [119], [135] | VGG16, VGG19 and Xception | (VGG16 LR4) Accuracy-0.91 Precision-0.90 Recall-0.94 F1 score-0.92 AUC-0.91 | |
| [54] | [111] | CNN, ResneXt-50, Densenet-161, Inception-V3 and Wide-Resnet | Accuracy-87.95% Sensitivity-96.36% | |
| [55] | [111], [119] | CNN EfficientNet InceptionV3 ResNet DenseNet | Accuracy-89.3 | |
| [56] | [118], [119], [133], [136] | CNN-RESNET | Sensitivity-95% Specificity-93.0% Dice-78.5% | |
| [57] | [133], [137] | Xception | Accuracy | |
|
Table 3, continued | ||||
|---|---|---|---|---|
| References | Dataset references | Image processing techniques | Machine learning and deep learning techniques | Result |
| [58] | [111] | 3D ResNet50 CNN | Accuracy | |
| [59] | [123] | Contrast Limited Adaptive Histogram Equalization (CLAHE), Resnet CNN | Accuracy-0.87 Precision-0.91 Recall-0.81 F1 score-0.84 | |
| [60] | [105] | Convolutional neural network (CNN) Inception v3 | Accuracy-84 Precision-0.8636 Recall-0.8143 F1 score-0.8382 | |
| [61] | [138] | CNN U-Net | sensitivity | |
| [62] | [139] | DenseNet Inception V3 ImageNet | Accuracy Ct Scan X ray 85% 95.98% | |
| [63] | [111] | U-net (R231CovidWeb) | Accuracy-89.8% sensitivity-94.5% specificity-83.7% Area Under the ROC Curve (AUC)-0.93 probability threshold-0.5 | |
| [64] | [140] | U-Net 3D CNN (Long Term convolutional nets (LTC), Inflated 3D ConvNet (I3D)) | Prec Recall f1 LTC 96% 98% 97% ConvNet 100% 96% 98% | |
| [65] | [141] | CNN VGG16 VGG19 | Accuracy-0.94 Precision-1.0 Recall-1.0 F1 score-1.0 AUC-0.985 | |
| [66] | [142], [143], [144], [35] | CNN ImageNet U-Net, CLAHE VGG16, ResNet | Accuracy-0974 F1 Score-0.979 | |
| [67] | [30] | CNN, ImageNet Res-Net32 CBAM VGG16 | (ResNet32 with attention block module) Accuracy-97.43% | |
| [68] | [26] | ResNet50 | Accuracy (%) Normal CAP COVID 88.89 88.57 90.00 Sensitivity 88.57 | |
| [145] | [146] | Co-ResNet | Accuracy-90.90% Precision-90.20% | |
6.2Dataset
[105] provided the dataset. It was divided into four sections: CT scans, which contained the original CT scan images, lung mask, which contained the same images but divided the left and right lung by color, infection mask, which contained the same images as CT scans but had segmentation that could be COVID-19, and lung and infection mask, which contained the lung segmentation and radiological findings of COVID-19 combined in one image of and lung and infection mask, NifTi format ((*.nii) extension) was used for all of these photos. In a.csv file, all of the photos were combined. Because the data was precisely labelled, there was no need to make any adjustments to the dataset. Images when loaded by the model (see Fig. 4).
6.3Architecture
Basic packages were imported, as well as TensorFlow for training, nibabel for reading NifTi format data, and matplotlib for plotting the graph. To examine the photos and further characterize the images, a list was developed in accordance with the size of the images. Just as with our pretrained model, the lists were allocated to arrays. The dataset was separated into training and testing data using sklearn by setting test size
6.4Result
We used U-Net Model for COVID-19 detection with 90% training data and 10% testing data. We compared our model to [44], in which Lenet was employed, and [46], in which CNN was utilized. The results are provided in Table 2. The performance metrics when compared with training and validation data showed very similar results (see Fig. 5).
7.Comparative study table
Information of the results about different machine learning and image processing papers is provided in Table 3. The purpose of this paper to provide information about the research done on covid-19 diagnosis and provide some help for future researchers to work from the information gathered. The literature review of image processing and machine learning was done in our previous work [108].
8.Conclusion
SARS-CoV-2 virus that causes COVID-19, a respiratory disorder. It spreads from person to person in close proximity, and people are most vulnerable to contracting COVID-19 in crowded and poorly ventilated areas. As a result, it’s critical to have a quick diagnosis of COVID-19. AI approaches are also being used by researchers to detect COVID-19. This paper summarizes the results of various different researchers that have worked on COVID-19 detection. Because dataset is so crucial, different datasets have been employed for different projects, resulting in a variety of results. As a result, each dataset will provide various outcomes. This paper compiles information from various research papers that have used x-ray and CT scan lung images to study COVID-19. As well as the models for COVID-19 prediction. Image processing, machine learning approaches, and deep learning are the three aspects of the literature review. DenseNet and its variants were utilized in a number of deep learning articles, including [119, 31, 49, 54, 56, 62]. ResNet and its variants were also widely utilized, with articles [97, 31, 39, 44, 46, 47, 49, 50, 54, 55, 58, 59, 66, 67, 68] mentioning them. Researchers that have employed image processing and feature extraction for COVID-19 detection can be found in the image processing section. GLCM has been used in all feature extraction publications since it offers the pixel value of texture images. LBP has also been employed to extract features in [75, 119, 77]. The paper’s machine learning section examines works by researchers who have utilized machine learning techniques to detect covid 19. SVM appeared to be the most widely used technique, as it was utilized in [75, 119, 77, 78, 96, 99, 101]. Many articles [119, 78, 95, 98, 99, 101] used KNN because it produced good results. In addition, we applied our own algorithm to predict COVID-19 in Lung CT scan pictures. For feature extraction in images, we employed a VGG16 pretrained model along with the Xgboost boosting approach to distinguish between COVID-19 and non-Covid. We got an accuracy of 98%, precision of 98%, recall of 97%, specificity of 97% and f1 score of 98% for COVID-19 images. We also implemented our Deep learning model by using U-Net and got an accuracy of 99.86%, precision of 90.90%, recall of 88.88%, Loss of 0.39%, F1 score of 89.82% and AUC (Area under Curve) of 99.87%. The goal of “Soft Computing and Image Processing Techniques for COVID-19 Prediction for COVID-19 in Lung CT Scan Images” paper is to help future researchers to work on COVID-19 diagnosis and also to predict COVID-19 with different AI models. It would make their work easier as the necessary information to start working on COVID-19 is provided.
References
[1] | D.M. Morens, G.K. Folkers and A.S. Fauci, What is a pandemic? The Journal of Infec-tious Diseases 200: ((2009) ), 1018–1021. doi: 10.1086/644537. |
[2] | T.P. Velavan and C.G. Meyer, The Covid-19 epidemic, Tropical Medicine & Interna-tional Health 25: ((2020) ), 278–280. doi: 10.1111/tmi.13383. |
[3] | S. Bernard Stoecklin, P. Rolland, Y. Silue et al., First cases of coronavirus disease 2019 (COVID-19) in France: Surveillance, investigations and control measures, January 2020. Eurosurveillance. doi: 10.2807/1560-7917.es.2020.25.6.2000094. |
[4] | World Health Organization, WHO coronavirus disease (COVID-19) dashboard. https://covid19.who.int/, last accessed 2021/08/17. |
[5] | J. Huggett, K. Dheda, S. Bustin et al., Real-time RT-PCR normalisation; strategies and considerations, Genes & Immunity 6: ((2005) ), 279–284. doi: 10.1038/sj.gene.6364190. |
[6] | L.M. Kucirka, S.A. Lauer, O. Laeyendecker et al., Variation in False-Negative Rate of Reverse Transcriptase Polymerase Chain Reaction-Based SARS-CoV-2 Tests by Time Since Exposure, (2020) . doi: 10.7326/M20-1495. |
[7] | M. Minsky, Steps toward artificial intelligence, Proceedings of the IRE 49: ((1961) ), 8–30. doi: 10.1109/jrproc.1961.287775. |
[8] | R.B. Parikh, S. Teeple and A.S. Navathe, Addressing bias in artificial intelligence in Health Care, JAMA 322: ((2019) ), 2377. doi: 10.1001/jama.2019.18058. |
[9] | F.M. Gagliardi, R. Vagnozzi, R. Caruso et al., Epidermoids of the Cerebellopontine Angle (CPA): Usefulness of CT scan, Acta Neurochirurgica 54: ((1980) ), 271–281. doi: 10.1007/bf01407095. |
[10] | J.V. Chagas, D. de A. Rodrigues, R.F. Ivo et al., A new approach for the detection of pneumonia in children using CXR images based on a real-time IOT system, Journal of Real-Time Image Processing 18: ((2021) ), 1099–1114. doi: 10.1007/s11554-021-01086-y. |
[11] | A. Shrestha and A. Mahmood, Review of Deep Learning Algorithms and Architectures, (2019) . doi: 10.1109/ACCESS.2019.2912200. |
[12] | T.G. Dietterich, Machine-learning research, AI Magazine 18: (4) ((1997) ), 97. doi: 10.1609/aimag.v18i4.1324. |
[13] | T. Toutin, Review article: Geometric processing of remote sensing images: Models, algorithms and methods, International Journal of Remote Sensing 25: ((2004) ), 1893–1924. doi: 10.1080/0143116031000101611. |
[14] | E. Polverino, C. Cilloniz, C. Esquinas et al., Complicated pneumococcal pneumonia in adults, A47 community acquired pneumonia and healthcare associated pneumonia, (2009) . doi: 10.1164/ajrccm-conference.2009.179.1_meetingabstracts.a1711. |
[15] | Z. Feng, D. Guo, D. Tang et al., Codebert: A pre-trained model for programming and natural languages, Findings of the Association for Computational Linguistics: EMNLP 2020, (2020) . doi: 10.18653/v1/2020.findings-emnlp.139. |
[16] | R. Yamashita, M. Nishio, R.K. Do and K. Togashi, Convolutional Neural Networks: An overview and application in Radiology, Insights Into Imaging 9: ((2018) ), 611–629. doi: 10.1007/s13244-018-0639-9. |
[17] | G. Huang, Z. Liu, L. Van Der Maaten and K.Q. Weinberger, Densely connected Convolu-tional Networks, in: 2017 IEEE Conference on Computer Vision and Pattern Recognition (CVPR), (2017) . doi: 10.1109/cvpr.2017.243. |
[18] | A.G. Howard, M. Zhu, B. Chen, D. Kalenichenko et al., MobileNets: Efficient Convolu-tional Neural Networks for Mobile Vision Applications, (2017) . doi: 10.48550/arXiv.1704.04861. |
[19] | F. Chollet, Xception: Deep Learning with Depthwise Separable Convolutions, (2017) . doi: 10.48550/arXiv.1610.02357. |
[20] | C. Szegedy, W. Liu, Y. Jia et al., Going deeper with convolutions, (2014) . https://arxiv.org/abs/1409.4842. |
[21] | K. He, X. Zhang, S. Ren and J. Sun, Deep residual learning for image recognition, (2015) . https://arxiv.org/abs/1512.03385. |
[22] | K. Simonyan and A. Zisserman, Very deep convolutional networks for large-scale image recognition, (2015) . https://arxiv.org/abs/1409.1556. |
[23] | A. El-Sawy, H. EL-Bakry and M. Loey, CNN for handwritten arabic digits recognition based on lenet-5, Advances in Intelligent Systems and Computing, (2016) , 566–575. doi: 10.1007/978-3-319-48308-5_54. |
[24] | M. Tan and Q.V. Le, Rethinking Model Scaling for Convolutional Neural Networks, (2019) . doi: 10.48550/arXiv.1905.11946. |
[25] | A. Yayık, Y. Kutlu and G. Altan, Deep learning with CONVNET predicts imagery tasks through EEG, (2019) . https://arxiv.org/abs/1907.05674. |
[26] | COVIDX CT. In: Kaggle. https://www.kaggle.com/hgunraj/covidxct. Accessed 19 Feb 2022. |
[27] | M.Z. Alom, T.M. Taha, C. Yakopcic et al., The history began from Alexnet: A com-prehensive survey on Deep Learning Approaches, (2018) . https://arxiv.org/abs/1803.01164. |
[28] | R. Khan, X. Zhang and R. Kumar, Analysis of ResNet and GoogleNet models for mal-ware detection, Journal of Computer Virology and Hacking Techniques, (2019) , 29–37. doi: 10.1007/s11416-018-0324-z. |
[29] | O. Ronneberger, P. Fischer and T. Brox, U-Net: Convolutional Networks for Biomedical Image Segmentation, Lecture Notes in Computer Science, (2015) , 234–241. doi: 10.1007/978-3-319-24574-4_28. |
[30] | T. Rahman, Covid-19 radiography database, In: Kaggle. https://www.kaggle.com/tawsifurrahman/covid19-radiography-database. Accessed 19 Feb 2022. |
[31] | N. Hilmizen, A. Bustamam and D. Sarwinda, The Multimodal Deep Learning for Diag-nosing COVID-19 Pneumonia from Chest CT-Scan and X-Ray Images, in: 2020 3rd Interna-tional Seminar on Research of Information Technology and Intelligent Systems, ISRITI 2020, (2020) , pp. 26–31. doi: 9781728184067. |
[32] | M.R. Islam and A. Matin, Detection of covid 19 from CT image by the novel lenet-5 CNN architecture, in: 2020 23rd International Conference on Computer and Information Technology (ICCIT), (2020) . doi: 10.1109/iccit51783.2020.9392723. |
[33] | T. Anwar and S. Zakir, Deep learning-based diagnosis of COVID-19 using chest CT-scan images, (2020) . doi: 10.36227/techrxiv.12328061.v1. |
[34] | I.P. Sari, M. Nugraheni and P. Wanda, A basic concept of image classification for COVID-19 patients using chest CT scan and Convolutional Neural Network, in: 2020 1st International Conference on Information Technology, Advanced Mechanical and Elec-trical Engineering (ICITAMEE), (2020) . doi: 10.1109/icitamee50454.2020.9398462. |
[35] | S. Rajaraman, J. Siegelman, P.O. Alderson et al., Iteratively pruned deep learning en-sembles for COVID-19 detection in chest X-rays, IEEE Access 8: ((2020) ), 115041–115050. doi: 10.1109/access.2020.3003810. |
[36] | R.R. Selvaraju, M. Cogswell, A. Das et al., Grad-cam: Visual explanations from deep networks via gradient-based localization, in: 2017 IEEE International Conference on Com-puter Vision (ICCV), (2017) . doi: 10.1109/iccv.2017.74. |
[37] | S. Tabik, A. Gomez-Rios, J.L. Martin-Rodriguez et al., COVIDGR dataset and Covid-SDNet methodology for predicting COVID-19 based on chest X-ray images, IEEE Jour-nal of Biomedical and Health Informatics 24: ((2020) ), 3595–3605. doi: 10.1109/jbhi.2020.3037127. |
[38] | M. Rey-Area, E. Guirado, S. Tabik and J. Ruiz-Hidalgo, FuCiTNet: Improving the general-ization of deep learning networks by the fusion of learned class-inherent transfor-mations, Information Fusion 63: ((2020) ), 188–195. doi: 10.1016/j.inffus.2020.06.015. |
[39] | A.A. Khan, S. Shafiq, R. Kumar et al., H3DNN: 3D deep learning based detection of covid-19 virus using lungs computed tomography, in: 2020 17th International Computer Conference on Wavelet Active Media Technology and Information Processing (ICCWAMTIP), (2020) . doi: 10.1109/iccwamtip51612.2020.9317357. |
[40] | R.M. James and A. Sunyoto, Detection of CT – scan lungs COVID-19 image using convo-lutional neural network and Clahe, in: 2020 3rd International Conference on Information and Communications Technology (ICOIACT), (2020) . doi: 10.1109/icoiact50329.2020.9332069. |
[41] | G. Yadav, S. Maheshwari and A. Agarwal, Contrast Limited adaptive histogram equaliza-tion-based enhancement for Real Time Video System, in: 2014 International Conference on Advances in Computing, Communications and Informatics (ICACCI), (2014) . doi: 10.1109/icacci.2014.6968381. |
[42] | A.G. Dastider, M. Rashid Subah, F. Sadik et al., Rescovnet: A deep learning-based ar-chitecture for COVID-19 detection from chest CT scan images, in: 2020 IEEE Region 10 Conference (TENCON), (2020) . doi: 10.1109/tencon50793.2020.9293887. |
[43] | N. Otsu, A threshold selection method from gray-level histograms, IEEE Transac-tions on Systems, Man, and Cybernetics 9: ((1979) ), 62–66. doi: 10.1109/tsmc.1979.4310076. |
[44] | A. Mohammed, C. Wang, M. Zhao et al., Weakly-supervised network for detection of COVID-19 in chest CT scans, IEEE Access 8: ((2020) ), 155987–156000. doi: 10.1109/access.2020.3018498. |
[45] | Ö. Çiçek, A. Abdulkadir, S.S. Lienkamp et al., 3D U-Net: Learning dense volumetric segmentation from sparse annotation, Medical Image Computing and Computer-Assisted Intervention – MICCAI 2016: ((2016) ), 424–432. doi: 10.1007/978-3-319-46723-8_49. |
[46] | J. Wang, Y. Bao, Y. Wen et al., Prior-attention residual learning for more discrimina-tive COVID-19 screening in CT images, IEEE Transactions on Medical Imaging 39: ((2020) ), 2572–2583. doi: 10.1109/tmi.2020.2994908. |
[47] | X. Cai, Y. Wang, X. Sun et al., Comparing the performance of resnets on covid-19 di-agnosis using CT scans, in: 2020 International Conference on Computer, Information and Telecommunication Systems (CITS), (2020) . doi: 10.1109/cits49457.2020.9232574. |
[48] | P. Tabarisaadi, A. Khosravi and S. Nahavandi, A Deep Bayesian ensembling framework for COVID-19 detection using chest CT images, in: 2020 IEEE International Conference on Systems, Man, and Cybernetics (SMC), (2020) . doi: 10.1109/smc42975.2020.9283003. |
[49] | A. Seum, A.H. Raj, S. Sakib and T. Hossain, A comparative study of CNN transfer learn-ing classification algorithms with segmentation for COVID-19 detection from CT Scan images, in: 2020 11th International Conference on Electrical and Computer Engineering (ICECE), (2020) . doi: 10.1109/icece51571.2020.9393129. |
[50] | A. Kaya, K. Atas and I. Myderrizi, Implementation of CNN based COVID-19 classifica-tion model from CT images, in: 2021 IEEE 19th World Symposium on Applied Machine In-telligence and Informatics (SAMI), (2021) . doi: 10.1109/sami50585.2021.9378646. |
[51] | T. Padma and C.U. Kumari, Deep learning based chest X-ray image as a diagnostic tool for covid-19, in: 2020 International Conference on Smart Electronics and Communication (ICOSEC), (2020) . doi: 10.1109/icosec49089.2020.9215257. |
[52] | N.N. Qaqos and O.S. Kareem, Covid-19 diagnosis from chest X-ray images using Deep Learning Approach, in: 2020 International Conference on Advanced Science and Engineer-ing (ICOASE), (2020) . doi: 10.1109/icoase51841.2020.9436614. |
[53] | F.M. Yener and A.B. Oktay, Diagnosis of COVID-19 with a deep learning approach on chest CT slices, 2020 Medical Technologies Congress (TIPTEKNO), (2020) . doi: 10.1109/tiptekno50054.2020.9299266. |
[54] | F. Bougourzi, R. Contino, C. Distante and A. Taleb-Ahmed, CNR-IEMN: A Deep Learning based approach to recognise covid-19 from CT-scan, in: ICASSP 2021 – 2021 IEEE Interna-tional Conference on Acoustics, Speech and Signal Processing (ICASSP), (2021) . doi: 10.1109/icassp39728.2021.9414185. |
[55] | S. Chaudhary, S. Sadbhawna, V. Jakhetiya et al., Detecting covid-19 and community acquired pneumonia using chest CT scan images with Deep Learning, in: ICASSP 2021 – 2021 IEEE International Conference on Acoustics, Speech and Signal Processing (ICASSP), (2021) . doi: 10.1109/icassp39728.2021.9414007. |
[56] | Y.-H. Wu, S.-H. Gao, J. Mei et al., JCS: An explainable COVID-19 diagnosis system by Joint Classification and Segmentation, IEEE Transactions on Image Processing 30: ((2021) ), 3113–3126. doi: 10.1109/tip.2021.3058783. |
[57] | Y. Jiang, H. Chen, H. Ko and D.K. Han, Few-shot learning for CT scan based COVID-19 diagnosis, in: ICASSP 2021 – 2021 IEEE International Conference on Acoustics, Speech and Signal Processing (ICASSP), (2021) . doi: 10.1109/icassp39728.2021.9413443. |
[58] | S. Xue and C. Abhayaratne, Covid-19 diagnostic using 3D deep transfer learning for classification of volumetric computerised tomography chest scans, in: ICASSP 2021 – 2021 IEEE International Conference on Acoustics, Speech and Signal Processing (ICASSP), (2021) . doi: 10.1109/icassp39728.2021.9414947. |
[59] | S. Sanagavarapu, S. Sridhar and T.V. Gopal, Covid-19 identification in Clahe enhanced CT scans with class imbalance using ensembled ResNets, in: 2021 IEEE International IOT, Electronics and Mechatronics Conference (IEMTRONICS), (2021) . doi: 10.1109/iemtronics52119.2021.9422556. |
[60] | P. Dutta, T. Roy and N. Anjum, Covid-19 detection using transfer learning with Convolu-tional Neural Network, in: 2021 2nd International Conference on Robotics, Electrical and Signal Processing Techniques (ICREST), (2021) . doi: 10.1109/icrest51555.2021.9331029. |
[61] | D. Amran, M. Frid-Adar, N. Sagie et al., Automated triage of covid-19 from various lung abnormalities using chest CT features, in: 2021 IEEE 18th International Symposium on Biomedical Imaging (ISBI), (2021) . doi: 10.1109/isbi48211.2021.9433803. |
[62] | M. Berrimi, S. Hamdi, R.Y. Cherif et al., Covid-19 detection from XRAY and CT scans using transfer learning, in: 2021 International Conference of Women in Data Science at Taif University (WiDSTaif), (2021) . doi: 10.1109/widstaif52235.2021.9430229. |
[63] | S. Heidarian, P. Afshar, A. Mohammadi et al., CT-caps: Feature extraction-based au-tomated framework for COVID-19 disease identification from chest CT scans using cap-sule networks, in: ICASSP 2021 – 2021 IEEE International Conference on Acoustics, Speech and Signal Processing (ICASSP), (2021) . doi: 10.1109/icassp39728.2021.9414214. |
[64] | J. Rodriguez, D. Romo-Bucheli, F. Sierra et al., A covid-19 patient severity stratifica-tion using a 3D convolutional strategy on CT-Scans, in: 2021 IEEE 18th International Sym-posium on Biomedical Imaging (ISBI), (2021) . doi: 10.1109/isbi48211.2021.9434154. |
[65] | S. Sharma and S. Tiwari, Covid-19 diagnosis using X-ray images and deep learning, in: 2021 International Conference on Artificial Intelligence and Smart Systems (ICAIS), (2021) . doi: 10.1109/icais50930.2021.9395851. |
[66] | S. Kumar, M. Talib and P. Verma, Covid detection from X-ray and CT scans us-ing transfer learning – A study, in: 2021 International Conference on Artificial Intelligence and Smart Systems (ICAIS), (2021) . doi: 10.1109/icais50930.2021.9395784. |
[67] | M.A. Nawshad, U.A. Shami, S. Sajid and M.M. Fraz, Attention based residual network for effective detection of covid-19 and viral pneumonia, in: 2021 International Conference on Digital Futures and Transformative Technologies (ICoDT2), (2021) . doi: 10.1109/icodt252288.2021.9441485. |
[68] | P. Garg, R. Ranjan, K. Upadhyay et al., multi-scale residual network for covid-19 di-agnosis using CT-scans, in: ICASSP 2021 – 2021 IEEE International Conference on Acous-tics, Speech and Signal Processing (ICASSP), (2021) . doi: 10.1109/icassp39728.2021.9414426. |
[69] | R.M. Haralick, K. Shanmugam and I.H. Dinstein, Textural features for Image Classifica-tion, IEEE Transactions on Systems, Man, and Cybernetics SMC 3: ((1973) ), 610–621. doi: 10.1109/tsmc.1973.4309314. |
[70] | M. Pietikäinen, Local Binary Patterns, (2021) . doi: 10.4249/scholarpedia.9775. |
[71] | N. Dalal and B. Triggs, Histograms of oriented gradients for human detection, in: 2005 IEEE Computer Society Conference on Computer Vision and Pattern Recognition (CVPR’05), (2005) . doi: 10.1109/cvpr.2005.177. |
[72] | A.S. Sohail, P. Bhattacharya, S.P. Mudur and S. Krishnamurthy, Local relative GLRLM-based texture feature extraction for classifying ultrasound medical images, in: 2011 24th Canadian Conference on Electrical and Computer Engineering (CCECE), (2011) . doi: 10.1109/ccece.2011.6030630. |
[73] | G. Thibault, J. Angulo and F. Meyer, Advanced statistical matrices for texture characteri-zation: Application to cell classification, IEEE Transactions on Biomedical Engineering 61: ((2014) ), 630–637. doi: 10.1109/tbme.2013.2284600. |
[74] | T. Jabid, M.H. Kabir and O. Chae, Local directional pattern (LDP) for face recognition, in: 2010 Digest of Technical Papers International Conference on Consumer Electronics (ICCE), (2010) . doi: 10.1109/icce.2010.5418801. |
[75] | L.N. Rohmah and A. Bustamam, Improved classification of Coronavirus Disease (COVID-19) based on combination of texture features using CT scan and X-ray images, in: 2020 3rd International Conference on Information and Communications Technology (ICOIACT), (2020) . doi: 10.1109/icoiact50329.2020.9332123. |
[76] | D.A. Zebari, A.M. Abdulazeez, D.Q. Zeebaree and M.S. Salih, A fusion scheme of texture features for COVID-19 detection of CT Scan Images, in: 2020 International Conference on Advanced Science and Engineering (ICOASE), (2020) . doi: 10.1109/icoase51841.2020.9436538. |
[77] | M. Barstugan, U. Ozkaya and S. Ozturk, Coronavirus (COVID-19) Classification using CT Images by Machine Learning Methods, (2020) . doi: 10.48550/arXiv.2003.09424. |
[78] | H. Yasar and M. Ceylan, A novel comparative study for detection of covid-19 on CT lung images using texture analysis, machine learning, and Deep Learning Methods, Mul-timedia Tools and Applications 80: ((2020) ), 5423–5447. doi: 10.1007/s11042-020-09894-3. |
[79] | F. Huang, G. Xie and R. Xiao, Research on ensemble learning, in: 2009 International Con-ference on Artificial Intelligence and Computational Intelligence, (2009) . doi: 10.1109/aici.2009.235. |
[80] | T. Evgeniou and M. Pontil, Support Vector Machines: Theory and applications, Machine Learning and Its Applications, (2001) , 249–257. doi: 10.1007/3-540-44673-7_12. |
[81] | I.T. Jolliffe and J. Cadima, Principal component analysis: A review and recent develop-ments, Philosophical Transactions of the Royal Society A: Mathematical, Physical and Engineering Sciences 374: ((2016) ),20150202. doi: 10.1098/rsta.2015.0202. |
[82] | G. Guo, H. Wang, D.A. Bell and Y. Bi, KNN Model-Based Approach in Classification, (2004) . |
[83] | J. Ali, R. Khan, N. Ahmad and I. Maqsood, Random Forests and Decision Trees, Interna-tional Journal of Computer Science Issues (IJCSI), (2012) . |
[84] | M. Wien, H. Schwarz and T. Oelbaum, Performance analysis of SVC, IEEE Transactions on Circuits and Systems for Video Technology 17: ((2007) ), 1194–1203. doi: 10.1109/tcsvt.2007.905530. |
[85] | G. Di Franco and M. Santurro, Machine learning, artificial neural networks and social research, Quality & Quantity 55: ((2020) ), 1007–1025. doi: 10.1007/s11135-020-01037-y. |
[86] | N. Kashyap and G.R. Sinha, Image watermarking using 3-level discrete wavelet trans-form (DWT), International Journal of Modern Education and Computer Science 4: ((2012) ), 50–56. doi: 10.5815/ijmecs.2012.03.07. |
[87] | B. Rok and L. Lara, Gradient boosting for high-dimensional prediction of rare events, Computational Statistics & Data Analysis 113: ((2017) ), 19–37. doi: 10.1016/j.csda.2016.07.016. |
[88] | T. Chengsheng, L. Huacheng and X. Bing, AdaBoost typical algorithm and its application research, in: MATEC Web of Conferences, Vol. 139, (2017) , p. 00222. doi: 10.1051/matecconf/201713900222. |
[89] | Mariusconstantin Popescu, Valentina Balas, Liliana Popescu, Nikos Mastorakis, Multilayer Perceptron and Neural Networks, (2009) . doi: 1109-2734. |
[90] | E.D. Cubuk, B. Zoph, J. Shlens and Q.V. Le, Randaugment: Practical Automated Data Augmentation with a reduced search space, in: 2020 IEEE/CVF Conference on Computer Vision and Pattern Recognition Workshops (CVPRW), (2020) . doi: 10.1109/cvprw50498.2020.00359. |
[91] | S. Hochreiter and J. Schmidhuber, Long short-term memory, Neural Computation 9: ((1997) ), 1735–80. doi: 10.1162/neco.1997.9.8.1735. |
[92] | C.-Y.J. Peng, K.L. Lee and G.M. Ingersoll, An introduction to logistic regression analysis and reporting, The Journal of Educational Research 96: ((2002) ), 3–14. doi: 10.1080/00220670209598786. |
[93] | K. Kumari and S. Yadav, Linear regression analysis study, 4: ((2018) ), 33–36. doi: 10.4103/jpcs.jpcs_8_18. |
[94] | S. Na, L. Xumin and G. Yong, Research on K-means clustering algorithm: An improved K-means clustering algorithm, in: 2010 Third International Symposium on Intelligent Infor-mation Technology and Security Informatics, (2010) . doi: 10.1109/iitsi.2010.74. |
[95] | A.U. Berliana and A. Bustamam, Implementation of stacking ensemble learning for clas-sification of COVID-19 using image dataset CT scan and Lung X-ray, in: 2020 3rd Interna-tional Conference on Information and Communications Technology (ICOIACT), (2020) . doi: 10.1109/icoiact. |
[96] | H. Tabrizchi, A. Mosavi, A. Szabo-Gali et al., Rapid covid-19 diagnosis using deep learning of the computerized tomography scans, in: 2020 IEEE 3rd International Conference and Workshop in Óbuda on Electrical and Power Engineering (CANDO-EPE), (2020) . doi: 10.1109/cando-epe51100.2020.9337794. |
[97] | S. Sharma, Drawing insights from covid-19-infected patients using CT scan images and Machine Learning Techniques: A study on 200 patients, Environmental Science and Pollution Research 27: ((2020) ), 37155–37163. doi: 10.1007/s11356-020-10133-3. |
[98] | L. Brunese, F. Martinelli, F. Mercaldo and A. Santone, Machine learning for coronavirus covid-19 detection from chest X-rays, Procedia Computer Science 176: ((2020) ), 2212–2221. doi: 10.1016/j.procs.2020.09.258. |
[99] | K. Rezaee, A. Badiei and S. Meshgini, A hybrid deep transfer learning-based approach for COVID-19 classification in chest X-ray images, in: 2020 27th National and 5th Interna-tional Iranian Conference on Biomedical Engineering (ICBME), (2020) . doi: 10.1109/icbme51989.2020.9319426. |
[100] | B. Li, Q. Zhang, Y. Song et al., Diagnosing covid-19 from CT images based on an Ensemble Learning Framework, in: ICASSP 2021 – 2021 IEEE International Conference on Acoustics, Speech and Signal Processing (ICASSP), (2021) . doi: 10.1109/icassp39728.2021.9413707. |
[101] | M.A.A. Siddiqui, M.A. Ali and M. Deriche, On the early detection of covid19 using ad-vanced machine learning techniques: A Review, in: 2021 18th International Multi-Conference on Systems, Signals & Devices (SSD), (2021) . doi: 10.1109/ssd52085.2021.9429345. |
[102] | A.S. Kwekha-Rashid, H.N. Abduljabbar and B. Alhayani, Coronavirus disease (COVID-19) cases analysis using machine-learning applications, Applied Nanoscience, (2021) . doi: 10.1007/s13204-021-01868-7. |
[103] | T. Chen and C. Guestrin, XGBoost, in: Proceedings of the 22nd ACM SIGKDD Interna-tional Conference on Knowledge Discovery and Data Mining, (2016) . doi: 10.1145/2939672.2939785. |
[104] | G. Griffin, A. Holub and P. Perona, Caltech-256 object category dataset: Semantic scholar, In: undefined. https://www.semanticscholar.org/paper/Caltech-256-Object-Category-Dataset-Griffin-Holub/5a5effa909cdeafaddbbb7855037e02f8e25d632. Ac-cessed 20 Feb 2022. |
[105] | Andrewmvd, Covid-19 CT scans: Getting started, In: Kaggle. https://www.kaggle.com/andrewmvd/covid-19-ct-scans-getting-started. Accessed 1 Feb 2022. |
[106] | PlamenEduardo, SARS-COV-2 CT-scan dataset, In: Kaggle. https://www.kaggle.com/plameneduardo/sarscov2-ctscan-dataset. Accessed 1 Feb 2022. |
[107] | C. Nwankpa, W. Ijomah, A. Gachagan and S. Marshall, Activation Functions: Compari-son of trends in Practice and Research for Deep Learning, (2018) . doi: 10.48550/arXiv.1811.03378. |
[108] | N.V.L. Appari, M.G. Kanojia and K.K. Bangera, Machine Learning and Image Processing Techniques for Covid-19 Detection: A Review, SoCPaR 2021, (2020) . doi: 10.1007/978-3-030-96302-6_41. |
[109] | P. Patel, Chest X-ray (covid-19 & pneumonia), In: Kaggle. https://www.kaggle.com/prashant268/chest-xray-covid19-pneumonia/. Accessed 18 Feb 2022. |
[110] | D. Qader Zeebaree, A. Mohsin Abdulazeez, D. Asaad Zebari et al., Multi-level fu-sion in ultrasound for cancer detection based on uniform LBP features, Computers, Ma-terials & Continua 66: ((2021) ), 3363–3382. doi: 10.32604/cmc.2021.013314. |
[111] | P. Afshar, S. Heidarian, N. Enshaei et al., Covid-CT-MD, covid-19 computed tomog-raphy scan dataset applicable in machine learning and Deep Learning, Scientific Data, (2021) . doi: 10.1038/s41597-021-00900-3. |
[112] | J. Deng, W. Dong, R. Socher et al., ImageNet: A large-scale hierarchical image data-base, in: 2009 IEEE Conference on Computer Vision and Pattern Recognition, (2009) . doi: 10.1109/cvpr.2009.5206848. |
[113] | Redazione, S SIRM, Società Italiana di radiologia medica E interventistica, In: SIRM. https://www.sirm.org/. Accessed 18 Feb 2022. |
[114] | UCSD-AI4H UCSD-AI4H/covid-CT: Covid-CT-Dataset: A CT scan dataset about COVID-19, In: GitHub. https://github.com/UCSD-AI4H/COVID-CT. Accessed 18 Feb 2022. |
[115] | Artificial Intelligence in radiology, In: mosmed.ai. https://mosmed.ai/en/. Accessed 18 Feb 2022. |
[116] | In: Sal hospital. http://www.salhospital.com/. Accessed 18 Feb 2022. |
[117] | ieee8023 IEEE8023/covid-chestxray-dataset: We are building an open database of COVID-19 cases with chest X-ray or CT images, In: GitHub. https://github.com/ieee8023/covid-chestxray-dataset. Accessed 18 Feb 2022. |
[118] | J.P. Cohen, P. Morrison and L. Dao, COVID-19 Image Data Collection, (2020) . doi: 10.48550/arXiv.2003.11597. |
[119] | X. Yang, X. He et al., COVID-CT-Dataset: A CT Scan Dataset about COVID-19, (2020) . doi: 10.48550/arXiv.2003.13865. |
[120] | MedRxiv, In: medRxiv. https://www.medrxiv.org/. Accessed 19 Feb 2022. |
[121] | BioRxiv, In: bioRxiv. https://www.biorxiv.org/. Accessed 19 Feb 2022. |
[122] | Pymupdf Pymupdf/pymupdf: Python bindings for mupdf’s rendering library, In: GitHub. https://github.com/pymupdf/PyMuPDF. Accessed 19 Feb 2022. |
[123] | Radiopaedia’s mission is to create the best radiology reference the world has ever seen and to make it available for free, for ever, for all, In: Radiopaedia Blog RSS. https://radiopaedia.org/. Accessed 19 Feb 2022. |
[124] | Praveen, Coronahack -Chest X-ray-dataset, In: Kaggle. http://www.kaggle.com/praveengovi/coronahack-chest-xraydataset. Accessed 19 Feb 2022. |
[125] | A. Abbas, M.M. Abdelsamea and M.M. Gaber, Classification of COVID-19 in chest X-ray images using DeTraC deep convolutional neural network, (2020) . doi: 10.48550/arXiv.2003.13815. |
[126] | Agchung Agchung/Figure1-covid-chestxray-dataset: Figure 1 COVID-19 chest X-ray dataset initiative, In: GitHub. https://github.com/agchung/Figure1-COVID-chestxray-dataset. Accessed 19 Feb 2022. |
[127] | RSNA Pneumonia Detection Challenge, In: Kaggle. https://www.kaggle.com/c/rsna-pneumonia-detection-challenge/data. Accessed 19 Feb 2022. |
[128] | A.E. Johnson, T.J. Pollard, N.R. Greenbaum et al., MIMIC-CXR-JPG, a large publicly available database of labeled chest radiographs, (2019) . doi: 10.48550/arXiv.1901.07042. |
[129] | A. Bustos, A. Pertusa et al., PadChest: A large chest x-ray image dataset with multi-label annotated reports, (2019) . doi: 10.48550/arXiv.1901.07441. |
[130] | R. Kumar, A.A. Khan, J. Kumar et al., Blockchain-Federated-Learning and deep learning models for COVID-19 detection using CT Imaging, IEEE Sensors Journal 21: ((2019) ), 16301–16314. doi: 10.1109/jsen.2021.3076767. |
[131] | R. Helen, N. Kamaraj, K. Selvi and V.R. Raja, Segmentation of pulmonary parenchyma in CT lung images based on 2D Otsu optimized by PSO, (2011) . doi: 10.1109/ICETECT.2011.5760176. |
[132] | E. Soares, P. Angelov, S. Biaso et al., SARS-COV-2 CT-scan dataset: A large dataset of real patients CT scans for SARS-COV-2 identification, In: medRxiv. doi: 10.1101/2020.04.24.20078584v3. Accessed 19 Feb 2022. |
[133] | Covid-19, In: Medical segmentation. http://medicalsegmentation.com/covid19/. Accessed 19 Feb 2022. |
[134] | Raddar, Chest X-rays tuberculosis from India, In: Kaggle. https://www.kaggle.com/raddar/chest-xrays-tuberculosis-from-india. Accessed 19 Feb 2022. |
[135] | Find open datasets and Machine Learning Projects, In: Kaggle. https://www.kaggle.com/datasets. Accessed 19 Feb 2022. |
[136] | N. Sajid, Covid-19 patients lungs X ray images 10000, In: Kaggle. https://www.kaggle.com/nabeelsajid917/covid-19-x-ray-10000-images. Accessed 19 Feb 2022. |
[137] | Y. Jiang, H. Chen, M. Loew and H. Ko, Covid-19 CT image synthesis with a conditional generative adversarial network, In: arXiv.org. (2022) . https://arxiv.org/abs/2007.14638. |
[138] | K. Zhang, X. Liu, J. Shen et al., Clinically applicable AI system for accurate diagno-sis, quantitative measurements, and prognosis of covid-19 pneumonia using com-puted tomography, Cell, (2020) . doi: 10.1016/j.cell.2020.04.045. |
[139] | D.S. Kermany, M. Goldbaum, W. Cai et al., Identifying medical diagnoses and treat-able diseases by image-based Deep Learning, Cell, (2018) . doi: 10.1016/j.cell.2018.02.010. |
[140] | M. Jun, G. Cheng, W. Yixin et al., Covid-19 CT Lung and infection segmentation da-taset, In: Zenodo. https://zenodo.org/record/3757476. Accessed 19 Feb 2022. |
[141] | P. Mooney, Chest X-ray images (pneumonia), In: Kaggle. https://www.kaggle.com/paultimothymooney/chest-xray-pneumonia. Accessed 19 Feb 2022. |
[142] | S. Hu, Y. Gao, Z. Niu et al., Weakly supervised deep learning for COVID-19 infec-tion detection and classification from CT Images, IEEE Access 8: ((2020) ), 118869–118883. doi: 10.1109/access.2020.3005510. |
[143] | Y. Li, D. Wei, J. Chen et al., Efficient and effective training of COVID-19 classifica-tion networks with self-supervised dual-track learning to rank, IEEE Journal of Biomedi-cal and Health Informatics 24: ((2020) ), 2787–2797. doi: 10.1109/jbhi.2020.3018181. |
[144] | J.R. Ferreira, D. Armando Cardona Cardenas, R.A. Moreno et al., Multi-view ensem-ble convolutional neural network to improve classification of pneumonia in low contrast chest X-ray images, in: 2020 42nd Annual International Conference of the IEEE Engineer-ing in Medicine & Biology Society (EMBC), (2020) . doi: 10.1109/embc44109.2020.9176517. |
[145] | S. Bharati, P. Podder, M.R. Mondal and V.B.S. Prasath, CO-ResNet: Optimized resnet model for covid-19 diagnosis from X-ray images, International Journal of Hybrid Intelligent Systems 17: ((2021) ), 71–85. doi: 10.3233/his-210008. |
[146] | X. Wang, Y. Peng, L. Lu et al., Chestx-Ray8: Hospital-scale chest X-ray database and benchmarks on weakly-supervised classification and localization of common thorax diseases, in: 2017 IEEE Conference on Computer Vision and Pattern Recognition (CVPR), (2017) . doi: 10.1109/cvpr.2017.369. |
[147] | M. Elleuch, F. Marzougui and M. Kherallah, Diagnostic method based DL approach to de-tect the lack of elements from the leaves of diseased plants, International Journal of Hy-brid Intelligent Systems 17: ((2021) ), 33–42. doi: 10.3233/his-210002. |
[148] | N.K. Valappil and Q.A. Memon, CNN-SVM based vehicle detection for UAV platform, International Journal of Hybrid Intelligent Systems 17: ((2021) ), 59–70. doi: 10.3233/his-210003. |
[149] | L. Oulladji, K. Feraoun, M. Batouche and A. Abraham, Arabic text detection using en-semble machine learning, International Journal of Hybrid Intelligent Systems 14: ((2018) ), 233–238. doi: 10.3233/his-180254. |
[150] | L.F. Souza, G. Holanda, F.H. Silva et al., Automatic Lung segmentation in CT images using mask R-CNN for mapping the feature extraction in supervised methods of machine learning using transfer learning, International Journal of Hybrid Intelligent Systems 16: ((2021) ), 189–205. doi: 10.3233/his-200287. |

