the Creative Commons Attribution 4.0 License.
the Creative Commons Attribution 4.0 License.
 | 22 Feb 2022
Declines and peaks in NO2 pollution during the multiple waves of the COVID-19 pandemic in the New York metropolitan area
Charlotte F. Kwong
Daniel Goldberg
Luke Schiferl
Róisín Commane
Nader Abuhassan
James J. Szykman
Lukas C. Valin
The COVID-19 pandemic created an extreme natural experiment in which sudden changes in human behavior and economic activity resulted in significant declines in nitrogen oxide (NOx) emissions, immediately after strict lockdowns were imposed. Here we examined the impact of multiple waves and response phases of the pandemic on nitrogen dioxide (NO2) dynamics and the role of meteorology in shaping relative contributions from different emission sectors to NO2 pollution in post-pandemic New York City. Long term (> 3.5 years), high frequency measurements from a network of ground-based Pandora spectrometers were combined with TROPOMI satellite retrievals, meteorological data, mobility trends, and atmospheric transport model simulations to quantify changes in NO2 across the New York metropolitan area. The stringent lockdown measures after the first pandemic wave resulted in a decline in top-down NOx emissions by approx. 30 % on top of long-term trends, in agreement with sector-specific changes in NOx emissions. Ground-based measurements showed a sudden drop in total column NO2 in spring 2020, by up to 36 % in Manhattan and 19 %–29 % in Queens, New Jersey (NJ), and Connecticut (CT), and a clear weakening (by 16 %) of the typical weekly NO2 cycle. Extending our analysis to more than a year after the initial lockdown captured a gradual recovery in NO2 across the NY/NJ/CT tri-state area in summer and fall 2020, as social restrictions eased, followed by a second decline in NO2 coincident with the second wave of the pandemic and resurgence of lockdown measures in winter 2021. Meteorology was not found to have a strong NO2 biassing effect in New York City after the first pandemic wave. Winds, however, were favorable for low NO2 conditions in Manhattan during the second wave of the pandemic, resulting in larger column NO2 declines than expected based on changes in transportation emissions alone. Meteorology played a key role in shaping the relative contributions from different emission sectors to NO2 pollution in the city, with low-speed (< 5 m s−1) SW-SE winds enhancing contributions from the high-emitting power-generation sector in NJ and Queens and driving particularly high NO2 pollution episodes in Manhattan, even during – and despite – the stringent early lockdowns. These results have important implications for air quality management in New York City, and highlight the value of high resolution NO2 measurements in assessing the effects of rapid meteorological changes on air quality conditions and the effectiveness of sector-specific NOx emission control strategies.
- Article
(7726 KB) -
Supplement
(529 KB) - BibTeX
- EndNote


The global outbreak of the Coronavirus Disease 2019 (COVID-19) profoundly changed the world. From school closures to remote work and other physical distancing measures, this crisis changed the way we move within our communities, potentially with long-term implications (Barbieri et al., 2021; Przybylowski et al., 2021). Altered mobility patterns led to sudden and significant worldwide decreases in nitrogen oxide (NOx) emissions from the transportation sector, as documented in many studies focusing on air quality changes immediately after the initial lockdowns (e.g., Liu et al., 2020; Goldberg et al., 2020; Gkatzelis et al., 2021). Yet, the impact of multiple pandemic waves over longer time periods, and the role of meteorology and sector-specific emissions as key drivers of high NOx pollution episodes that occurred in major cities such as New York – even during, and despite, the most stringent early lockdown periods – remain largely unknown, driving this study.
New York City (NYC), the most populous and most densely populated city in the Unites States, was hit particularly hard by the pandemic. By late-March 2020, the tri-state region of New York (NY), New Jersey (NJ), and Connecticut (CT) declared a disaster emergency and issued stay-at-home restrictions in response to COVID-19. Almost 8 million New Yorkers sheltered in place, while roughly 5 % of New York City residents (about 420 000 people) left the city between March and May (Quealy, 2020; Bounds, 2020). The largest decrease in residential population occurred in Manhattan – with more than 30 % reduction in relatively wealthy neighborhoods including Upper West and Upper East Side – while the rest of the city saw comparably modest losses (Quealy, 2020). The entire New York metropolitan area (approx. 12 000 km2, McCarthy, 2021) remained in lockdown with strict social distancing measures, including school and non-essential business closures, limited transit services, and suspension of public events and gatherings, for more than 2 months, from mid-March through June 2020. Lockdown measures were relaxed and the first phase of reopening began in June with the area progressing to the final stage of reopening in July. Yet, social distancing measures became strict again, including school closures, as the city experienced a surge in COVID-19 cases in late fall 2020 that reached a maximum in mid-January 2021 with more cases reported to NYC Department of Health and Mental Hygiene than during the first wave of the pandemic (Fig. S1). Early studies using satellite data from the Ozone Monitoring Instrument (OMI) and the Tropospheric Monitoring Instrument (TROPOMI) revealed 31 (± 14) %, and 28 (± 11) % reduction, respectively, in nitrogen dioxide (NO2) tropospheric column amount within a 100 km radius of New York City during the 3 weeks following the onset of the pandemic compared to the same period in 2019 (Bauwens et al., 2020). Similarly, Goldberg et al. (2020) reported a 20 % drop in TROPOMI NO2 within a 22 km radius of New York City between 13 March and 30 April 2020.
Emitted to the atmosphere primarily during fossil fuel combustion, nitrogen oxides (NOx = NO + NO2) are a major source of air pollution and necessary precursors of tropospheric ozone, impacting climate as well as human and ecosystem health (Fares et al., 2013; Duan et al., 2019; Burnett et al., 2004). High NO2 levels have been associated with lung irritation and reduced lung function, increased asthma attacks, and cardiovascular disorders, as well as lower birth weight in newborns and increased risk of premature death (US EPA 2016). In addition, through wet and dry deposition, the atmosphere is a major source of excess nitrogen in many terrestrial and aquatic ecosystems worldwide (Paerl et al., 2002; Pardo et al., 2011). Prior studies have indicated atmospheric deposition accounts for a third or more of total nitrogen loading in systems such as Chesapeake Bay and Long Island Sound, with important implications for soil biogeochemistry, aquatic biology, development of coastal eutrophication, harmful algal blooms, and hypoxia (e.g., Stacey et al., 2001; Decina et al., 2017, 2020). A combination of strict air quality regulation policies (e.g., Jezouit and Rambo, 2005) and technological improvements over the past two decades has resulted in significant declines in NOx emissions over the continental United States (van der A et al., 2008; Duncan et al., 2016; Krotkov et al., 2016). Satellite Aura/OMI observations have captured an approximately 4 % yr−1 decrease in tropospheric column NO2 levels between 2005 and 2015 over the eastern United States (Krotkov et al., 2016) and a 46 % decline in NOx emissions has been reported for New York City over the period from 2006 to 2017 (Goldberg et al., 2019a). Despite these improvements, air pollution continues to be the single biggest environmental health risk in the United States and globally today (Burnett et al., 2018; Thakrar et al., 2020; WHO, 2019). With significant NOx emissions from various sectors (e.g., transportation, energy, industrial), the New York metropolitan area experiences among the highest national NO2 levels (Herman et al., 2018) and has the worst nonattainment record of ozone in eastern North America (based on the EPA 2015 standard) (Karambelas et al., 2020).
Restrictions on human and economic activities, particularly reductions in transportation emissions due to the COVID-19 stay-at-home orders, provide a unique opportunity to assess the importance of different sources of air pollution in New York City and how further sector-specific NOx emission reductions may impact nitrogen pollution in this major urban center. The overarching objective of this study was to examine how NO2 dynamics changed in the New York metropolitan area during the multiple phases of the pandemic and across regions experiencing different shifts in mobility patterns. Ground-based measurements conducted over a period of 3.5 years (2017–2021) allowed us to capture interannual variability, impacts of meteorology, and changes in air quality as human behavior changed during the multiple pandemic waves and as vehicle traffic started to return to near pre-pandemic levels a year after the initial lockdown. Combining these high-frequency observations with model simulations and satellite imagery uniquely captured NO2 dynamics across multiple scales and highlighted the impact of COVID-19 restrictions not only on NO2 column amounts but also on NO2 spatiotemporal behavior, including seasonal and weekly cycles.
Meteorological factors have a significant impact on atmospheric chemistry as well as transport, transformation, and dispersion of air pollutants (Xu et al., 2011; Banta et al., 2011; Goldberg et al., 2020). Elucidating the role of meteorology is thus important in assessments of COVID-19 impacts on urban air quality (Gkatzelis et al., 2021). Seasonality and local meteorology were previously reported to drive NO2 changes in New York City by as much as a factor of 2 over the course of a year (Goldberg et al., 2020). Although meteorological patterns were especially favorable for low NO2 in much of the United States in spring 2020, varying meteorological conditions in New York City were not found to have a biasing effect in TROPOMI estimates of NO2 declines during the initial lockdown period (Goldberg et al., 2020). Because our study extended over a longer time period, we explicitly investigated how weather conditions may have impacted observed changes in NO2 pollution and the relative contribution of different NOx emissions sectors (i.e., energy versus transportation) during the multiple phases of the pandemic.
2.1 Ground-based measurements of column NO2 dynamics
To assess the impact of COVID-19 restrictions on NO2 spatiotemporal behavior we used high-frequency (approx. every 1 min) measurements of total column NO2 (TCNO2) from the ground-based Pandonia Global Network (PGN, https://www.pandonia-global-network.org/, data last access: 4 June 2021). Sponsored by the National Aeronautics and Space Administration (NASA) and the European Space Agency (ESA), PGN provides real-time, standardized, calibrated, and verified air quality data, and associated uncertainty values, from a network of Pandora spectrometer instruments (PSIs, Herman et al., 2019). The PGN global network serves as a validation resource for UV–visible satellite sensors on low-earth and geostationary orbit, and recent studies have included Pandora measurements for ground-based validation of TROPOMI NO2 measurements near New York City and Long Island Sound (Judd et al., 2020; Verhoelst et al., 2021). In the New York metropolitan area, PGN sites include Manhattan, NY (PSI #135), Queens, NY (PSIs #55, #140), New Brunswick, NJ (PSIs #56, #69), and New Haven, CT (PSIs #20, #64) (Table 1, Fig. 1). PSI #135 in Upper West Manhattan, NY, has the longest data record (since December 2017) among these instruments and is located on the Advanced Science Research Center (ASRC) Rooftop Observatory at the City College of New York campus, an intensive urban air-quality monitoring site. The Pandora sensor in Queens, NY, is located at the CUNY (City University of New York) Queens College, a New York Department of Environmental Conservation (NYDEC) Air Toxics and NCore monitoring site within a dense residential neighborhood and near several major roadways. The Pandora in New Haven, CT, is located at the Connecticut Department of Energy and Environmental Protection (CTDEEP) Photochemical Assessment Monitoring Station (PAMS) in Criscuolo Park, at the confluence of the Mill and Quinnipiac rivers surrounded by a residential neighborhood near the elevated intersection of three major highways and industrial activities across the rivers. The New Jersey Department of Environmental Protection (NJDEP) Photochemical Assessment Monitoring Station (PAMS) in New Brunswick, NJ, includes a Pandora sensor located on the roof of the Rutgers (NJDEP) research shelter, which is dedicated to atmospheric research, on a university research farm in a suburban neighborhood and approximately 20 km from the coast.
Table 1Pandora sites (including names of local principal investigator (PI)), and mean, standard deviation (SD), and maximum (max) total column NO2 (TCNO2) amounts (based on half-hour averages) measured before (pre-) and after (post-) the COVID-19 lockdown in New York.
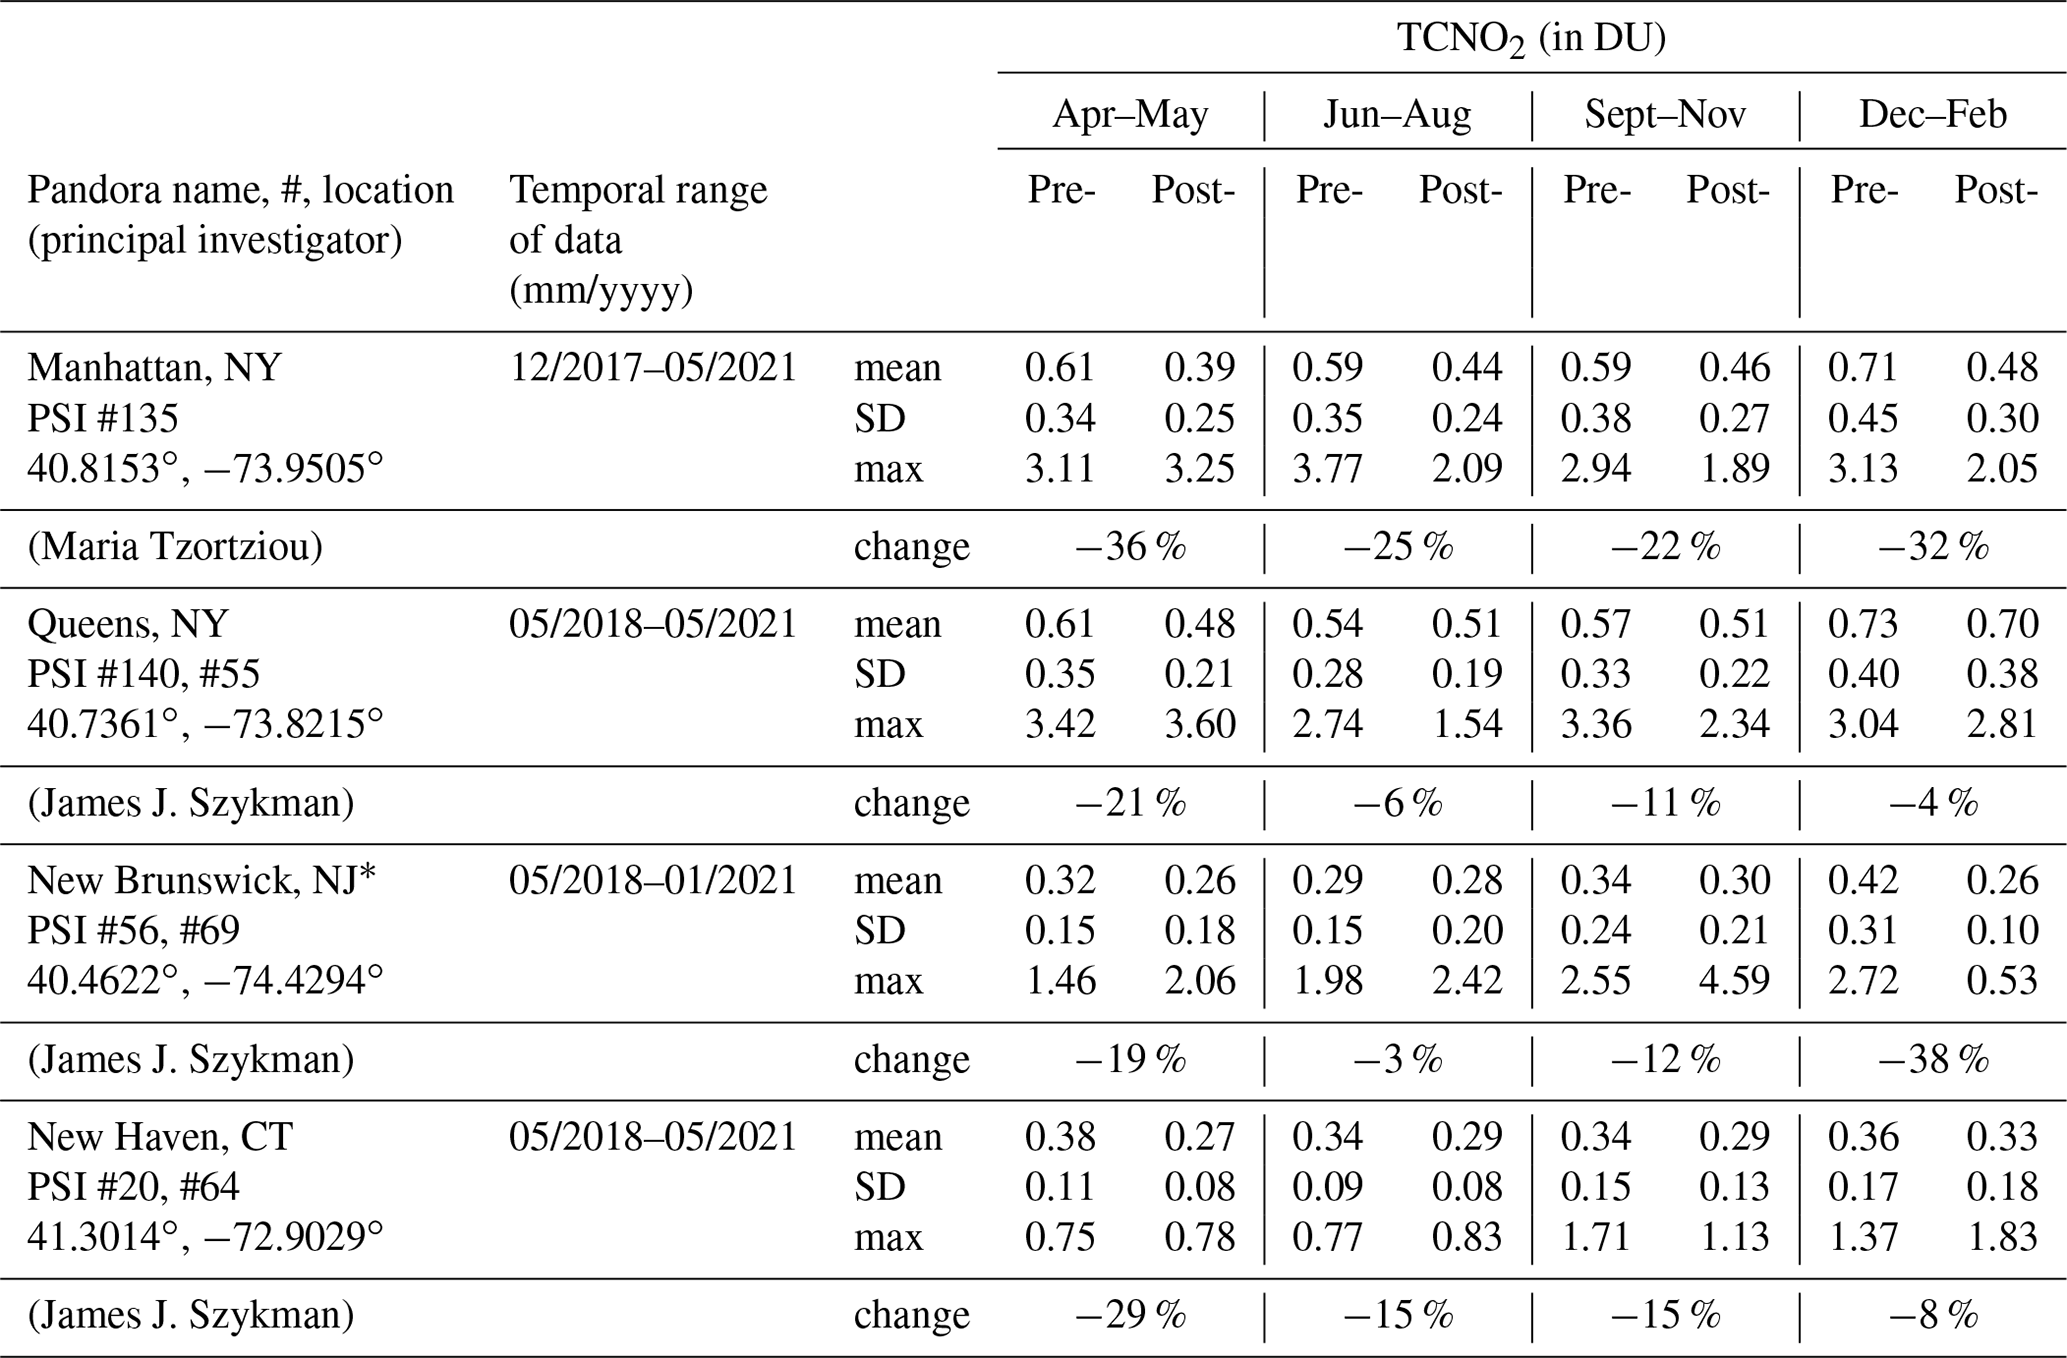
The December–February period for New Brunswick contains 16 d of data in December 2020, 1 d of data in January 2021, and no data in February 2021.
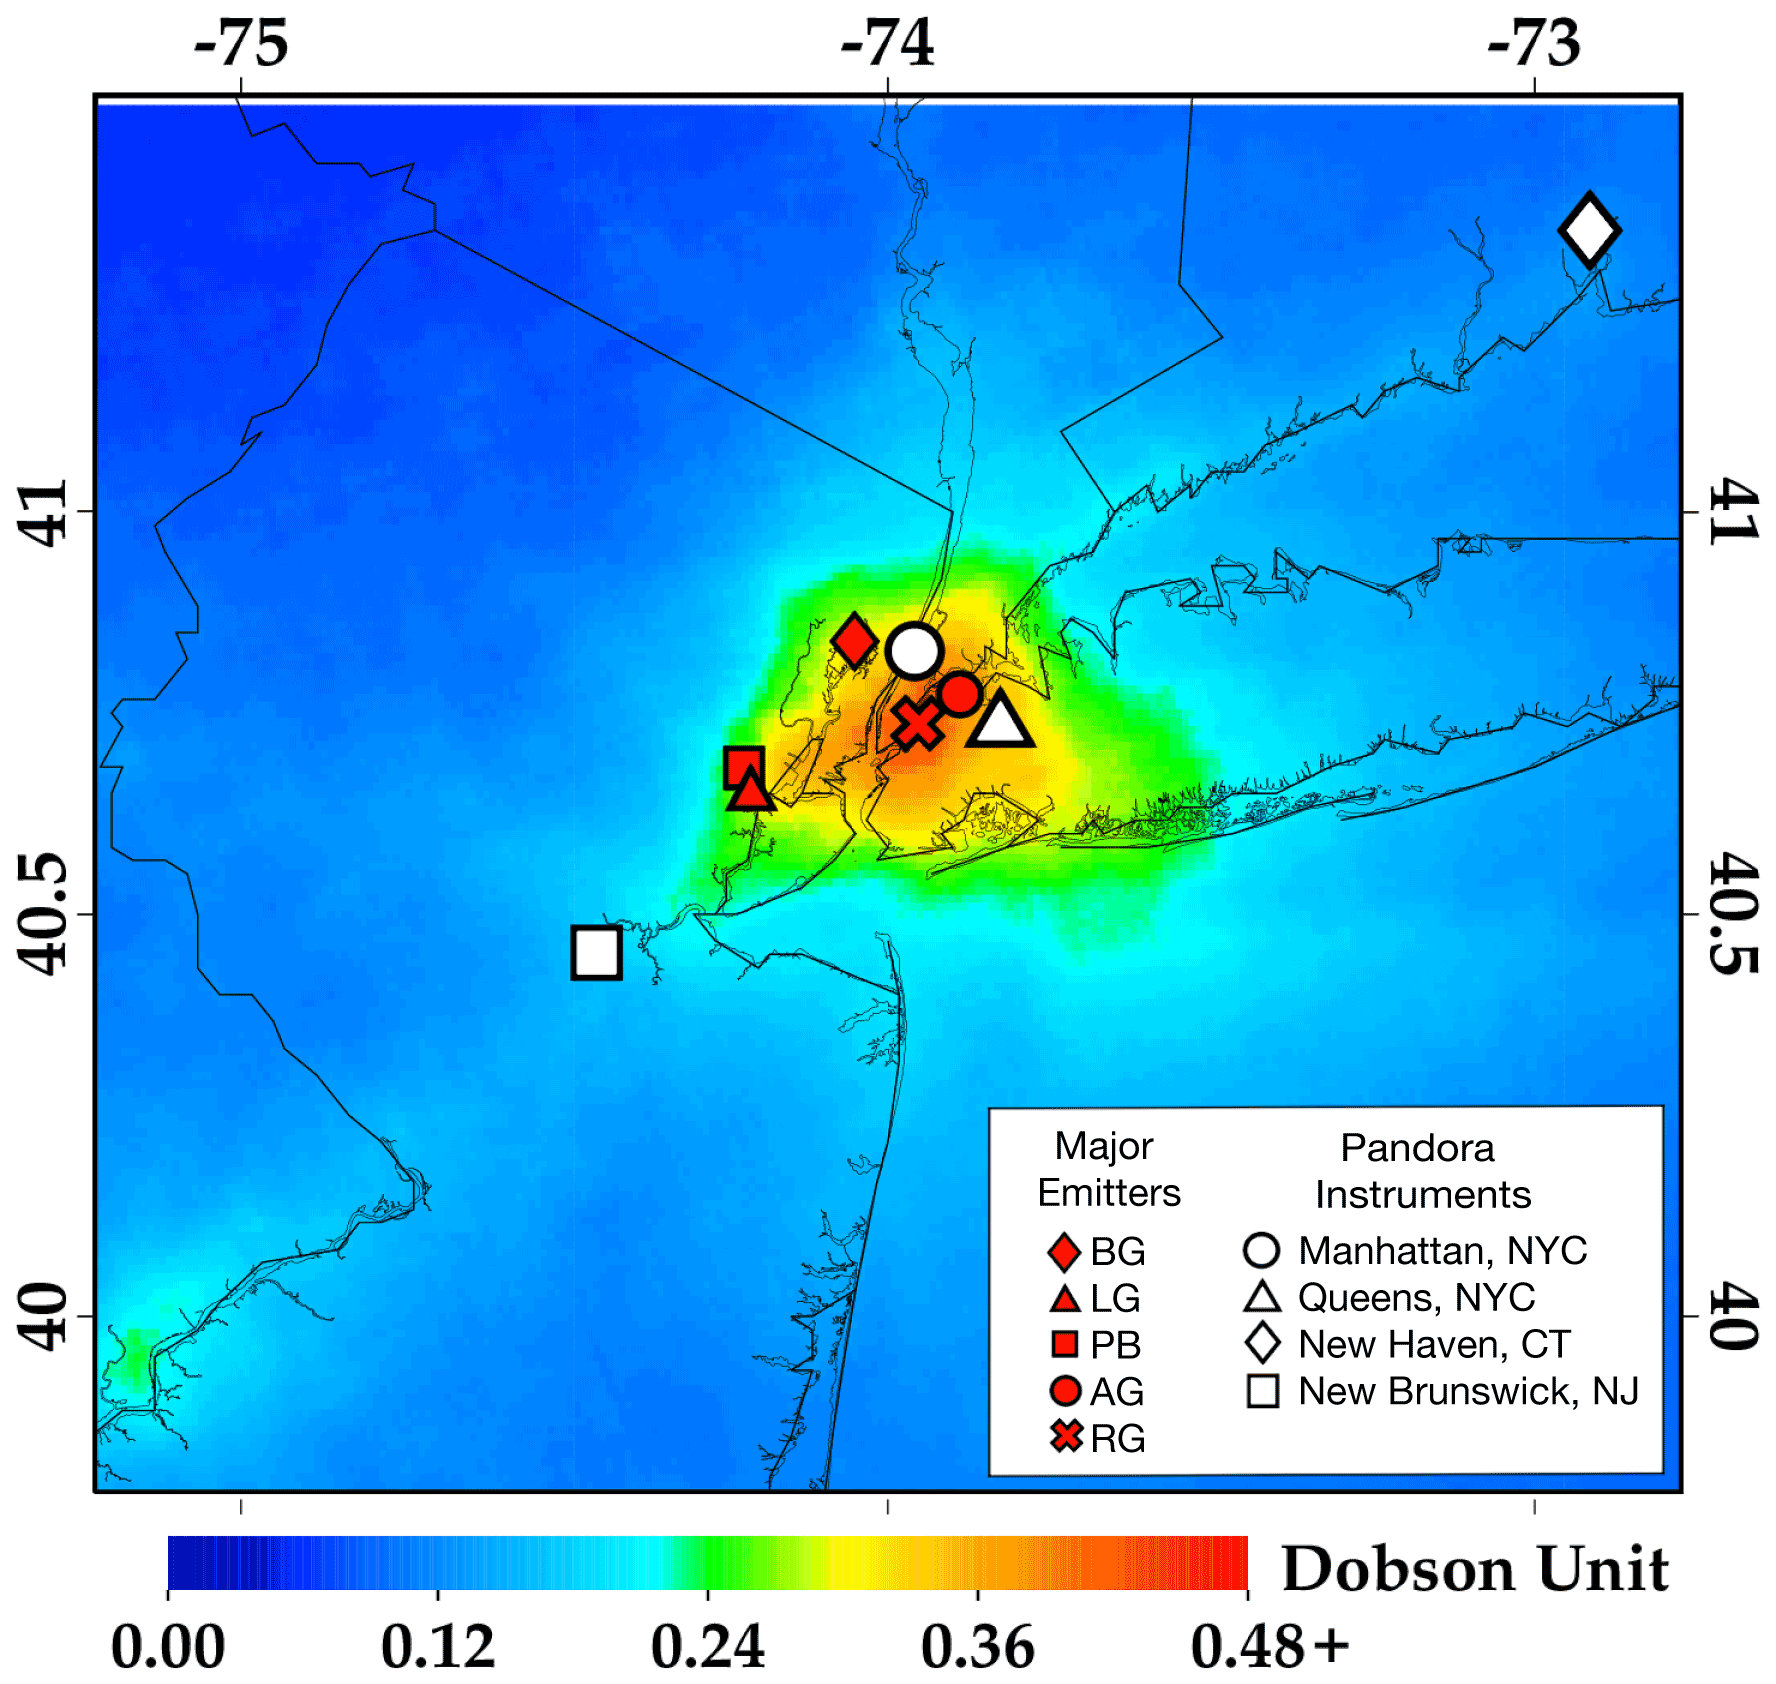
Figure 1Map of study area, indicating location of Pandora sensors (white symbols) in: Manhattan, NY; Queens, NY; New Brunswick, NJ; and New Haven, CT; overlaid with mean 2019 annual total column NO2 from TROPOMI (in DU). Major pollutant emitters (red symbols) in the area are included, specifically the PSEG Bergen Generating Station in Ridgefield (BG), the Linden Generating Station (LG), and the Phillips 66 Bayway (PB) Refinery in Linden (major emission sources in NJ), and the Astoria (AG) and Ravenswood Generating (RG) Stations in Queens, NY (among the largest greenhouse gas polluters in the state of NY in 2018 and 2019).
Pandora is a sun/sky/lunar passive UV/visible spectrometer system, driven by a highly accurate sun tracker that points an optical head at the sun and transmits the received light to an Avantes low stray light CCD spectrometer (spectral range: 280–525 nm; spectral resolution: 0.6 nm with 4 times oversampling) through a fiber optic cable (Herman et al., 2019; Tzortziou et al., 2014). The spectrometer is temperature stabilized at 20 ∘C inside a weather resistant container. Trace gas abundances along the light path are determined using differential optical absorption spectroscopy (DOAS). The system can operate in both direct-sun and sky-scan mode for retrievals of O3, NO2, SO2 and CH2O total columns and information on vertical profile (Tzortziou et al., 2018; Herman et al., 2018; Spinei et al., 2018), and is an enhanced monitoring instrument for characterizing upper air pollutants under the US EPA PAMS program (Szykman et al., 2019). The estimated TCNO2 error in Pandora retrievals is approximately 0.05 DU (1 DU = 2.69×10¹⁶ molec cm−2) (Herman et al., 2019). Pandora data were filtered here for normalized root-mean square of weighted spectral fitting residuals less than 0.05, uncertainty in NO2 retrievals less than 0.05 DU, and TCNO2 > 0.
2.2 TROPOMI satellite retrievals
Jointly developed by the Netherlands and ESA, TROPOMI is an air quality monitoring sensor onboard the sun-synchronous Copernicus Sentinel-5 Precursor satellite, launched on 13 October 2017 (Veefkind et al., 2012). On a low-earth (825 km) orbit, Sentinel-5P has a daily Equator overpass time of approximately 13:30 local time and global daily coverage. TROPOMI has a spatial resolution of 7.2 km (5.6 km as of 6 August 2019) along-track by 3.6 km across-track at nadir, a significant improvement compared to its predecessors OMI (Ozone Monitoring Instrument) (Levelt et al., 2006) and SCIAMACHY (SCanning Imaging Absorption spectroMeter for Atmospheric CartograpHY) (Bovensmann et al., 1999). Here, we also used data from OMI due to its long-time record exceeding 17 years. TROPOMI's extended spectral range (270–2385 nm) and high spectral resolution (0.25–1 nm) allow observations of cloud, aerosol properties, and key atmospheric trace gases including O3, NO2, CO, SO2, CH4 and CH2O (Veefkind et al., 2012). NO2 retrievals from TROPOMI are based on measurements in the 405–465 nm spectral window. Using a DOAS technique, similar to the Pandora instrument, the top-of-atmosphere spectral radiances are converted into slant column amounts of NO2 between the sensor and the Earth's surface (Boersma et al., 2018). In two additional steps, subtraction of the stratospheric component and incorporation of an air mass factor, the slant column quantity is converted into a tropospheric vertical column content (Beirle et al., 2019; Dix et al., 2020; Goldberg et al., 2019b; Griffin et al., 2019; Ialongo et al., 2020; Reuter et al., 2019; Zhao et al., 2020). For this analysis, we used the operational “off-line” TROPOMI NO2 data set, Version 1.02 between 30 April 2018–19 March 2019 and Version 1.03 20 March 2019–28 November 2020. We do not continue the TROPOMI analysis beyond 28 November 2020 due to a significant change in the algorithm (to version 1.04) on 29 November 2020. TROPOMI data are filtered using a quality assurance flag (QA), in which pixels with QA values greater than 0.75 are utilized; no other filter has been applied. Validation of TROPOMI NO2 V1.02 tropospheric columns over the New York City metropolitan area indicate columns are biased low, varying 19 %–33 % (Judd et al., 2020).
2.3 Satellite-derived NOx emissions
We used an inverse statistical modeling technique (Goldberg et al., 2019b; Laughner and Cohen, 2019) to derive the New York City NOx emission rates from a combination of TROPOMI satellite data and re-analysis meteorology. This method accounts for daily changes in temperature, sun angle, wind speed, and wind direction by calculating a spatiotemporally specific NO2 lifetime. In brief, all NO2 satellite data over New York City were compiled and rotated based on the daily observed wind direction, so that the oversampled plume is decaying in a single direction. We used the closest gridded value without interpolation of the 100 m (above the surface) horizontal wind speed and direction from the ERA5 re-analysis data set (Hersbach et al., 2020) generated at . Once all daily plumes were rotated to be aligned as an effective horizontal plume and averaged together during a 5-month warm season period (May–September; usually ∼ 75 snapshots), we integrated ± 0.5∘ along the y axis about the x axis to compute a one-dimensional line density in units of mass per distance. The line densities, which are parallel to the wind direction, peak near the primary NOx emissions source and gradually decay downwind from a combination of atmospheric dispersion, chemical transformation, and deposition. The line densities were fitted to a statistical exponentially modified Gaussian (EMG) model (Beirle et al., 2011; de Foy et al., 2014; Valin et al., 2013; Verstraeten et al., 2018). The five fitted parameters of the statistical fit are the NO2 background, NO2 mass perturbed above the background threshold (burden), decay distance, horizontal location of apparent source (ideally at the origin), and sigma of the Gaussian plume. The NOx emissions rate from the source can be calculated from the NO2 burden, decay distance, and NOx NO2 ratio, which previous work has shown to be 1.33 (Beirle et al., 2011). After accounting for a systematic low bias of TROPOMI in polluted areas (Judd et al., 2020; Verhoelst et al., 2021), the NOx emissions compare well with known emissions from power plants (Goldberg et al., 2019b). For this project, we do not correct for TROPOMI low bias, but instead assume the low bias is consistent between years and calculate changes between years. A full description of the method can be found in Goldberg et al. (2019a, b).
2.4 STILT model simulations
We used STILT, the Stochastic Time-Inverted Lagrangian Transport model, to calculate the surface influence and contributions from different sources of NO2 pollution to the city. STILT is a Lagrangian particle dispersion model, in this case driven by NOAA High-Resolution Rapid Refresh (HRRR) meteorology at 3 km horizontal resolution, that follows the trajectory of 500 air parcels released from the receptor (measurement site) position backward in time over the previous 24 h. The motion of each parcel is determined by both advection by the large-scale wind fields and random turbulent motion, independent of the other parcels. The proportion of parcels residing in the lower half of the planetary boundary layer determines the influence of surface fluxes on the measured mole fractions. This surface influence is tracked in time and space, which allows for the calculation of a two-dimensional footprint at hourly intervals over the travel period and spatial domain of the particles. The unit of surface influence is defined as the response of each receptor concentration measurement to a unit emission of a trace gas at each grid square (e.g., ppb (µmol m−2 s). In this study, we ran hourly STILT simulations for the 10 h surrounding daily peak NO2, for cases of particularly high total column NO2 amounts (> 1.8 DU, more than three times the average of pre-pandemic levels) measured at the Manhattan and Queens Pandora sites during the COVID-19 lockdown in April 2020 and after the shutdown in October 2020. Simulated particles originated at the elevation of the Pandora instruments. We also performed simulations for one low TCNO2 case in April 2020 for comparison. The STILT footprints were multiplied by 2015 annual gridded maps of NOx emissions (µmol m−2 s−1) at 0.1∘ horizonal resolution from the Emissions Database for Global Atmospheric Research (EDGAR) v5.0, which combine atmospheric pollutant data categorized by anthropogenic emissions sector (e.g., power, manufacturing, transportation), to predict the NO2 concentration enhancement (ppb) that would be expected for each observed hour.
2.5 Meteorological Data
Wind speed and direction data from the ERA5 Model (Copernicus Climate Change Service (C3S), 2017) were used to examine the impact of meteorology on TROPOMI retrieved NO2 column amounts. To downscale the grid ERA5 reanalysis, we spatially interpolate daily averaged winds to using bilinear interpolation (Goldberg et al., 2020). The average 100 m winds during 16:00–21:00 UTC (i.e., approximately the TROPOMI overpass time over North America) were used in our analysis. To assess impacts of meteorology on ground-based measurements of TCNO2 from the Manhattan Pandora PSI#135, we used in situ measurements of wind speed and wind direction (measured at a resolution of 0.01 m s−1 and 1∘, respectively) collected by a collocated ATMOS 41 All-In-One weather station on a 15 min timescale.
2.6 Calculation of change in NO2 column amounts
Change in NO2 column amounts was estimated by comparing post-lockdown TROPOMI and Pandora measurements to the same timeframe in 2018–2019 to account for seasonality and interannual variability (Goldberg et al., 2020; Bauwens et al., 2020). The impact of meteorology on these estimates was explicitly quantified using ERA5 and in situ meteorological data. We estimated changes in NO2 over the different phases of the pandemic in New York City (i) immediately following the initial lockdown in April–May 2020, (ii) as restrictions gradually eased in June–August 2020, (iii) during the re-opening phase in September–November 2020, (iv) as restriction became strict again in December 2020–February 2021 due to the second wave of the pandemic, and (v) in March–May 2021, 1 yr after the initial lockdown. Pandora data were first averaged in half-hour bins to eliminate bias towards times of day with more data, then averaged on weekly, monthly, and seasonal time scales. To examine weekly cycles from satellite observations, TROPOMI data were averaged over longer timescales (April–November), due to the lower temporal resolution and impacts of clouds on satellite retrievals. All computed means for seasonal and weekly cycles were calculated with 95 % confidence intervals using a two-tailed single sample t test. While NO2 data is non-normally distributed, all sample sizes are large (n > 100), and statistics (e.g., p values) were also calculated using the nonparametric Mann–Whitney and Kruskal–Wallis tests which confirmed the validity of t test results.
2.7 Changes in mobility patterns
To examine changes in mobility patterns, we looked at sector-specific mobility indices provided by Apple (Forster et al., 2020; Apple COVID-19 Mobility Trends Reports, 2021) and traffic counts from the Metropolitan Transport Authority (MTA) day-by-day transit data, focusing on bridge and tunnel ridership to represent passenger vehicles (buses, motorcycles, cars, trucks) (NY MTA, 2021). Apple mobility data (accessed on 4 June 2021) tracked mobile phone movements and compared post-COVID-19 data with the average on 13 February 2020 (Forster et al., 2020). For MTA data (https://new.mta.info/coronavirus/ridership, last access: 4 June 2021), bridge and tunnel traffic was quantified from E-ZPass and cash toll collection, and percentage (%) changes in ridership were calculated through comparison to traffic on the pre-COVID equivalent day in the previous year.
3.1 Changes in NO2 column amounts and spatiotemporal dynamics
Satellite imagery from TROPOMI captured significant post-shutdown NO2 reductions in the New York metropolitan area, particularly during the first 3 months after the initial lockdowns (Fig. 2). As MTA bridge and tunnel traffic plummeted by up to 80 % in April 2020 (Fig. S2), TCNO2 over a 50×50 km area around Manhattan dropped by 32 % in March–May 2020 compared to the same period in 2018–2019 (Fig. 2a, d). Smaller declines (< 30 %) were found in the surrounding areas of NJ, upstate NY, and CT. These results are consistent with Bauwens et al. (2020) reporting a decline in TROPOMI tropospheric NO2 column by 28 (± 11) % within a 100 km radius around New York City during the 3 weeks following the onset of the pandemic compared to the same period in 2019. By June–August 2020, total NO2 columns – lower during summer due to increased photochemical loss – rose closer to pre-pandemic levels, with approx. 15 % decline over New York City and even smaller changes (< 10 %) in western NJ, CT, and eastern Long Island (Fig. 2b, e). This recovery in NO2 coincided with the city of New York commencing the first phase of its reopening plan in June 2020 and gradually relaxing lockdown measures, including the opening of restaurants (outdoor dining) and some workplaces. Daily traffic on New York City bridges and tunnels increased to 22 % lower than baseline in summer 2020 (Fig. S2). This trend continued in fall 2020, with TCNO2 showing 13 % drop over New York City and smaller declines over more rural areas in northern NJ and eastern Long Island (Fig. 2c, f).
These values can be compared to long-term NO2 trends from OMI (Fig. S3), which shows a ∼ 3.8 % yr−1 drop between 2005 and 2019. The abrupt TCNO2 changes during the initial phase of the COVID lockdowns, occurring within a matter of days, were approximately equivalent to the drop seen over the prior 10-year period between 2009 and 2019.
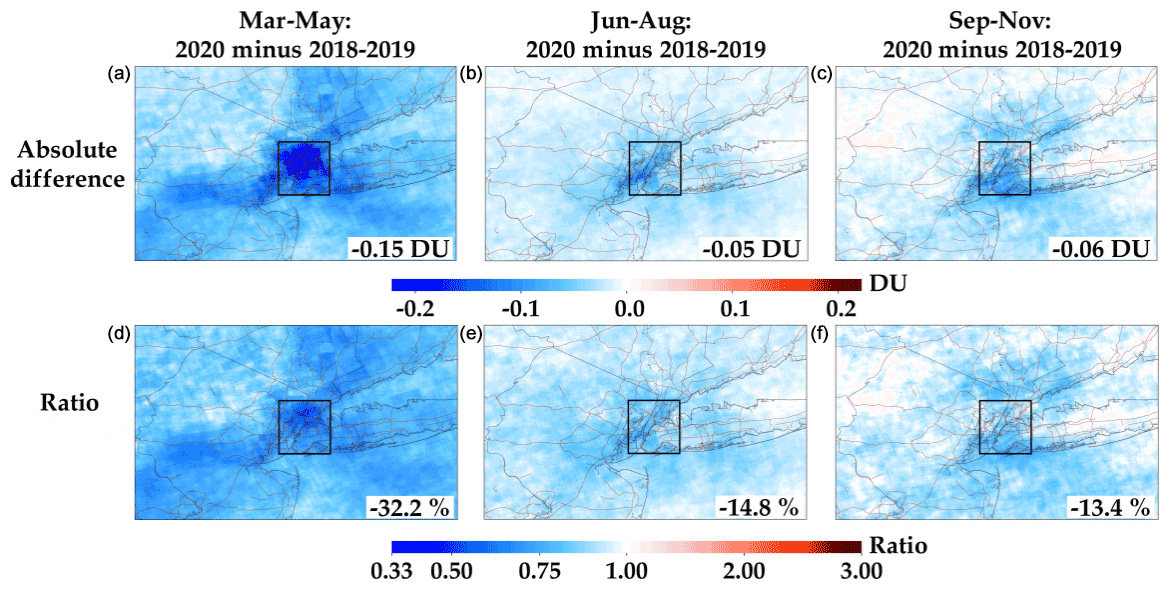
Figure 2TROPOMI total vertical column NO2 differences between 2018–2019 and 2020, over the New York metropolitan area. Results are shown for 13 March through May (a, d), June through August (b, e), and September through November (c, f). (a), (b), and (c) show the absolute difference between the 3-month period in 2018–2019 and 2020 in Dobson units. (d), (e), and (f) show the ratio between the 3-month period in 2018–2019 and 2020. Values denoted in bottom right of each panel are area-averaged difference within a 50×50 km area around Manhattan (black box). 13 March–29 April 2019 data are double counted in the March through May 2018–2019 period due to unavailable data in the 13 March–29 April 2018 timeframe.
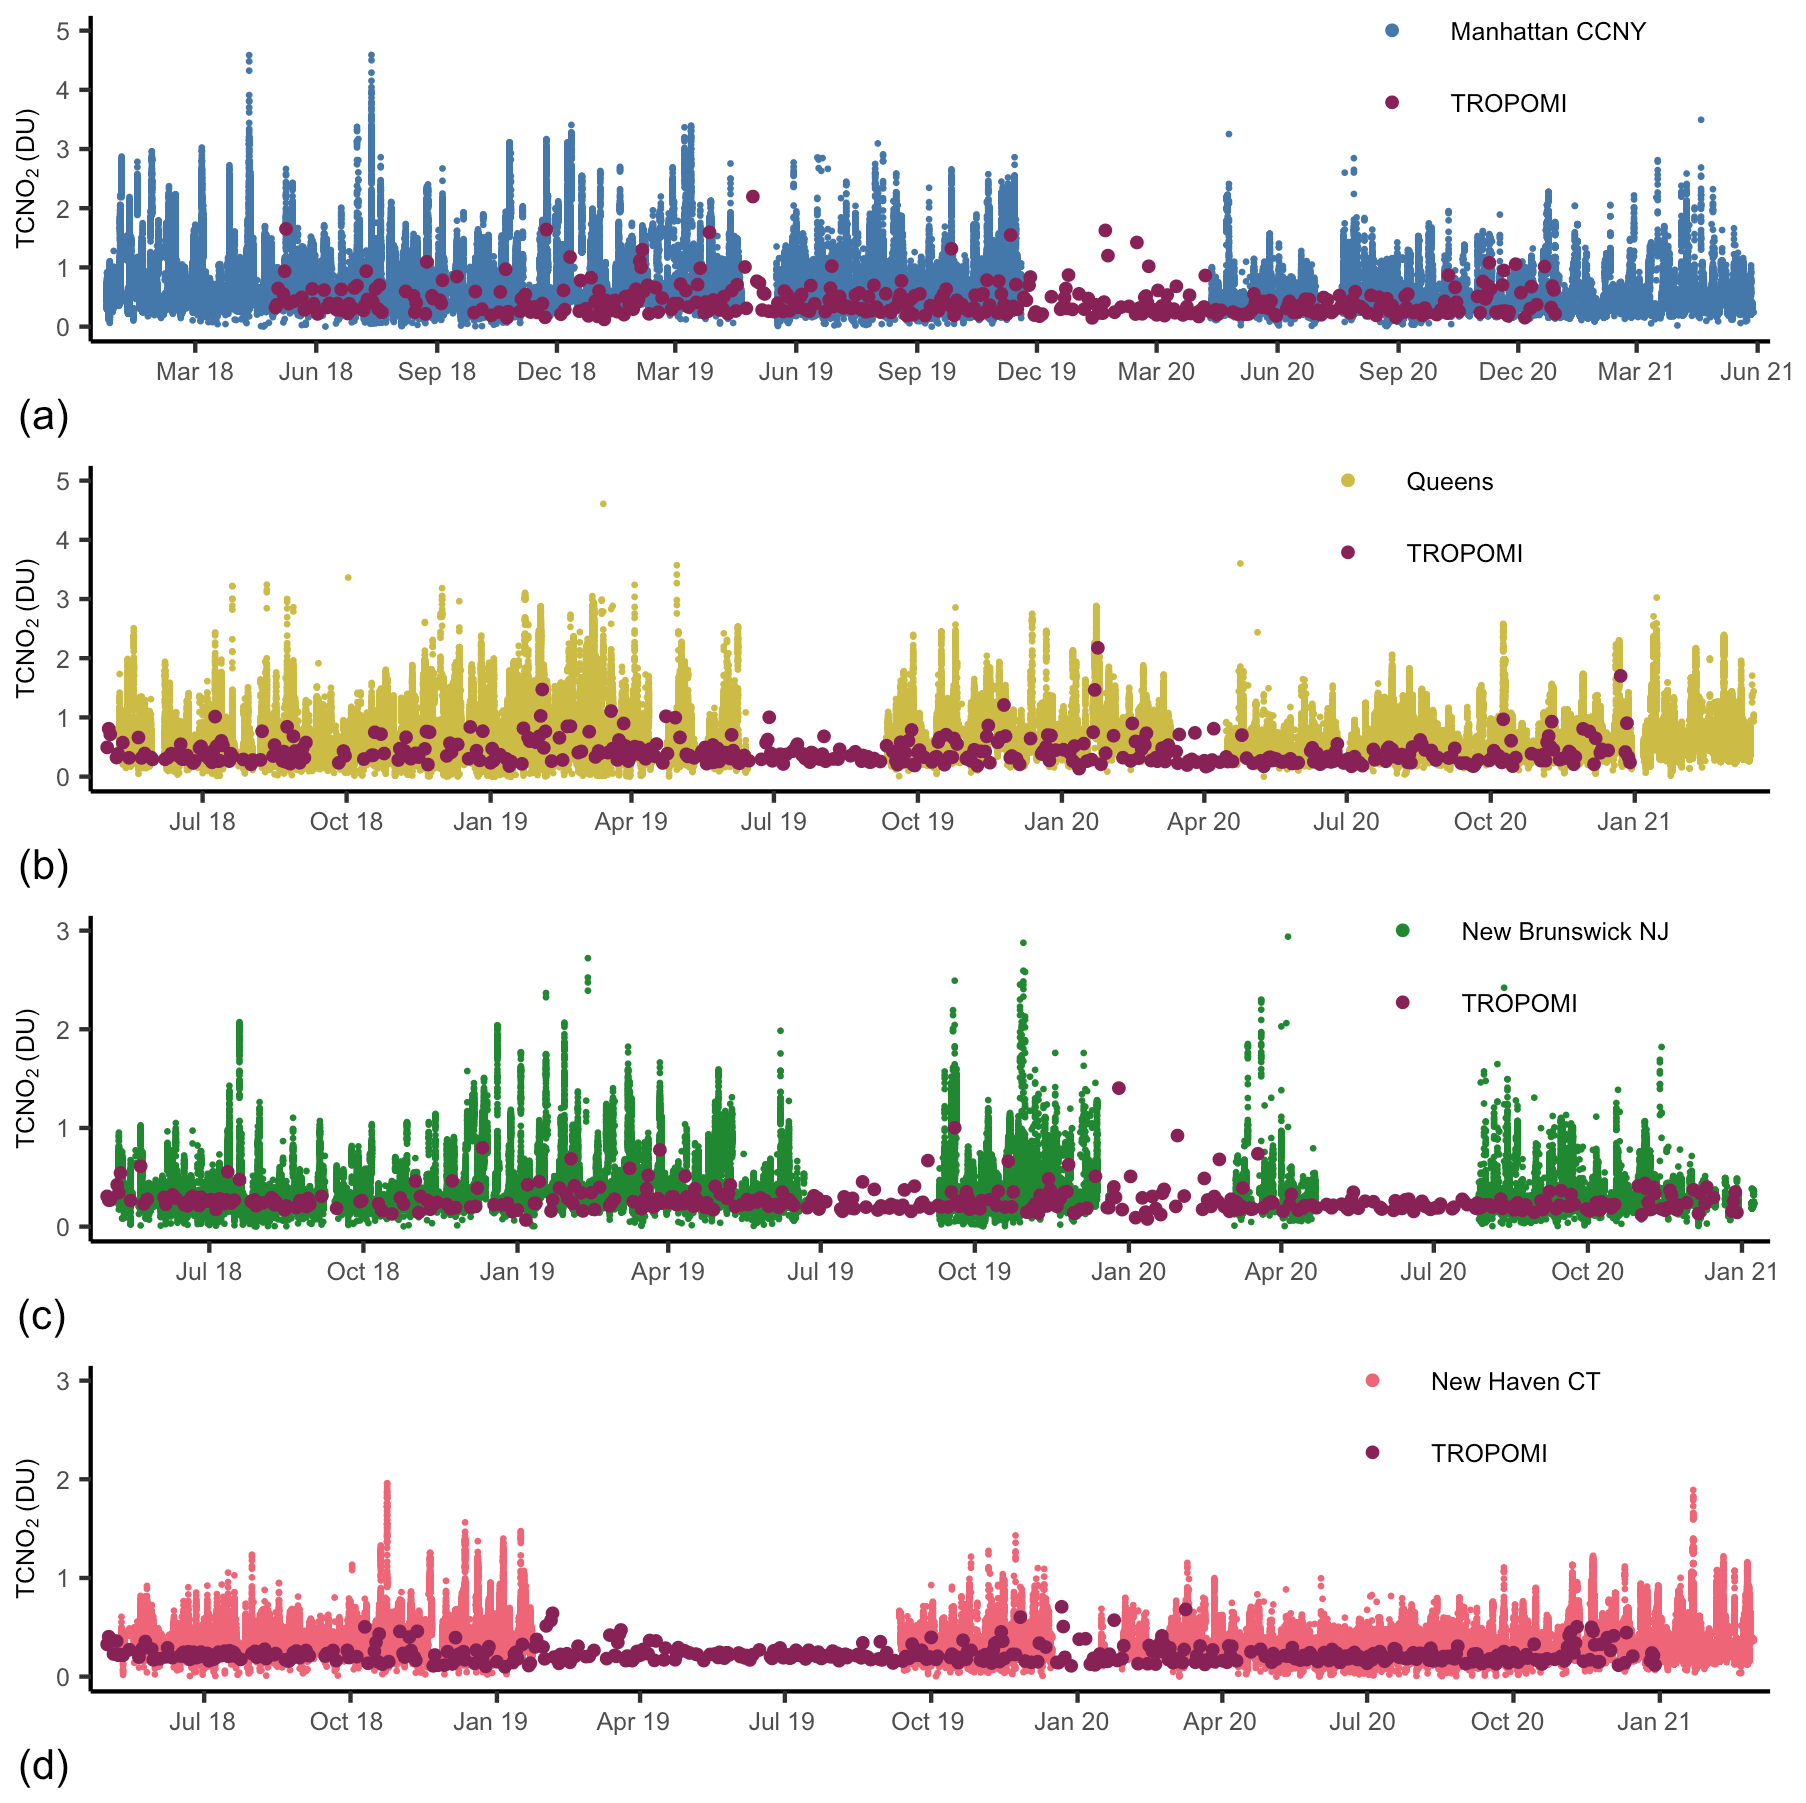
Figure 3Long term (December 2017–February 2021, May 2021 in Manhattan only) data record of TCNO2 (in DU) measured by Pandoras in (a) Upper West Side Manhattan (blue circles), (b) Queens (yellow circles), (c) New Brunswick NJ (green circles) and (d) New Haven CT (pink circles). Total column TROPOMI overpass data at locations of the Pandora instruments is also shown (red circles). No data averaging was performed on Pandora or TROPOMI values.
These abrupt spatiotemporal changes in TCNO2 detected by TROPOMI were remarkably consistent with the higher resolution TCNO2 measurements from the ground-based Pandora network. Prior to lockdown, TCNO2 in Manhattan and Queens, NY, was characterized by high variability, often surpassing 2 DU (Fig. 3). NO2 total columns in New Brunswick, NJ, and New Haven, CT, were overall considerably lower than measurements in New York City, in agreement with pre-pandemic TROPOMI retrievals (Table 1, Figs. 1, 3). Across all sites, pre-pandemic TCNO2 showed a clear seasonal cycle typical of Northern Hemisphere mid-latitude locations, with maxima occurring during the winter (Figs. 3, 4) due largely to increased fossil fuels for domestic heating, the longer tropospheric NO2 lifetime at colder temperatures, less light availability, and a shallower and more stable planetary boundary layer (van der A et al., 2008; Roberts-Semple et al., 2012). Post-shutdown, all Pandora sensors measured a significant drop in TCNO2. In the 2 months following the initial lockdown, TCNO2 in Manhattan decreased by 36 % compared to pre-pandemic levels, with smaller declines, 21 %, 19 % and 29 % respectively, in Queens, New Brunswick, and New Haven (Table 1).
Variability in TCNO2 (Table 1) also decreased at most locations, indicating a reduction in the magnitude of high NO2 pollution episodes. As social distancing restrictions gradually started to ease in June, TCNO2 in Manhattan started to slowly recover, reaching 25 % lower than the pre-pandemic seasonal mean in summer and 22 % lower in fall 2020. NO2 rose even closer to pre-pandemic levels in Queens, New Brunswick, and New Haven, showing less than 15 % decline in summer and fall 2020 (Table 1), consistent with TROPOMI (Fig. 2). TCNO2 in Manhattan, however, dropped again significantly below pre-pandemic levels during the second wave of the pandemic in late 2020 (Table 1, Fig. 4). The decline in TCNO2 reached 39 % in January 2021, consistent with both a decline in mobility (i.e., re-closing of businesses and transition from in-person to online learning in many schools in the area; Fig. S1), as well as favorable meteorological conditions for low NO2 (discussed in Sect. 3.4). As restrictions eased again, NO2 levels rebounded to 11 % and 21 % below pre-pandemic levels in April and May 2021, respectively, more than a year after the COVID-19 outbreak in the United States (Table 1, Fig. 4).
These changes resulted in a departure from typical seasonal NO2 behavior, maximum in winter and minimum in summer, with instead a maximum in monthly mean TCNO2 in July 2020 and two minima tightly linked to the two pandemic waves in May 2020 and January 2021 (Fig. 4). In agreement with Gkatzelis et al. (2021), the NO2 decrease closely followed changes in the stringency of lockdown measures and particularly decreases in traffic, further confirming the importance of the transportation sector as a source of NOx pollution in Manhattan. Still, as discussed in the next section, other emission sectors also contributed significantly to the observed spatiotemporal changes in NO2 pollution over the New York metropolitan area during the multiple waves of the pandemic.
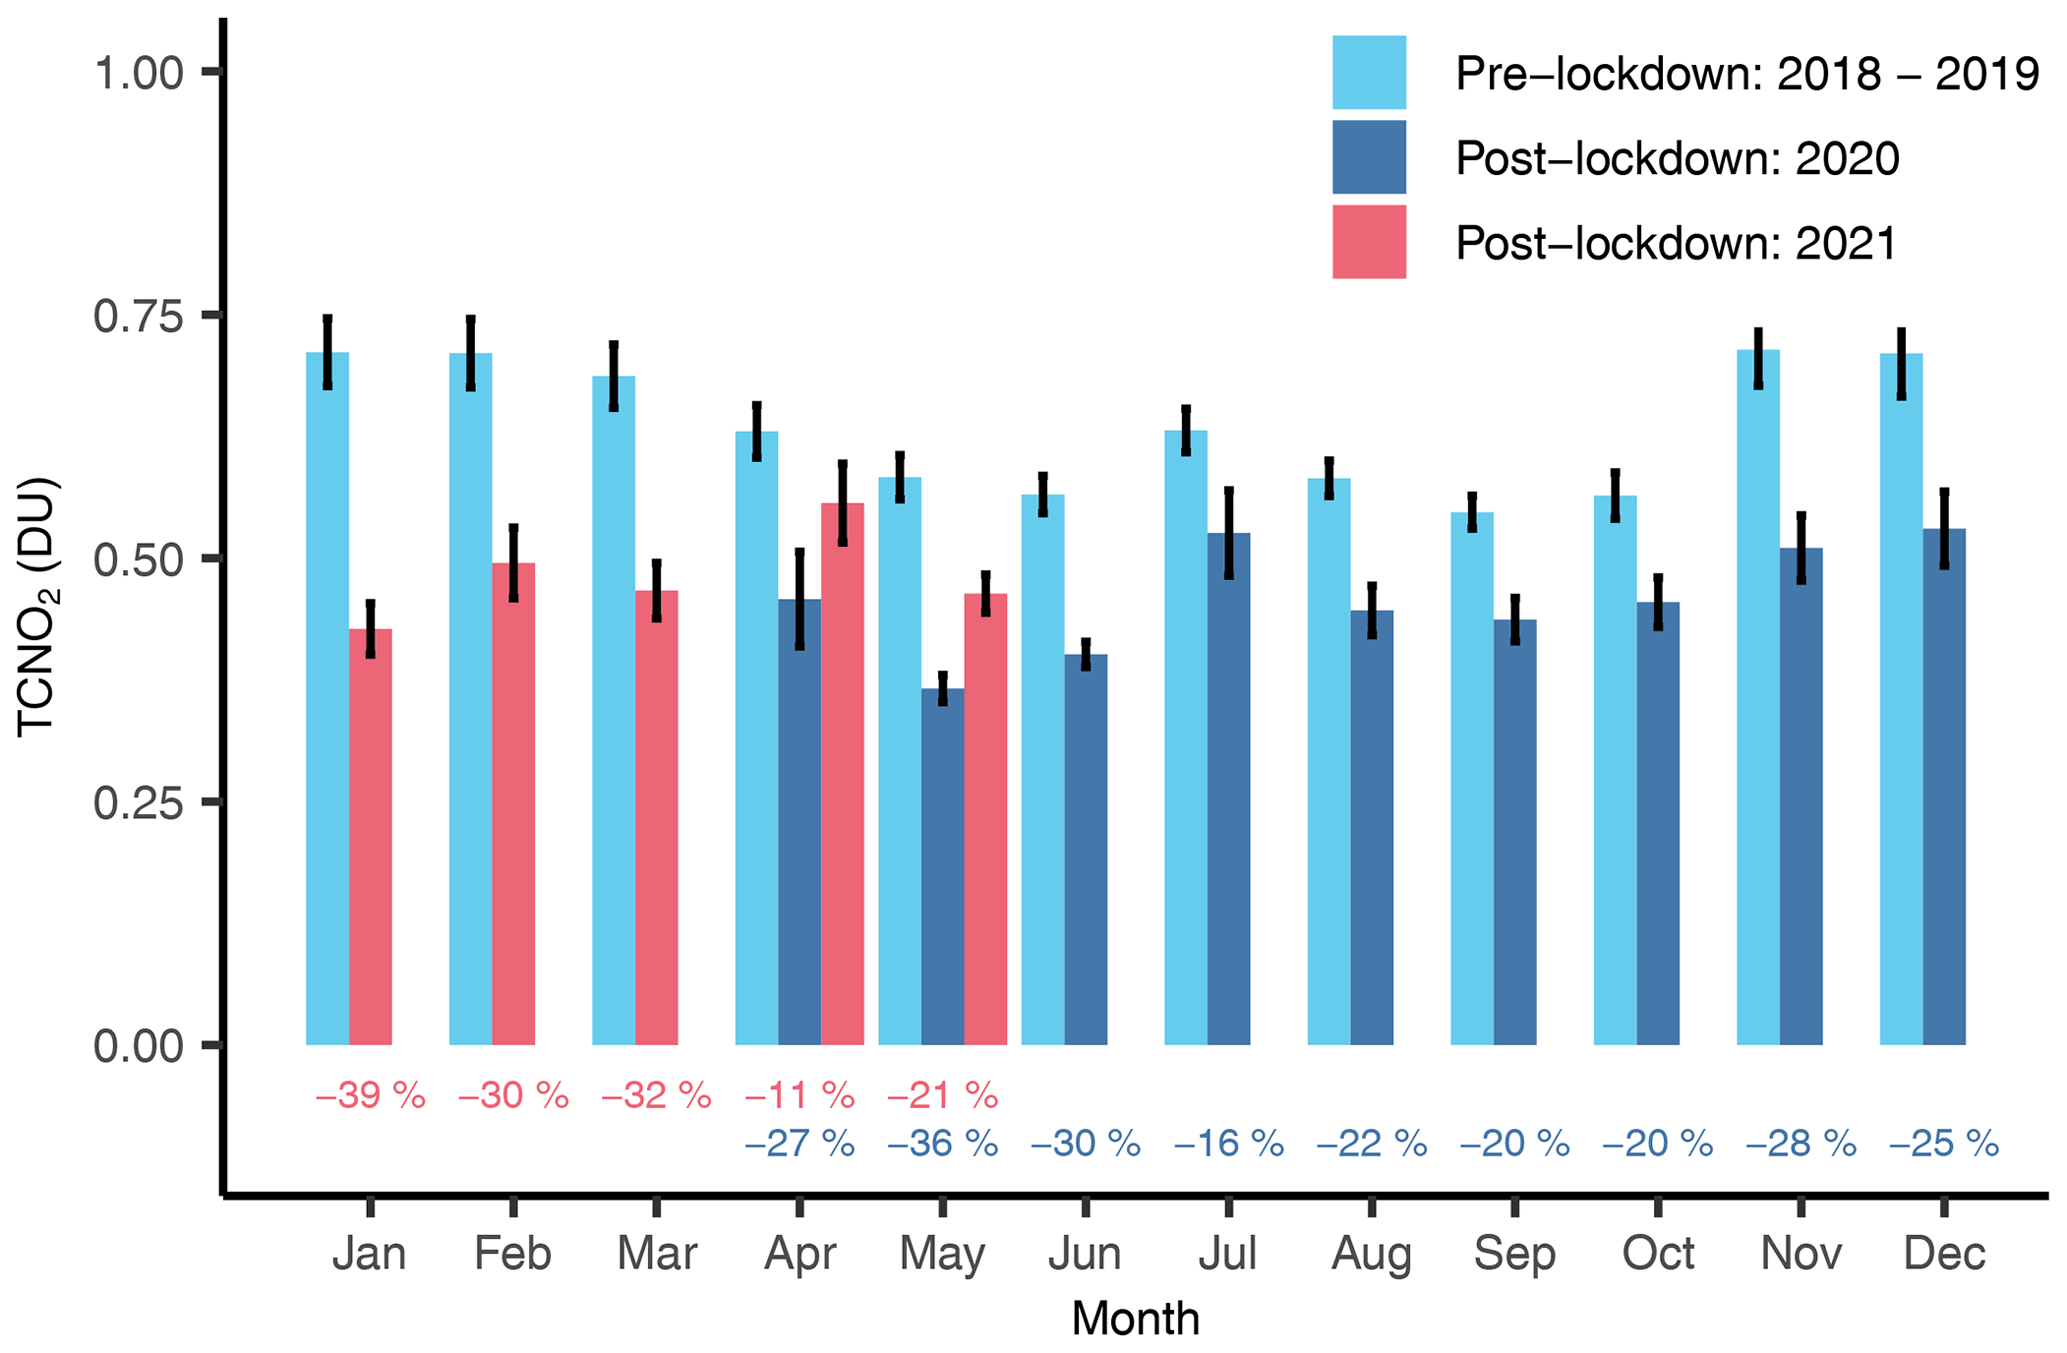
Figure 4Monthly mean seasonal cycle of TCNO2 in Upper West Manhattan pre-lockdown (December 2017–December 2019, cyan) and post-lockdown (April 2020–December 2020, blue, and January–May 2021, red), as measured by PSI #135 (30 min averaged data; 95 % confidence intervals indicated by error bars; data not available during January–March 2020). The percentage (%) change is also shown below each bar.
3.2 Impacts of COVID-19 measures on NOx emissions
While meteorology plays a significant role in air pollution levels, our estimates of top-down NOx emissions from TROPOMI indicate that sudden reductions in NOx emissions due to COVID-19 measures were the dominant factor driving the observed NO2 decline in New York City during the first wave of the pandemic (Fig. 5).
Five-month (May to September) averaged top-down NOx emissions suggest a 34.5 % drop between 2019 and 2020 (Fig. 5). This reduction in NOx emissions is significantly larger than the long-term decline of approx. 4 % yr−1 captured by OMI (Fig. S3) and reported in previous studies for the eastern United States and New York City (Krotkov et al., 2016; Goldberg et al., 2019a), and suggests that COVID-19 measures during the first pandemic wave led to ∼ 30 % reduction in NOx emissions in New York City, on top of the long-term trend resulting from air-quality regulations and technological improvements. The reason TROPOMI TCNO2 changes (Fig. 2) are smaller than NOx changes during the coincident timeframe (ΔTCNO2 : ∼ 24 % vs. ΔNOx : ∼ 35 %) is because there is a background component to NO2.
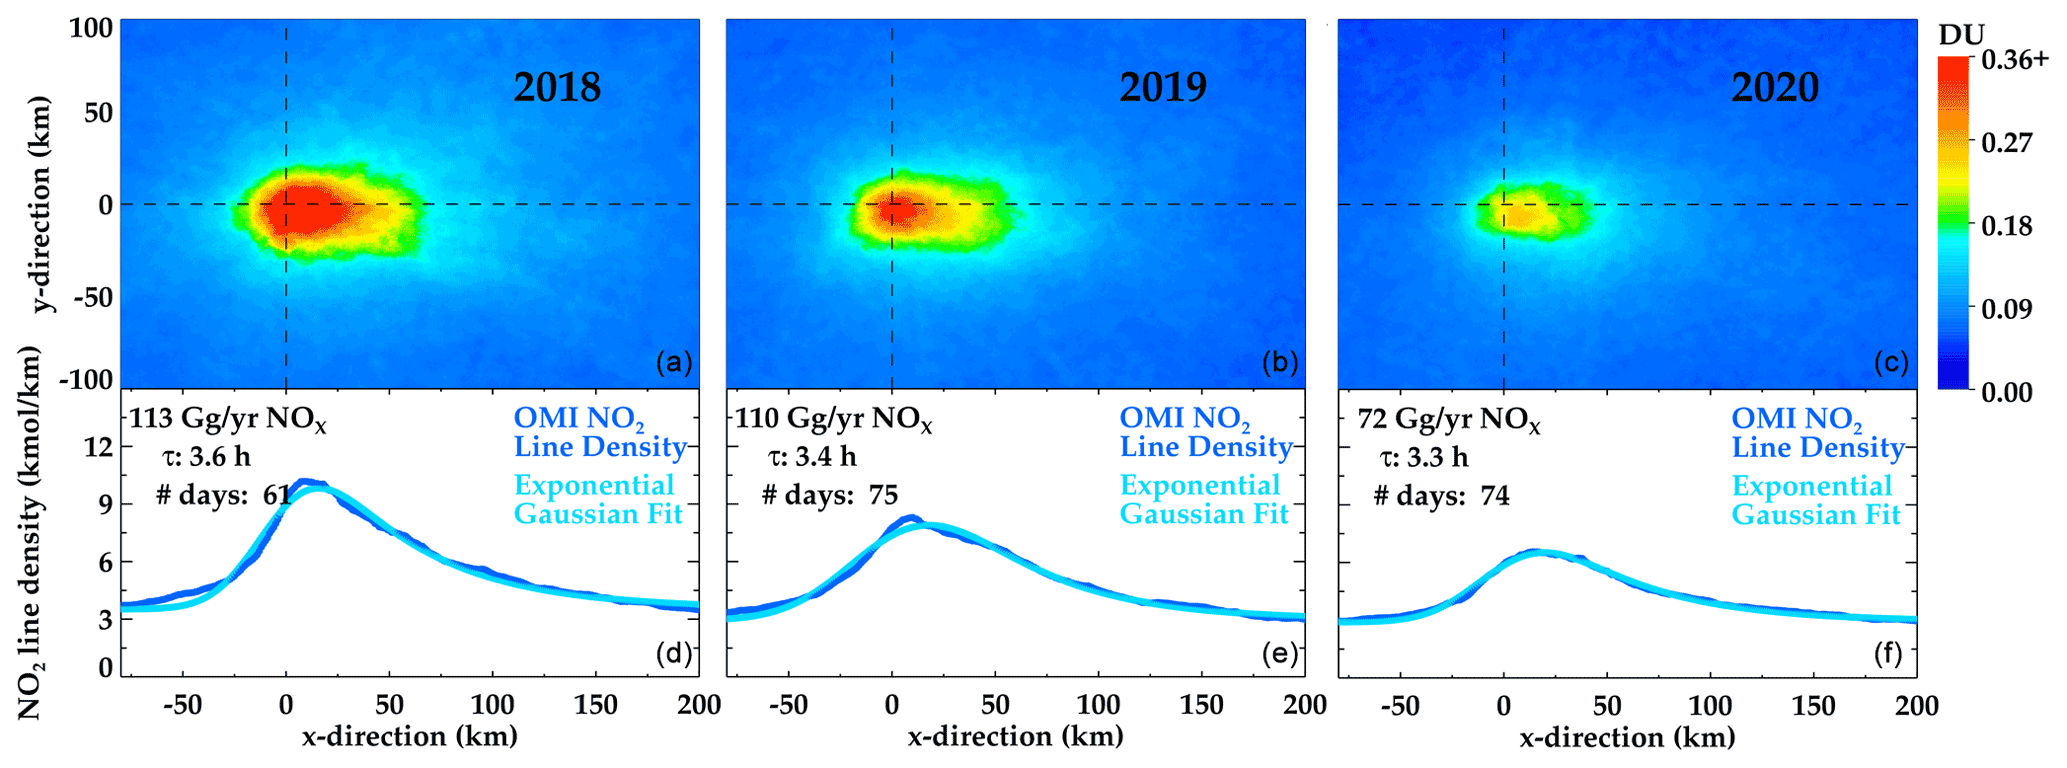
Figure 5Five-month averaged (May–September) top-down NOx emission estimates for the New York metropolitan area, for 2018 (a, d), 2019 (b, e) and 2020 (c, f). TROPOMI NO2 data is rotated based on daily wind direction. (d), (e), and (f) show the TROPOMI NO2 line densities, which are integrals along the y axis ± 50 km about the x axis. The statistical EMG fit to the top-down line densities is shown in light blue.
The EPA National Emissions Inventory (NEI) provides context for expected changes in NOx emissions due to the COVID-19 pandemic. According to 2017 NEI data, mobile sources account for about 59 % of annual NOx emissions in New York City (25 % on-road, and 34 % non-road transportation including non-road equipment (15 %) and locomotives/aircrafts/marine vessels (19 %)). The next largest contributing sector is energy (41 %), which includes electric generation, and residential, commercial, and industrial fuel combustion. Wildfires, biogenic sources, and waste disposal contribute a negligible amount (< 1 %; NEI 2017). New York City NOx emissions are more heavily weighted in the energy sector than other major US cities such as Los Angeles (13 %) and Chicago (26 %) (NEI, 2017). During spring 2020, MTA bridge and tunnel traffic decreased on average by 55 %, nationwide commercial passenger airline and business aviation travel decreased by approx. 75 % and 70 % (Transportation Research Board, 2020; FlightAware, 2020; Bureau of Transportation Statistics (BTS), 2020), while operation of commercial marine vessels, non-road equipment, and locomotives dropped by an estimated ∼ 6 %, ∼ 52 %, and ∼ 15 %–20 %, respectively (United Nations Conference on Trade and Development 2021; Procore, 2020; Bureau of Transportation Statistics, 2020). Applying these reported changes in activity to corresponding estimated NOx contributions from different components of the mobility sector in New York City (EPA) results in an approx. 26 % decrease in NOx emissions. Declines in power generation demand/usage in New York City, however, were considerably smaller, on average 15 % in spring 2020 (New York Independent Systems Operator, 2020). These changes in emissions from the transportation and power generation sector suggest approximately 32 % decrease in NOx emissions in New York City during the first wave of the pandemic, which is consistent with our estimated reduction in top-down NOx emissions from TROPOMI.
The overall less dramatic declines in TCNO2 observed at locations outside Manhattan (e.g., CT and NJ) during the first 2 months following the initial lockdowns agree with reported changes in population, with many city residents across the United States relocating (temporally and long term) to their suburban areas, more so from wealthier than lower-income neighborhoods (Quealy et al., 2020). They are also consistent with mobility trends across our study region, with the strongest mobility declines occurring in New York City. According to Apple mobility data, transportation associated with driving and transit during March–May 2020 were 36 % and 72 % lower than baseline, respectively, in New York City, compared to 32 % and 54 % in Middlesex County, NJ, and 19 % and 49 % in New Haven, CT (Fig. S4). Moreover, the mobile sector constitutes a larger portion of total NOx emissions in Middlesex County, NJ, (72 %) and New Haven, CT, (71 %) than in New York City, with significantly larger contributions from diesel at 36 % of Middlesex total emissions (22 % in CT, 25 % in New York City). National US diesel sales experienced a relatively smaller decrease from 2019–2020 than gasoline sales did, with a maximum decrease of ∼ 20 % in spring (vs. a mean −40 % for gas) (U.S. Energy Information Administration, 2021), so the relatively larger contribution from diesel in NJ could also partially explain the smaller decreases in NO2 at these locations compared to those observed in NY.
3.3 Changes in NO2 weekly cycles during the pandemic
Anthropogenic NOx emissions often display a clear weekly cycle in major cities around the world, with minima on rest days (e.g., Beirle et al., 2003; Kaynak et al., 2009; Tzortziou et al., 2013). The amplitude of this weekly cycle has been shown in OMI data (2015–2017) to be strengthening in regions undergoing rapid emission growth, while it has been weakening over European and US cities due to the long-term decline in anthropogenic emissions (Stavrakou et al., 2020). Yet, recent data from TROPOMI (2018–2019) show that significant NO2 decreases on Sunday are still prevalent in cities of North America, Europe, Australia, Korea, and Japan (Stavrakou et al., 2020). In New York City, TROPOMI captured 30 % lower tropospheric column NO2 on Sundays compared to a typical weekday in 2018–2019 (Goldberg et al., 2021), in agreement with pre-pandemic MTA and Apple data showing lower traffic into and around the city on Sundays. Similarly, Pandora measurements in Manhattan showed a clear weekly NO2 dependence before the pandemic, with minima consistently observed on Sunday on average 33 % lower than weekday values (Figs. 6, 7). A strong diurnal variability in NO2 was also found (e.g., Fig. 8), although diurnal patterns were highly variable spatially and temporally, consistent with previous studies (Tzortziou et al., 2013). The Sunday-to-weekday TCNO2 ratio varied seasonally from 0.64 and 0.63 in spring and summer, to 0.75 and 0.88, respectively, in fall and winter (Figs. 6, 7b), most likely due to the longer tropospheric NO2 lifetime and an increase in relative contribution of NOx sources that have no weekly cycle (e.g., heating) in winter (Beirle et al., 2003).
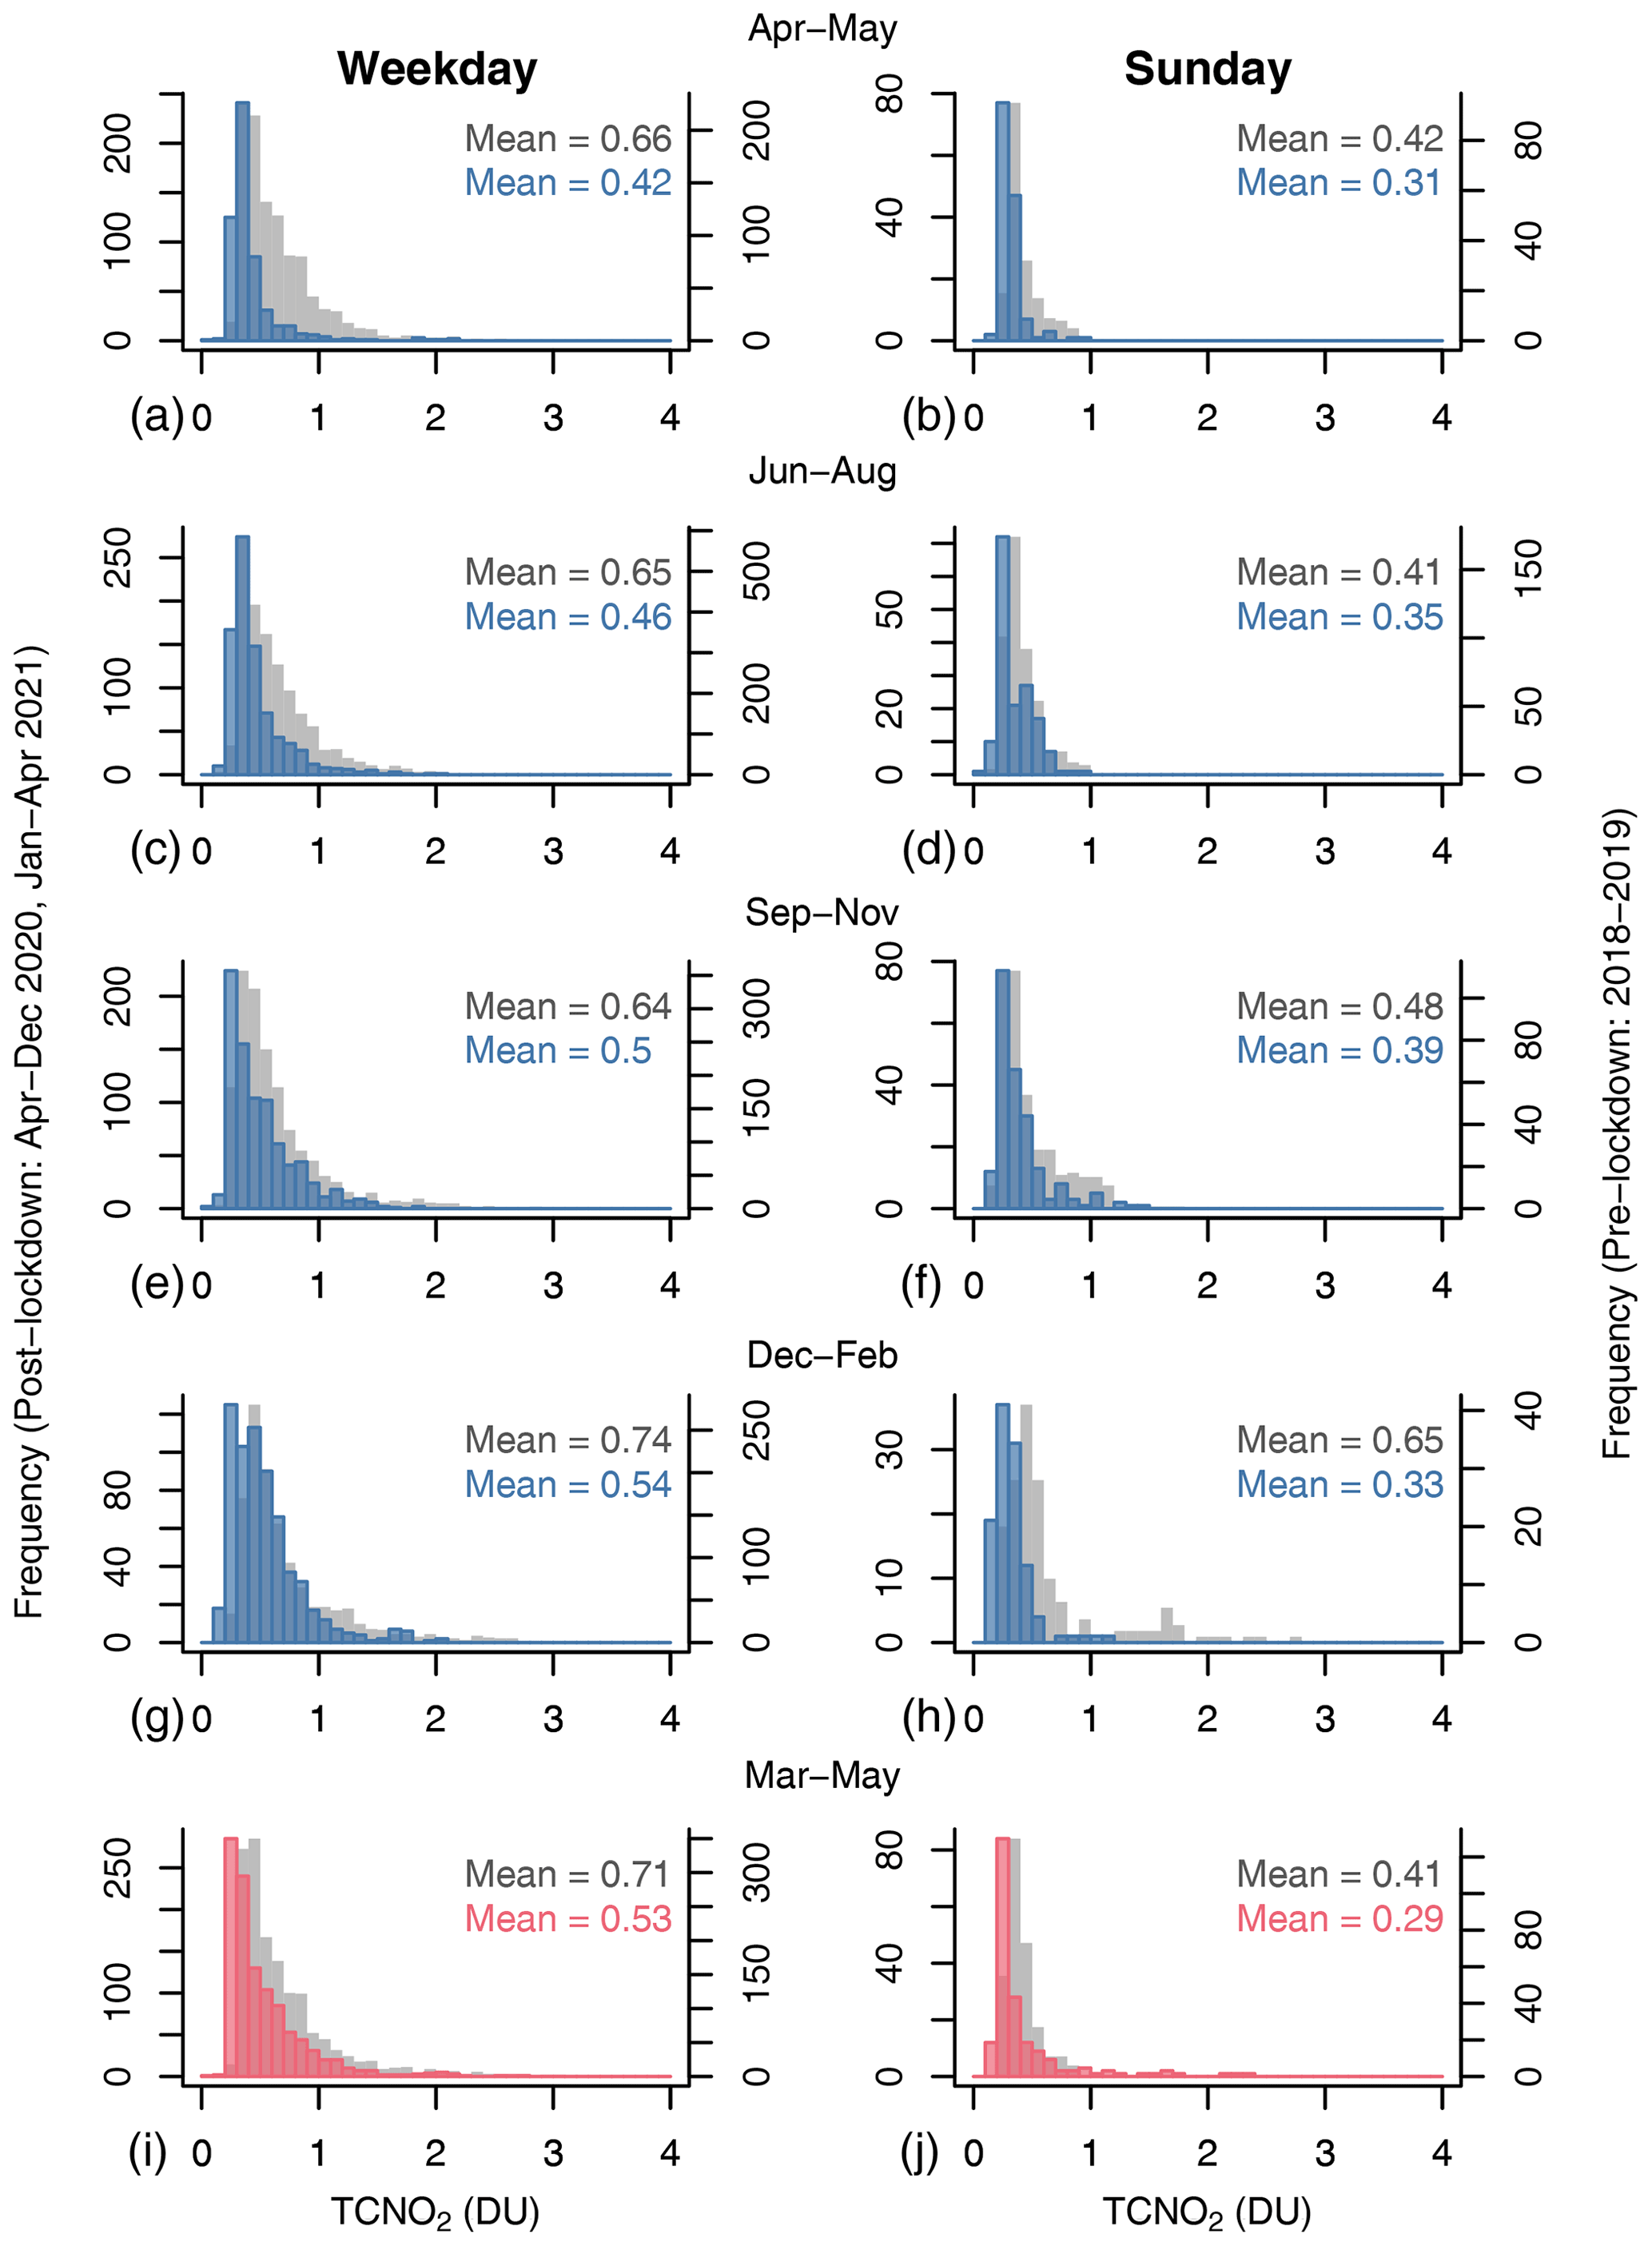
Figure 6Histogram of TCNO2 measured in Upper West Manhattan by PSI#135 for pre-lockdown (gray, 2018–2019) and post-lockdown winter (blue) and post-lockdown spring (pink) conditions. Results are shown for weekdays (left column) and Sunday (right column) across seasons from April 2020–May 2021. The mean NO2 pre- and post-lockdown is also shown.
The COVID-19 measures significantly impacted this weekly NO2 behavior. Over the 9 months following the lockdown in New York (April–November 2020), TROPOMI captured a clear increase in the Sunday-to-weekday TCNO2 ratio from 0.76 to 0.92 (Fig. 7a). Higher frequency Pandora measurements enabled comparison on seasonal timescales, revealing a disproportionate drop in weekday TCNO2 immediately after the initial lockdown (Figs. 6, 7). Weekday NO2 decreased by as much as 36 % and 29 % in spring and summer 2020, respectively, while Sunday NO2, decreased only by 26 % and 15 % (Fig. 6). The Sunday-to-weekday TCNO2 ratio, thus, increased by 16 % in the post-pandemic spring months with a similar trend into the summer (Fig. 7b). By fall, although TCNO2 was still significantly lower than pre-pandemic levels (−22 % on weekdays and −19 % on Sundays, Fig. 6), the typical weekly cycle re-emerged with a post-pandemic ratio of 0.78. Surprisingly, the weekly cycle in TCNO2 increased during the winter (Fig. 7b), as a result of a larger decrease in Sunday NO2 (49 %) compared to weekday NO2 (27 %, Fig. 6). A large departure from typical weekend travel patterns during the second wave of the pandemic, with MTA bridge and tunnel traffic data showing a relatively larger decrease in traffic on Sundays during winter 2021 (Fig. S4), could partly explain these results while the adoption of socially distanced protocols by 2021 may have resulted in relatively fewer reductions of weekday activities such as construction or shipping. By the reopening phase in March–May 2021, the weekly NO2 cycle strengthened significantly (Fig. 7b). With the exception of two Sundays in March and April that showed high peaks in TCNO2 due to strong influence of low-speed (< 5 m s−1) south and westerly winds, the Sunday-to-weekday ratio approached pre-pandemic levels in spring 2021, likely reflecting a gradual return to “normal” as the city-wide COVID infection rate dropped (Fig. S1).
Long-term declines in anthropogenic NOx emissions and the resulting growing importance of background NO2 had already led to a significant dampening of the weekly NO2 cycle in pre-pandemic New York City over the past 15 years, as shown by an increase in the OMI retrieved Sunday-to-week column ratio by 17 % from 2005 to 2017 (Qu et al., 2021; Stavrakou et al., 2020). Interestingly, the early stringent COVID-19 lockdown measures and related abrupt changes in human behavior resulted in an additional 16 % weakening of the TCNO2 weekly cycle, in just 3 months. Including these changes (both weakening and recovery) in weekly cycles of emissions and pollutant concentrations in chemistry-transport models is important in efforts to quantify and simulate the impacts of the COVID-19 pandemic on regional air quality, human health, and ecosystems.
3.4 Meteorology as a driver of NO2 decline and high pollution episodes during the pandemic
Despite the significant reduction in NO2 emissions during and following the COVID-19 lockdown, both ground-based and satellite sensors captured cases of high pollution in the New York metropolitan region with TCNO2 often exceeding three times the pre-pandemic levels (Table 1, Figs. 4, 8). 23 and 25 April 2020, during the initial lockdown, are such instances of TCNO2 exceeding 1.8 DU (three times the pre-pandemic seasonal TCNO2 mean) and showing remarkably similar diurnal behavior at the Manhattan and Queens locations (Fig. 8c, d).
TROPOMI data was not available, but OMI captured TCNO2 of 1.12 DU over New York city on 25 April (Fig. 8d). At the early stage of the second wave of the pandemic, TCNO2 also exceeded 1.8 DU on 9 October in both Manhattan and Queens with a time lag of approximately 2 h between the maximum observed by the two instruments (Fig. 8e). On the same day, TROPOMI TCNO2 reached 0.9 DU, more than two times higher than the pre-pandemic satellite monthly NO2 mean (Fig. 8e). Overall, there were 12 d when ground-based measured TCNO2 exceeded 1.8 DU in post COVID-19 New York City, despite a 34.5 % drop in top-down NOx emissions (Fig. 5). Considering the significant decline in transportation emissions, the post-lockdown high NO2 pollution episodes are most likely associated with power plant emissions and specific meteorological conditions. Indeed, the EDGAR v5.0 inventory shows that spatial patterns in NOx emissions over the New York metropolitan area are primarily driven by the power generation sector, while contributions from road traffic, buildings, and manufacturing show more even distribution with slight peaks of approximately 0.05 kg NOx m−2 yr−1 in Brooklyn, Queens, and Manhattan (Fig. 9). Of the many power plants in the area, the Astoria Energy LLC and Astoria and Ravenswood Generating Stations in Queens were among the largest greenhouse gas polluters in the state of New York in 2018 and 2019, with total reported greenhouse emissions > 3 500 000 metric ton CO2 e (EPA FLIGHT GHG Inventories) (Fig. 1). In NJ, the PSEG Bergen Generating Station in Ridgefield (NW of Manhattan/NW of Harlem) and the Linden Cogeneration Facility (SW of Manhattan) are major power plants located West of Manhattan with total reported emissions > 7 000 000 metric ton CO2 e both in 2018 and 2019.
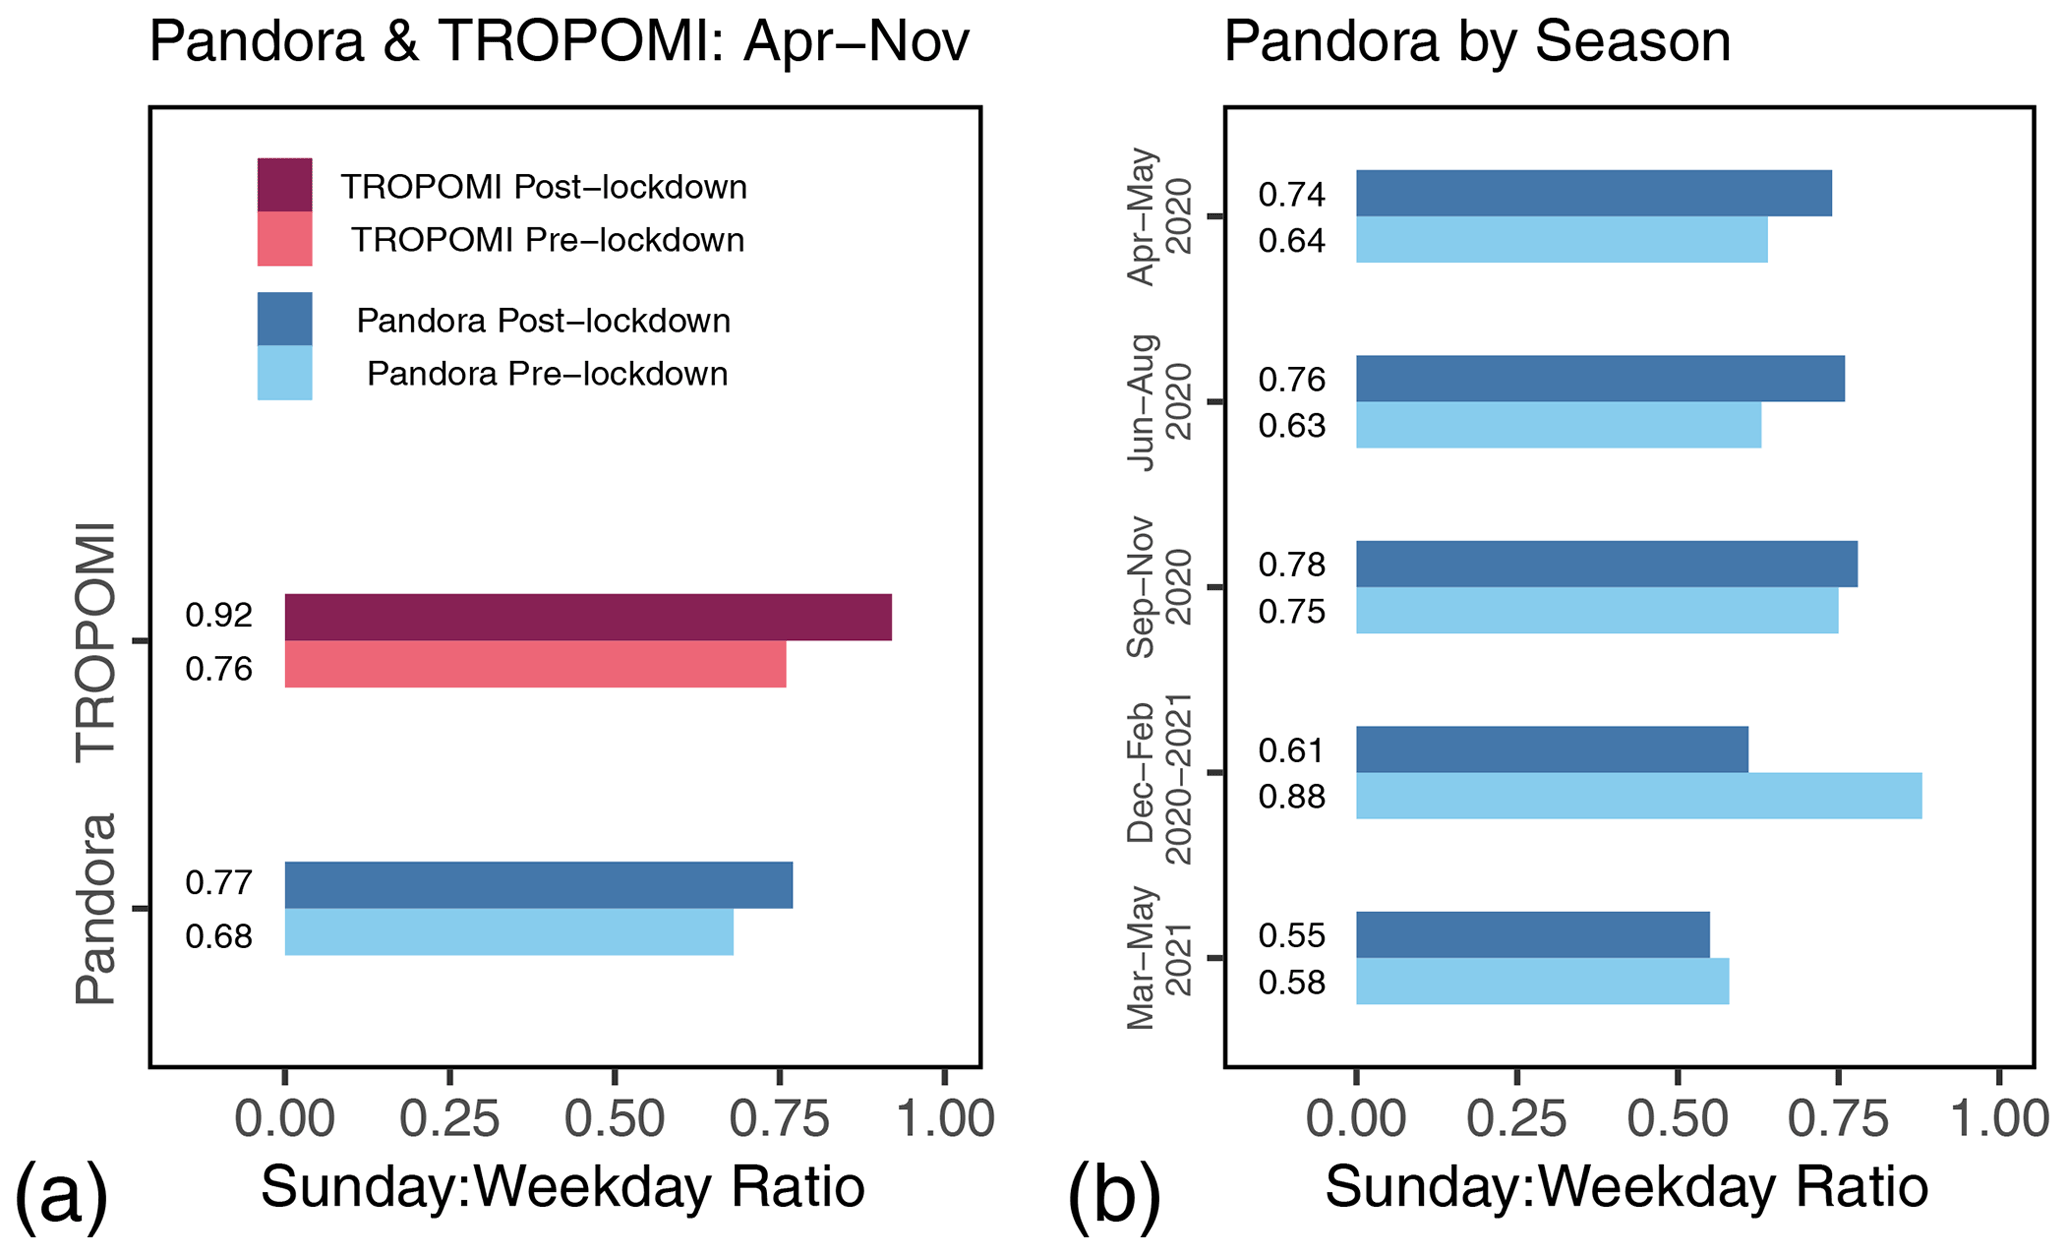
Figure 7(a) Sunday-to-weekday TCNO2 ratios averaged over April–November 2018–2019 (pre-lockdown) and 2020 (post-lockdown) from TROPOMI and Pandora (PSI#135); (b) seasonal change in Sunday-to-weekday column ratios pre- and post-lockdown from Pandora (PSI#135).
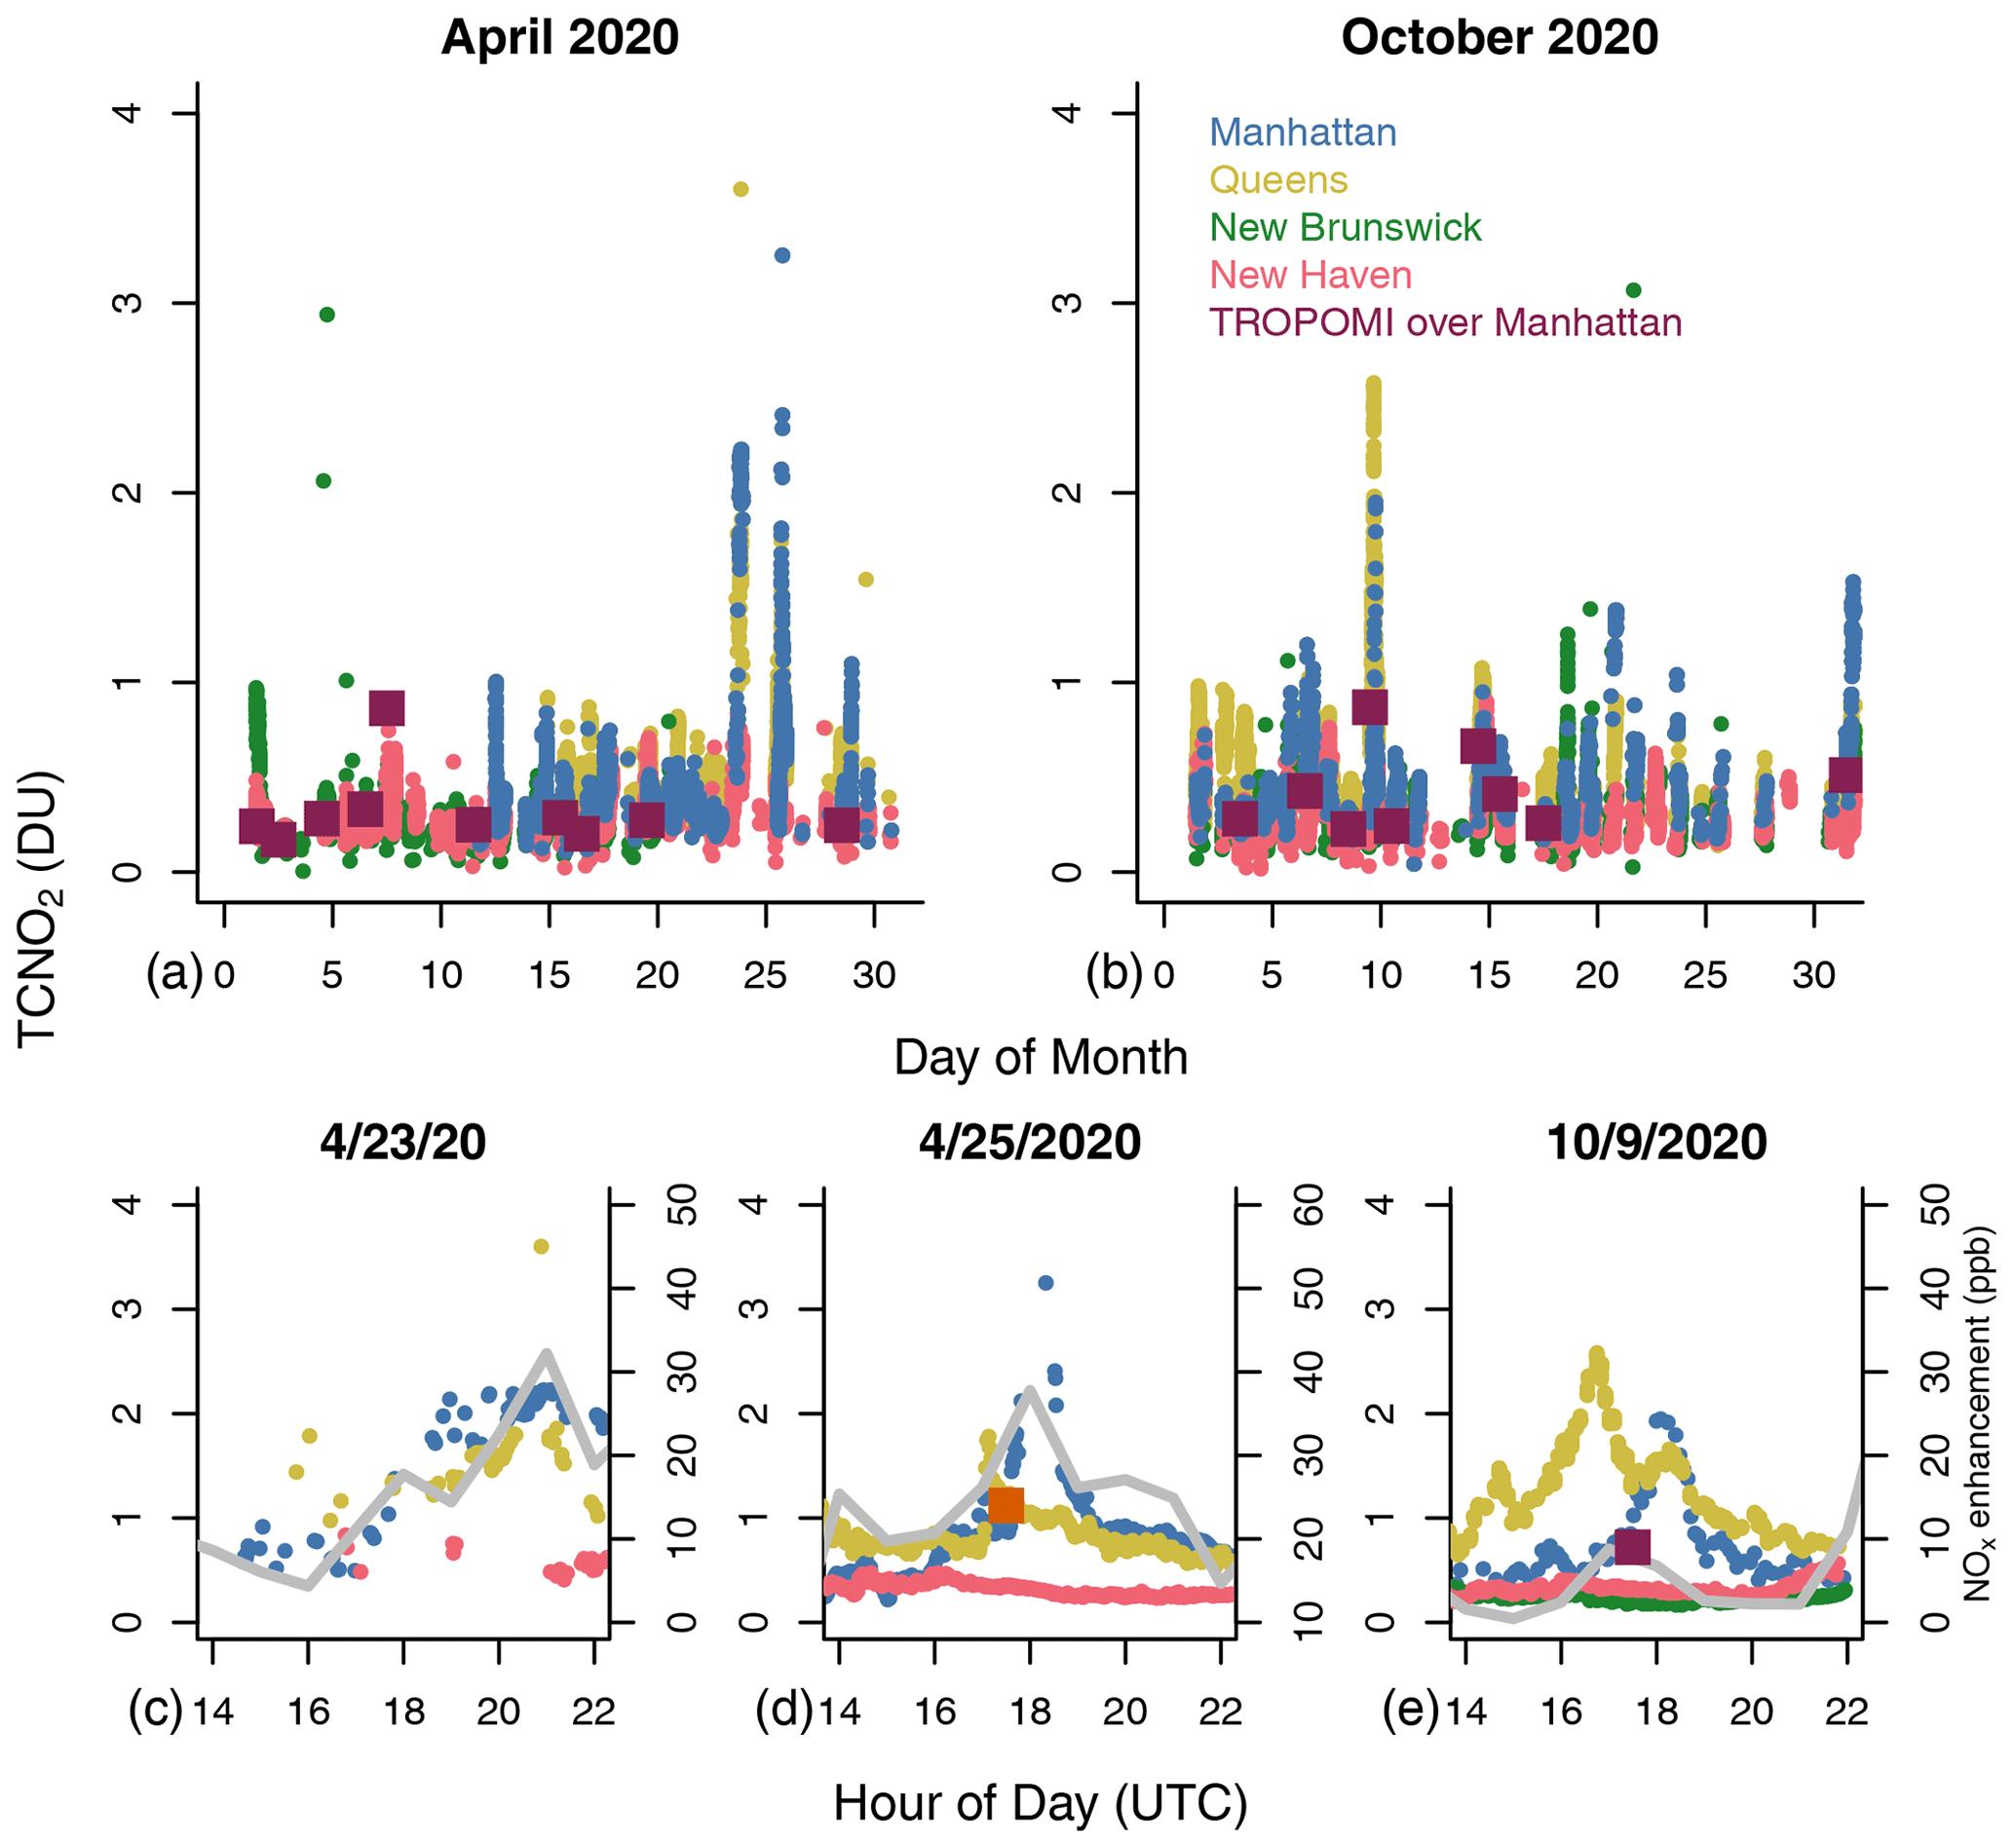
Figure 8Despite the decline in traffic and physical distancing restrictions, cases of high NO2 pollution (TCNO2 > 1.8 DU) were observed in the New York metropolitan area during and post the COVID-19 lockdown. TCNO2 measurements are shown here for (a) April 2020 and (b) October 2020, from Pandora systems in Manhattan, Queens, New Brunswick, and New Haven, and TROPOMI over Manhattan. Diurnal dynamics in TCNO2 during specific days of exceedances are shown for (c) 23 April, (d) 25 April (square indicates OMI TCNO2 over Manhattan), and (e) 9 October 2020. The EDGAR power-sector near-surface NOx concentration enhancements in Manhattan are shown by the gray line in (c)–(e).
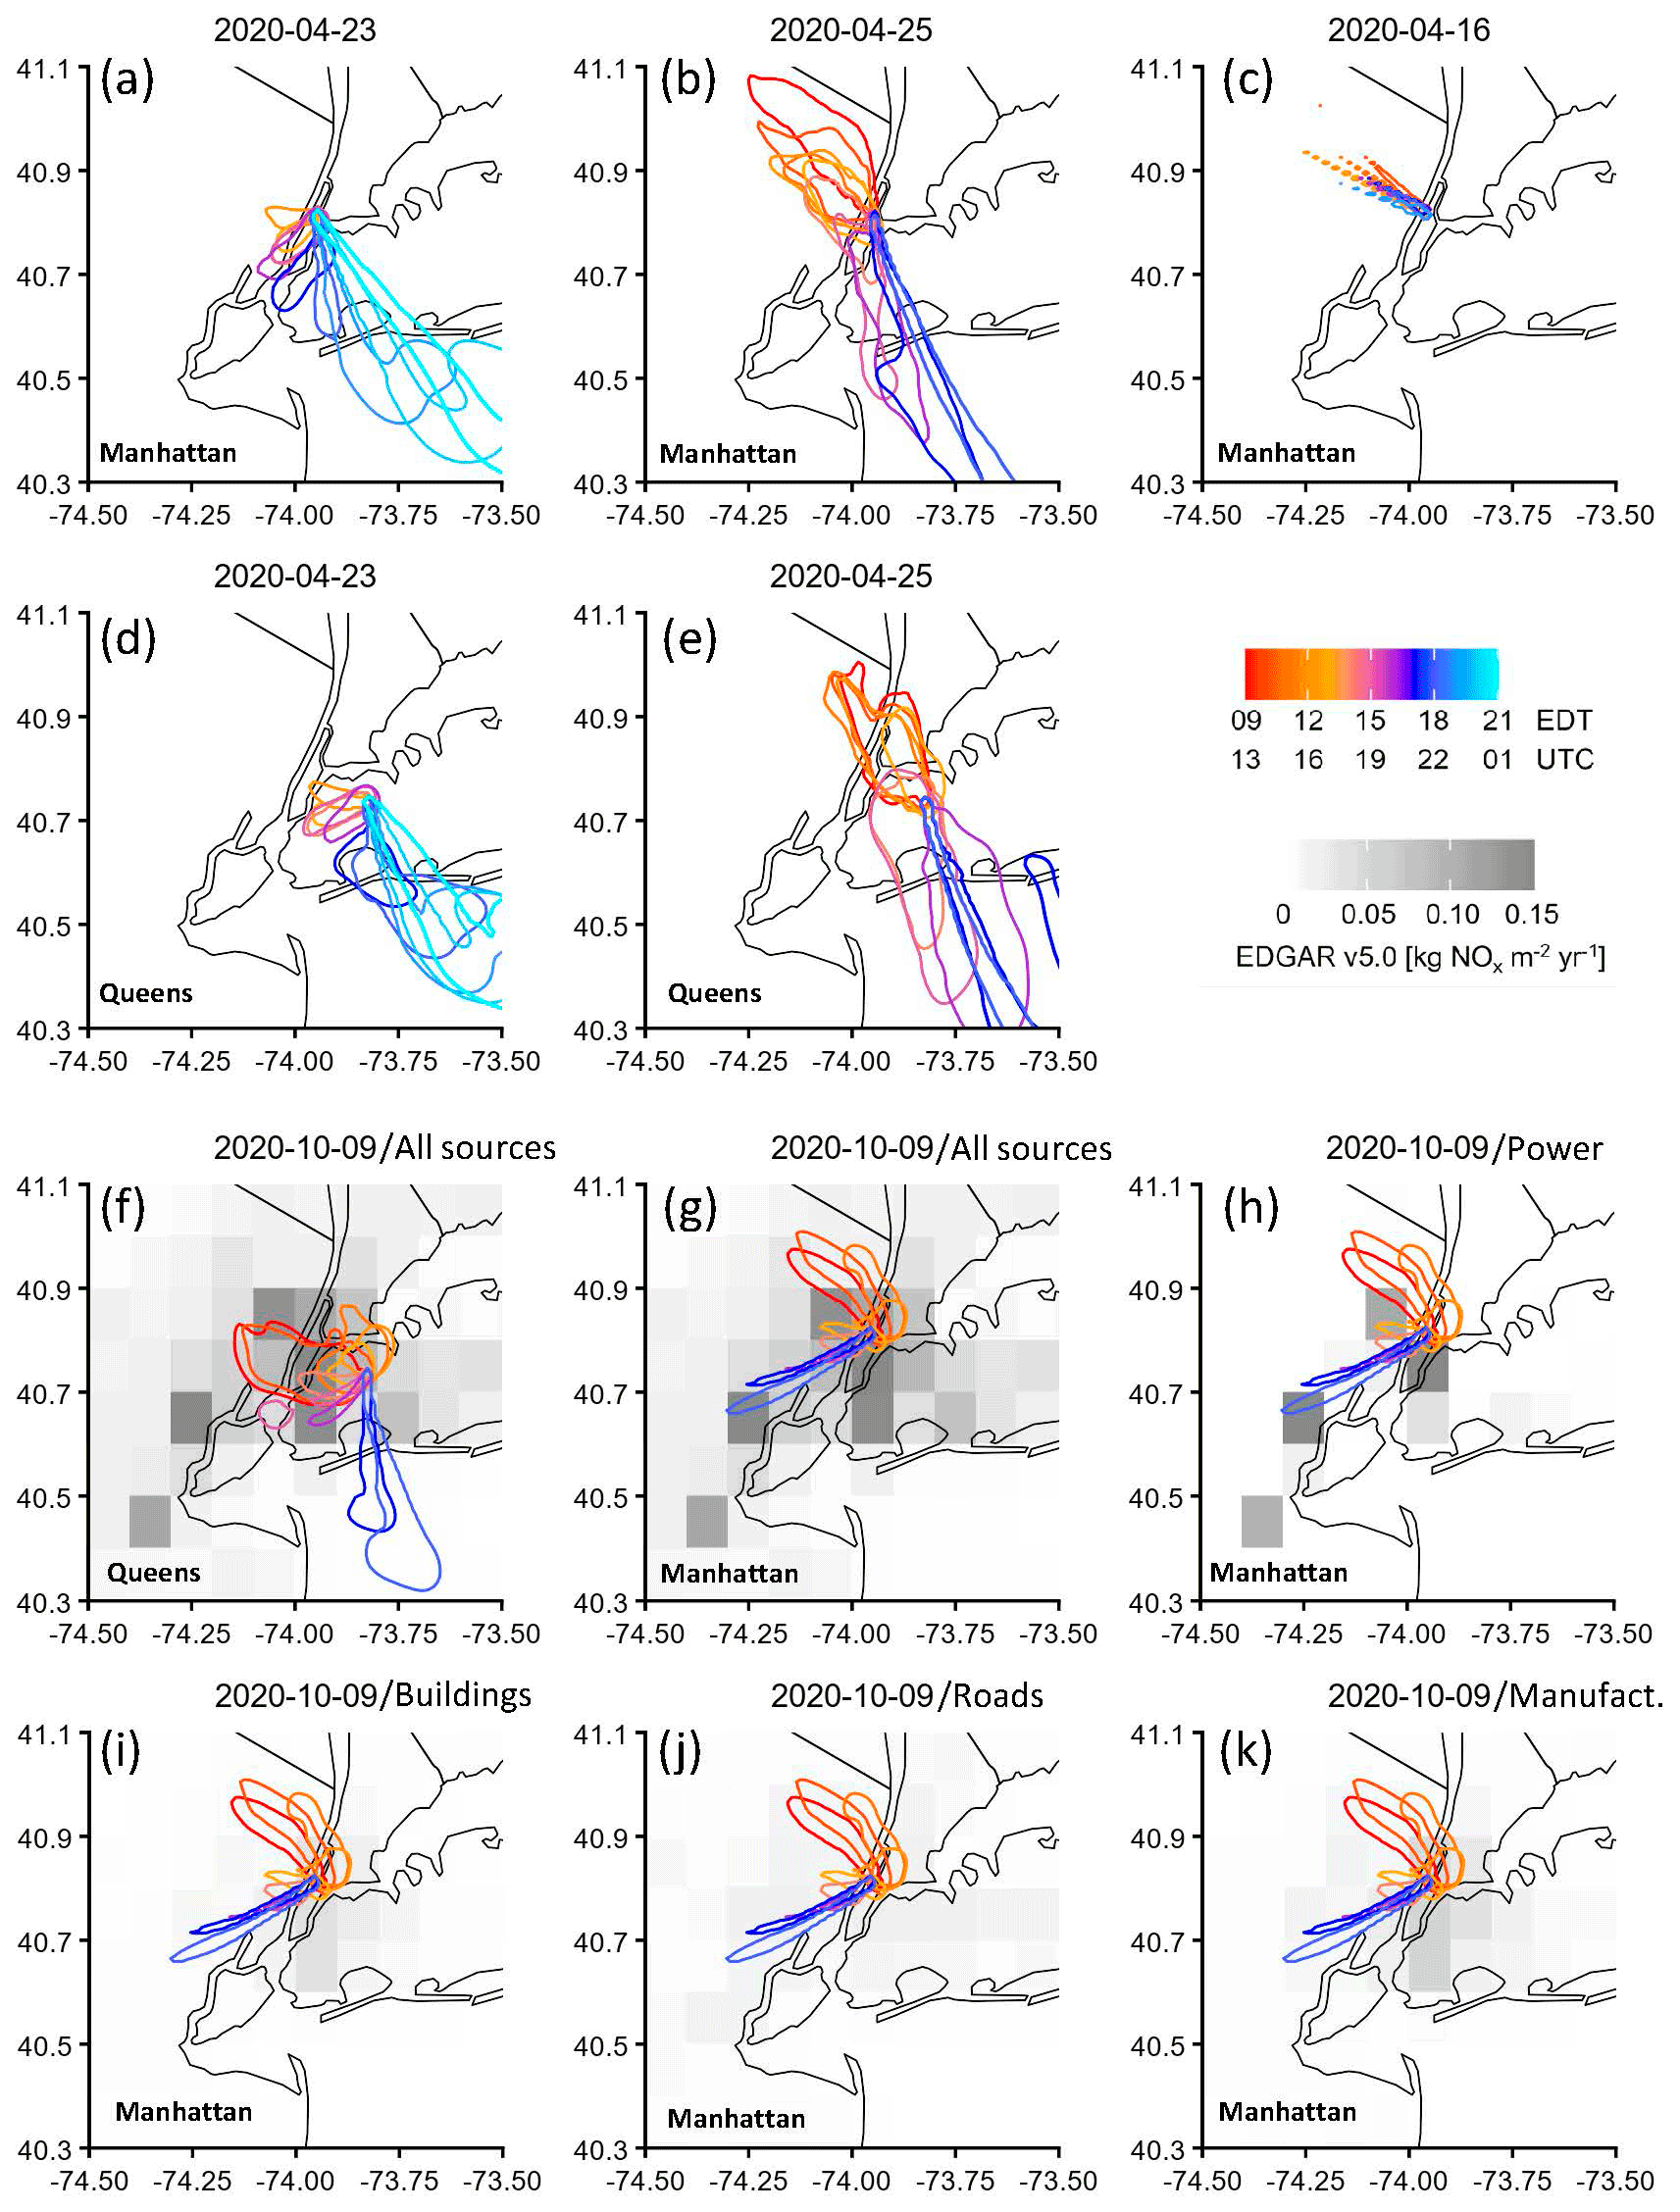
Figure 9Twenty-four hour total STILT surface influence contours for total column NO2 exceedances on 23 April (a, d), 25 April (b, e), and 9 October (f–k) and a low NO2 case on 16 April 2020 (c), for comparison. Contour lines represent surface influence of 1 ppb (µmol m−2 s−1)−1 and are colored by hour-of-day of the receptor. October 9 is overlaid with EDGAR inventories of NOx for 2015 (kg NOx m−2 yr−1). The area encircled by each contour indicates the region of emissions that reaches the Manhattan and Queens observation sites for a given time and day.
Consistent with the location of these power plants, we found that meteorological conditions on days when high TCNO2 was measured in Manhattan were characterized by low-speed southerly and westerly winds. STILT footprints showed that on 23 April air masses from the high-emitting power sector in New Jersey and along the East River persisted over Upper West Manhattan from 16:00 to 21:00 UTC (Fig. 9a) when TCNO2 peaked in PSI #135 observations (Fig. 8c). A strong increase in wind speed and change in direction, effectively mixing in clean ocean air, after 21:00 UTC coincided with a rapid decline in measured TCNO2. A similar pattern was observed on 25 April (Figs. 8d, 9b, e), when air intercepted by the Manhattan and Queens Pandoras shifts from the northwest to southeast, slowing while passing over New Jersey and the East River power plants around 18:00 UTC to produce the observed TCNO2 peak at these sites. On 9 October, westerly airflow from New Jersey shifted to accumulate NOx emissions over the Manhattan Pandora location from 17:00 to 19:00 UTC when observed TCNO2 peaked at 1.95 DU. Wind accelerated and shifted southwest in the evening, coinciding with a TCNO2 decrease to < 0.5 DU (Figs. 8e, 9f, g). Low-speed westerly winds brought Manhattan and East River power plant emissions to the Queens location approximately 2 h earlier that day, in agreement with the earlier peak in TCNO2 measured by the Pandora (Fig. 8e). Strong winds, persisting in a single direction for several hours, consistently dispersed pollution resulting in low NO2 column amounts over Manhattan and Queens. An example is 16 April (Fig. 9c), when high-speed NW winds persisted throughout the day dispersing local and regional pollution and transporting NO2 out to the ocean.
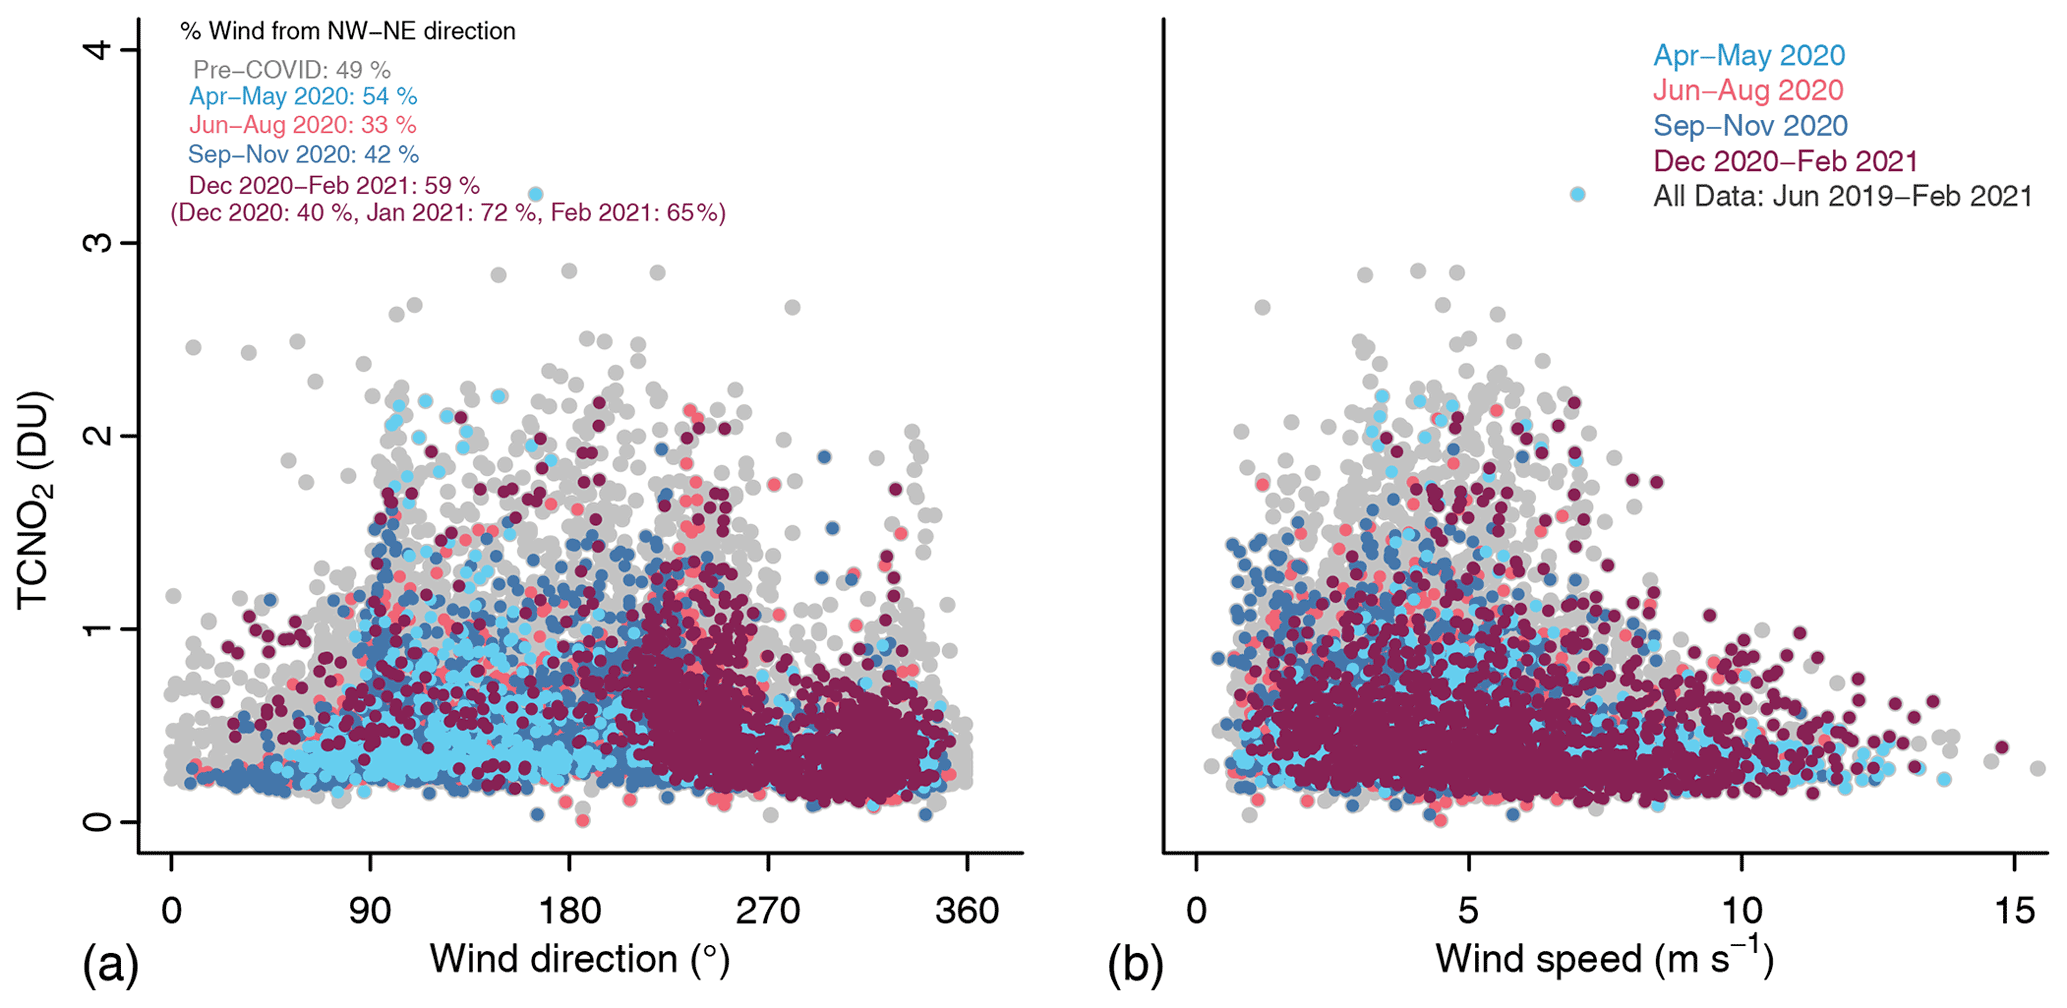
Figure 10Relationship between column NO2 amounts (DU, PSI #135 data, 15 min averaged) and (a) wind direction (in degrees from north) and (b) wind speed (in m s−1; ATMOS 41 data) organized by post-lockdown season, measured from June 2019 to February 2021 in Upper West Manhattan.
Combining the STILT footprints, which account for the meteorology described above, with the sector-specific EDGAR NOx emission maps allows us to approximate the fraction of expected NOx concentration enhancements from each emission sector observed at each Pandora station. For 25 April, we find that the largest contribution of NOx at the Manhattan site is from power generation (42 %), with manufacturing dominating at the Queens site (30 %). Road transportation (using pre-pandemic estimates) contributes only 13 % and 18 % at the Manhattan and Queens sites, respectively. Despite the constant NOx emissions rate for each month in EDGAR (i.e., no diurnal cycle), the diurnal pattern of the meteorology-driven simulated power-sector near-surface NOx concentration enhancement was consistent with the TCNO2 observed by the Pandoras on both 23 and 25 April 2020 (Fig. 8c–e). This result supports the large role played by meteorology in causing NO2 accumulation and demonstrates a clear connection between the near-surface and total column NOx concentrations on these days.
Our measurements showed that the observed correlation between particularly high post-pandemic NO2 pollution episodes and low-speed winds is typical of NO2 dynamics in Manhattan. In large cities with relatively flat topography, including New York City, increasing wind speeds from nearly stagnant to > 8 m s−1 were previously shown to decrease NO2 by 40 %–85 % (Goldberg et al., 2020). Indeed, coincident measurements of wind conditions and NO2 at the Manhattan Pandora location before the pandemic showed that TCNO2 rarely rose above 1 DU at wind speeds faster than 8 m s−1 (Fig. 10b). The highest TCNO2 amounts occurred when surface winds were in the range 1–5 m s−1. Under such conditions, winds are strong enough to transport pollution from local sources as well as major pollutant emitters in the tri-state area but can still lead to accumulation of pollution in Manhattan.
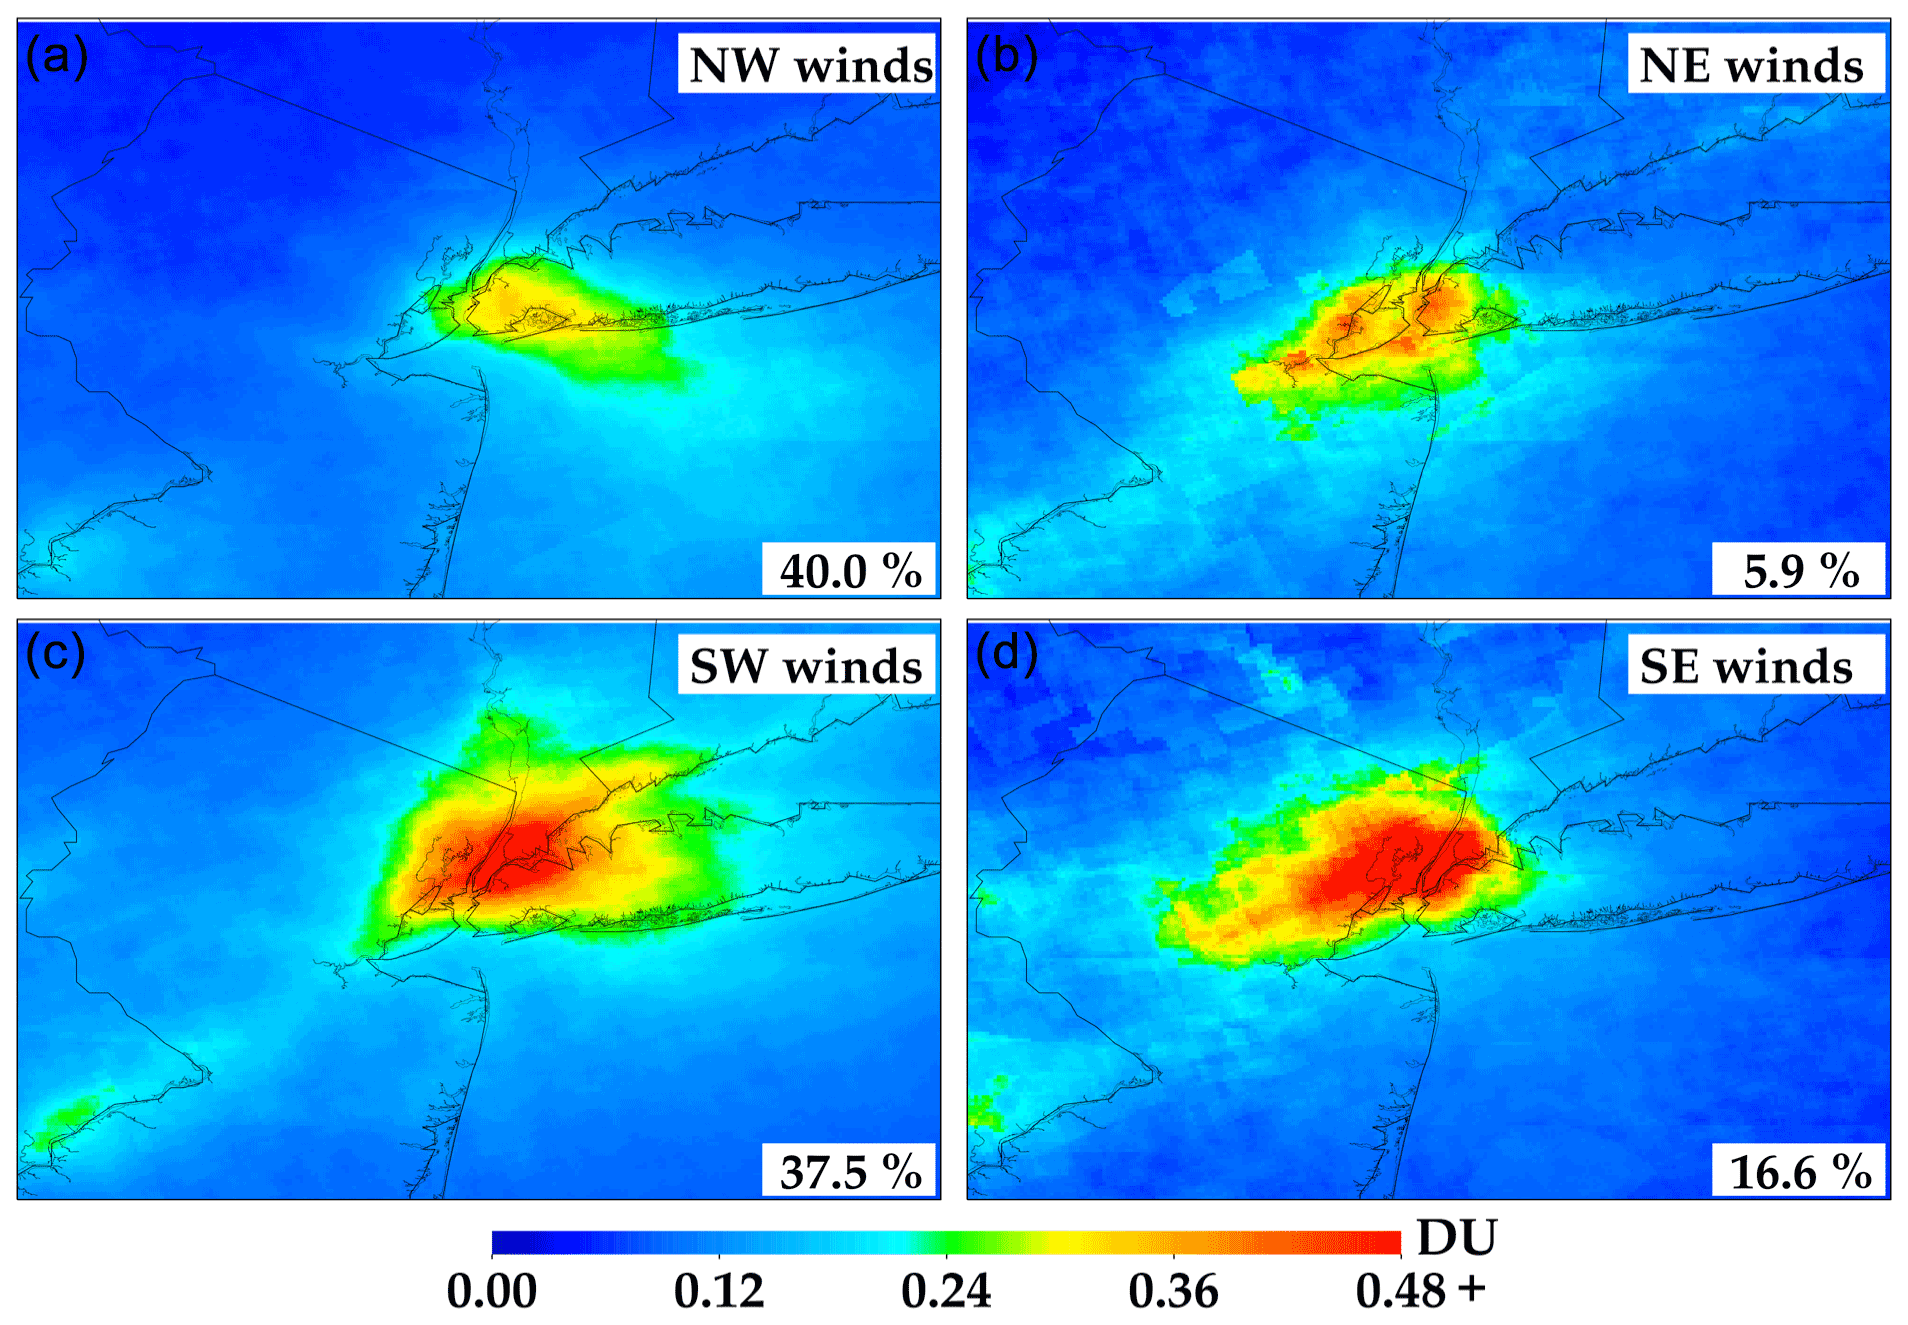
Figure 11TROPOMI NO2 plumes over New York City (May 2018–December 2019) segregated into 100 m wind direction quadrants northwest (a), northeast (b), southwest (c), and southeast (d). The percentages of each direction are shown at the bottom right corner of each panel.
Moreover, the frequency of high NO2 pollution events varies by wind direction, which correlate with sources of NOx pollution. Most events with TCNO2 > 1 DU, and all cases with TCNO2 > 2DU, occurred with SE–SW winds (90–270∘ in Fig. 10a). These air mass origins encompass influences from Queens and Brooklyn (SE), lower Manhattan, and northern New Jersey (SW-W) where most of the major power plants and economic activity are located (Fig. 1). Mean TCNO2 for SE-SW winds was 0.6 DU, compared to 0.4 DU for NE-NW winds. Pre-pandemic TROPOMI retrievals (2018–2019) also showed that SE-SW winds yield the highest NO2 levels in New York City, on average twice as high compared to winds from the NW and NE (Fig. 11), where there are fewer upwind sources. Satellite imagery over the 2018–2019 period was evenly distributed across SE-SW (high NO2) and NW-NE (low NO2) wind directions. TROPOMI retrievals also demonstrate a strong negative relationship between satellite NO2 columns and wind speed (Fig. 12), with the highest NO2 occurring at wind speed < 4 m s−1 and the lowest at wind speed > 6 m s−1 over the New York metropolitan area before the pandemic.
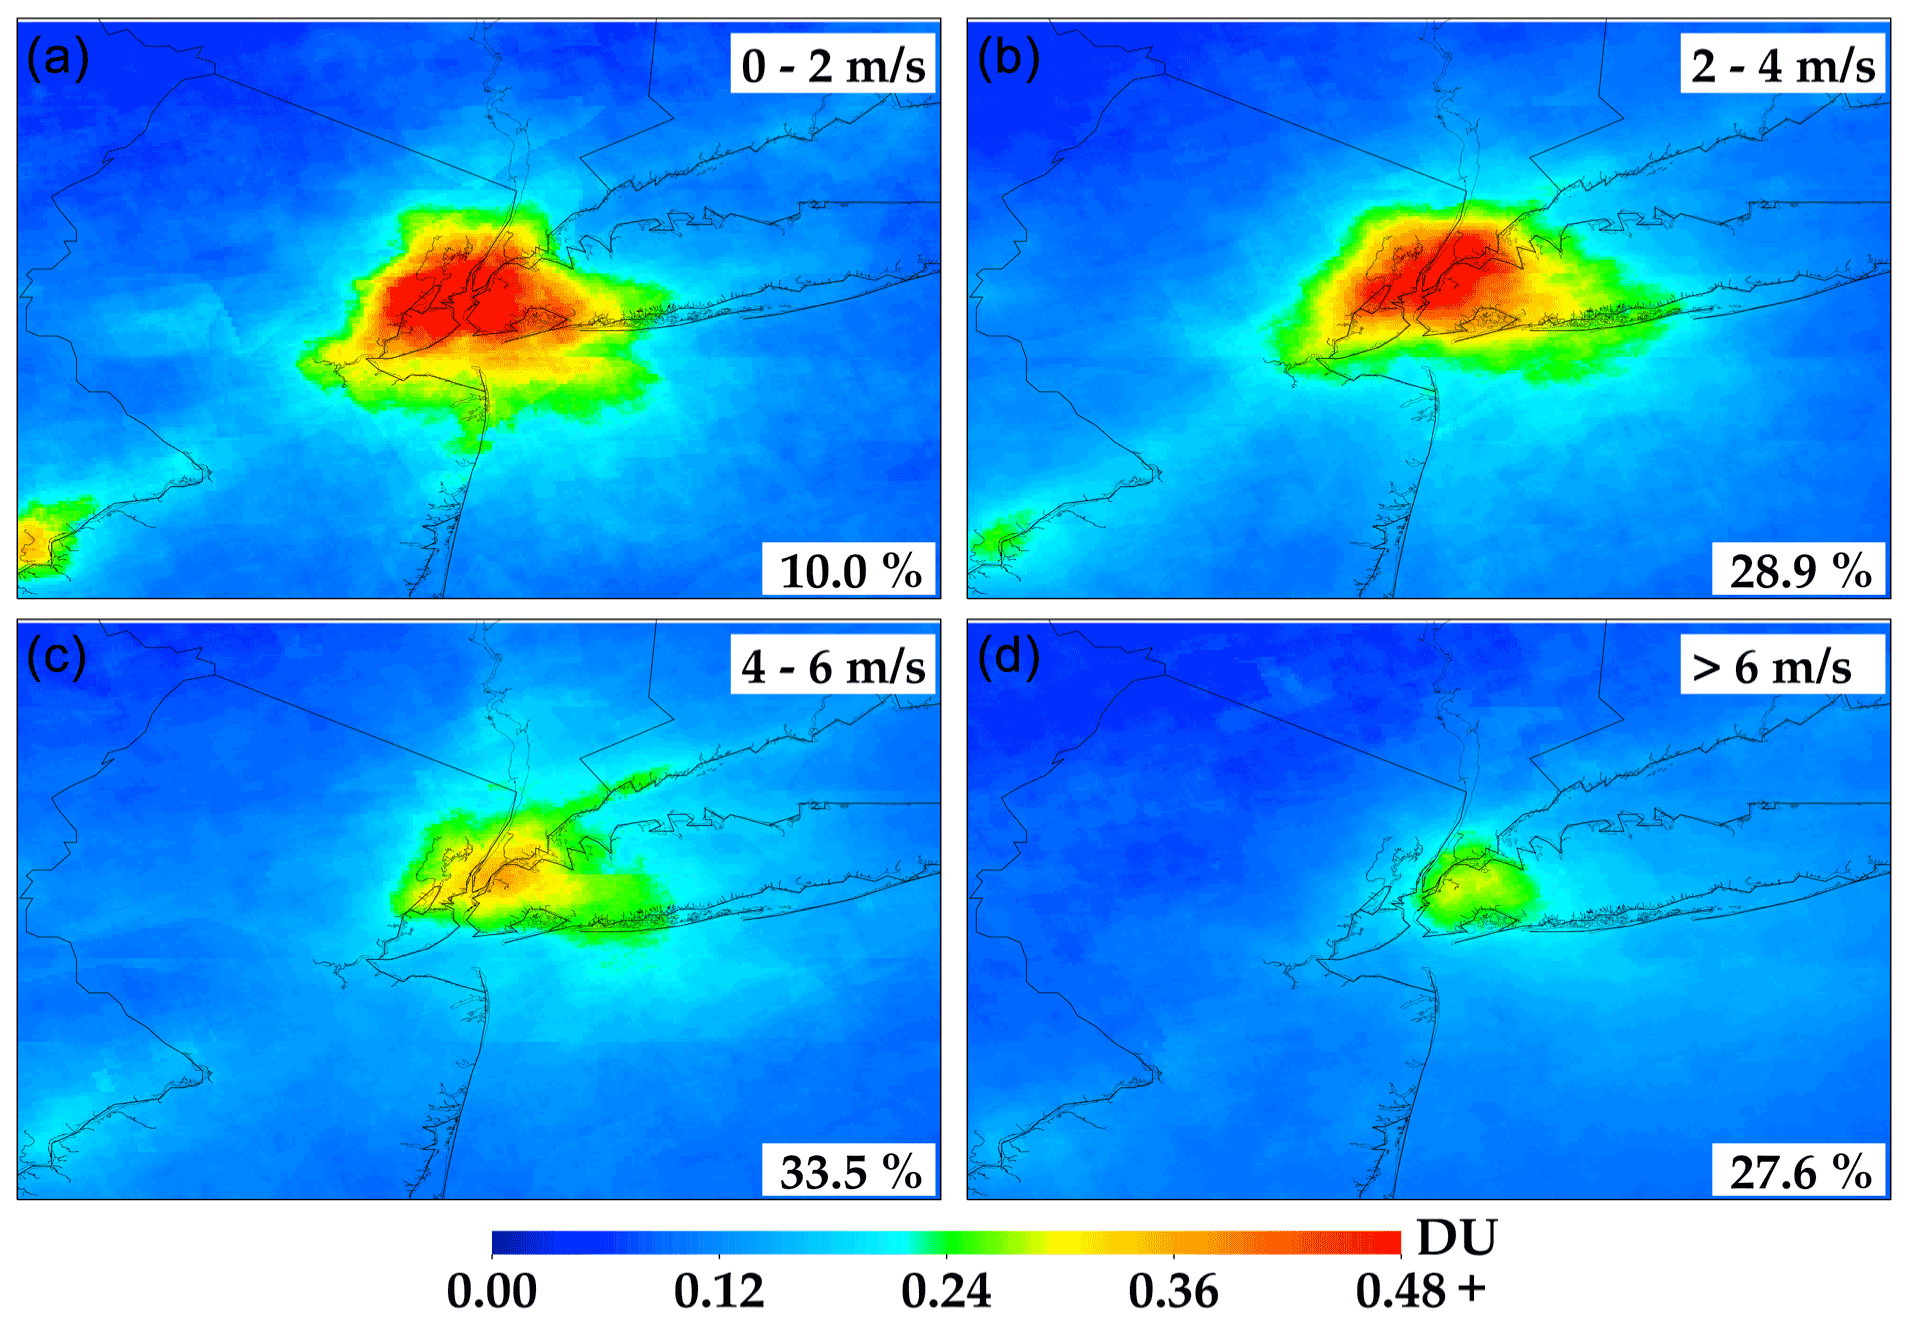
Figure 12TROPOMI NO2 (May 2018–December 2019) segregated by 100 m wind speed in 2 m s−1 intervals from ERA5 daily meteorology. The percentages of each wind-speed interval are shown at the bottom right corner of each panel.
These meteorological factors, in addition to explaining the particularly high TCNO2 values measured even under strict social distancing restrictions during the COVID-19 lockdowns in the tri-state area, were also found to contribute to the significantly reduced NO2 values in winter 2021. January and February 2021 showed a drop in NO2 by 39 % and 30 %, respectively, similar to the NO2 decline observed immediately after the initial strict lockdowns (Fig. 4). Although traffic (based on both MTA data and Apple mobility trends) showed a noticeable decrease during the second wave of the pandemic, mobility was not nearly as restricted as in April–May 2020 (Figs. S1, S2). Bridge and tunnel traffic was approximately 30 % lower in winter 2021 compared to 55 % lower in spring 2020. Interestingly, in winter 2021 wind in Upper West Manhattan was mostly (72 % in January and 65 % in February) from NW-NE directions, which yields the cleanest conditions and favors low NO2 columns (Fig. 10a). For comparison, wind at the same location in January and February 2020 was 49 % and 50 % from NW-NE direction. In contrast to winter 2021, in spring, summer, and fall 2020, wind was 54 %, 33 % and 42 % from NW-NE directions (compared to 49 % in pre-COVID conditions, Fig. 10) and mean wind speed was in the range 3.8–5.5 m s−1, suggesting that wind conditions were not favorable for lower NO2 in Manhattan in 2020. Hence, our estimates of NO2 decline in April–December 2020 primarily reflect the impact of changes in anthropogenic emissions, particularly reductions in emissions from the transportation sector. These findings corroborate results from Goldberg et al. (2020), who concluded that varying meteorological conditions (wind speed and direction) in New York City, while different between years, did not have a strong biasing effect in their estimates of the effects of COVID-19 physical distancing on NO2 in the month directly following the initial lockdowns. The prevalence of northerly winds in winter 2021, however, minimized the relative contribution of emissions from the energy sector to New York City, favoring low NO2 conditions. This led to stronger NO2 declines compared to pre-pandemic levels than would be expected based on just changes in emissions from the transportation sector during the second wave of the pandemic.
Stringent lockdown measures following the COVID-19 outbreak resulted in an abrupt and significant decline in TROPOMI top-down NOx emissions in New York City, by ∼ 30 % on top of long-term trends. A sudden drop in total column NO2 (by up to 36 % in Manhattan), along with a weakening of the weekly NO2 cycle and a disruption of typical seasonal patterns were observed by the ground-based Pandora network in the New York metropolitan area. Yet, during the same timeframe, traffic in New York City bridges and tunnels plummeted by 55 %, on average, compared to pre-pandemic levels, reaching as much as 80 % reduction in early April 2020. These results highlight that although on-road transportation is an important source of emissions in New York City, emissions from non-road transportation and the power generation sector (not as strongly affected by the lockdown measures) critically affect NO2 pollution levels in New York. Accounting for each sector's contribution to total emissions, resulted in a change in NOx emissions by approx. 32 %, which was consistent with satellite top-down estimates.
Disentangling the impacts of meteorology and NOx emission changes on urban air quality is key for designing and implementing improved emission-control strategies. Meteorology had different impacts across the different pandemic waves in New York City. Although it was not found to have a strong biasing effect after the first pandemic wave in spring to fall 2020, meteorology strongly favored clean air conditions over Manhattan after the second pandemic wave in winter 2021, lowering NO2 levels beyond what would be expected based on lockdown measures alone. The key role that meteorology plays in shaping the relative contributions from different emission sectors to NO2 pollution in New York City was further demonstrated by the occurrence of several high NO2 pollution events even during – and despite – the extreme reductions in transportation emissions during the stringent early lockdowns. High total NO2 columns, often exceeding three times the pre-pandemic levels, were consistently characterized by low-speed (< 5 m s−1) SW-SE winds that enhanced contributions from the high-emitting power-generation sector and accumulation of pollution over New York City. A subsequent increase in wind speed and change in wind direction typically coincided with a decrease in NO2 over the city, indicating dispersion of pollutants across the coastal environment with potentially negative effects on downwind communities as well as terrestrial and aquatic ecosystems (Loughner et al., 2016).
The COVID-19 pandemic resulted in immediate and multifaceted impacts on human behavior that affected various pollutant sectors and their relative contributions to urban NOx emissions differently. During this extreme natural experiment, long-term and high-temporal resolution retrievals from the Pandora network were essential in capturing the response of total column NO2 – declines and high pollution episodes – during the multiple pandemic waves and reopening phases in the New York metropolitan area. Incorporating observed NOx emissions changes across time scales is important for improving air quality modeling and forecasting, especially in the context of sub-daily stagnation events that produce NOx exceedances despite low emissions. Such high-resolution observations from ground-based networks, and soon from geostationary satellite sensors such as TEMPO (Chance et al., 2013), enable the characterization of fine-scale features in NO2 behavior as well as assessment of the possible effects of rapid meteorological changes on air quality conditions. In New York, a city transitioning to a NOx limited ozone production environment during summer (Jin et al., 2017), NOx plays an important role in the oxidation of VOC's (volatile organic compounds) ozone production as well as secondary aerosol formation. Integration of high-resolution NO2 measurements from ground-based networks and geostationary satellite platforms is, thus, critical in further assessing changes in NO2, aerosol, and ozone pollution as the world re-opens, and in evaluating the effectiveness of future sector-specific NOx emission control strategies and their impacts on air quality, human health, and urban ecosystems.
All Pandora data used in this study can be downloaded freely from the Pandonia Global Network website https://www.pandonia-global-network.org/ (last access: 4 June 2021). Our gridded satellite NO2 products and output from our model simulations can be obtained by contacting the corresponding author, Maria Tzortziou (mtzortziou@ccny.cuny.edu).
The supplement related to this article is available online at: https://doi.org/10.5194/acp-22-2399-2022-supplement.
MT designed the study, collected and analyzed the field datasets, contributed to the satellite data analysis, and wrote the paper with input from the co-authors; CFK contributed to the field and satellite data processing and analysis; DG processed the TROPOMI satellite data; LS and RC provided the STILT model simulations. NA, JJS, and LCV contributed to the Pandora data collection and processing. All co-authors reviewed and edited the paper for clarity.
The contact author has declared that neither they nor their co-authors have any competing interests.
The research described in this article has been reviewed by the
US Environmental Protection Agency (EPA) and approved for publication.
Approval does not signify that the contents necessarily reflect the views
and the policies of the agency nor does mention of trade names or commercial
products constitute endorsement or recommendation for use.
Publisher's note: Copernicus Publications remains neutral with regard to jurisdictional claims in published maps and institutional affiliations.
We thank Alexander Cede, Thomas Hanisco, Moritz Mueller, Michael Gray, Elena Spinei Lind, Jay Herman, Brian Lamb, and the NASA Pandora Project and ESA Pandonia Project staff for assistance in the field and for establishing and maintaining the Pandora sites used in this investigation. We also thank Rohit Mathur and Venkatesh Rao for feedback on an earlier draft of this paper.
This research was supported by NASA Rapid Response and Novel research in the Earth Sciences (RRNES) Program (grant no. 80NSSC20K1287), NASA Interdisciplinary Science (IDS) Program (grant no. 80NSSC17K0258), NOAA Earth System Sciences and Remote Sensing Technologies (award no. NA16SEC4810008), and NOAA Climate Program Office's Atmospheric Chemistry, Carbon Cycle, and Climate program (grant no. NA20OAR4310306).
This paper was edited by Thomas Karl and reviewed by two anonymous referees.
Apple COVID-19 Mobility Trends Reports-Data: https://www.apple.com/covid19/mobility, last access: 4 June 2021.
Banta, R. M., Senff, C. J., Alvarez, R. J., Langford, A. O., Parrish, D. D., Trainer, M. K., Darby, L. S., Michael Hardesty, R., Lambeth, B., Andrew Neuman, J., Angevine, W. M., Nielsen-Gammon, J., Sandberg, S. P., and White, A. B.: Dependence of daily peak O3 concentrations near Houston, Texas on environmental factors: Wind speed, temperature, and boundary-layer depth, Atmos. Environ., 45, 162–173, https://doi.org/10.1016/j.atmosenv.2010.09.030, 2011.
Barbieri, D. M., Lou, B., Passavanti, M., Hui, C., Hoff, I., Lessa, D. A., Sikka, G., Chang, K., Gupta, A., Fang, K., Banerjee, A., Maharaj, B., Lam, L., Ghasemi, N., Naik, B., Wang, F., Mirhosseini, A. F., Naseri, S., Liu, Z., Qiao, Y., Tucker, A., Wijayaratna, K., Peprah, P., Adomako, S., Yu, L., Goswami, S., Chen, H., Shu, B., Hessami, A., Abbas, M., Agarwal, N., and Rashidi, T. H.: Impact of COVID-19 pandemic on mobility in ten countries and associated perceived risk for all transport modes, PLOS ONE, 16, e0245886, https://doi.org/10.1371/journal.pone.0245886, 2021.
Bauwens, M., Compernolle, S., Stavrakou, T., Müller, J.-F., Gent, J. van, Eskes, H., Levelt, P. F., A, R. van der, Veefkind, J. P., Vlietinck, J., Yu, H., and Zehner, C.: Impact of Coronavirus Outbreak on NO2 Pollution Assessed Using TROPOMI and OMI Observations, Geophys. Res. Lett., 47, e2020GL087978, https://doi.org/10.1029/2020GL087978, 2020.
Beirle, S., Platt, U., Wenig, M., and Wagner, T.: Weekly cycle of NO2 by GOME measurements: a signature of anthropogenic sources, Atmos. Chem. Phys., 3, 2225–2232, https://doi.org/10.5194/acp-3-2225-2003, 2003.
Beirle, S., Boersma, K. F., Platt, U., Lawrence, M. G., and Wagner, T.: Megacity Emissions and Lifetimes of Nitrogen Oxides Probed from Space, Science, 333, 1737–1739, https://doi.org/10.1126/science.1207824, 2011.
Beirle, S., Borger, C., Dörner, S., Li, A., Hu, Z., Liu, F., Wang, Y., and Wagner, T.: Pinpointing nitrogen oxide emissions from space, Sci. Adv., 5, eaax9800, https://doi.org/10.1126/sciadv.aax9800, 2019.
Boersma, K. F., Eskes, H. J., Richter, A., De Smedt, I., Lorente, A., Beirle, S., van Geffen, J. H. G. M., Zara, M., Peters, E., Van Roozendael, M., Wagner, T., Maasakkers, J. D., van der A, R. J., Nightingale, J., De Rudder, A., Irie, H., Pinardi, G., Lambert, J.-C., and Compernolle, S. C.: Improving algorithms and uncertainty estimates for satellite NO2 retrievals: results from the quality assurance for the essential climate variables (QA4ECV) project, Atmos. Meas. Tech., 11, 6651–6678, https://doi.org/10.5194/amt-11-6651-2018, 2018.
Bounds, A. M.: New Yorkers' Street Smarts and Survival Smarts During the Pandemic: Preppers, Community Resilience and Local Citizenship, Urbana, XXI, Urbana: Urban Affairs & Public Policy, Publication of the Urbana Consortium, https://doi.org/10.47785/urbana.5.2020, 2020.
Bovensmann, H., Burrows, J. P., Buchwitz, M., Frerick, J., Noël, S., Rozanov, V. V., Chance, K. V., and Goede, A. P. H.: SCIAMACHY: Mission Objectives and Measurement Modes, J. Atmos. Sci., 56, 127–150, 1999.
Bureau of Transportation Statistics: The Week in Transportation, Bureau of Transportation Statistics, available at: https://www.bts.gov/covid-19/ (last access: 9 June 2021), 2020.
Burnett, R., Chen, H., Szyszkowicz, M., Fann, N., Hubbell, B., Pope, C. A., Apte, J. S., Brauer, M., Cohen, A., Weichenthal, S., Coggins, J., Di, Q., Brunekreef, B., Frostad, J., Lim, S. S., Kan, H., Walker, K. D., Thurston, G. D., Hayes, R. B., Lim, C. C., Turner, M. C., Jerrett, M., Krewski, D., Gapstur, S. M., Diver, W. R., Ostro, B., Goldberg, D., Crouse, D. L., Martin, R. V., Peters, P., Pinault, L., Tjepkema, M., Donkelaar, A. van, Villeneuve, P. J., Miller, A. B., Yin, P., Zhou, M., Wang, L., Janssen, N. A. H., Marra, M., Atkinson, R. W., Tsang, H., Thach, T. Q., Cannon, J. B., Allen, R. T., Hart, J. E., Laden, F., Cesaroni, G., Forastiere, F., Weinmayr, G., Jaensch, A., Nagel, G., Concin, H., and Spadaro, J. V.: Global estimates of mortality associated with long-term exposure to outdoor fine particulate matter, P. Natl. Acad. Sci. USA, 115, 9592–9597, https://doi.org/10.1073/pnas.1803222115, 2018.
Burnett, R. T., Stieb, D., Brook, J. R., Cakmak, S., Dales, R., Raizenne, M., Vincent, R., and Dann, T.: Associations between Short-Term Changes in Nitrogen Dioxide and Mortality in Canadian Cities, Arch. Environ. Health, 59, 228–236, https://doi.org/10.3200/AEOH.59.5.228-236, 2004.
Chance, K., Liu, X., Suleiman, R. M., Flittner, D. E., Al-Saadi, J., and Janz, S. J.: Tropospheric emissions: monitoring of pollution (TEMPO), in: Earth Observing Systems XVIII, Earth Observing Systems XVIII, Society of Photo-Optical Instrumentation Engineers (SPIE), 88660D, https://doi.org/10.1117/12.2024479, 2013.
COVID-19: Latest Data – NYC Health: https://www1.nyc.gov/site/doh/covid/covid-19-data.page, last access: 9 July 2021.
Decina, S. M., Templer, P. H., Hutyra, L. R., Gately, C. K., and Rao, P.: Variability, drivers, and effects of atmospheric nitrogen inputs across an urban area: Emerging patterns among human activities, the atmosphere, and soils, Sci. Total Environ., 609, 1524–1534, https://doi.org/10.1016/j.scitotenv.2017.07.166, 2017.
Decina, S. M., Hutyra, L. R., and Templer, P. H.: Hotspots of nitrogen deposition in the world's urban areas: a global data synthesis, J. Ecol. Environ., 18, 92–100, https://doi.org/10.1002/fee.2143, 2020.
de Foy, B., Wilkins, J. L., Lu, Z., Streets, D. G., and Duncan, B. N.: Model evaluation of methods for estimating surface emissions and chemical lifetimes from satellite data, Atmos. Environ., 98, 66–77, https://doi.org/10.1016/j.atmosenv.2014.08.051, 2014.
Dix, B., Bruin, J. de, Roosenbrand, E., Vlemmix, T., Francoeur, C., Gorchov-Negron, A., McDonald, B., Zhizhin, M., Elvidge, C., Veefkind, P., Levelt, P., and de Gouw, J.: Nitrogen Oxide Emissions from U.S. Oil and Gas Production: Recent Trends and Source Attribution, Geophys. Res. Lett., 47, e2019GL085866, https://doi.org/10.1029/2019GL085866, 2020.
Duan, Y., Liao, Y., Li, H., Yan, S., Zhao, Z., Yu, S., Fu, Y., Wang, Z., Yin, P., Cheng, J., and Jiang, H.: Effect of changes in season and temperature on cardiovascular mortality associated with nitrogen dioxide air pollution in Shenzhen, China, Sci. Total Environ., 697, 134051, https://doi.org/10.1016/j.scitotenv.2019.134051, 2019.
Duncan, B. N., Lamsal, L. N., Thompson, A. M., Yoshida, Y., Lu, Z., Streets, D. G., Hurwitz, M. M., and Pickering, K. E.: A space-based, high-resolution view of notable changes in urban NOx pollution around the world (2005–2014), J. Geophys. Res.-Atmos., 121, 976–996, https://doi.org/10.1002/2015JD024121, 2016.
Fares, S., Vargas, R., Detto, M., Goldstein, A. H., Karlik, J., Paoletti, E., and Vitale, M.: Tropospheric ozone reduces carbon assimilation in trees: estimates from analysis of continuous flux measurements, Glob. Change Biol., 19, 2427–2443, https://doi.org/10.1111/gcb.12222, 2013.
FlightAware: An Uneven Recovery: A Sector-by-Sector Visualization of the Impact of COVID-19 on Aviation, available at: https://blog.flightaware.com/ (last access: 9 July 2021), 2020.
Forster, P. M., Forster, H. I., Evans, M. J., Gidden, M. J., Jones, C. D., Keller, C. A., Lamboll, R. D., Quéré, C. L., Rogelj, J., Rosen, D., Schleussner, C.-F., Richardson, T. B., Smith, C. J., and Turnock, S. T.: Current and future global climate impacts resulting from COVID-19, Nat. Clim. Change, 10, 913–919, https://doi.org/10.1038/s41558-020-0883-0, 2020.
Gkatzelis, G. I., Gilman, J. B., Brown, S. S., Eskes, H., Gomes, A. R., Lange, A. C., McDonald, B. C., Peischl, J., Petzold, A., Thompson, C. R., and Kiendler-Scharr, A.: The global impacts of COVID-19 lockdowns on urban air pollution: A critical review and recommendations, Elementa, Science of the Anthropocene, 9, 00176, https://doi.org/10.1525/elementa.2021.00176, 2021.
Goldberg, D. L., Lu, Z., Oda, T., Lamsal, L. N., Liu, F., Griffin, D., McLinden, C. A., Krotkov, N. A., Duncan, B. N., and Streets, D. G.: Exploiting OMI NO2 satellite observations to infer fossil-fuel CO2 emissions from U.S. megacities, Sci. Total Environ., 695, 133805, https://doi.org/10.1016/j.scitotenv.2019.133805, 2019a.
Goldberg, D. L., Lu, Z., Streets, D. G., de Foy, B., Griffin, D., McLinden, C. A., Lamsal, L. N., Krotkov, N. A., and Eskes, H.: Enhanced Capabilities of TROPOMI NO2: Estimating NOX from North American Cities and Power Plants, Environ. Sci. Technol., 53, 12594–12601, https://doi.org/10.1021/acs.est.9b04488, 2019b.
Goldberg, D. L., Anenberg, S. C., Griffin, D., McLinden, C. A., Lu, Z., and Streets, D. G.: Disentangling the Impact of the COVID-19 Lockdowns on Urban NO2 From Natural Variability, Geophys. Res. Lett., 47, e2020GL089269, https://doi.org/10.1029/2020GL089269, 2020.
Goldberg, D. L., Anenberg, S. C., Kerr, G. H., Mohegh, A., Lu, Z., and Streets, D. G.: TROPOMI NO2 in the United States: A detailed look at the annual averages, weekly cycles, effects of temperature, and correlation with surface NO2 concentrations, Earth's Future, 9, e2020EF001665, https://doi.org/10.1029/2020EF001665, 2021.
Griffin, D., Zhao, X., McLinden, C. A., Boersma, F., Bourassa, A., Dammers, E., Degenstein, D., Eskes, H., Fehr, L., Fioletov, V., Hayden, K., Kharol, S. K., Li, S.-M., Makar, P., Martin, R. V., Mihele, C., Mittermeier, R. L., Krotkov, N., Sneep, M., Lamsal, L. N., ter Linden, M., van Geffen, J., Veefkind, P., and Wolde, M.: High-Resolution Mapping of Nitrogen Dioxide With TROPOMI: First Results and Validation Over the Canadian Oil Sands, Geophys. Res. Lett., 46, 1049–1060, https://doi.org/10.1029/2018GL081095, 2019.
Herman, J., Spinei, E., Fried, A., Kim, J., Kim, J., Kim, W., Cede, A., Abuhassan, N., and Segal-Rozenhaimer, M.: NO2 and HCHO measurements in Korea from 2012 to 2016 from Pandora spectrometer instruments compared with OMI retrievals and with aircraft measurements during the KORUS-AQ campaign, Atmos. Meas. Tech., 11, 4583–4603, https://doi.org/10.5194/amt-11-4583-2018, 2018.
Herman, J., Abuhassan, N., Kim, J., Kim, J., Dubey, M., Raponi, M., and Tzortziou, M.: Underestimation of column NO2 amounts from the OMI satellite compared to diurnally varying ground-based retrievals from multiple PANDORA spectrometer instruments, Atmos. Meas. Tech., 12, 5593–5612, https://doi.org/10.5194/amt-12-5593-2019, 2019.
Hersbach, H., Bell, B., Berrisford, P., Hirahara, S., Horányi, A., Muñoz-Sabater, J., Nicolas, J., Peubey, C., Radu, R., Schepers, D., Simmons, A., Soci, C., Abdalla, S., Abellan, X., Balsamo, G., Bechtold, P., Biavati, G., Bidlot, J., Bonavita, M., Chiara, G. D., Dahlgren, P., Dee, D., Diamantakis, M., Dragani, R., Flemming, J., Forbes, R., Fuentes, M., Geer, A., Haimberger, L., Healy, S., Hogan, R. J., Hólm, E., Janisková, M., Keeley, S., Laloyaux, P., Lopez, P., Lupu, C., Radnoti, G., Rosnay, P. de, Rozum, I., Vamborg, F., Villaume, S., and Thépaut, J.-N.: The ERA5 global reanalysis, Q. J. Roy. Meteor. Soc., 146, 1999–2049, https://doi.org/10.1002/qj.3803, 2020.
Ialongo, I., Virta, H., Eskes, H., Hovila, J., and Douros, J.: Comparison of TROPOMI/Sentinel-5 Precursor NO2 observations with ground-based measurements in Helsinki, Atmos. Meas. Tech., 13, 205–218, https://doi.org/10.5194/amt-13-205-2020, 2020.
Jezouit, D. and Rambo, F.: The Clean Air Interstate Rul, EM-Environmental Manager, 2005.
Jin, X., Fiore, A. M., Murray, L. T., Valin, L. C., Lamsal, L. N., Duncan, B., Boersma, K. F., De Smedt, I., Abad, G. G., Chance, K., and Tonnesen, G. S.: Evaluating a space-based indicator of surface ozone-NOx-VOC sensitivity over midlatitude source regions and application to decadal trends, J. Geophys. Res.-Atmos., 122, 10439–10461, https://doi.org/10.1002/2017JD026720, 2017.
Judd, L. M., Al-Saadi, J. A., Szykman, J. J., Valin, L. C., Janz, S. J., Kowalewski, M. G., Eskes, H. J., Veefkind, J. P., Cede, A., Mueller, M., Gebetsberger, M., Swap, R., Pierce, R. B., Nowlan, C. R., Abad, G. G., Nehrir, A., and Williams, D.: Evaluating Sentinel-5P TROPOMI tropospheric NO2 column densities with airborne and Pandora spectrometers near New York City and Long Island Sound, Atmos. Meas. Tech., 13, 6113–6140, https://doi.org/10.5194/amt-13-6113-2020, 2020.
Karambelas, A.: LISTOS: Toward a Better Understanding of New York City’s Ozone Pollution Problem, October 2020 issue of Environmental Managers Magazine, a copyrighted publication of the Air & Waste Management Association (A&WMA), https://pubs.awma.org/flip/EM-Oct-2020/emoct20.pdf (last access: 10 June 2021), 2020.
Kaynak, B., Hu, Y., Martin, R. V., Sioris, C. E., and Russell, A. G.: Comparison of weekly cycle of NO2 satellite retrievals and NOx emission inventories for the continental United States, J. Geophys. Res., 114, D05302, https://doi.org/10.1029/2008JD010714, 2009.
Krotkov, N. A., McLinden, C. A., Li, C., Lamsal, L. N., Celarier, E. A., Marchenko, S. V., Swartz, W. H., Bucsela, E. J., Joiner, J., Duncan, B. N., Boersma, K. F., Veefkind, J. P., Levelt, P. F., Fioletov, V. E., Dickerson, R. R., He, H., Lu, Z., and Streets, D. G.: Aura OMI observations of regional SO2 and NO2 pollution changes from 2005 to 2015, Atmos. Chem. Phys., 16, 4605–4629, https://doi.org/10.5194/acp-16-4605-2016, 2016.
Laughner, J. L. and Cohen, R. C.: Direct observation of changing NOx lifetime in North American cities, Science, 366, 723–727, https://doi.org/10.1126/science.aax6832, 2019.
Levelt, P. F., Van Den Oord, G. H. J., Dobber, M. R., Mälkki, A., Visser, H., De Vries, J., Stammes, P., Lundell, J. O. V., and Saari, H.: The ozone monitoring instrument, IEEE Trans. Geosci. Remote Sens., 44, 1093–1100, https://doi.org/10.1109/TGRS.2006.872333, 2006.
Liu, F., Page, A., Strode, S. A., Yoshida, Y., Choi, S., Zheng, B., Lamsal, L. N., Li, C., Krotkovm N. A., Eskes, H., van der A R., Veefkind, P., Levelt, P. F., Hauser, O. P., and Joiner, J.: Abrupt decline in tropospheric nitrogen dioxide over China after the outbreak of COVID-19, Sci. Adv., 6, eabc2992, https://doi.org/10.1126/sciadv.abc2992, 2020.
Loughner, C. P., Tzortziou, M., Shroder, S., and Pickering, K. E.: Enhanced dry deposition of nitrogen pollution near coastlines: A case study covering the Chesapeake Bay estuary and Atlantic Ocean coastline, J. Geophys. Res.-Atmos., 121, 14221–14238, https://doi.org/10.1002/2016JD025571, 2016.
McCarthy, N.: The World's Largest Cities By Area, Source: Demographia, Statista, https://www.statista.com/chart/13966/the-worlds-largest-cities-by-area/ (last access: 10 June 2021), 2021.
NY MTA: Day-by-day ridership numbers, available at: https://new.mta.info/coronavirus/ridership, last access: 4 June 2021.
Paerl, H. W., Dennis, R. L., and Whitall, D. R.: Atmospheric deposition of nitrogen: Implications for nutrient over-enrichment of coastal waters, Estuaries, 25, 677–693, https://doi.org/10.1007/BF02804899, 2002.
Pardo, L. H., Robin-Abbott, M. J., and C. T., (Eds.): Assessment of Nitrogen deposition effects and empirical critical loads of Nitrogen for ecoregions of the United States, Gen. Tech. Rep. NRS-80, U.S Department of Agriculture, Forest Service, 80, 1–291, https://doi.org/10.2737/NRS-GTR-80, 2011.
Procore: Construction Activity across the United States shows signs of recovering to pre-COVID-19 levels, Procore Technologies, Inc., https://blog.procore.com/, (last access: 9 July 2021), 2020.
Przybylowski, A., Stelmak, S., and Suchanek, M.: Mobility Behaviour in View of the Impact of the COVID-19 Pandemic – Public Transport Users in Gdansk Case Study, Sustainability, 13, 364, https://doi.org/10.3390/su13010364, 2021.
Qu, Z., Jacob, D. J., Silvern, R. F., Shah, V., Campbell, P. C., Valin, L. C., and Murray, L. T.: US COVID-19 Shutdown Demonstrates Importance of Background NO2 in Inferring NOx Emissions From Satellite NO2 Observations, Geophys. Res. Lett., 48, e2021GL092783, https://doi.org/10.1029/2021GL092783, 2021.
Quealy, K.: The Richest Neighborhoods Emptied Out Most as Coronavirus Hit New York City, The New York Times, https://www.nytimes.com/ (last access: 10 June 2021), 2020.
Reuter, M., Buchwitz, M., Schneising, O., Krautwurst, S., O'Dell, C. W., Richter, A., Bovensmann, H., and Burrows, J. P.: Towards monitoring localized CO2 emissions from space: co-located regional CO2 and NO2 enhancements observed by the OCO-2 and S5P satellites, Atmos. Chem. Phys., 19, 9371–9383, https://doi.org/10.5194/acp-19-9371-2019, 2019.
Roberts-Semple, D., Song, F., and Gao, Y.: Seasonal characteristics of ambient nitrogen oxides and ground–level ozone in metropolitan northeastern New Jersey, Atmos. Pollut. Res., 3, 247–257, https://doi.org/10.5094/APR.2012.027, 2012.
Spinei, E., Whitehill, A., Fried, A., Tiefengraber, M., Knepp, T. N., Herndon, S., Herman, J. R., Müller, M., Abuhassan, N., Cede, A., Richter, D., Walega, J., Crawford, J., Szykman, J., Valin, L., Williams, D. J., Long, R., Swap, R. J., Lee, Y., Nowak, N., and Poche, B.: The first evaluation of formaldehyde column observations by improved Pandora spectrometers during the KORUS-AQ field study, Atmos. Meas. Tech., 11, 4943–4961, https://doi.org/10.5194/amt-11-4943-2018, 2018.
Stacey, P. E., Greening, H. S., Kremer, J. N., Peterson, D., and Tomasko, D. A.: Contributions of Atmospheric Nitrogen Deposition to U.S. Estuaries: Summary and Conclusions, in: Nitrogen Loading in Coastal Water Bodies: An Atmospheric Perspective, Am. Geophys. Union (AGU), edited by: Valigura, R. A., Alexander, R. B., Castro, M. S., Meyers, T. P., Paerl, H. W., Stacey, P. E., and Turner, R. E., 187–226, https://doi.org/10.1029/CE057p0187, 2001.
Stavrakou, T., Müller, J.-F., Bauwens, M., Boersma, K. F., and van Geffen, J.: Satellite evidence for changes in the NO2 weekly cycle over large cities, Sci. Rep., 10, 10066, https://doi.org/10.1038/s41598-020-66891-0, 2020.
Szykman, J., Swap, R., Lefer, B., Valin, L., Lee, S. C., Fioletov, V., Zhao, X., Davies, J., Williams, D., Abuhassan, N., Shalaby, L., Cede, A., Tiefengraber, M., Mueller, M., Kotsakis, A., Santos, F., and Robinson, J.: Pandora: Connecting in-situ and Satellite Monitoring in Support of the Canada – U.S. Air Quality Agreement, EM: Air and Waste Management Association's Magazine for Environmental Managers, ISSN: 2470-4741, Vol. 2019, Issue June, 2019.
Thakrar, S. K., Balasubramanian, S., Adams, P. J., Azevedo, I. M. L., Muller, N. Z., Pandis, S. N., Polasky, S., Pope, C. A., Robinson, A. L., Apte, J. S., Tessum, C. W., Marshall, J. D., and Hill, J. D.: Reducing Mortality from Air Pollution in the United States by Targeting Specific Emission Sources, Environ. Sci. Technol. Lett., 7, 639–645, https://doi.org/10.1021/acs.estlett.0c00424, 2020.
Transportation Research Board: Webinar Visualizing Effects of COVID 19 on Transportation A One Year Retrospective – National Academies, available at: https://www.nationalacademies.org/event/, last access: 9 July 2021.
Tzortziou, M., Herman, J. R., Cede, A., Loughner, C. P., Abuhassan, N., and Naik, S.: Spatial and temporal variability of ozone and nitrogen dioxide over a major urban estuarine ecosystem, J. Atmos. Chem., 72, 287–309, https://doi.org/10.1007/s10874-013-9255-8, 2013.
Tzortziou, M., Herman, J. R., Ahmad, Z., Loughner, C. P., Abuhassan, N., and Cede, A.: Atmospheric NO2 dynamics and impact on ocean color retrievals in urban nearshore regions, J. Geophys. Res.-Ocean., 119, 3834–3854, https://doi.org/10.1002/2014JC009803, 2014.
Tzortziou, M., Parker, O., Lamb, B., Herman, J. R., Lamsal, L., Stauffer, R., and Abuhassan, N.: Atmospheric Trace Gas (NO2 and O3) Variability in South Korean Coastal Waters, and Implications for Remote Sensing of Coastal Ocean Color Dynamics, Remote Sens., 10, 1587, https://doi.org/10.3390/rs10101587, 2018.
United Nations Conference on Trade and Development: COVID-19 and Maritime Transport Impact and Responses, available at: https://unctad.org/system/, last access: 9 June 2021.
U.S. Energy Information Administration: COVID-19 mitigation efforts result in the lowest U.S. petroleum consumption in decades, https://www.eia.gov/todayinenergy/detail.php?id=46141, last access: 20 November 2021.
Valin, L. C., Russell, A. R., and Cohen, R. C.: Variations of OH radical in an urban plume inferred from NO2 column measurements, Geophys. Res. Lett., 40, 1856–1860, https://doi.org/10.1002/grl.50267, 2013.
van der A, R. J., Eskes, H. J., Boersma, K. F., van Noije, T. P. C., Roozendael, M. V., Smedt, I. D., Peters, D. H. M. U., and Meijer, E. W.: Trends, seasonal variability and dominant NOx source derived from a ten year record of NO2 measured from space, J. Geophys. Res.-Atmos., 113, D04302, https://doi.org/10.1029/2007JD009021, 2008.
Veefkind, J. P., Aben, I., McMullan, K., Förster, H., de Vries, J., Otter, G., Claas, J., Eskes, H. J., de Haan, J. F., Kleipool, Q., van Weele, M., Hasekamp, O., Hoogeveen, R., Landgraf, J., Snel, R., Tol, P., Ingmann, P., Voors, R., Kruizinga, B., Vink, R., Visser, H., and Levelt, P. F.: TROPOMI on the ESA Sentinel-5 Precursor: A GMES mission for global observations of the atmospheric composition for climate, air quality and ozone layer applications, Remote Sens. Environ., 120, 70–83, https://doi.org/10.1016/j.rse.2011.09.027, 2012.
Verhoelst, T., Compernolle, S., Pinardi, G., Lambert, J.-C., Eskes, H. J., Eichmann, K.-U., Fjæraa, A. M., Granville, J., Niemeijer, S., Cede, A., Tiefengraber, M., Hendrick, F., Pazmiño, A., Bais, A., Bazureau, A., Boersma, K. F., Bognar, K., Dehn, A., Donner, S., Elokhov, A., Gebetsberger, M., Goutail, F., Grutter de la Mora, M., Gruzdev, A., Gratsea, M., Hansen, G. H., Irie, H., Jepsen, N., Kanaya, Y., Karagkiozidis, D., Kivi, R., Kreher, K., Levelt, P. F., Liu, C., Müller, M., Navarro Comas, M., Piters, A. J. M., Pommereau, J.-P., Portafaix, T., Prados-Roman, C., Puentedura, O., Querel, R., Remmers, J., Richter, A., Rimmer, J., Rivera Cárdenas, C., Saavedra de Miguel, L., Sinyakov, V. P., Stremme, W., Strong, K., Van Roozendael, M., Veefkind, J. P., Wagner, T., Wittrock, F., Yela González, M., and Zehner, C.: Ground-based validation of the Copernicus Sentinel-5P TROPOMI NO2 measurements with the NDACC ZSL-DOAS, MAX-DOAS and Pandonia global networks, Atmos. Meas. Tech., 14, 481–510, https://doi.org/10.5194/amt-14-481-2021, 2021.
Verstraeten, W. W., Boersma, K. F., Douros, J., Williams, J. E., Eskes, H., Liu, F., Beirle, S., and Delcloo, A.: Top-Down NOX Emissions of European Cities Based on the Downwind Plume of Modelled and Space-Borne Tropospheric NO2 Columns, Sensors, 18, 2893, https://doi.org/10.3390/s18092893, 2018.
WHO: Ten health issues WHO will tackle this year, available at: https://www.who.int/news-room/spotlight/ten-threats-to-global-health-in-2019, last access: 3 May 2021.
Xu, W. Y., Zhao, C. S., Ran, L., Deng, Z. Z., Liu, P. F., Ma, N., Lin, W. L., Xu, X. B., Yan, P., He, X., Yu, J., Liang, W. D., and Chen, L. L.: Characteristics of pollutants and their correlation to meteorological conditions at a suburban site in the North China Plain, Atmos. Chem. Phys., 11, 4353–4369, https://doi.org/10.5194/acp-11-4353-2011, 2011.
Zhao, X., Griffin, D., Fioletov, V., McLinden, C., Cede, A., Tiefengraber, M., Müller, M., Bognar, K., Strong, K., Boersma, F., Eskes, H., Davies, J., Ogyu, A., and Lee, S. C.: Assessment of the quality of TROPOMI high-spatial-resolution NO2 data products in the Greater Toronto Area, Atmos. Meas. Tech., 13, 2131–2159, https://doi.org/10.5194/amt-13-2131-2020, 2020.