
Development of a Mortality Prediction Model in Hospitalised SARS-CoV-2 Positive Patients Based on Routine Kidney Biomarkers

 , , , , , , ,
Abstract
:1. Introduction
2. Results
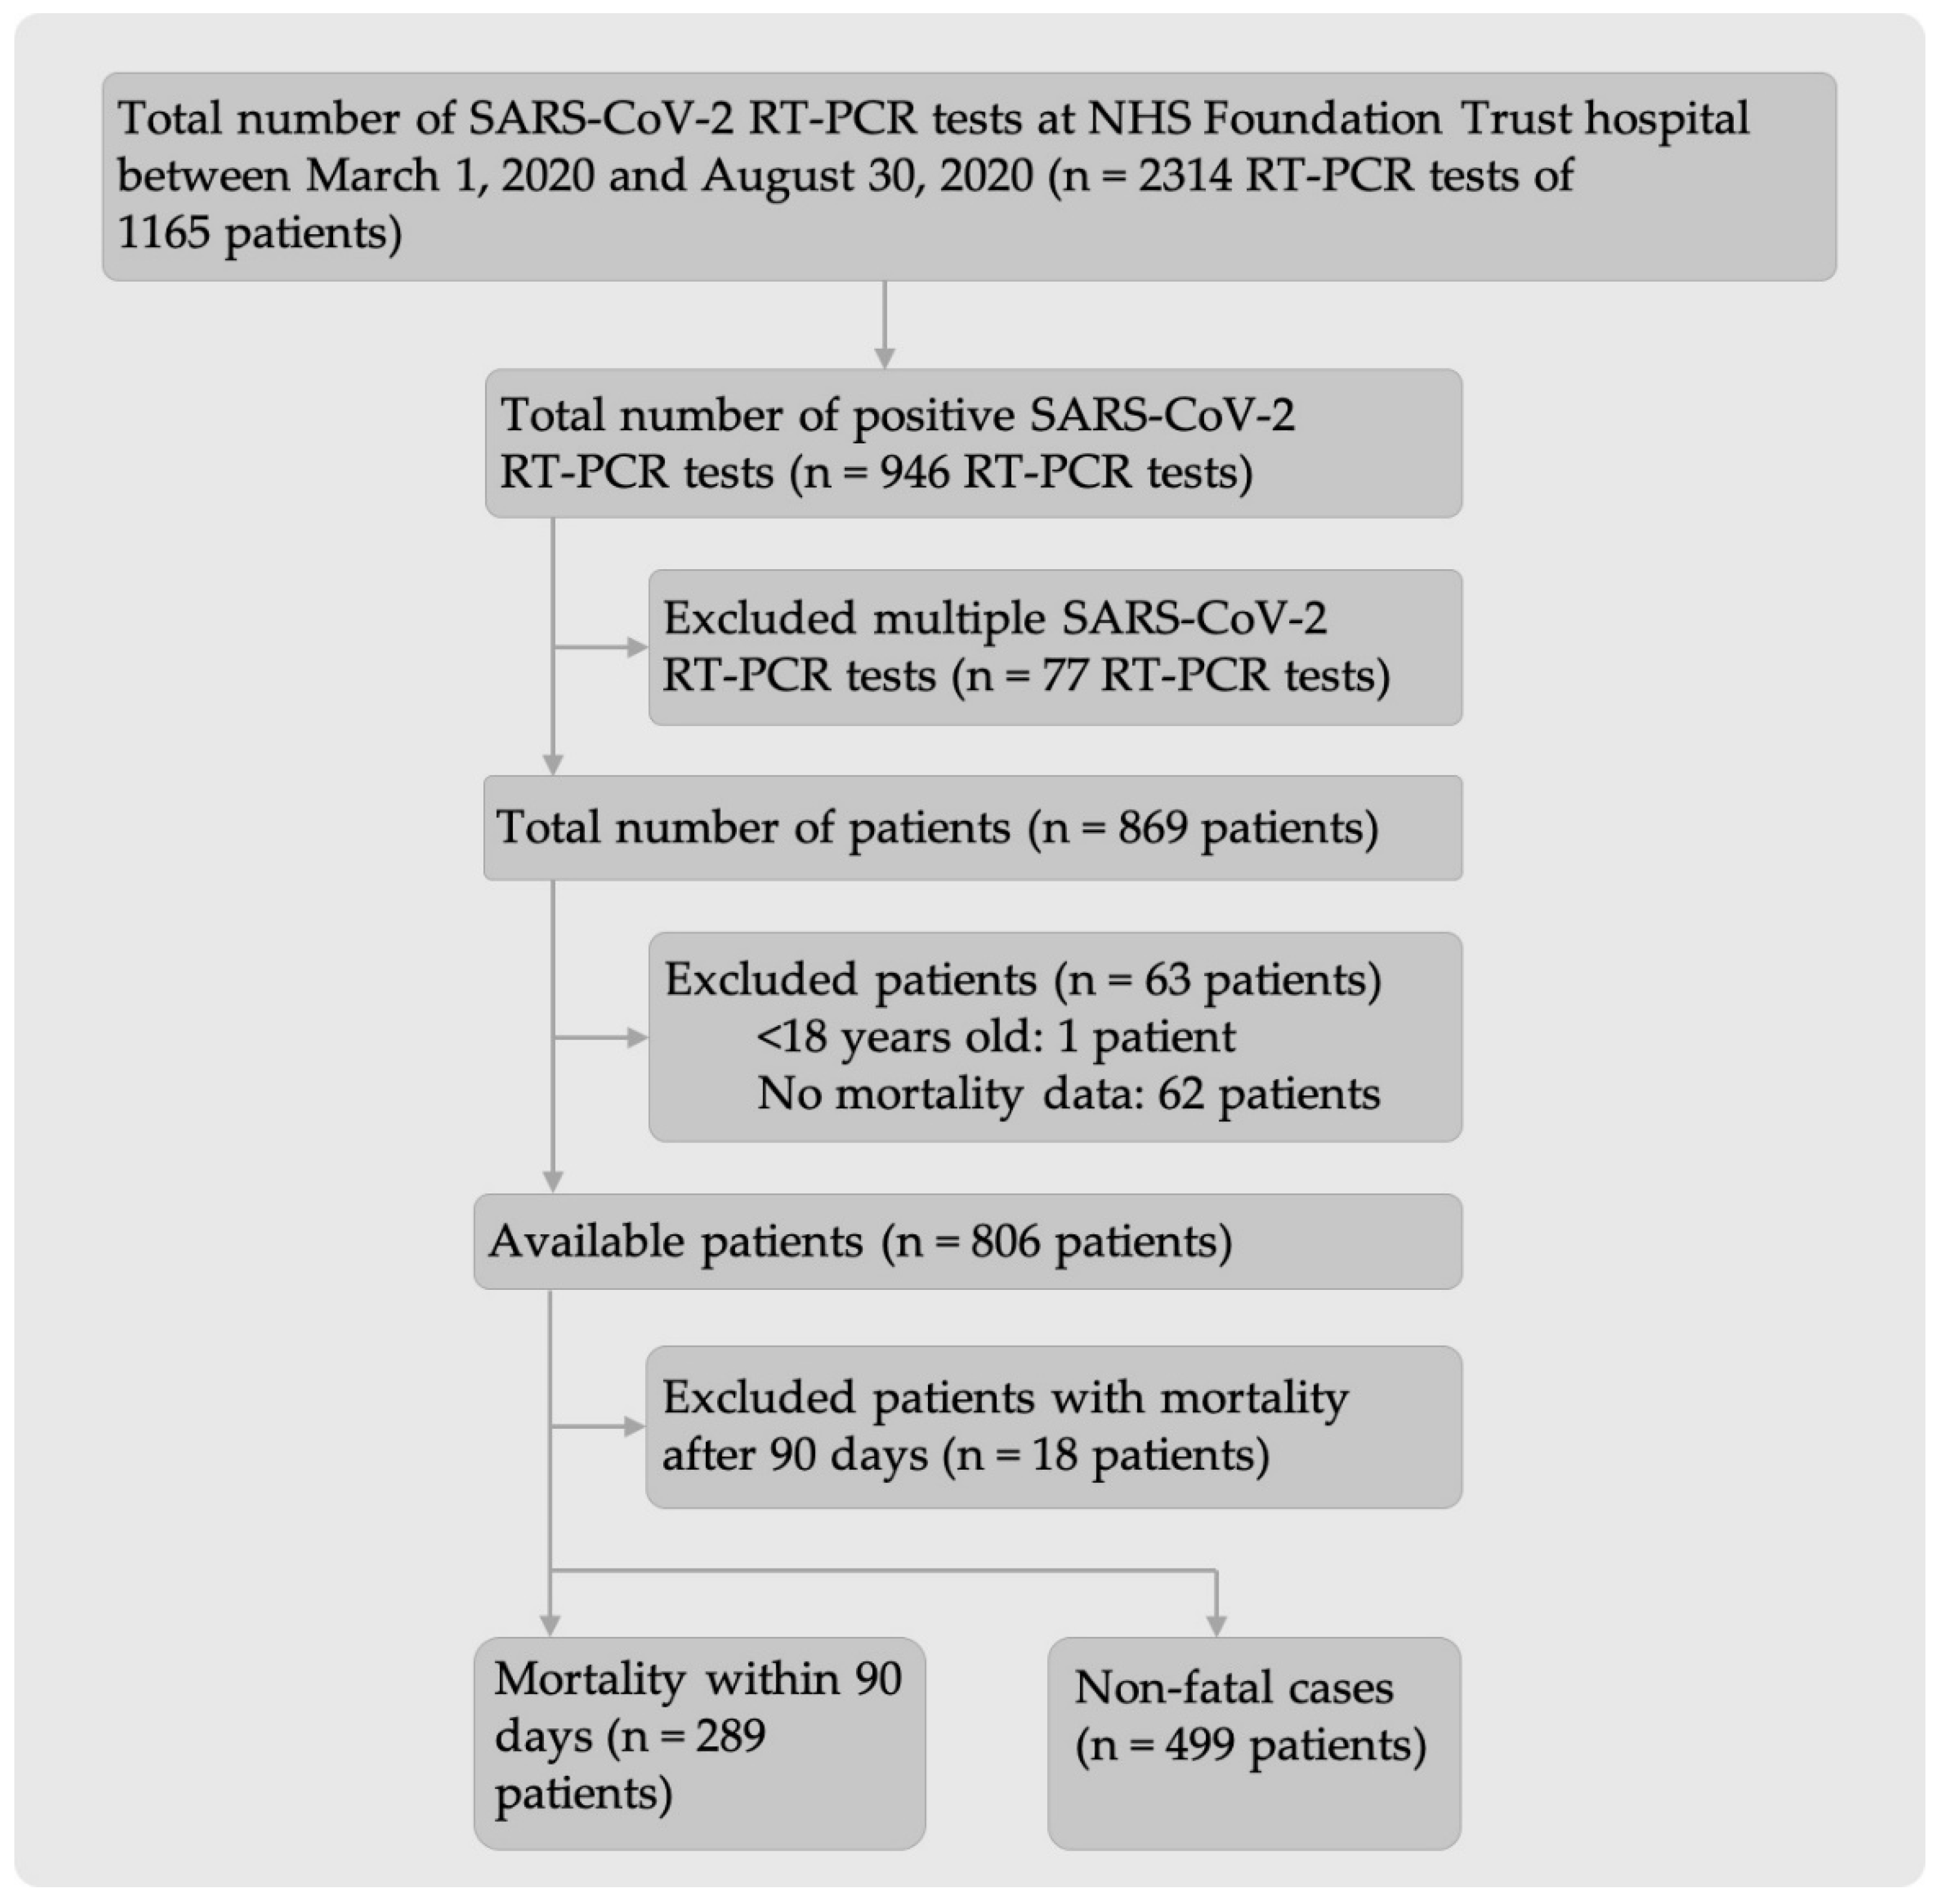
2.1. Participants
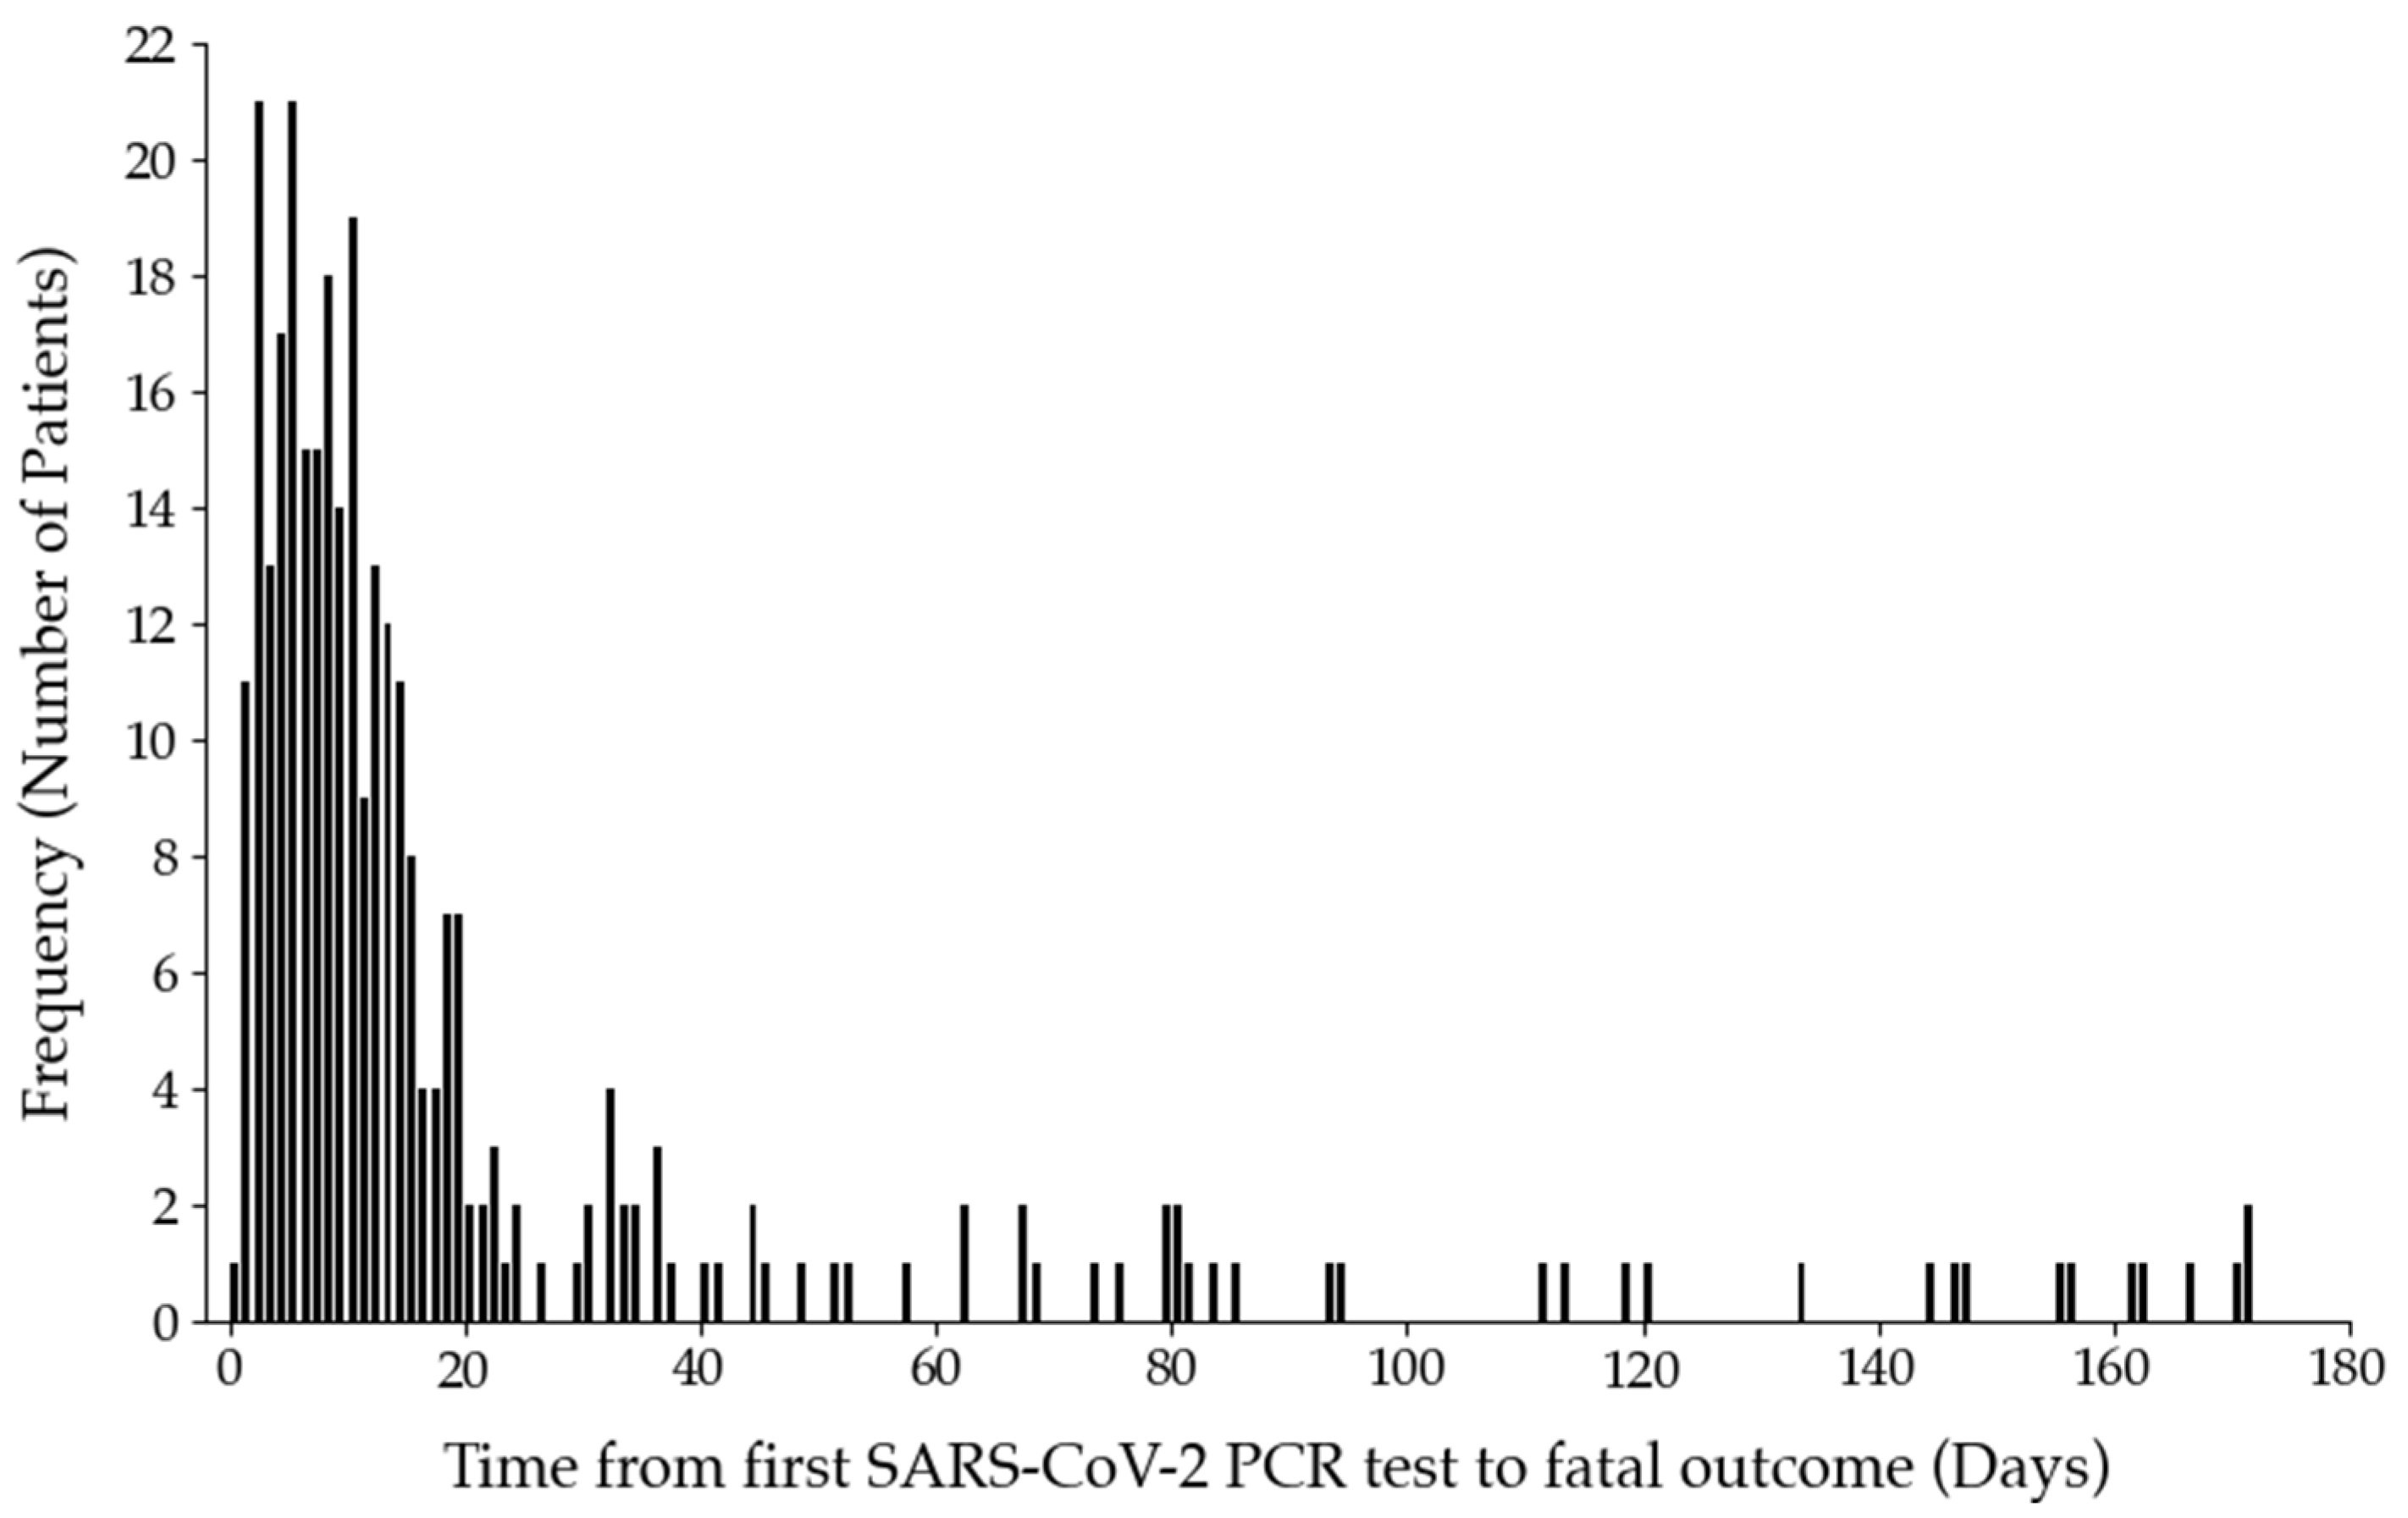
2.2. Non-Fatal and Fatal Outcomes in SARS-CoV-2 Positive Patients
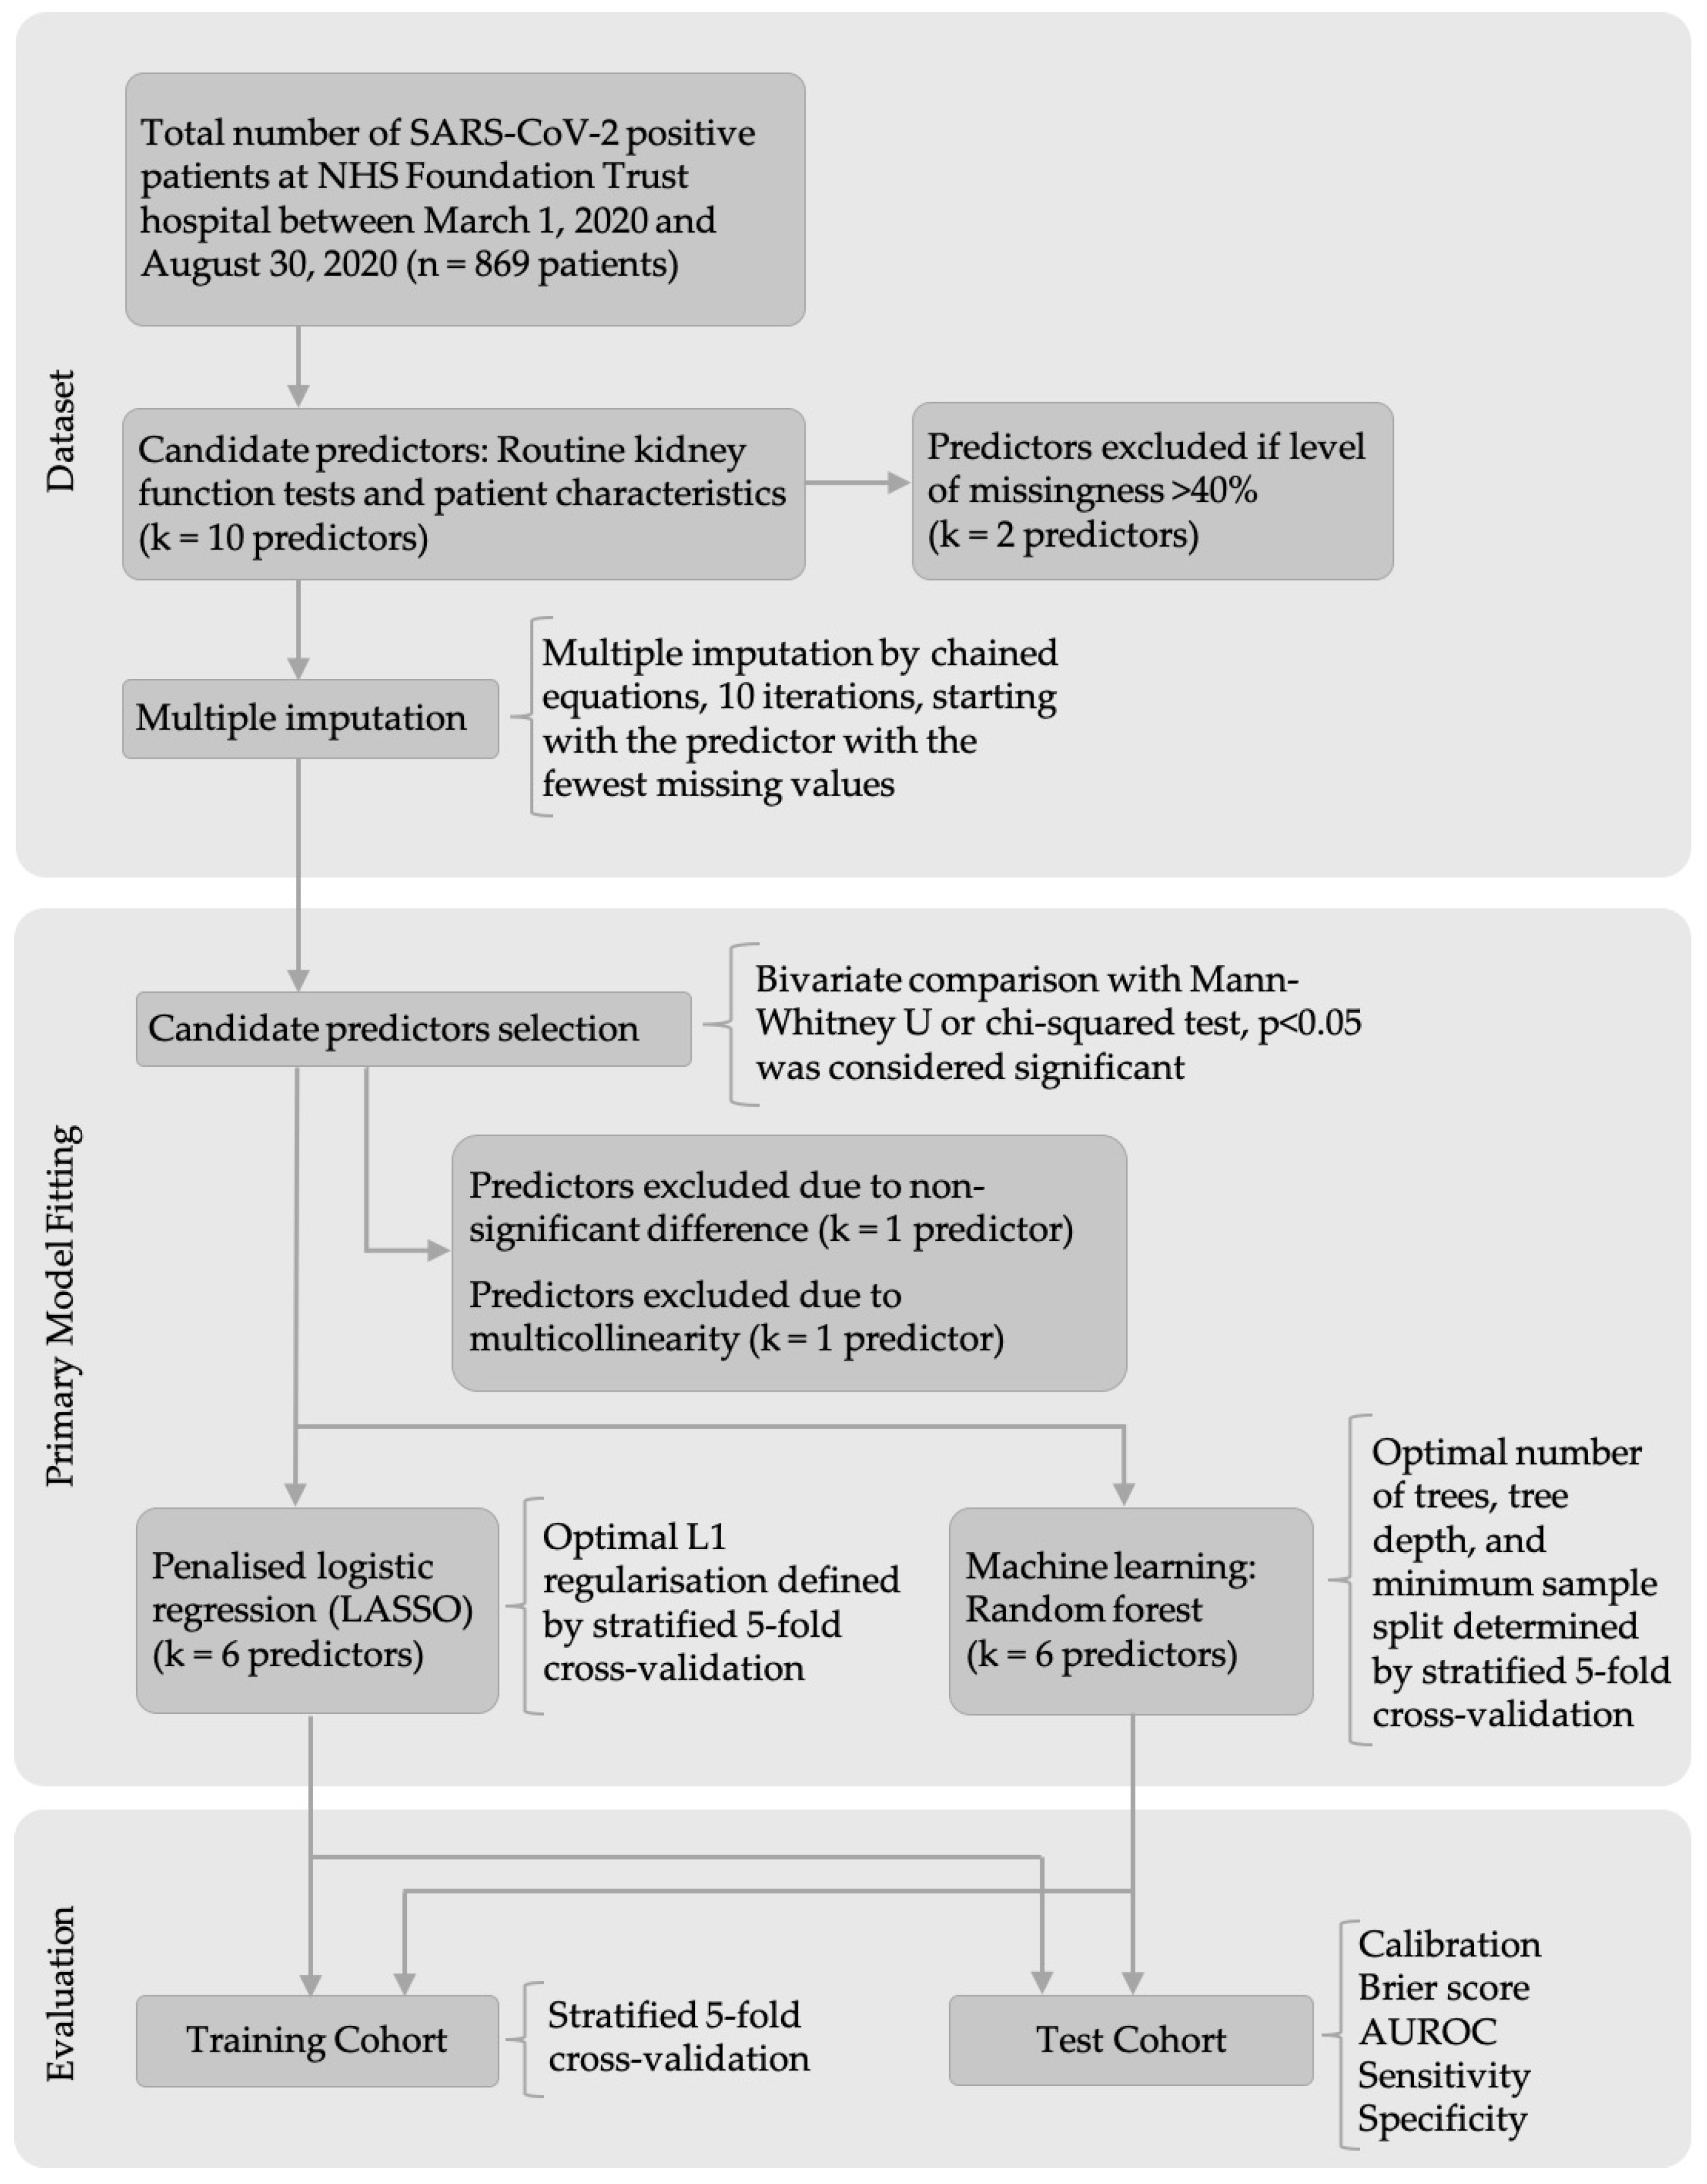
2.3. Prediction Models
2.4. Missing Values
2.5. Candidate Predictors Selection
2.6. Model Development
2.6.1. Logistic Regression
2.6.2. Random Forest
2.6.3. Simplified Model
2.7. Model Performance in Training Cohort
2.8. Model Evaluation in Test Cohort
3. Discussion
4. Materials and Methods
4.1. Study Design and Setting
4.2. Data Protection/Ethics
4.3. Participants
4.4. Inclusion and Exclusion Criteria
4.5. Mortality Timeframe
4.6. Candidate Predictors
4.7. Non-Fatal and Fatal Outcomes in SARS-CoV-2 Positive Patients
4.8. Prediction Models
4.8.1. Outcome
4.8.2. Model Development
4.8.3. Model Evaluation in Training Cohort
4.8.4. Model Evaluation in Test Cohort
5. Conclusions
Supplementary Materials
Author Contributions
Funding
Institutional Review Board Statement
Informed Consent Statement
Data Availability Statement
Conflicts of Interest
Abbreviations
| ACE2 | Angiotensin-converting enzyme 2 |
| AKI | Acute kidney injury |
| AUROC | Area under the receiver operating characteristicreceiver operator curve |
| CI | Confidence interval |
| COVID-19 | Coronavirus disease 2019 |
| CRP | C-reactive protein |
| eGFR | Estimated glomerular filtration rate |
| IQR | Interquartile range |
| IRAS | Integrated Research Application System |
| LASSO | Least absolute shrinkage and selection operator |
| LIMS | Laboratory Information Management System |
| MICE | Multiple imputation by chained equations |
| MRI | Magnetic Resonance Imaging |
| NHS | National Health Service |
| NSAIDs | Non-steroidal anti-inflammatory drugs |
| REC | Research Ethics Committee |
| RF | Random forest |
| RNA | Ribonucleic acid |
| RT-PCR | Real-time polymerase chain reaction |
| SARS-CoV-2 | Severe acute respiratory syndrome coronavirus 2 |
| SD | Standard deviation |
| TRIPOD | Transparent reporting of a multivariable prediction model for individual prediction or diagnosis |
References
- Nadim, M.K.; Forni, L.G.; Mehta, R.L.; Connor, M.J.; Liu, K.D.; Ostermann, M.; Rimmelé, T.; Zarbock, A.; Bell, S.; Bihorac, A.; et al. COVID-19-associated acute kidney injury: Consensus report of the 25th Acute Disease Quality Initiative (ADQI) Workgroup. Nat. Rev. Nephrol. 2020, 16, 747–764. [Google Scholar] [CrossRef]
- Gkogkou, E.; Barnasas, G.; Vougas, K.; Trougakos, I.P. Expression profiling meta-analysis of ACE2 and TMPRSS2, the putative anti-inflammatory receptor and priming protease of SARS-CoV-2 in human cells, and identification of putative modulators. Redox Biol. 2020, 36, 101615. [Google Scholar] [CrossRef]
- Wu, L.; Zhou, L.; Mo, M.; Liu, T.; Wu, C.; Gong, C.; Lu, K.; Gong, L.; Zhu, W.; Xu, Z. SARS-CoV-2 Omicron RBD shows weaker binding affinity than the currently dominant Delta variant to human ACE2. Signal Transduct. Target. Ther. 2022, 7, 8. [Google Scholar] [CrossRef]
- Diao, B.; Wang, C.; Wang, R.; Feng, Z.; Zhang, J.; Yang, H.; Tan, Y.; Wang, H.; Wang, C.; Liu, L.; et al. Human kidney is a target for novel severe acute respiratory syndrome coronavirus 2 infection. Nat. Commun. 2021, 12, 2506. [Google Scholar] [CrossRef]
- Pan, X.-W.; Xu, D.; Zhang, H.; Zhou, W.; Wang, L.-H.; Cui, X.-G. Identification of a potential mechanism of acute kidney injury during the COVID-19 outbreak: A study based on single-cell transcriptome analysis. Intensive Care Med. 2020, 46, 1114–1116. [Google Scholar] [CrossRef] [Green Version]
- Ahmadian, E.; Hosseiniyan Khatibi, S.M.; Razi Soofiyani, S.; Abediazar, S.; Shoja, M.M.; Ardalan, M.; Zununi Vahed, S. COVID-19 and kidney injury: Pathophysiology and molecular mechanisms. Rev. Med. Virol. 2020, 31, e2176. [Google Scholar] [CrossRef]
- Sarhan, M.; von Mässenhausen, A.; Hugo, C.; Oberbauer, R.; Linkermann, A. Immunological consequences of kidney cell death. Cell Death Dis. 2018, 9, 114. [Google Scholar] [CrossRef] [Green Version]
- Khwaja, A. KDIGO clinical practice guidelines for acute kidney injury. Nephron. Clin. Pract. 2012, 120, c179–c184. [Google Scholar] [CrossRef]
- Thongprayoon, C.; Hansrivijit, P.; Kovvuru, K.; Kanduri, S.R.; Torres-Ortiz, A.; Acharya, P.; Gonzalez-Suarez, M.L.; Kaewput, W.; Bathini, T.; Cheungpasitporn, W. Diagnostics, risk factors, treatment and outcomes of acute kidney injury in a new paradigm. J. Clin. Med. 2020, 9, 1104. [Google Scholar] [CrossRef] [Green Version]
- Cheng, Y.; Luo, R.; Wang, K.; Zhang, M.; Wang, Z.; Dong, L.; Li, J.; Yao, Y.; Ge, S.; Xu, G. Kidney disease is associated with in-hospital death of patients with COVID-19. Kidney Int. 2020, 97, 829–838. [Google Scholar] [CrossRef]
- Hirsch, J.S.; Ng, J.H.; Ross, D.W.; Sharma, P.; Shah, H.H.; Barnett, R.L.; Hazzan, A.D.; Fishbane, S.; Jhaveri, K.D.; Northwell, C.-R.C.; et al. Acute kidney injury in patients hospitalized with COVID-19. Kidney Int. 2020, 98, 209–218. [Google Scholar] [CrossRef]
- Pei, G.; Zhang, Z.; Peng, J.; Liu, L.; Zhang, C.; Yu, C.; Ma, Z.; Huang, Y.; Liu, W.; Yao, Y.; et al. Renal involvement and early prognosis in patients with COVID-19 pneumonia. J. Am. Soc. Nephrol. 2020, 31, 1157–1165. [Google Scholar] [CrossRef]
- World Health Organization WHO Coronavirus Disease (COVID-19) Dashboard. Available online: https://covid19.who.int/ (accessed on 7 September 2021).
- Asghar, M.S.; Haider Kazmi, S.J.; Khan, N.A.; Akram, M.; Hassan, M.; Rasheed, U.; Ahmed Khan, S. Poor prognostic biochemical markers predicting fatalities caused by COVID-19: A retrospective observational study from a developing country. Cureus 2020, 12, e9575. [Google Scholar] [CrossRef]
- Lippi, G.; South, A.M.; Henry, B.M. Electrolyte imbalances in patients with severe coronavirus disease 2019 (COVID-19). Ann. Clin. Biochem. 2020, 57, 262–265. [Google Scholar] [CrossRef] [Green Version]
- Wynants, L.; Van Calster, B.; Collins, G.S.; Riley, R.D.; Heinze, G.; Schuit, E.; Bonten, M.M.J.; Dahly, D.L.; Damen, J.A.; Debray, T.P.A.; et al. Prediction models for diagnosis and prognosis of COVID-19: Systematic review and critical appraisal. BMJ 2020, 369, m1328. [Google Scholar] [CrossRef] [Green Version]
- Jiwa, N.; Mutneja, R.; Henry, L.; Fiscus, G.; Zu Wallack, R. Development of a brief scoring system to predict any-cause mortality in patients hospitalized with COVID-19 infection. PLoS ONE 2021, 16, e0254580. [Google Scholar] [CrossRef]
- Ray, S.; Swift, A.; Fanstone, J.W.; Banerjee, A.; Mamalakis, M.; Vorselaars, B.; Mackenzie, L.S.; Weeks, S. LUCAS: A highly accurate yet simple risk calculator that predicts survival of COVID-19 patients using rapid routine tests. medRxiv 2021. [Google Scholar] [CrossRef]
- Knight, S.R.; Ho, A.; Pius, R.; Buchan, I.; Carson, G.; Drake, T.M.; Dunning, J.; Fairfield, C.J.; Gamble, C.; Green, C.A.; et al. Risk stratification of patients admitted to hospital with covid-19 using the ISARIC WHO Clinical Characterisation Protocol: Development and validation of the 4C Mortality Score. BMJ 2020, 370, m3339. [Google Scholar] [CrossRef]
- Hippisley-Cox, J.; Coupland, C.A.C.; Mehta, N.; Keogh, R.H.; Diaz-Ordaz, K.; Khunti, K.; Lyons, R.A.; Kee, F.; Sheikh, A.; Rahman, S.; et al. Risk prediction of covid-19 related death and hospital admission in adults after covid-19 vaccination: National prospective cohort study. BMJ 2021, 374, n2244. [Google Scholar] [CrossRef]
- Bonetti, G.; Manelli, F.; Patroni, A.; Bettinardi, A.; Borrelli, G.; Fiordalisi, G.; Marino, A.; Menolfi, A.; Saggini, S.; Volpi, R.; et al. Laboratory predictors of death from coronavirus disease 2019 (COVID-19) in the area of Valcamonica, Italy. Clin. Chem. Lab. Med. 2020, 58, 1100–1105. [Google Scholar] [CrossRef]
- Zhu, Y.; Du, Z.; Zhu, Y.; Li, W.; Miao, H.; Li, Z. Evaluation of organ function in patients with severe COVID-19 infections. Med. Clin. 2020, 155, 191–196. [Google Scholar] [CrossRef]
- An, C.; Lim, H.; Kim, D.W.; Chang, J.H.; Choi, Y.J.; Kim, S.W. Machine learning prediction for mortality of patients diagnosed with COVID-19: A nationwide Korean cohort study. Sci. Rep. 2020, 10, 18716. [Google Scholar] [CrossRef]
- Wehbe, Z.; Hammoud, S.H.; Yassine, H.M.; Fardoun, M.; El-Yazbi, A.F.; Eid, A.H. Molecular and Biological Mechanisms Underlying Gender Differences in COVID-19 Severity and Mortality. Front. Immunol. 2021, 12, 1603. [Google Scholar] [CrossRef]
- Moons, K.G.; Altman, D.G.; Reitsma, J.B.; Ioannidis, J.P.; Macaskill, P.; Steyerberg, E.W.; Vickers, A.J.; Ransohoff, D.F.; Collins, G.S. Transparent reporting of a multivariable prediction model for individual prognosis or diagnosis (TRIPOD): Explanation and elaboration. Ann. Intern. Med. 2015, 162, W1–W73. [Google Scholar] [CrossRef] [Green Version]
- Malik, P.; Patel, U.; Mehta, D.; Patel, N.; Kelkar, R.; Akrmah, M.; Gabrilove, J.L.; Sacks, H. Biomarkers and outcomes of COVID-19 hospitalisations: Systematic review and meta-analysis. BMJ Evid.-Based Med. 2021, 26, 107. [Google Scholar] [CrossRef]
- Pedregosa, F.; Varoquaux, G.; Gramfort, A.; Michel, V.; Thirion, B.; Grisel, O.; Blondel, M.; Prettenhofer, P.; Weiss, R.; Dubourg, V.; et al. Scikit-learn: Machine learning in python. J. Mach. Learn. Res. 2011, 12, 2825–2830. [Google Scholar]
- Pandas—Python Data Analysis Library. Available online: https://pandas.pydata.org/ (accessed on 28 June 2022).
- Hunter, J.D. Matplotlib: A 2D graphics environment 3.4.1. Comput. Sci. Eng. 2007, 9, 90–95. [Google Scholar] [CrossRef]
- Mdscore. Available online: https://mdscore.org (accessed on 28 June 2022).


| Characteristics | Reference Range | Non-Fatal (n = 499) | Fatal (n = 289) | p-Value |
|---|---|---|---|---|
| Median (IQR) or No. (%) | Median (IQR) or No. (%) | |||
| Sex (%): | - | 0.03 | ||
| Male | 273 (54.7) | 182 (63.0) | ||
| Female | 226 (45.3) | 107 (37.0) | ||
| Age [years] | - | 69.0 (55.0–80.0) | 81.0 (75.0–87.0) | <0.001 |
| Ethnicity (%): | - | <0.001 | ||
| White | 377 (75.6) | 254 (87.9) | <0.001 | |
| Mixed | 4 (0.8) | 0 (0.0) | 0.31 | |
| Asian | 27 (5.4) | 7 (2.4) | 0.07 | |
| Black | 38 (7.6) | 8 (2.8) | <0.05 | |
| Chinese | 0 (0.0) | 1 (0.3) | 0.78 | |
| Any other ethnicity | 53 (10.6) | 19 (6.6) | 0.10 | |
| Sodium [mmol/L] | 133.0–146.0 | 136.0 (133.0–138.0) | 138.0 (134.0–140.0) | <0.001 |
| Potassium [mmol/L] | 3.5–5.3 | 4.2 (3.9–4.5) | 4.2 (3.8–4.6) | 0.22 |
| Bicarbonate [mmol/L] | 22.0–29.0 | 21.5 (18.0–24.2) | 19.0 (18.0–24.0) | 0.23 |
| Chloride [mmol/L] | 95.0–108.0 | 96.0 (-) | - | - |
| Urea [mmol/L] | 2.5–7.8 | 6.1 (4.3–9.3) | 9.6 (6.9–14.0) | <0.001 |
| Creatinine [μmol/L] | 84.5 (71.0–114.0) | 101.0 (76.3–152.5) | <0.001 | |
| Male | 62.0–106.0 | 90.0 (78.0–121.0) | 117.0 (89.5–170.5) | <0.001 |
| Female | 44.0–80.0 | 76.0 (62.0–99.0) | 82.0 (62.5–125.0) | 0.08 |
| eGFR [mL/min/1.73 m2] | ≥60.0 | 73.0 (50.0–90.0) | 51.0 (33.0–75.0) | <0.001 |
| Predictor | Penalised Coefficient | Scaling Factor |
|---|---|---|
| Intercept | −5.31 | - |
| Sex | 0.53 | - |
| Age [years] | 5.01 | (Age − 20)/82 |
| Ethnicity | −0.40 | - |
| Sodium [mmol/L] | 1.43 | (Sodium − 107)/60 |
| Urea [mmol/L] | 2.83 | (Urea − 1.3)/49.9 |
| Creatinine [μmol/L] | 0.00 | (Creatinine − 15)/814 |
| Model Performance | Training Cohort | Test Cohort | ||||
|---|---|---|---|---|---|---|
| Logistic Regression | Random Forest | Simplified Model | Logistic Regression | Random Forest | Simplified Model | |
| Calibration | 0.986 | 1.093 | 1.127 | 1.109 | 1.190 | 0.846 |
| Brier score | 0.188 | 0.176 | 0.193 | 0.185 | 0.170 | 0.191 |
| AUROC (95% CI) | 0.769 (0.716–0.821) | 0.800 (0.750–0.820) | 0.748 (0.700–0.794) | 0.772 (0.694–0.823) | 0.820 (0.740–0.870) | 0.757 (0.678–0.815) |
| Sensitivity | 0.500 | 0.522 | 0.457 | 0.414 | 0.466 | 0.483 |
| Specificity | 0.838 | 0.825 | 0.825 | 0.820 | 0.900 | 0.830 |
| No. of true positive | 23 | 24 | 21 | 24 | 27 | 28 |
| No. of true negative | 67 | 66 | 66 | 82 | 90 | 83 |
| No. of false positive | 13 | 14 | 14 | 18 | 10 | 17 |
| No. of false negative | 23 | 22 | 25 | 34 | 31 | 30 |
| Risk Group | Probability of Fatal Outcome | Number of Patients (%) | Number of Fatal Cases (%) |
|---|---|---|---|
| Low | <0.05 | 51 (6.5) | 1 (0.1) |
| Intermediate | 0.05–0.35 | 311 (39.5) | 58 (7.4) |
| High | 0.35–0.84 | 420 (53.3) | 225 (28.6) |
| Very high | >0.85 | 6 (0.8) | 5 (0.6) |
Publisher’s Note: MDPI stays neutral with regard to jurisdictional claims in published maps and institutional affiliations. |
© 2022 by the authors. Licensee MDPI, Basel, Switzerland. This article is an open access article distributed under the terms and conditions of the Creative Commons Attribution (CC BY) license (https://creativecommons.org/licenses/by/4.0/).
Share and Cite
Boss, A.N.; Banerjee, A.; Mamalakis, M.; Ray, S.; Swift, A.J.; Wilkie, C.; Fanstone, J.W.; Vorselaars, B.; Cole, J.; Weeks, S.; et al. Development of a Mortality Prediction Model in Hospitalised SARS-CoV-2 Positive Patients Based on Routine Kidney Biomarkers. Int. J. Mol. Sci. 2022, 23, 7260. https://doi.org/10.3390/ijms23137260
Boss AN, Banerjee A, Mamalakis M, Ray S, Swift AJ, Wilkie C, Fanstone JW, Vorselaars B, Cole J, Weeks S, et al. Development of a Mortality Prediction Model in Hospitalised SARS-CoV-2 Positive Patients Based on Routine Kidney Biomarkers. International Journal of Molecular Sciences. 2022; 23(13):7260. https://doi.org/10.3390/ijms23137260
Chicago/Turabian StyleBoss, Anna N., Abhirup Banerjee, Michail Mamalakis, Surajit Ray, Andrew J. Swift, Craig Wilkie, Joseph W. Fanstone, Bart Vorselaars, Joby Cole, Simonne Weeks, and et al. 2022. "Development of a Mortality Prediction Model in Hospitalised SARS-CoV-2 Positive Patients Based on Routine Kidney Biomarkers" International Journal of Molecular Sciences 23, no. 13: 7260. https://doi.org/10.3390/ijms23137260