1. Introduction
Since the emergence of SARS-CoV-2, almost 137,866,311 million confirmed cases of COVID-19 cases were reported globally [
1] (up to 16 April 2021). In Italy, a total of 3809,193 million cases were confirmed (up to 16 April 2021), with 115,557 reported fatalities [
2]. In order to support the national healthcare system, the Ministry of Health appointed the Istituti Zooprofilattici Sperimentali, public health veterinary institutes, to test for the presence of SARS-CoV-2 RNA, naso-pharyngeal/oropharyngeal swabs (NNS) collected from suspected human cases [
3,
4].
Accordingly, starting from 16 March 2020, swabs collected in the province of Teramo from Abruzzo, a central region of Italy, are regularly tested for the presence of SARS-CoV-2 RNA at the Istituto Zooprofilattico Sperimentale dell’Abruzzo e del Molise (IZSAM).
In a preliminary study conducted in 2020 [
4], the mean of cycle threshold for the N protein-encoding gene (C
T N) values of the first swab from each positive patient tested from March to May 2020, was analyzed. In that study, we observed a trend of C
T increasing from a median value of 27.9 (±6.0 C
T median value of standard deviation) to 33.43 (±1.3 C
T median value of standard deviation) between March and May 2020, suggesting that lockdown measures and the elimination of infection foci were able to reduce the overall viral loads [
4]. In that period, a general lockdown was applied from March 9 until May 18 to the whole of Italy, allowing a significant reduction of virus transmission [
5]. Furthermore, a statistically significant reduction of viral RNA loads was observed in the pairwise comparison between swabs collected in April and March 2020 [
4]. In contrast, the absence of a statistically significant difference between May and April 2020 was probably due to the low number of positive samples detected in May [
4]. In addition, no differences between C
T N gene values were observed between males and females [
4].
In the first three months of the epidemic, from March 2020 to the end of May, a total of 660 COVID-19 cases were confirmed in the province of Teramo [
2]. Likewise, other Italian provinces, following a summer characterised by limited viral circulation, in September a rapid increasing of the epidemic curve was observed in the province of Teramo, which was overwhelmed by 7814 confirmed cases from October to December 2020 (
Figure 1) [
2].
Following the results of the preliminary study [
4], further analysis of the C
T N gene values of positive NNS swabs in patients tested from March to 15 December 2020 was performed in the province of Teramo in order to characterize the dynamic of SARS-CoV-2 RNA loads over a longer period of time and to verify the existence of links between C
T N gene values and the epidemiological situation in the area.
The analysis was limited up to 15 December 2020 in order to avoid the interference with the B.1.1.7 lineage (VOC 202012/01) of SARS-CoV-2 positive cases detected for the first time in Abruzzo in that period [
6].
2. Materials and Methods
The workflow for SARS-CoV-2 RNA detection in NNS swabs [
3] has been previously described [
3,
4]. Briefly, the adopted molecular test (TaqMan 2019-nCoV (qPCR) assay kit v2 manufactured by Thermo Fisher (Thermo Fisher Scientific, Waltham, MA, USA) targets three different portions of SARS-CoV-2 genome namely the replicase, S and N protein-encoding genes. For practical reasons, out of the three values produced for each sample, for the downstream analysis, only the C
T value associated with detection of the N protein-encoding gene was selected, since it is translated by the most abundant viral sub-genomic RNA [
7].
Statistical analysis was performed using StatTools© (version 7.5.2 Palisade Corporation, Ithaca, NY, USA). A Mann–Whitney test was used to assess the statistical significance of differences among the C
T N gene median values in NNS swabs collected from March to 15 December 2020 in the province of Teramo. Regression analysis was performed to verify the correlation between C
T N gene median values and the incidence per 10,000 inhabitants of COVID-19 cases registered in three specific periods of the year: from March to April, from May to September and from October to December. These observation periods were selected because they characterize the epidemic curve observed in Italy: the first epidemic wave, the inter-epidemic period, and the second epidemic wave (
Figure 1).
For each SARS-CoV-2 positive patient, the CT N gene value of the first positive swab was considered. The level of significance was set at a p-value of 0.05. In order to check the performance of the swabbing procedure, a real-time RT-PCR detecting the human ribonuclease P RNA component H1 (H1RNA) gene (RPPH1) on chromosome 14 was employed. This molecular test, included in the TaqMan 2019 nCoV Assay kit v1 by Thermo Fisher, was run with a total of 68 randomly selected SARS-CoV-2 RNA positive samples, within those included in this study. The swabs were selected, in equal number, based on the CT N value, including: CT N between 15 and 20 (CT N 15-20), CT N 20-25, CT N 25-30, and CT N 30-35. Furthermore, in order to assess the presence of a correlation between CT values and viral loads, log10 dilutions (seven replicates per dilution) of a SARS-CoV-2 isolate on cell cultures were processed by qPCR.
3. Results
From 16 March to 15 December 2020, IZSAM analyzed a total of 132,357 NNS collected in the province of Teramo and 12.880 NNS tested positive for SARS-CoV-2 RNA by qPCR. A total of 8212 positive patients was selected for further analysis, of which 4150 women and 4062 men (
Table 1). The median age (years) was found statistically different (two-tailed Mann–Whitney test,
p-value < 0.01) between women (median: 49.55 ± 23.9 of standard deviation) and men (median: 48.35 ± 23.5 of standard deviation). The C
T N gene median values of the first positive swab between women and men were calculated and no statistically significant differences (two-tails Mann–Whitney test,
p-value > 0.05) were found between women (median C
T N: 29) and men (median C
T N: 28).
C
T values of the H1RNA gene, although reasonably analysed on a selected set of samples, clearly showed that the observed trends of SARS-CoV-2 C
T N values are not related to the swabbing procedure as C
T values of the H1RNA are constant (mean range 22.94 ± 2.794 SD to 23.29 ± 2.28 SD) in samples showing different loads of SARS-CoV-2 RNA (
Figure 2A).
In order to assess the presence of a correlation between C
T values and viral loads, log
10 dilutions (seven replicates per dilution) of a SARS-CoV-2 isolate on cell cultures were processed. The results showed a linear correlation over seven order of magnitude (from 10
6 TCID
50/mLto 10
0 TCID
50/mL), with good intra-assay reproducibility at high, intermediate and low virus concentrations (
Figure 2B).
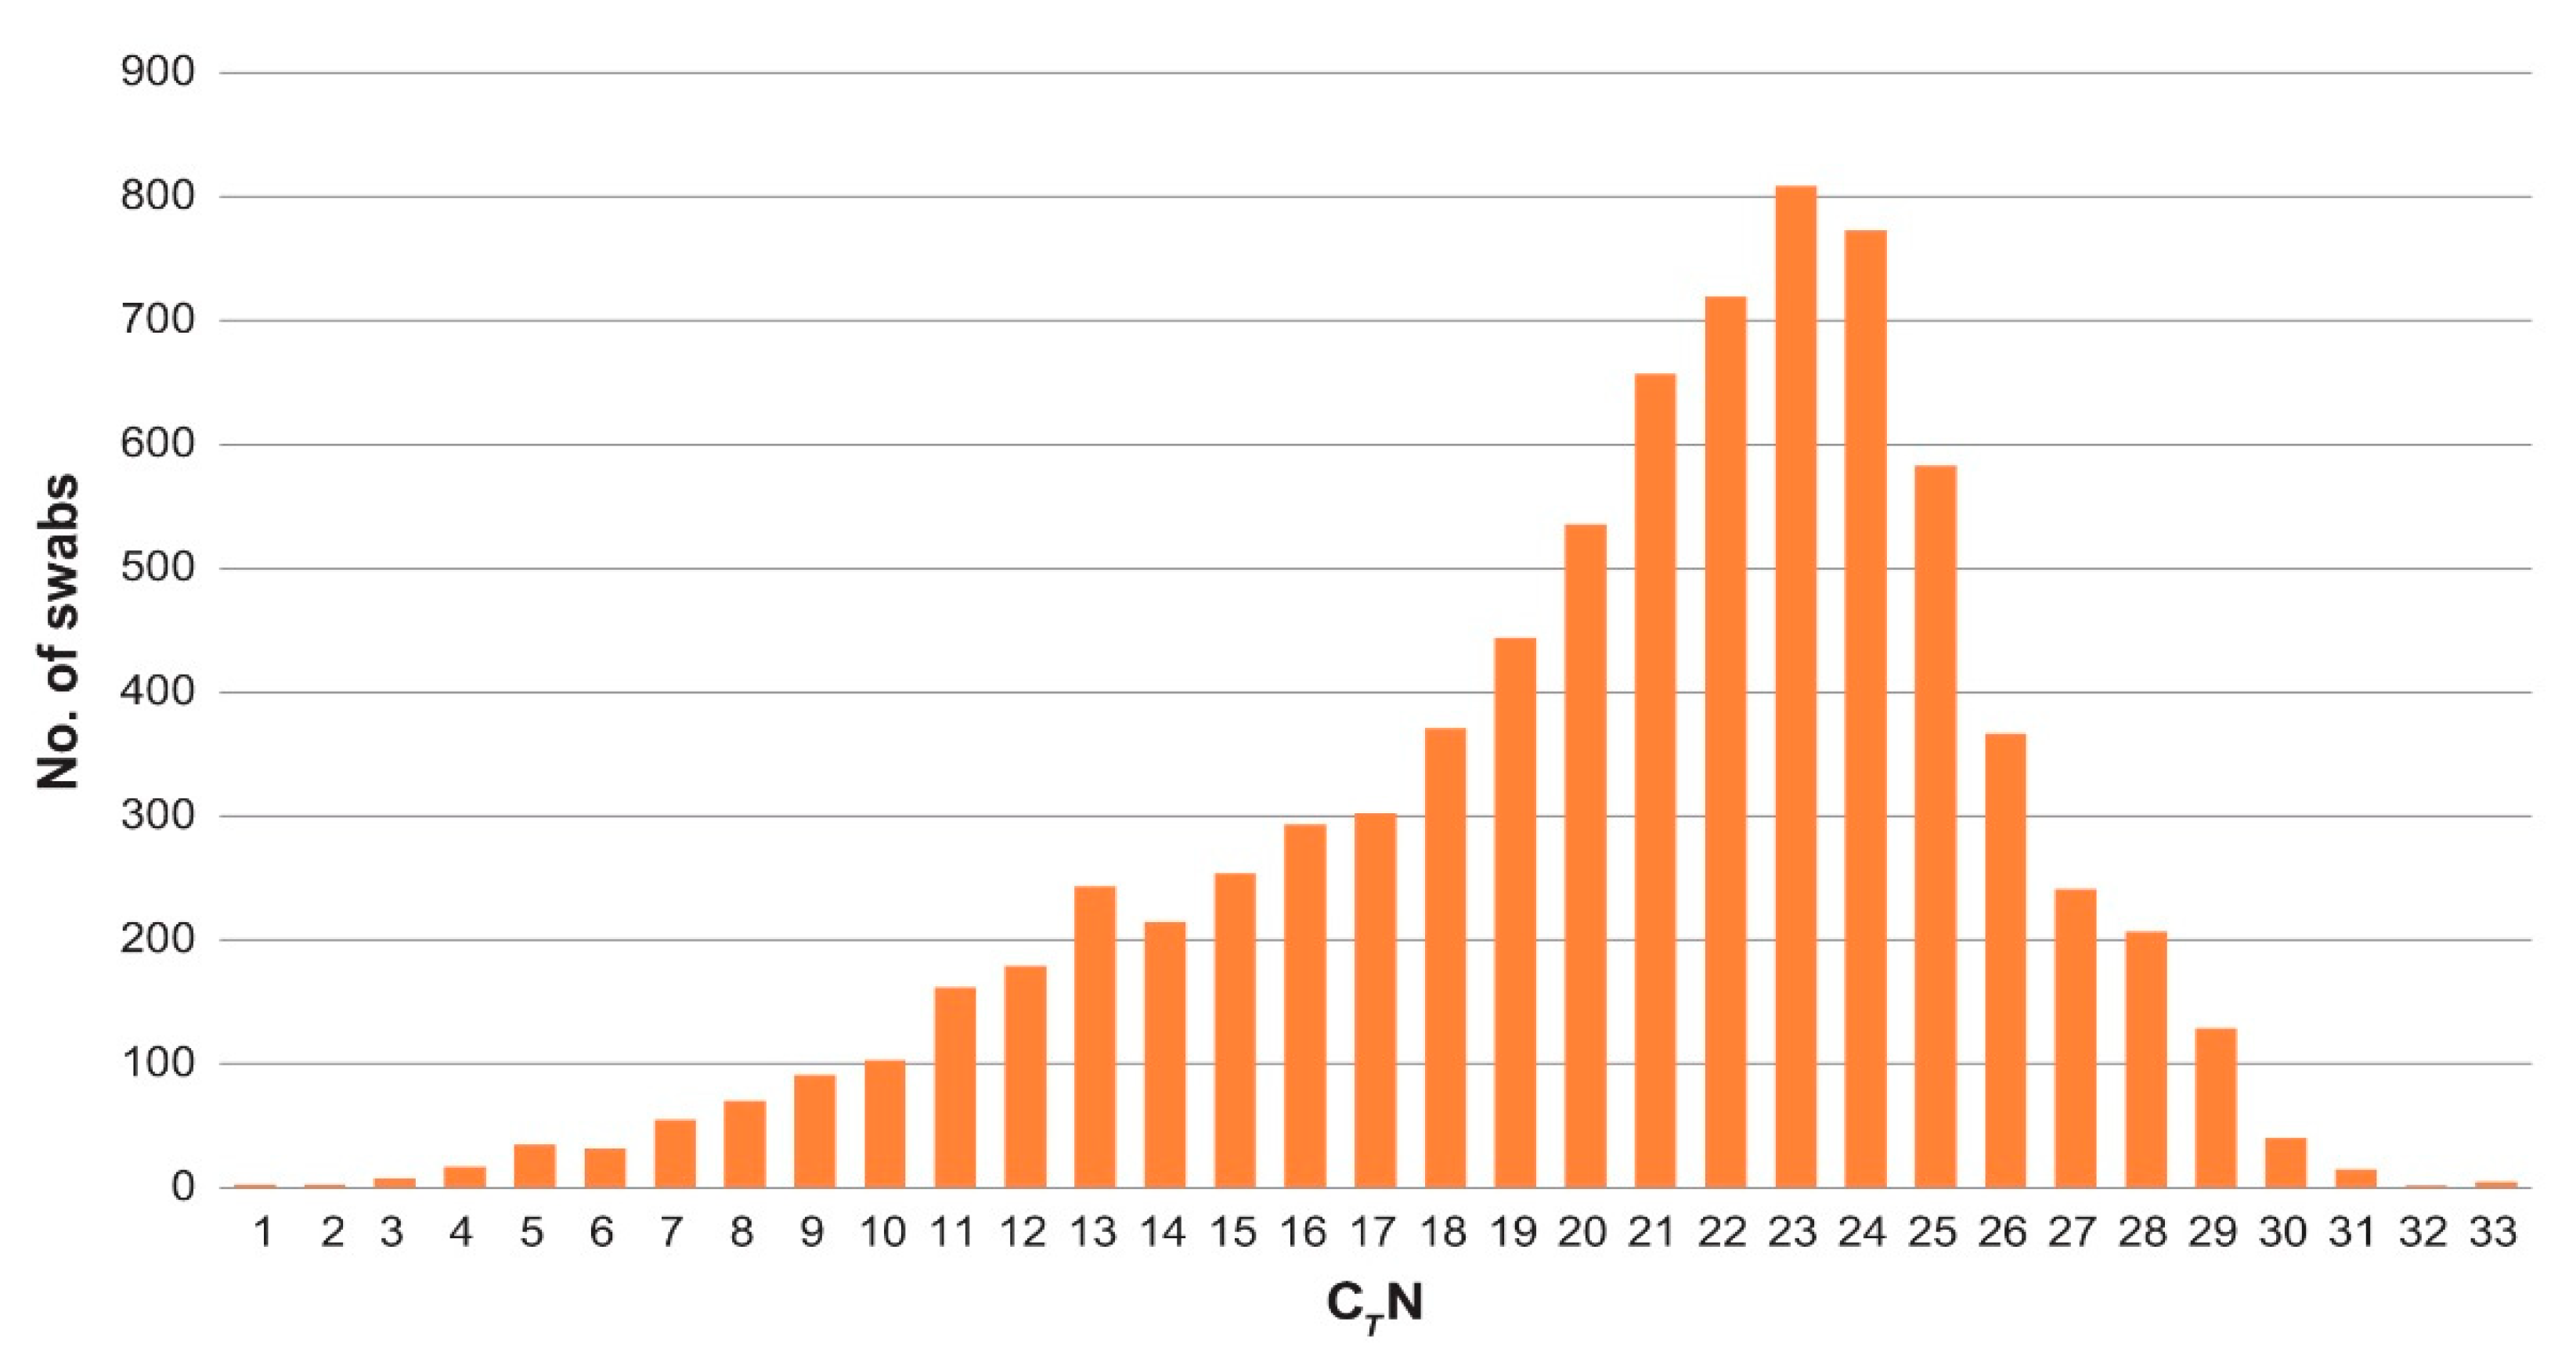
Concerning the C
T N values observed in the 8212 positive NNS, the mean and median values were 27.59 (±0.0983 CI 90%) and 29.00, respectively (
Figure 3).
Furthermore, the C
T N gene median values of the first positive swab for each individual were compared over time. In
Table 2 the C
T N gene values obtained during the months of observations and the number of swabs considered for each month are reported.
A statistically significant difference (two-tailed Mann-Whitney test) was observed among the C
T N gene median values of swabs collected from March to September (
Figure 4). In particular, the C
T N gene median values observed in NNS collected in March 2020 were significantly lower than those collected in April (
p-value < 0.0001), and the latter lower than those collected in May 2020 (
p-value = 0.0033), thus suggesting progressively lower viral RNA loads from March to May 2020. A significant difference was also observed in the pairwise comparisons between September and October 2020 (
p-value < 0.0001) and between November and December (
p-value < 0.0001).
When the median values of C
T N observed in the three main periods (March-April, May-September and October-December) characterising the SARS-CoV-2 epidemic in 2020 were compared with the incidence of COVID-19 cases (
Table 3), a strong inverse correlation (Pearson correlation coefficient = −0.978) was observed.
In turn, no correlation between the CT N values and the age of the infected individuals was observed (Pearson correlation coefficient = −0.094).
4. Discussion
Although RNA loads in swabs can be influenced by several factors including the clinical status of the patients, timing and swabbing procedure, we analyzed the trend of the CT N values in NNS collected from March to mid-December 2020.
In this study, we assumed that albeit not a good predictor of viral load when looking at an individual patient’s test results [
8], C
T values may give an indirect indication of the general viral load in the exposure environment when the population level is considered. This kind of approach has been already and successfully applied in other studies [
9,
10], and C
T values have been used not only as proxies for the amount of virus circulating in the population under study, but also to predict the trajectory of the epidemic [
10]. Although measured by diagnostic molecular method detecting genomic RNA rather than only subgenomic RNAs or virus isolation, analysis of viral load may indeed provide critical data to implement effective control measures and disease modeling [
11].
A pattern with progressive increasing of CT N gene values was observed from March to May, testifying to an overall reduction of viral RNA load in swabs. This pattern was inverted from September to October and then from November to December, with an increase of viral RNA load in swabs. It is also important to point out that this analysis was limited up to 15 December 2020. This was done to avoid the effect of B.1.1.7 lineage (VOC 202012/01) of SARS-CoV-2 firstly identified in mid-December 2020 in the Abruzzo region. Before that period, indeed, circulation of SARS-CoV-2 lineages belonging to variants of concern (e.g., B.1.1.7, P.1, and B.1.351) was not evidenced. Specifically, lineage B.1.177 (also known as Spanish variant) emerged in summer 2020 and quickly became the dominant lineage in this area during fall as a result of opening borders in summer 2020.
The first reduction of viral RNA load was observed from March to May, and it was concurrent with the effect of the general lockdown established all over Italy, with analogous repercussions also in the Teramo province (
Figure 3).
Accordingly, the observed increase of RNA loads in NNS tested from September onward could be linked to the general relaxation of preventive measures during the summer as a result of the cessation of the general lockdown in Italy. This link is confirmed by the strong inverse correlation between + median values and COVID-19 incidence per 100,000 inhabitants, when the three main epidemiological periods, characterized by different rates of COVID-19 incidence, are considered. As highlighted in our previous work [
4], one of the pitfalls of our findings is the lack of anamnestic data for each positive individual. Detailed information for each patient on the clinical status prior and after SARS-CoV-2 infection, disease severity, the date of symptom’s onset would be beneficial to better interpret the dynamic of RNA loads in NNS.
The data originated in this analysis are supported by the evidence that SARS-CoV-2 CT N value trends are not affected by the swabbing procedure as the human H1RNA gene, used as control, was constant across a selected set of SARS-CoV-2 positive samples showing a wide range of viral loads. Moreover, a correlation was evidenced between CT values and infectious virus in vitro, therefore high CT values (>30) are likely predictive of very limited amounts of infectious virus (≤101 TCID50/mL).
In conclusion, our findings strongly confirm the usefulness of using qPCR and related CT values as an indirect mean for monitoring the levels of viral load circulation in the population, although the emergence of new variants of the virus at the end of 2020, apparently more transmissible than the others, is posing new questions that should be addressed in the early future.
Author Contributions
Conceptualization, P.C. and A.L.; methodology, P.C., A.L. and M.L.D.; validation, P.C., M.L.D., L.A., F.C., A.D.G., V.Z., I.P., M.C., S.S. and A.L.; formal analysis, P.C., M.L.D., I.P., M.C. and S.S.; data curation, M.L.D., P.C., A.L.; writing—original draft preparation, P.C., and M.L.D., A.L.; writing—review and editing, M.L.D., P.C., A.L., L.A, F.C., A.D.G., V.Z., I.P., M.C., S.S. and G.S.; visualization, P.C, M.L.D. and A.L.; supervision, P.C.; project administration, G.M., N.D., D.M. and G.S.; funding acquisition, G.M., N.D., D.M. and A.L. All authors have read and agreed to the published version of the manuscript.
Funding
Funding were provided by the Italian Ministry of Health Ricerca Corrente 2020 MSRCTE0520 “PanCO: epidemiologia e patogenesi dei coronavirus umani ed animali” recipient Alessio Lorusso.
Institutional Review Board Statement
Not applicable.
Informed Consent Statement
Not applicable.
Data Availability Statement
Data sharing not applicable.
Conflicts of Interest
The authors declare no conflict of interest.
References
- World Health Organization (WHO). WHO Coronavirus Disease (COVID-19) Dashboard. 2020. Available online: https://covid19.who.int/ (accessed on 16 April 2021).
- Dipartimento della Protezione Civile. COVID-19 Italia—Monitoraggio della Situazione. 2020. Available online: https://gisanddata.maps.arcgis.com/apps/opsdashboard/index.html#/b0c68bce2cce478eaac82fe38d4138b1?width=600&height=600 (accessed on 17 February 2021).
- Lorusso, A.; Calistri, P.; Mercante, M.T.; Monaco, F.; Portanti, O.; Marcacci, M.; Cammà, C.; Rinaldi, A.; Mangone, I.; Di Pasquale, A.; et al. A “One-Health” approach for diagnosis and molecular characterization of SARS-CoV-2 in Italy. One Health 2020, 10, 100135. [Google Scholar] [CrossRef] [PubMed]
- Danzetta, M.L.; Amato, L.; Cito, F.; Di Giuseppe, A.; Morelli, D.; Savini, G.; Mercante, M.T.; Lorusso, A.; Portanti, O.; Puglia, I.; et al. SARS-CoV-2 RNA Persistence in Naso-Pharyngeal Swabs. Microorganisms 2020, 8, 1124. [Google Scholar] [CrossRef] [PubMed]
- Gazzetta Ufficiale della Repubblica Italiana. Decreto del Presidente del Consiglio dei Ministri 9 Marzo 2020. 2020. Available online: https://www.gazzettaufficiale.it/eli/id/2020/03/09/20A01558/sg (accessed on 17 February 2021).
- Lorusso, A.; Calistri, P.; Savini, G.; Morelli, D.; Ambrosij, L.; Migliorati, G.; D’Alterio, N. Novel SARS-CoV-2 variants in Italy: The role of veterinary public health institutes. Viruses 2021, 13, 549. [Google Scholar] [CrossRef] [PubMed]
- Wu, H.Y.; Brian, D.A. Subgenomic messenger RNA amplification in coronaviruses. Proc. Natl. Acad. Sci. USA 2010, 107, 12257–12262. [Google Scholar] [CrossRef] [PubMed] [Green Version]
- Dahdouh, E.; Lázaro-Perona, F.; Romero-Gómez, M.P.; Mingorance, J.; García-Rodriguez, J. Ct values from SARS-CoV-2 diagnostic PCR assays should not be used as direct estimates of viral load. J. Infect. 2021, 82, 414–451. [Google Scholar] [CrossRef] [PubMed]
- Veronesi, L.; Colucci, M.E.; Pasquarella, C.; Caruso, L.; Mohieldin Mahgoub Ibrahim, M.; Zoni, R.; Pergreffi, M.; Arcuri, C.; Seidenari, C.; Viani, I.; et al. Virological surveillance of SARS-CoV-2 in an Italian northern area: Comparison of Real Time RT PCR cycle threshold (CT) values in three epidemic periods. Acta Bio-Med. Atenei Parm. 2020, 91, 19–21. [Google Scholar]
- Hay, J.A.; Kennedy-Shaffer, L.; Kanjilal, S.; Lennon, N.J.; Gabriel, S.B.; Lipsitch, M.; Mina, M.J. Estimating epidemiologic dynamics from cross-sectional viral load distributions. Science 2021. [Google Scholar] [CrossRef] [PubMed]
- Cevik, M.; Tate, M.; Lloyd, O.; Maraolo, A.E.; Schafers, J.; Ho, A. SARS-CoV-2, SARS-CoV, and MERS-CoV viral load dynamics, duration of viral shedding, and infectiousness: A systematic review and meta-analysis. Lancet Microbe 2020, 2, e13–e22. [Google Scholar] [CrossRef]
| Publisher’s Note: MDPI stays neutral with regard to jurisdictional claims in published maps and institutional affiliations. |
© 2021 by the authors. Licensee MDPI, Basel, Switzerland. This article is an open access article distributed under the terms and conditions of the Creative Commons Attribution (CC BY) license (https://creativecommons.org/licenses/by/4.0/).


 ,
, 


