
Feature selection by machine learning models to identify the public’s changing priorities during the COVID-19 pandemic
Abstract
People around the world have experienced fundamental transformations during mass events. The Industrial Revolution, World War II, and the collapse of the Berlin Wall are some of the cases that have caused radical societal changes. COVID-19 has also been a process of mass experiences regarding society. Determining the mass impact the pandemic has had on society shows that the pandemic is facilitating the transition to the so-called new normal. Istanbul is a multi-identity city where 16 million people have intensely experienced the pandemic’s impact. While determining the identities of cities in the world, one can see that different city structures provide different data sets. This study models a machine learning algorithm suitable for the data set we’ve determined for the 39 different districts of Istanbul and 82 different features of Istanbul. The aim of the study is to indicate the changing societal trends during the COVID-19 pandemic using machine learning techniques. Thus, this work contributes to the literature and real life in terms of redesigning cities for the post-COVID19 period. Another contribution of this study is that the proposed methodology provides clues on what people in cities consider important during a pandemic.
1.Introduction
All smart city practices aim to increase human welfare; however, public expectations differ from country to country regarding the conditions for smart city practices. All geographic locations require different amounts of clean water to supply; for instance, the need for clean water in African cities is not the same as in European cities because there are many sources of clean water in the European region. Accordingly, people around the world have experienced the COVID-19 pandemic differently, while some regions have experienced the same difficulties [44]. The measures and restrictions implemented worldwide have been diverse. Thus, the extent of closures, vaccination rates, and number of positive cases differ from country to country. Managing the pandemic has been difficult, especially in city centers with dense populations. These different experiences have led to different behavioral changes for the citizens of each city. Many studies have used multi-criteria decision-making approaches and expert opinions to detect these trends [6,9,13]. Recent developments in metropolitan cities require nimble city services, infrastructure, and communication networks using harmonic management at the metropolitan level [6]. Modern cities are complex systems with their inhabitants, businesses, various modes of transport, huge communication networks, utilities, and public services [29]. For a metropolis, challenges arise from increases in the urban population and involve traffic density, air pollution, waste management challenges, and inadequate infrastructural quality [40]. Managing a complex city entails providing social inequality, human health, social balance, and social management in the region [21]. Considering all these dynamics, governments should manage complex cities innovatively [5].
Due to emerging conditions such as COVID-19 not having been previously experienced by experts, the literature has a great gap on how to manage complex cities post-pandemic. Therefore, this paper aims to use machine learning techniques by considering this gap in the literature to quickly determine people’s behaviors and tendencies. Moreover, the priorities and choices of the people living in Istanbul’s districts have profoundly changed throughout COVID-19. These changes allow Istanbulites’ needs to be determined for smart city applications. This paper proposes a model that shows the effects COVID-19 has had on public life over one specific metropolis. In addition, the proposed model helps administrators quickly respond to the dynamic changes occurring in cities. Moreover, this paper tries to determine urban livability levels with respect to necessary conditions.
In this study, some machine learning algorithms (LR, BRR, RFR, XGB) are preferred because other Neural Network technic such as Recurrent Neural Network (RNN), Long Short Term Memory networks (LSTM), focus group, survey, etc. approaches have limitations. For instance, since neural network learning systems work in a closed network system it is difficult to interpret the significance of features. In LR, BRR, RFR and XGB models, feature interpretation is relatively easy. In survey studies, to interpret meaningful outcomes pre and post disaster surveys are needed, which is not possible because such disasters, i.e. COVID19, are not predicted. There is a similar problem within the focus group method. A survey or focus group study would be a nice study to do with the same population before and during the pandemic and include the same questions to ensure good research. However, in this study, machine learning is used to detect a mass trend. Another reason is that the scope of the study is limited, as such methods are generally applied to a small segment of the population. Oppositely, in this study, secondary data is used. Secondary data, i.e. governmental data which covers almost all or a very high percentage of the society, brings higher reliability to the system. By this study, it can be seen that Istanbul has an unusual feature compared to other European cities. Considering the isolated life in the pandemic, the city is not only a region where about 16 million people share their lives, but also the only region in Europe with a high density due to its geographical structure. To compare multiple cities, the same features must be collected from both cities and for pre- and post-pandemic. Thus, collecting data is a difficult even though the method is very economical and fast.
The variables; education, economy, health, work, social life, environment, and infrastructure influence society’s housing preferences. Proximity to work, proximity to social life, proximity to transportation, and proximity to educational opportunities all play important roles in people’s location choices [46]. As a result, rental and purchase prices may be higher in city centers than in other regions.
(H1) The habitat choice of people who experienced the pandemic in a crowded city has changed.
This study seeks for the answer of “how the preferences of people living in a metropolitan and experiencing a pandemic is changed”. Specifically, it aims to determine the changes in society that experienced a worldwide pandemic. For this purpose a machine learning based approach is developed. The approach is able to show the reflection of residents of a metropolitan to pandemic such as COVID-19. To the best of our knowledge, there is no such study that searches the abovementioned research question comprehensively. The rest of the paper is organized as follows: Section 2 presents the relevant literature review. Section 3 shows the method used in the study. In Section 4 a real case application is conducted and assessed. Section 5 interprets the results of the evaluations. Section 6 compares the results of the study to similar ones in the recent literature.
2.Literature review
The increasing demand for urban living has caused cities’ populations to increase. Thus, cities’ limited resources cause problems for the people living in these cities such as China’s major cities [24]. Sustainable solutions to these problems are indispensable for smart cities, being living spaces whose citizens have the highest quality of life and economic prosperity [48]. The concept of smart cities is based on sustainability principles and are intended to continue well into the future. In this case, new city services create a new way of doing business by integrating with information technologies. A smart city provides its residents with safe, sophisticated, and environmentally friendly services [35]. The smart city is an ultramodern urban space that meets the needs of businesses, institutions, and citizens in particular [20]. Moreover, smart cities must identify city residents’ dynamically changing needs and respond to changing conditions.
Using multi-criteria decision-making, Onnom et al.’s study classified urban people’s expectations under nine different categories: environment, recreation, safety, health, economy, transportation, public utility, population density, and education [30]. Each category has different priorities within people’s life choices. Serious threats and changes have also occurred in people’s lives as a result of COVID-19 [18]. Smart cities with better characteristics will create opportunities to increase the city’s resilience against events such as pandemics [36].
A smart city equipped with sensors generates large data sets. Machine learning and artificial intelligence techniques have provided successful results from these datasets [10]. The big data produced by smart cities has a variety of different sizes and types. Therefore, smart solutions are required for uniformizing data [37]. Deep learning applications have provided early answers to the dynamic structures of cities [27].
Many parameters involved in machine learning must be optimized to produce a suitable model over complex datasets. Models resulting in higher reliability are produced using optimal parameters [14]. A relationship is created between these parameters using approaches such as randomness and complex searches among the parameters, after which different performance outputs are evaluated for each parameter in the model. Error values such as explained variance (EV), maximum error (ME), negative mean absolute error (NMAE), and root mean squared error (RMSE) require minimization when working on a regression datum. In addition, the magnitude of the absolute value of the R-squared score is also an important measurement parameter [4]. The scikit-learn library provides reliable results from metric measurements for determining the relationship between outputs and inputs [12]. The ideal model should first be selected for the existing dataset, then the ideal parameters should be determined. Four different models are used in our study. These models are frequently used in hyperparameter applications. Linear regression model have been used by Zheng and friends to determine high performance parameters for cyber-enabled [47]. Sun and friends have made the best estimation in their study by comparing Bayes Ridge Linear and Random Forest Regression to determine the parameters that cause landslides [39]. AlThuwaynee and friends used Extreme Gradient Boosting (XGB) Regressor and RFR models together in their index study [1]. In another study, Yuchi et al. found successful results for selecting features using the Random Forest Regressor (RFR), a machine learning tool [45]. Our study uses four different machine learning techniques to statistically estimate Istanbulites’ changing priorities according to their performances prior to and during COVID-19. These four models are chosen both to give successful results for indexing studies in the literature and to compare these models in our study.
This study will enable smart cities application to identify needs of a city and make quick decisions for city managers in times of crisis such as COVID-19. The absence of a similar study for the COVID-19 period in the literature until this period led us to conduct this study. The proposed framework does not provide meaningful results only for COVID-19 but also for other disasters such as global warming, earthquake, flood, cyber attack, drought etc.[19,38]. The same logic may be applied to parameter measuring before and during a disease and the changes in these parameters with high accuracy. Further, the effects of these changes on human body can be predicted successfully [33]. One of this study’s innovative aspects is to show such effects on society. The community managers to redesign more sustainable and robust cities can easily use the proposed approach
3.Problem statement and methodology
This study uses and compares four different forecasting models based on their performance values.
3.1.Linear regression (LR)
The linear regression equation is provided in Equation (1). In the equation,
3.2.Bayesian ridge regression (BRR)
Bayesian Ridge Regression is also used in hyperparameter studies and is shown in Equation (2). Using the a and λ parameters together in this equation maximizes the log marginal likelihood value according to the gamma distribution. While
Where n_iter is the maximum number of iterations and should be greater than or equal to 1. The tol is the stopping criterion; the algorithm stops when the value tol has converged.
3.3.Random forest regressor (RFR):
The RFR algorithm is a multi-combination of classification and regression trees (CART) algorithms and provides good results for both classification and regression models [16]. The algorithm creates the regression estimation by averaging the results from each decision tree (CART) in the classification. The randomness in the RFR algorithm ensures that the data sets assigned to each decision trees are random and the set of features the decision trees determine are assigned differently. This randomness reduces both error variance and error values in the model. Figure 1 shows the k trees assigned for k-bootstrap and the different predictions produced for different feature sets in each tree. CART makes each decision by assigning a feature to the point of separation of the branches of the trees in the k-tree. The accuracy of the decisions is evaluated using the training output. The decrease in error values ensures that the correct decision was made.
![Random forest regression flowchart (adapted from [32]).](https://content.iospress.com:443/media/ais/2022/14-5/ais-14-5-ais220200/ais-14-ais220200-g001.jpg)
3.4.Extreme gradient boosting (XGB) regressor
XGB is a machine learning application modeled by Chen and Guestrin [8]. XGB gives successful results in regression and classification applications. XGB is based on the CART algorithm timeline as with RFR.
η is the shrinkage parameter (i.e., learning rate)
Step 1: A dataset is created over a vast range of information categories regarding the region such as economy, education, health, society, utility, security, and population.
Step 2: The generated data set have differences in terms of units. Therefore, absolute maxima normalization is performed.
Step 3: Intercorrelations are determined for all the features in the dataset. One of the two features with a relationship size greater than 0.8 is left out of the data set. This approach will both reduce the error value in the regression analysis and increase the performance values that are important for the model. In addition, finding only one feature among the high correlation pairs in the feature weight ranking the model produces will facilitate the interpretation of the results. If this elimination does not occur, these highly correlated features can be constantly replaced in different runs, thus making interpreting the results difficult.
Step 4: The normalized data set is randomly separated as 30% test data and 70% training data. This randomness will increase model performance. The output column is separated for both test and training data. This study uses two output columns for each dataset (i.e., train and test) as two different cases will be analyzed.
Step 5: Performance values such as
Step 6: After determining the high-performance model, the feature weights and ranking that the model results from two different outputs (i.e.,
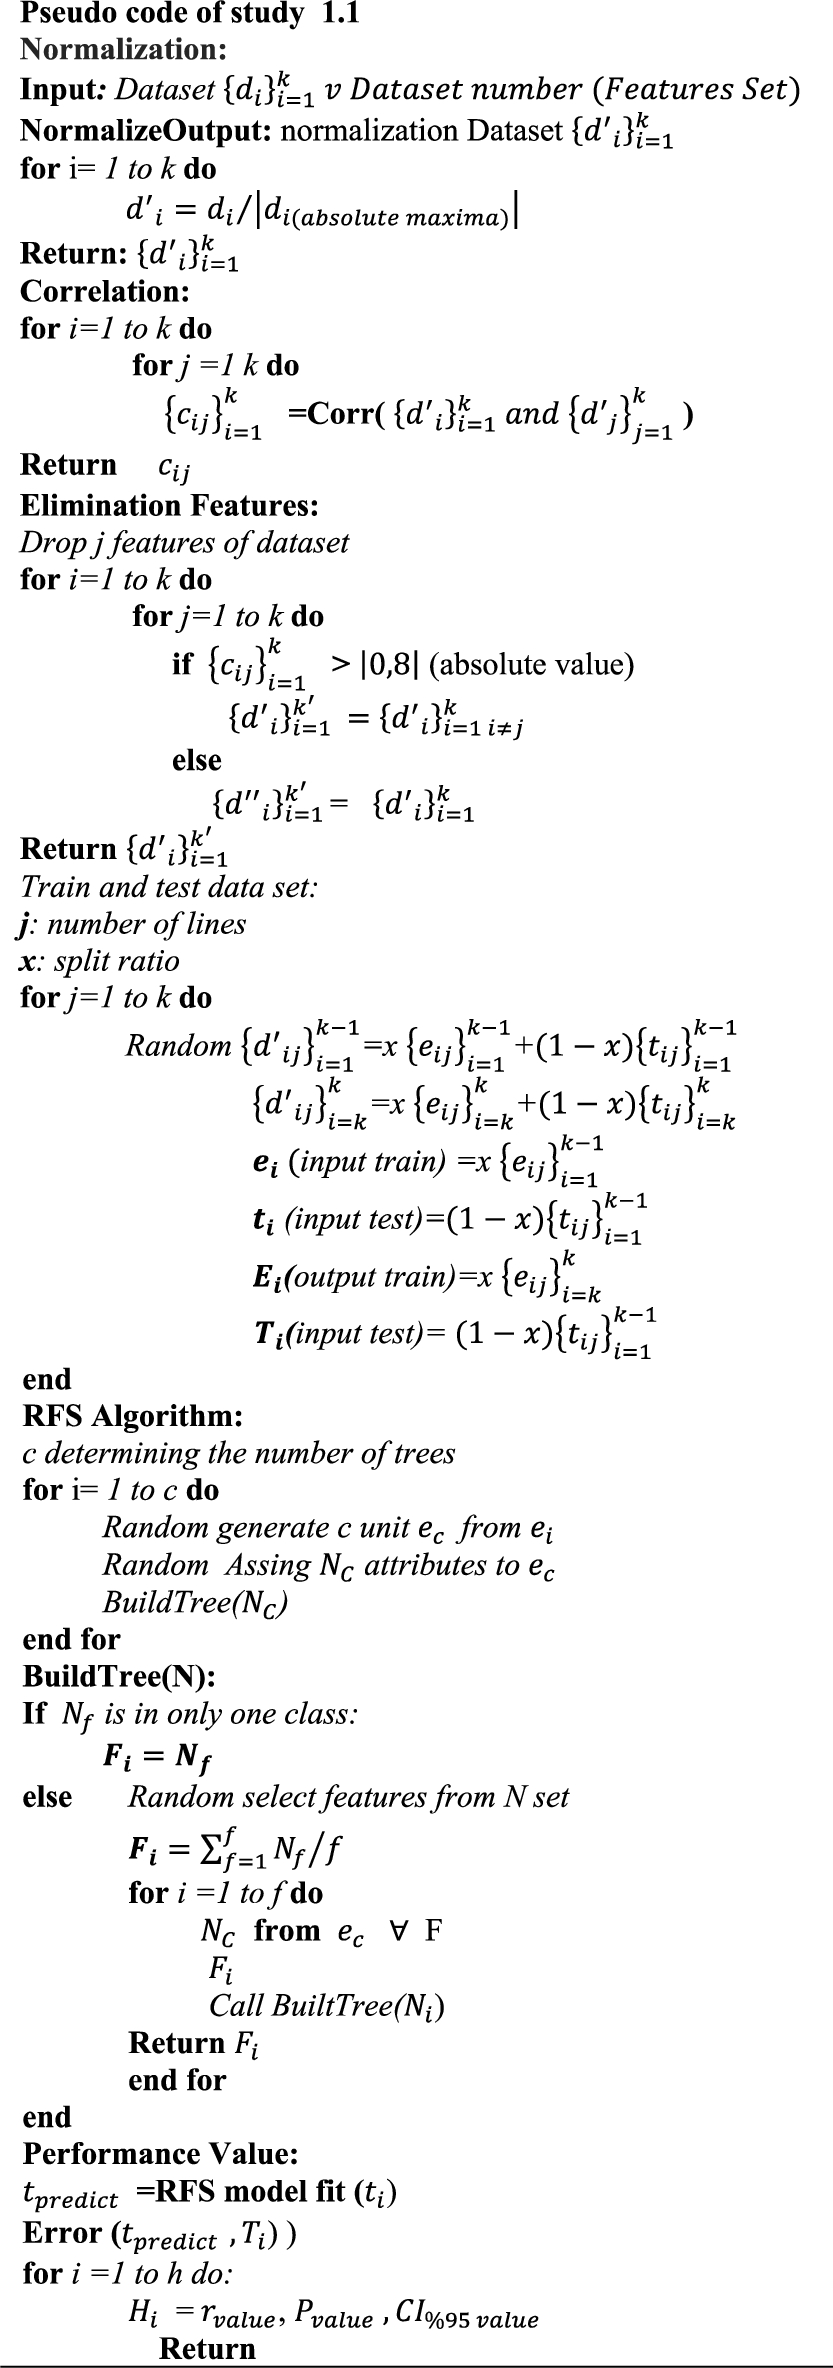
Figure 2 provides the pseudocode where the study uses RFR. The code has been used for other algorithms by replacing only the RFS portion of the algorithm.
Fig. 2.
The RFR model’s pseudocode.
Another important step in the study is to determine which input features are the most affecting features on the output features. The focus of this study is not only on building a robust model, but also detecting changes at different points in time.
3.5.SHAP
SHAP (Shapley Additive Explanations) is a method proposed by Lundberg and Lee to evaluate the effects of features on how they affect the outcomes [25]. Thus, SHAP provides an interpretation of the features in the training modes of complex learning methods. Moreover, the values of SHAP assign predictive importance (
3.5.1.Data acquisition
Istanbul was chosen for the study because its cosmopolitan structure provides more realistic results during the data analysis stage. The organic ties (hometown) of the people in other districts in Turkey are thought to mostly involve subjectivity in their life choices. Istanbul meets the concept of urbanity in terms of both immigrant and citizen diversity. In our study, we created the dataset under nine main categories: economy, health, transportation, security, population, education, utility, environment and value output. The first case in Turkey was detected in March 2020, and pandemic control measures began at that time.
Economy A data set on economy was created using OpenStreetMap (https://www.openstreetmap.org) for the numbers of banks, ATMs, markets, minimarkets, supermarkets, hotels, shops, industrial sites, bars, nightclubs, and cafes in Istanbul’s districts. The data have been disaggregated in terms of district. The program Mapinfo Pro GIS (https://www.basarsoft.com.tr) was used for this process. Data from the Mahallem İstanbul Projesi [My Neighborhood Istanbul Project] (2016) made for the European Union was used for the local demand data.
Health The data on the number of health centers, the number of public and private hospitals, and the number of patient beds in each district in Istanbul in 2021 were taken from the Ministry of Health website (https://www.saglik.gov.tr). The number of doctors and examinations per districts was taken from the Mahallem İstanbul Projesi (2016). Different features have been derived bases on certain features using the information from the district populations [26].
Transportation The data on the Metro (subway), Metrobus, ferry transportation lines, ferry voyages, metro passengers, and journey numbers within the boundaries of the district were taken from the data web page (https://data.ibb.gov.tr) of the Istanbul Metropolitan Municipality (IMM). The number of active vehicles on the roads in the districts and the monthly average vehicle speed have been derived from GPS data of roadside cameras. The number of parking lots in each district was taken from the OpenStreetMap data.
Environment The OpenStreetMap and Ministry of Environment and Forestry (https://cbs.csb.gov.tr) data were used for the number of parks, district areas, and total number of housing, museum galleries, sports facilities, and theaters. The data have been disaggregated as per capita green space and per capita park. The main reason for this distinction is the different uses citizens have for green spaces and park features. IMM data were used for the amount of garbage collected from streets per district.
Population District population data for each district were collected for the 0–14, 14–65, and 65+ age groups. Gender ratios and population counts were formed from the data obtained from the Population Directorate (https://nv.gov.tr/istanbul). The study additionally uses two different attributes: Syrian immigrants per district and “Non-Syrian might” immigrants per district.
Education The number of schools, classes, students, and teachers was derived using data from the Istanbul National Education Directorate (https://istanbul.meb.gov.tr). University and campus numbers were obtained from the Council of Higher Education website (https://www.yok.gov.tr). By using all these together, data for the number of teachers, classrooms, and faculties per student were derived.
Security The data on fire stations, police stations, and emergency aid centers per district were used as the study’s safety data.
Utility IMM’s number of wireless Internet points per district form the data set for this category.
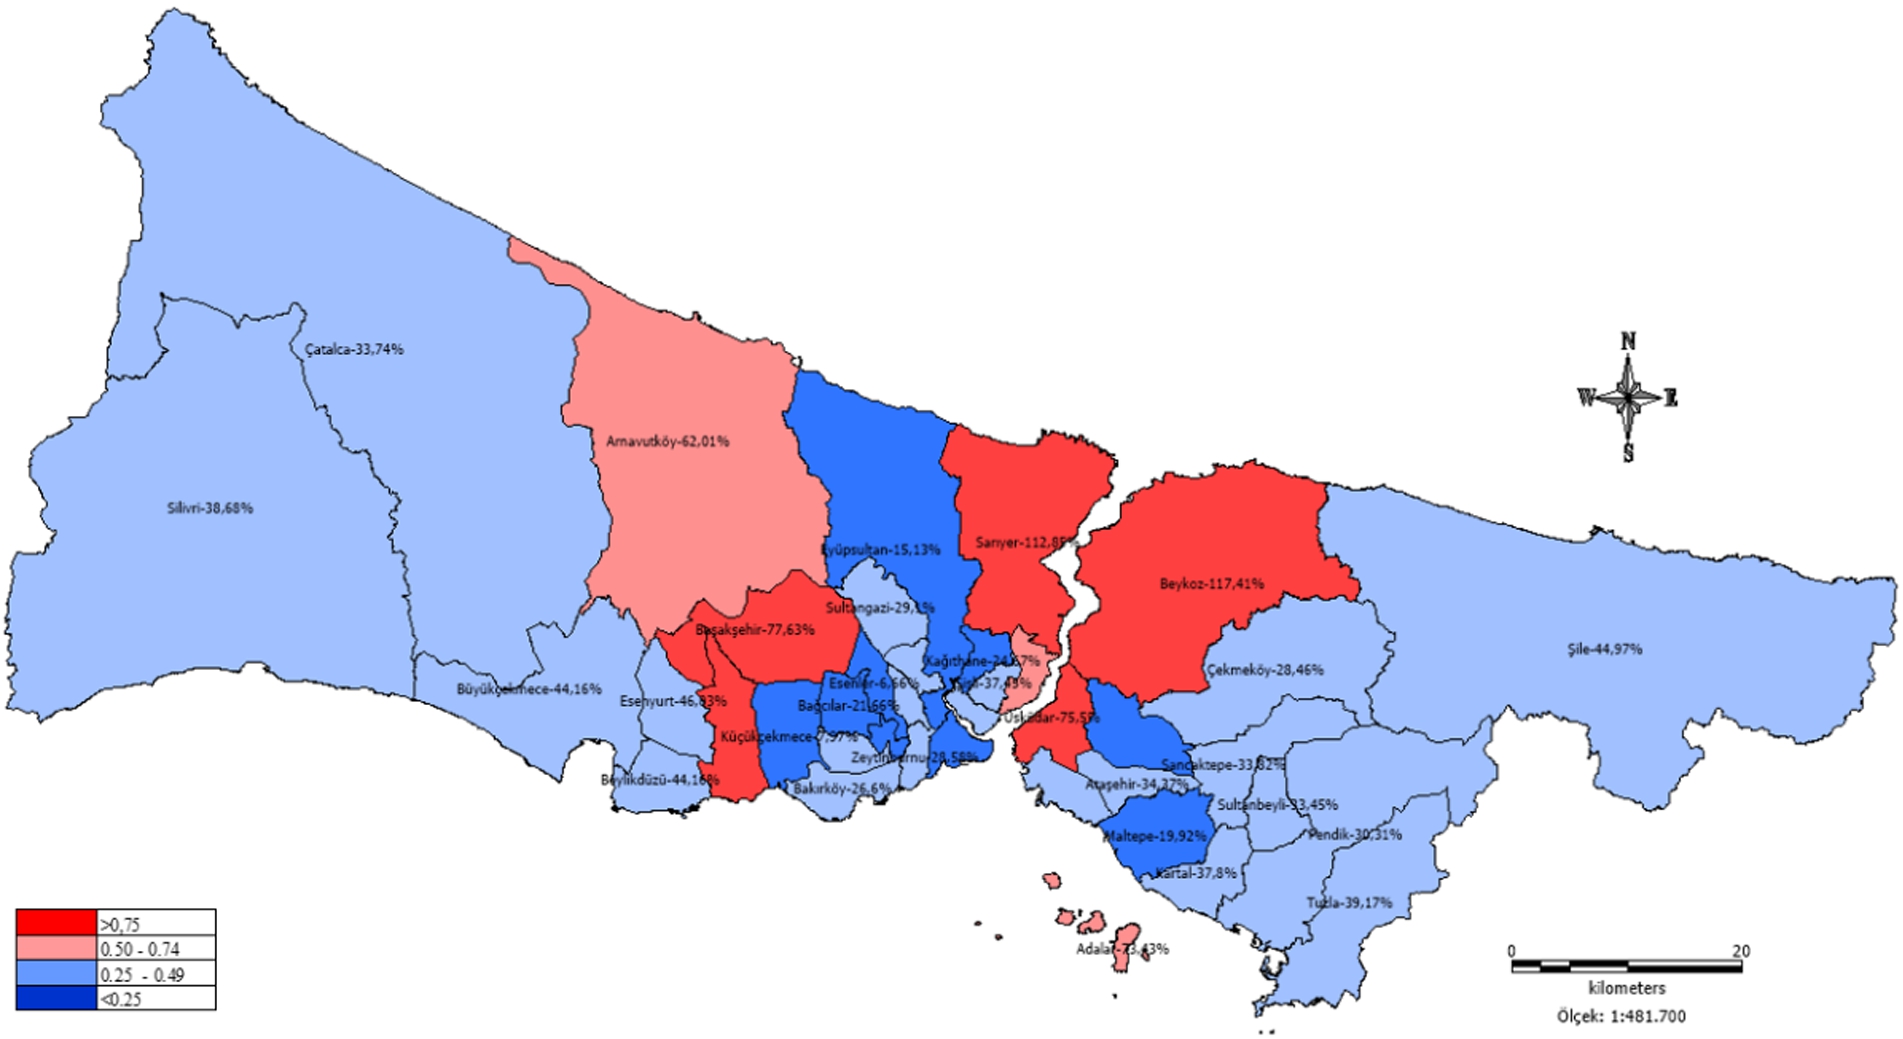
Value output The first case in Türkiye was detected in March 2020, and pandemic control measures began at that time. The real estate company Endeksa (https://www.endeksa.com/tr) offers annual residence costs per square meter per district in Istanbul. The study considers real estate costs from January 2020 and January 2021 to be important in terms of showing the effects from COVID-19. While 2020 housing costs reflect pre-COVID-19 habits, 2021 housing costs formed from the preferences of citizens who’ve experienced COVID-19. Figure 3 shows how real estate costs have changed throughout COVID-19 in Istanbul.
Fig. 3.
Increasing rate of real estate costs per square meter in Istanbul during COVID-19 according to Endeksa/2021.
4.Evaluating the model
Intercorrelations shown in Fig. 4 have been created for 82 different features of the 39 districts of Istanbul. The size and direction of the relationship between features are shown in different colors, with red areas representing a positive relationship while blue represents a negative relationship between features. A positive relationship exists when the value of one variable increase while the value of the other variables increases. A negative relationship exists when the value of one variable increase while the value of the other variable decreases.
Fig. 4.
Correlation chart between features.
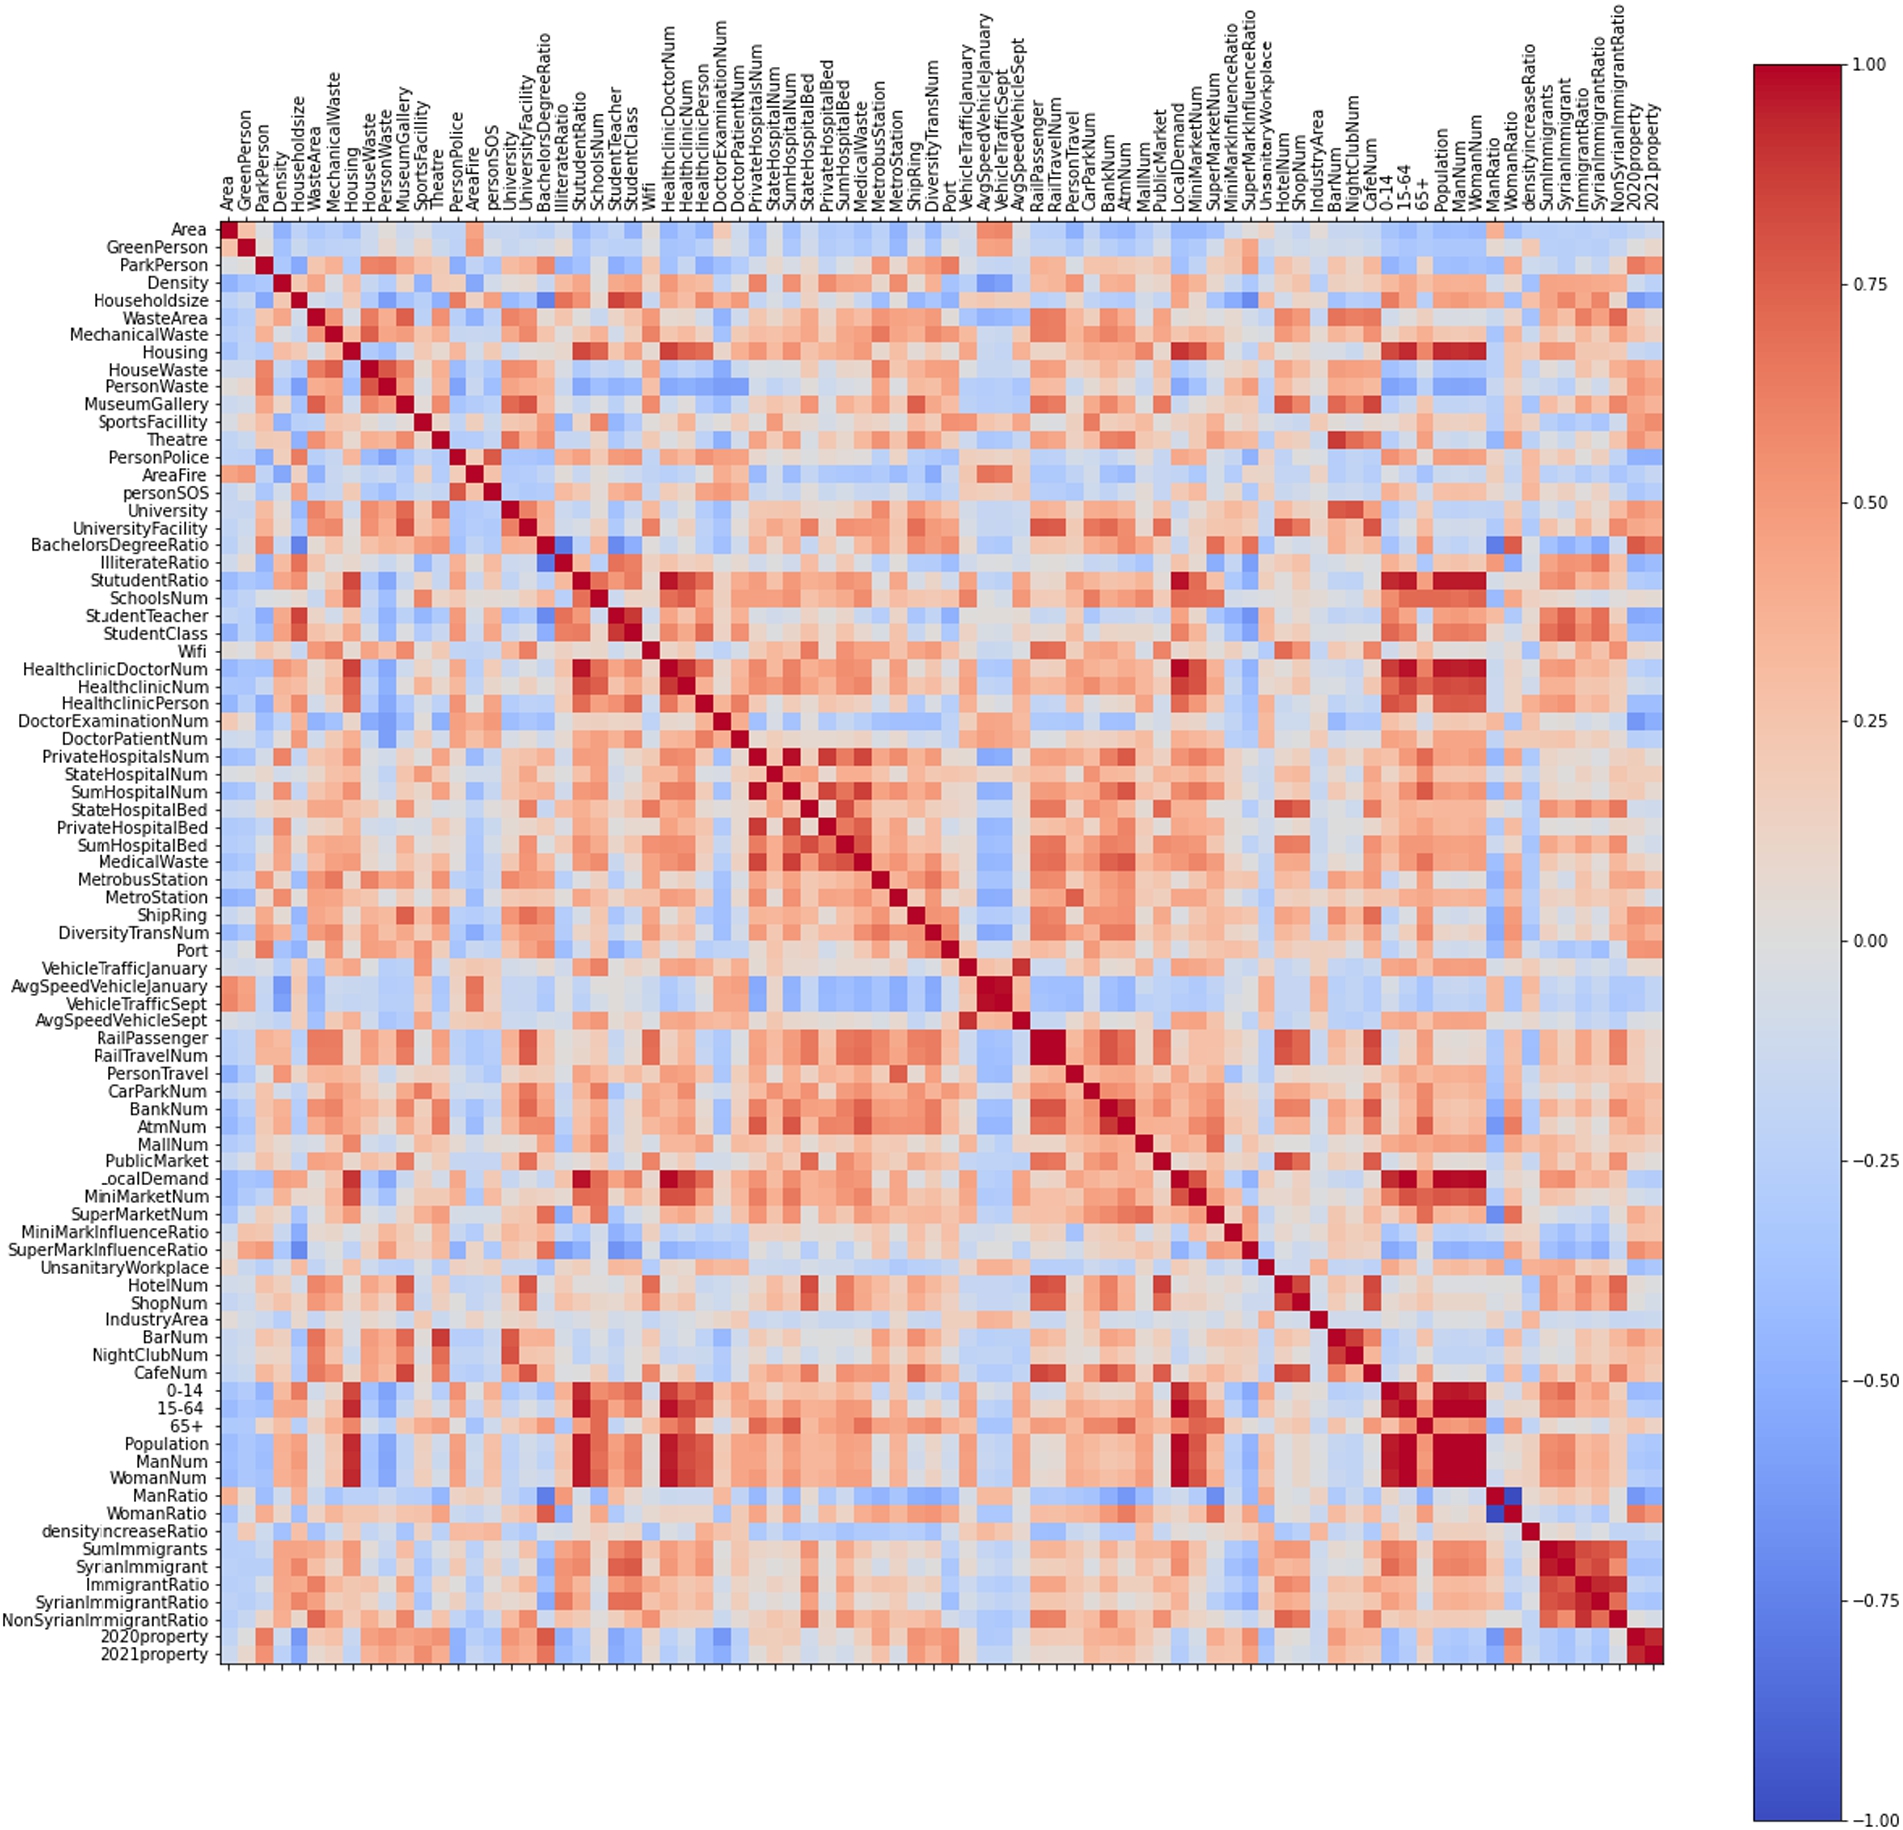
The study has selected which machine learning techniques to use by taking into consideration the types of continuous data being used. For inter correlations greater than 0.8 or less than −0.8, one data type is excluded from the data set to increase the prediction performance of the LR, BRR, RFR, and XGB models. The means and standard deviations of the results of the RFR and XGB models are shown in Table 1, where each model is run for 10 times. According to the ratios in Table 1, the rate of 0.8 is preferred because it resulted in a lower standard deviation on average. In addition, the results are interpreted by excluding highly correlated features from the data set. This approach increases the reliability of the results and validates the model by reducing the error value. The number of features in the dataset has been decreased to 52 using this arrangement. For example, a strong positive relationship between male and female ratios were detected, and thus the model excluded the features indicating the male ratio from the data set. The results are then interpreted accordingly. Housing costs per square meter in Istanbul have been divided into two outputs: pre-COVID-19 and during COVID-19. Thus, our dataset became a new dataset with 50 inputs and two different outputs. These four different models were run for 20 times in Python (a programing language) using the scikit-learn library and the highest performance values were gathered. Table 2 gives these performance values and the features rankings determined by each model for the two cases.
The dataset is divided into two groups (i.e., 30% test and 70% training data), with performance values being measured for both groups. The reason why the data is divided into 30% and 70% as test and train data is that the standard square values of the
RFR and XGB are seen to provide successful results in terms of all performance measures. RFR gave an
Table 1
Performances of models used in determining features reduction ratio
| Ratio | Features | Pre-COVID-19 | COVID-19 | ||
| Performance mean | Standard dev. | Performance mean | Standard dev. | ||
| 1 | 80 | 0.83817 | 0.01327 | 0.76333 | 0.04031 |
| 0.95 | 69 | 0.82167 | 0.02267 | 0.76857 | 0.02997 |
| 0.9 | 66 | 0.85600 | 0.02200 | 0.81667 | 0.04110 |
| 0.85 | 58 | 0.86818 | 0.01192 | 0.80875 | 0.04422 |
| 0.8 | 50 | 0.86600 | 0.01578 | 0.84333 | 0.01225 |
| 0.75 | 42 | 0.82273 | 0.03409 | 0.80400 | 0.01838 |
Table 2
Performances of models used in determining features’ weights
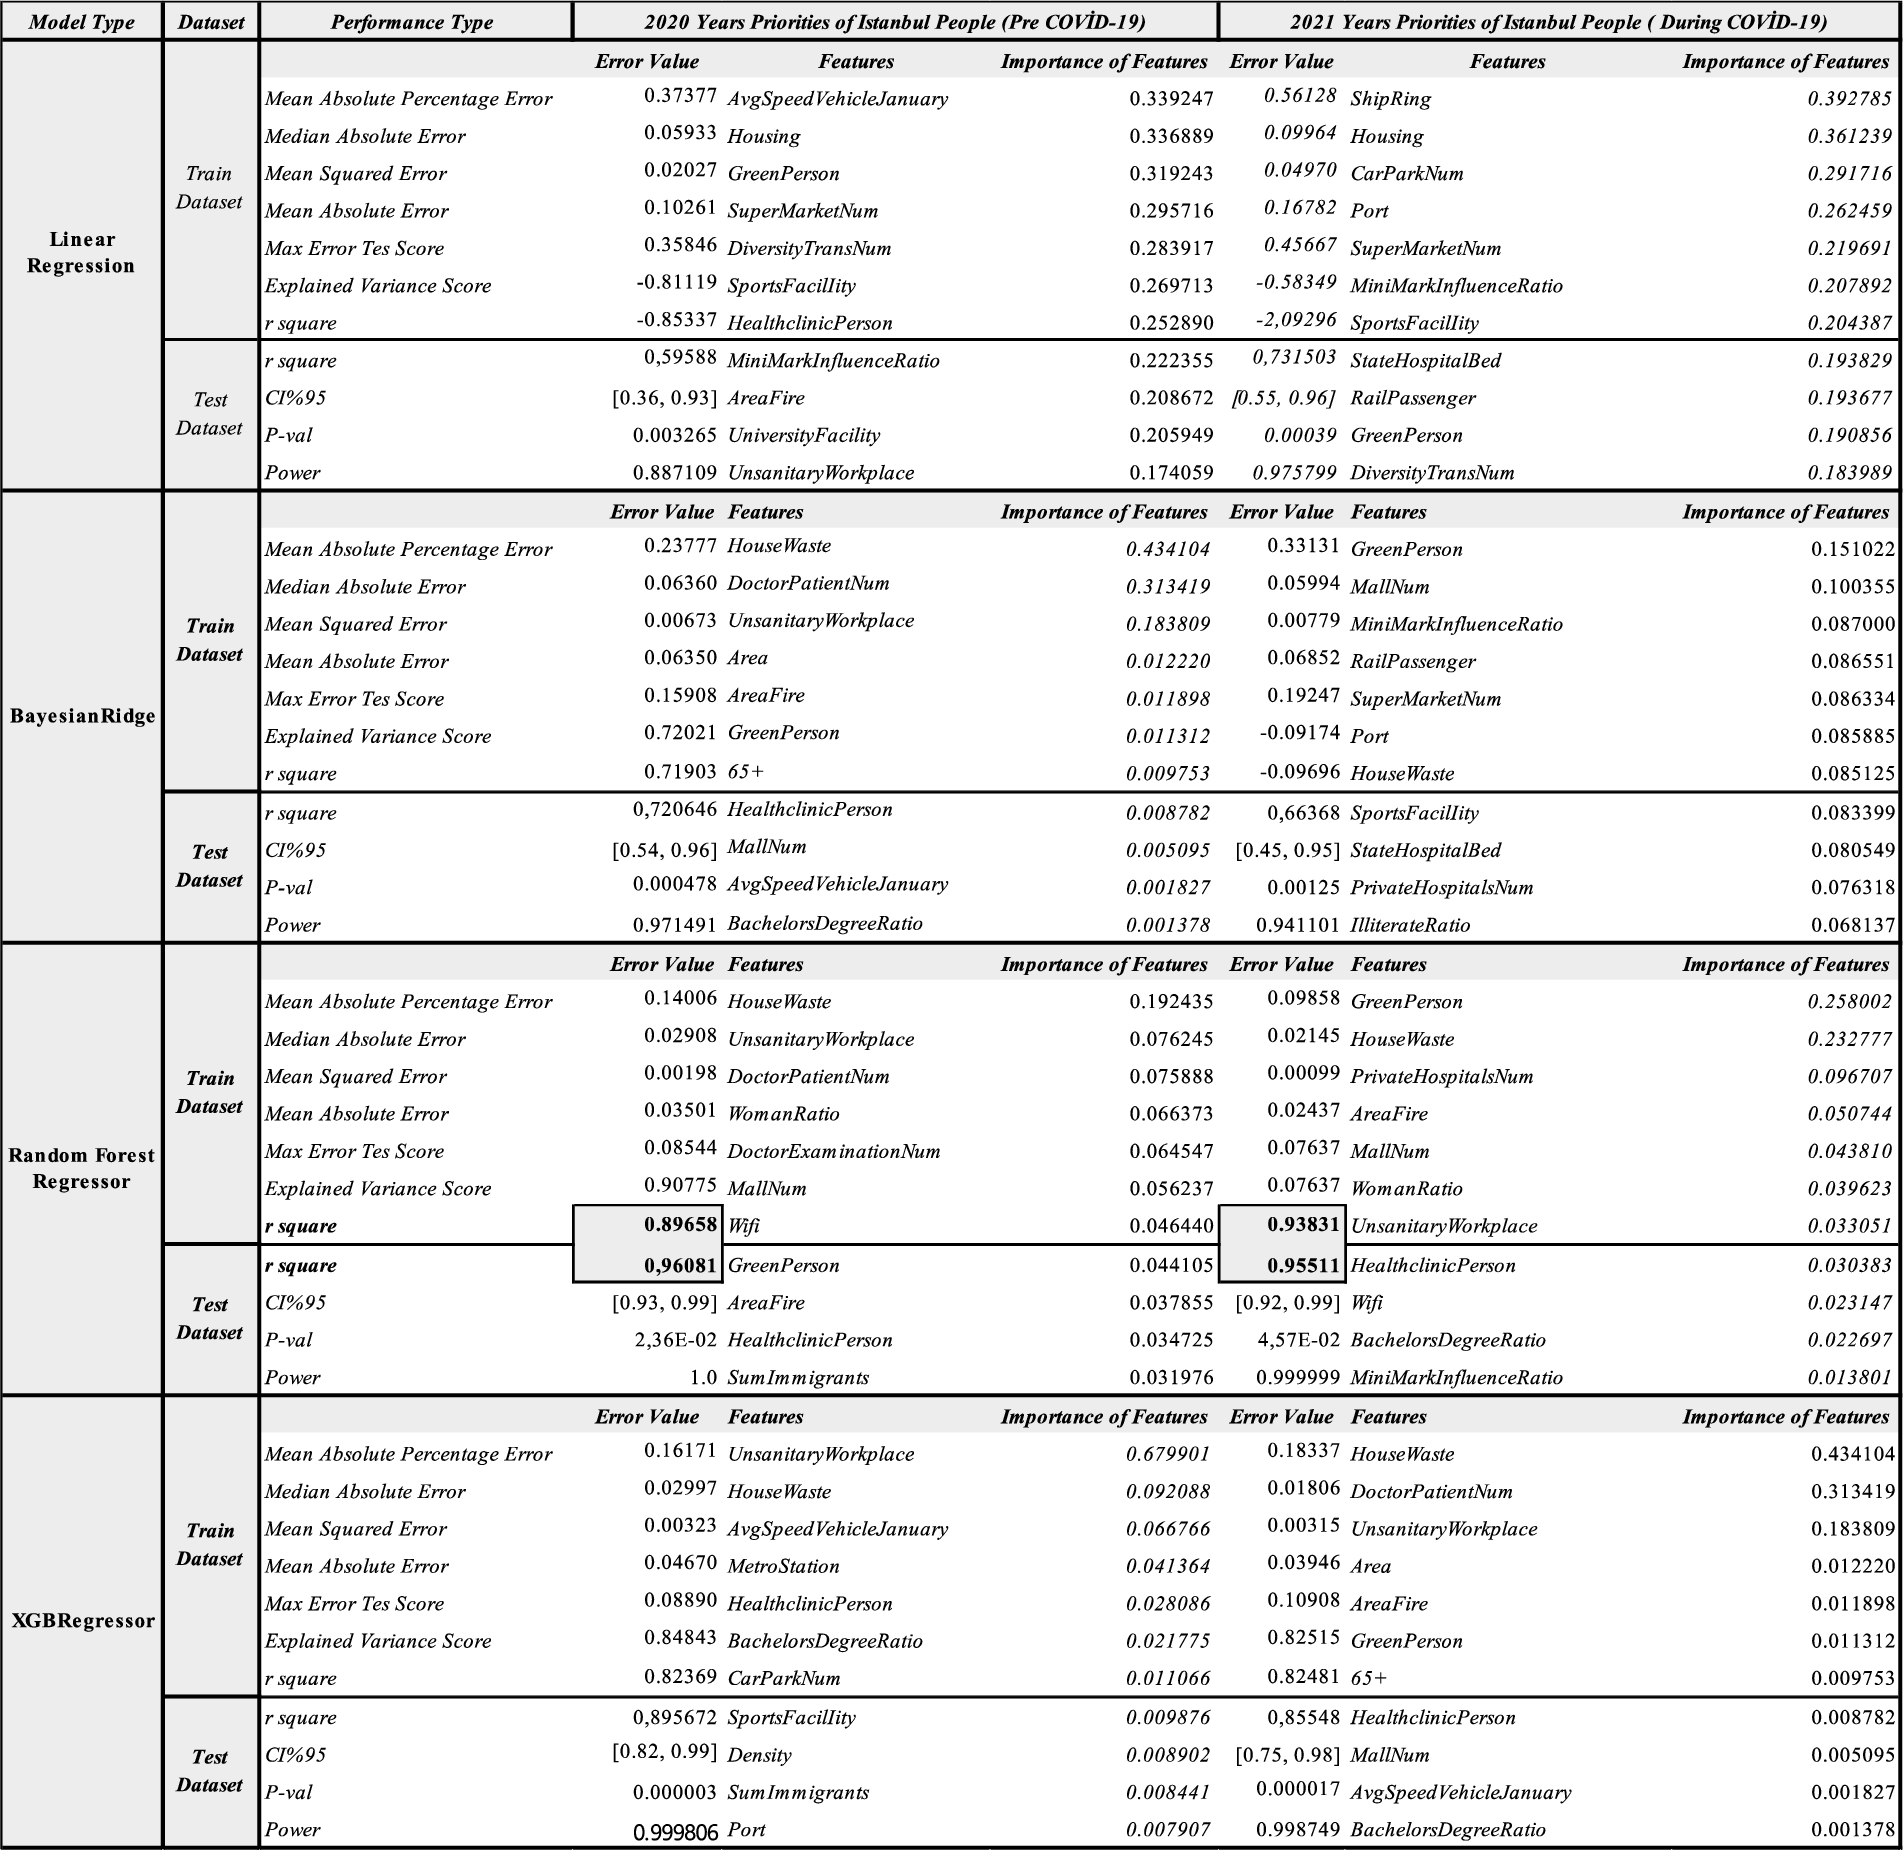
Fig. 5.
Comparison of RFR: (a) pre-COVID-19; (b) COVID-19.
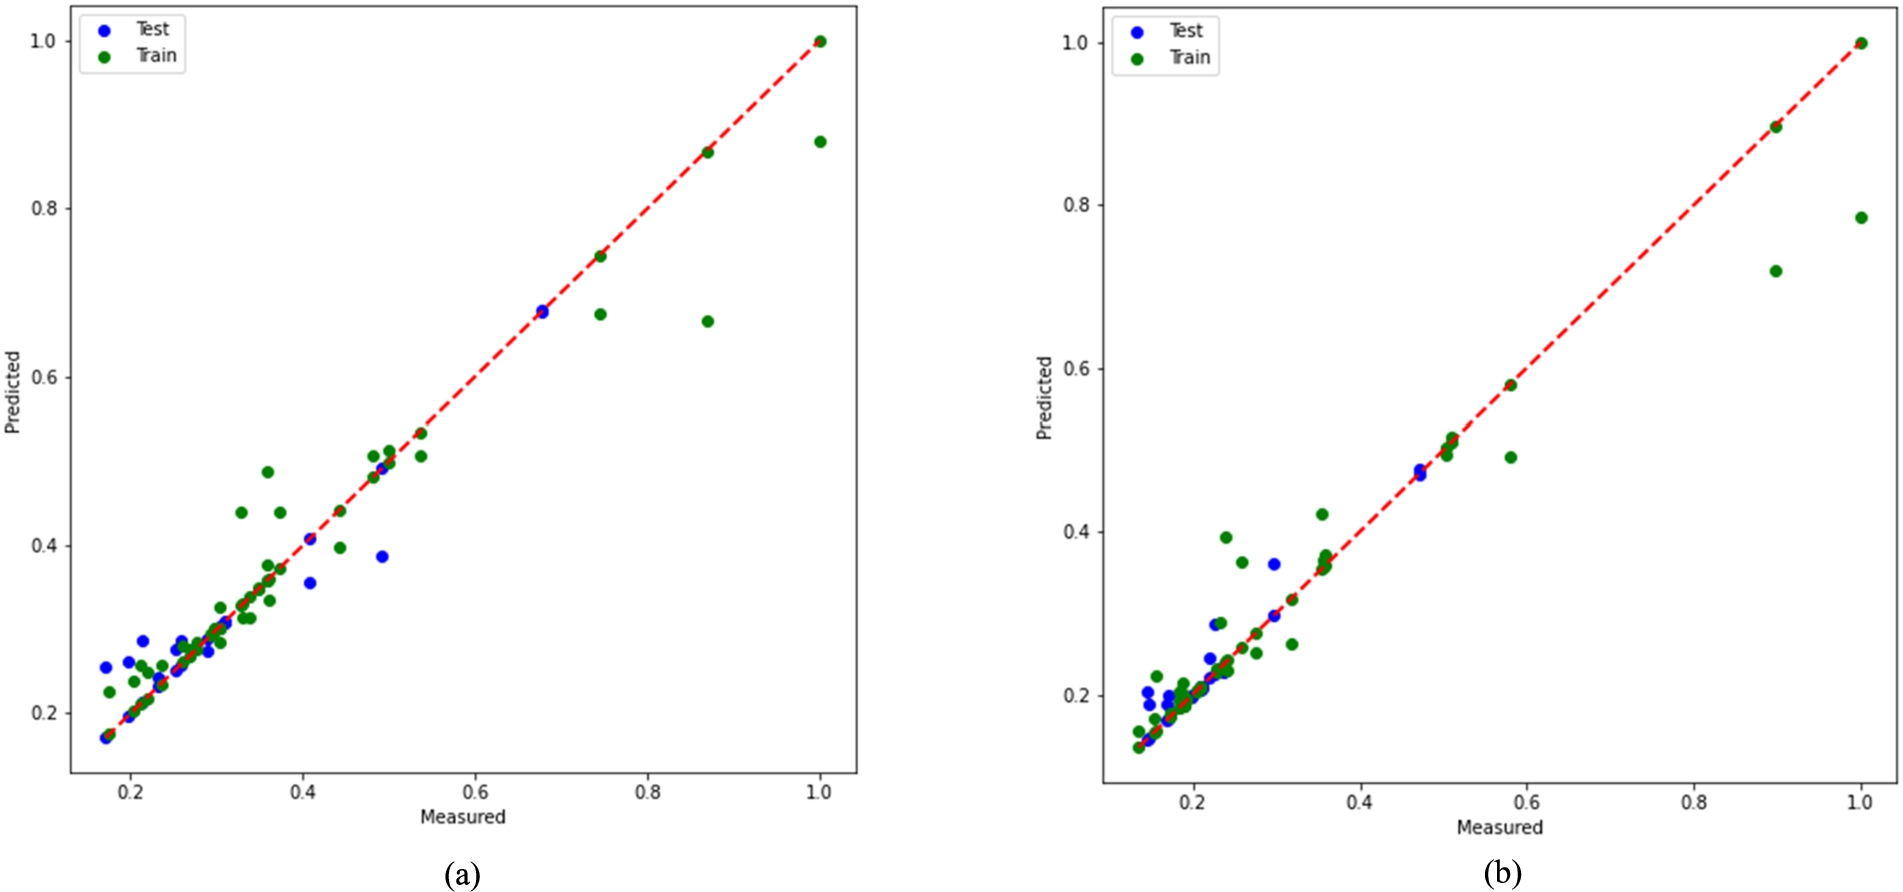
Fig. 6.
Comparison of XGB performance: (c) pre-COVID-19; (d) COVID-19.
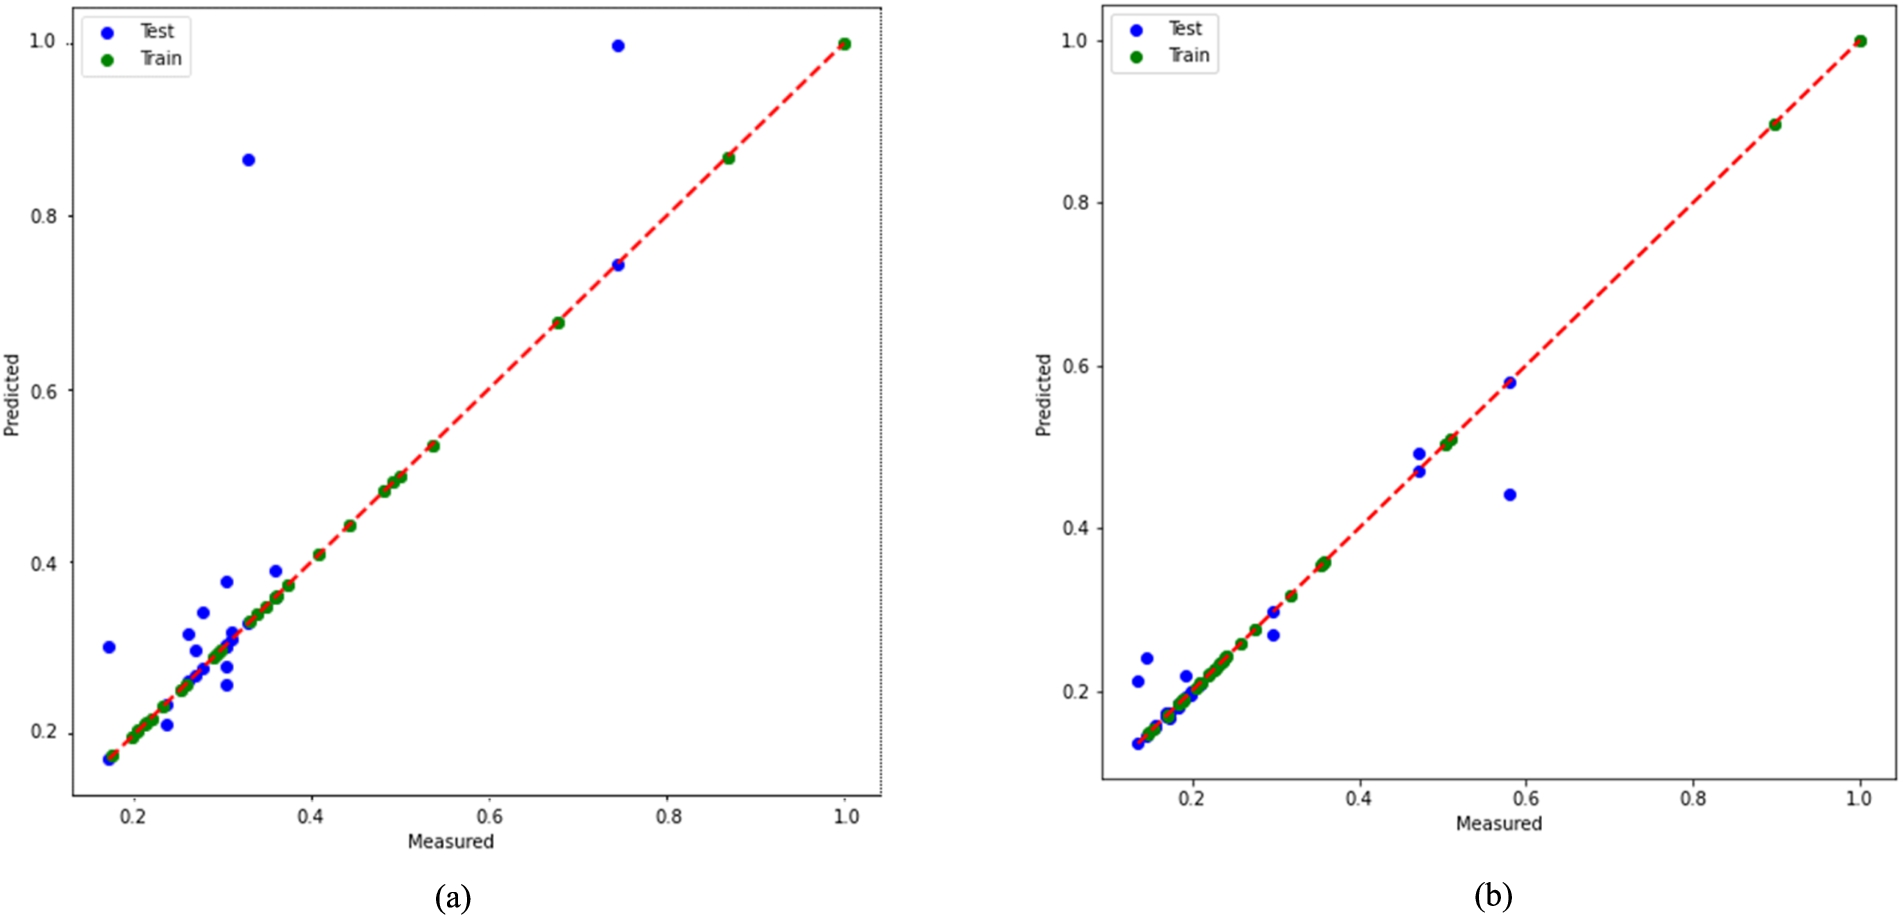
Figures 5 and 6 show the regressions for both test (blue) and train (green) models. The inconsistency between test and training (Fig. 6(c)), which is created for XGB, is striking. Explained variance of RFR model is 0.90. The value of explained variance describes the features that are displayed and aren’t due to error variance [33,42]. The value of 0.90 achieved by the model indicates a stronger power of association. This value means that it makes better predictions [33].
Fig. 7.
Istanbulites’ value ranges in January 2020 for the RFR.
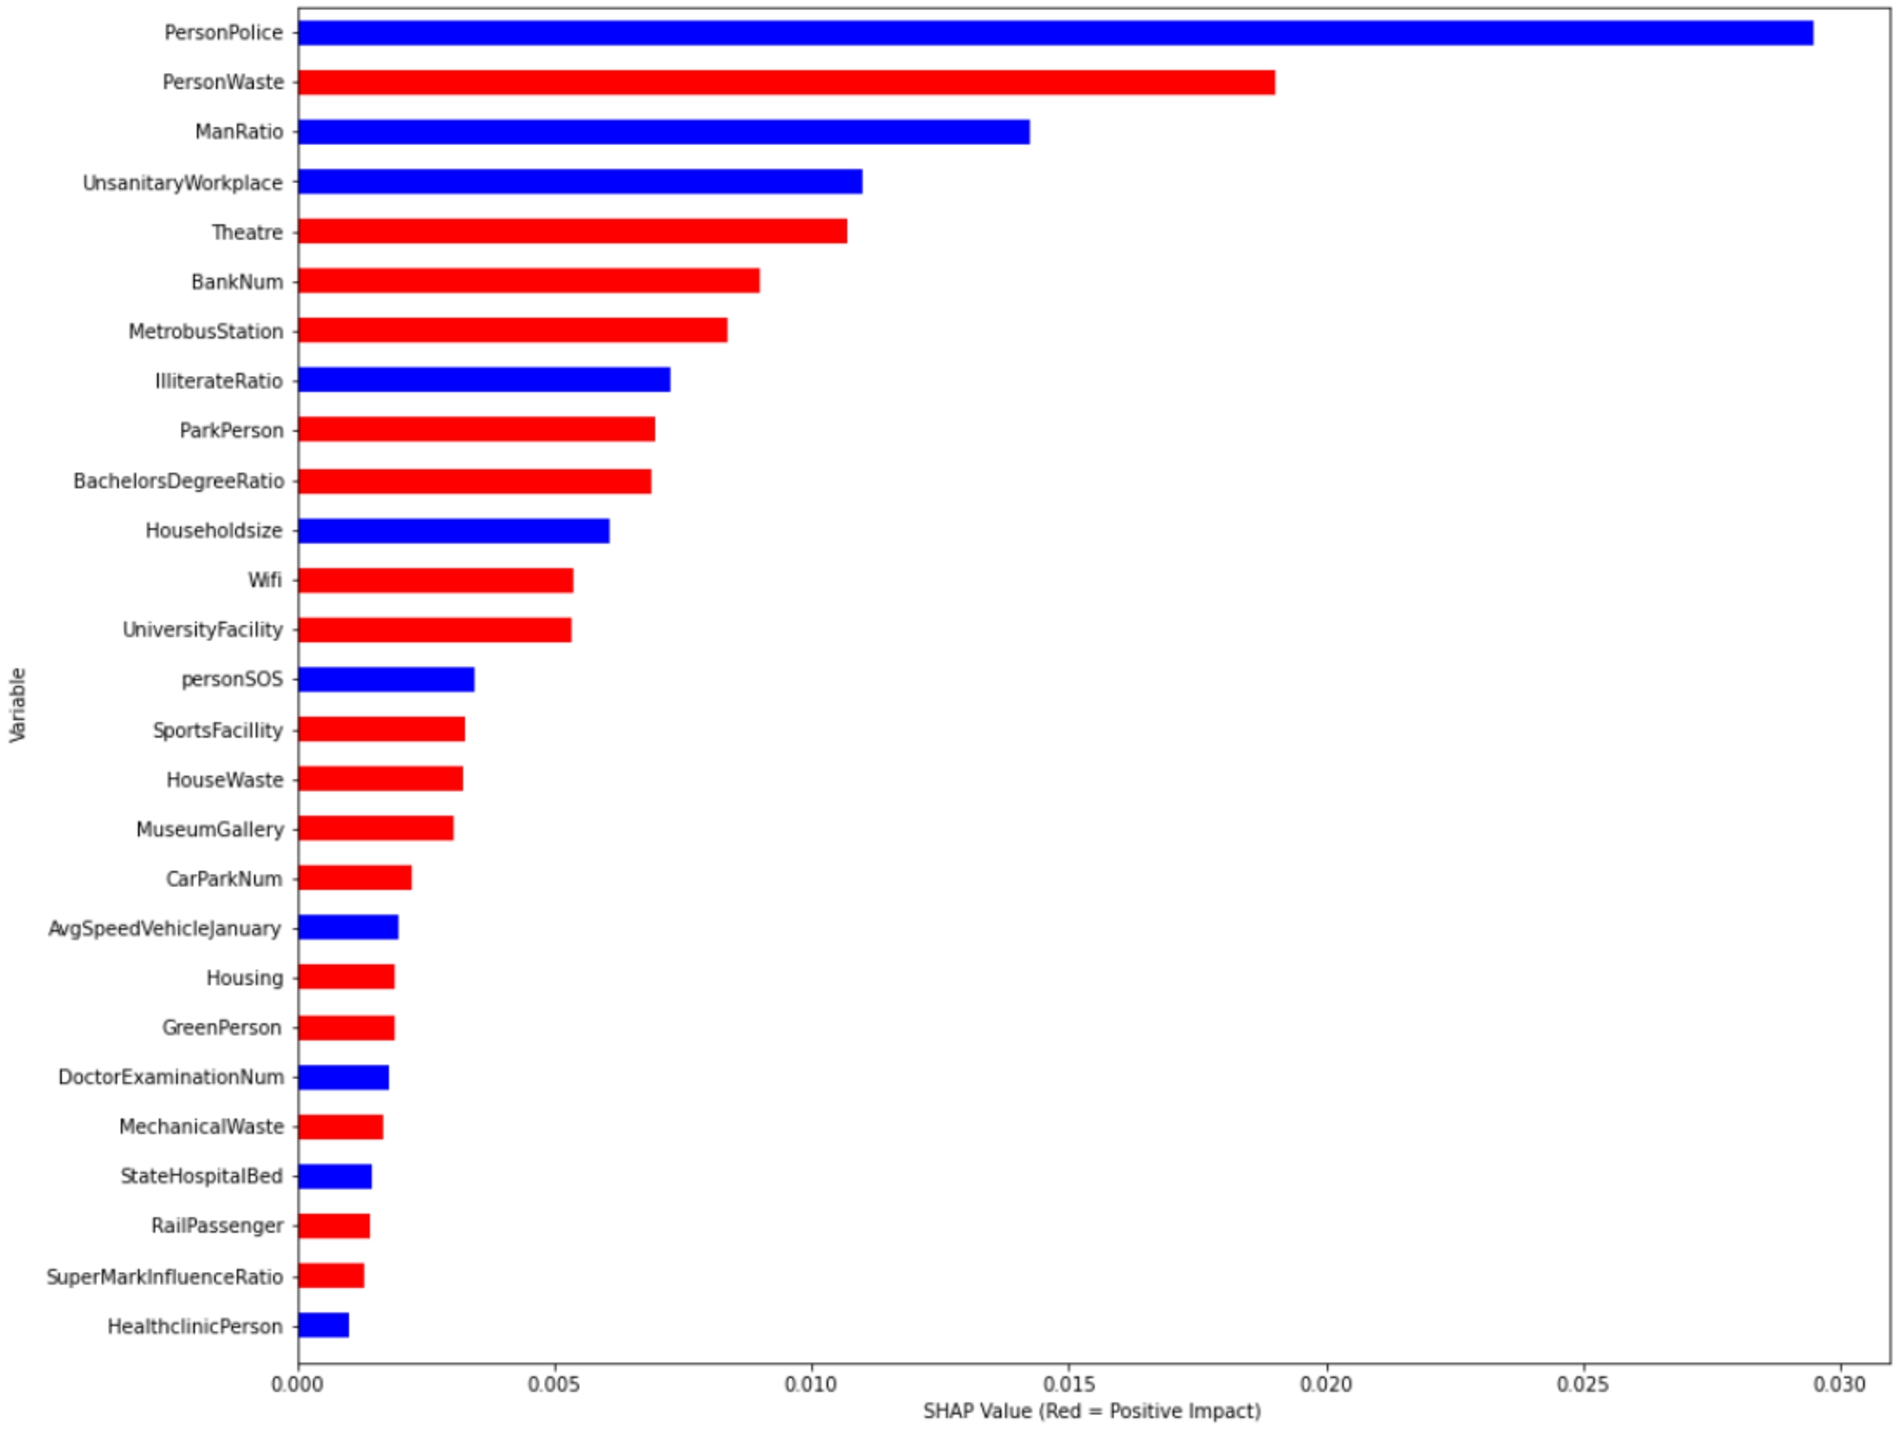
The PersonPolice feature shows the number of people per police station. Figure 7 shows that the PersonPolice feature has a strong negative correlation with hosting preference. The low number of persons per police station indicates that the district has more security measures. For instance, while there is one police station for every 41018 persons in Beykoz district, this number is 191479 in Esenyurt district, where immigration is high. Figure 6 shows that housing preference increases as security increases. PersonWaste is the amount of waste per person. It was formed by relating the amount of waste collected by the municipalities of the district to the population of the district. The consumption of prepared food increases in districts where the number of people living alone and workers are high. The large number of cafes, restaurants and fast-food establishments increases waste generation. In addition, waste generation increases in districts where people are constantly on the move during the day. The high rate of waste is a factor that negatively affects the real estate value of the district. There is a very strong relationship between the male rate and the female rate (correlation ratio 1.0). Due to this strong correlation ratio, the WomanRatio attribute is excluded from the data set. Figure 7 shows that the male ratio has a negative impact on housing demand, while the female ratio has a positive impact.
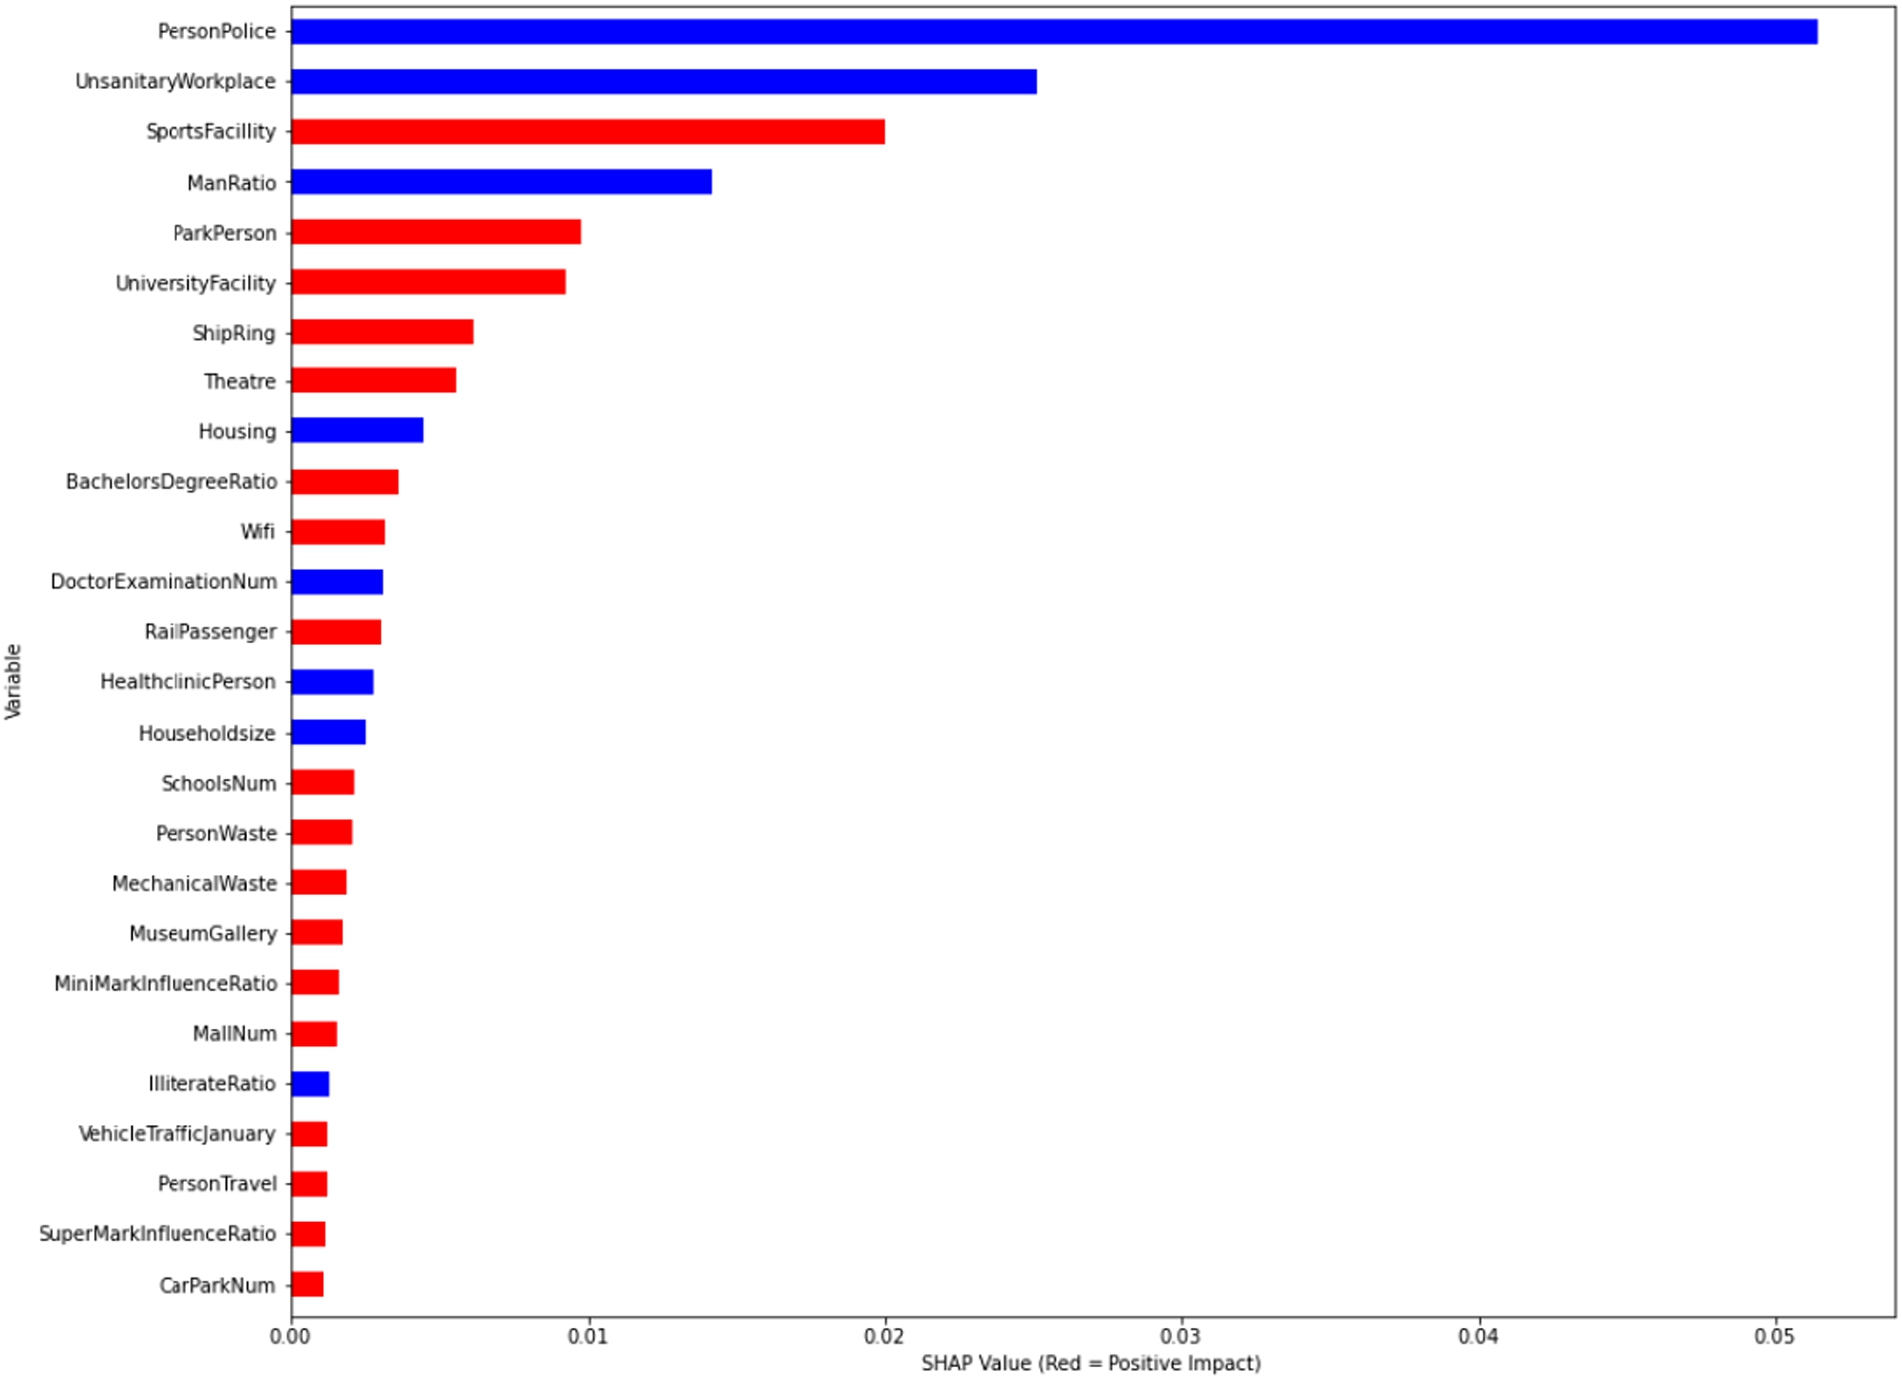
Figures 7 and 8 show the RFR values regarding Istanbulites’ tendencies regarding their life preferences for the pre-COVID-19 and COVID-19 periods, respectively. This study easily detects distinct changes in the rankings. As shown in Fig. 8, SportFacility has a positive impact on outputs. Districts with more park space per capita positively influenced the residential preferences of 1% of people during the pandemic period according to RFR model.
Fig. 8.
Istanbulites’ value ranges in January 2021 for the RFR.
5.Conclusions
This study finds that society’s housing preferences changed during the pandemic period, both according to the results of the model and due to the fact that real estate prices in Istanbul did not change to the same extent in each district. Istanbulites’ trends as determined for the pandemic process show negative and positive results. Figure 9 shows the changing trends for the available features. The feature of PersonPolice showed a positive change of 2.2% from the COVID-19 process between January 2020 and January 2021. Figure 9 is created by calculating the difference between the feature weights in 2021 and the feature weights in 2020.
Fig. 9.
The direction of Istanbuler’ value changes due to COVID-19.
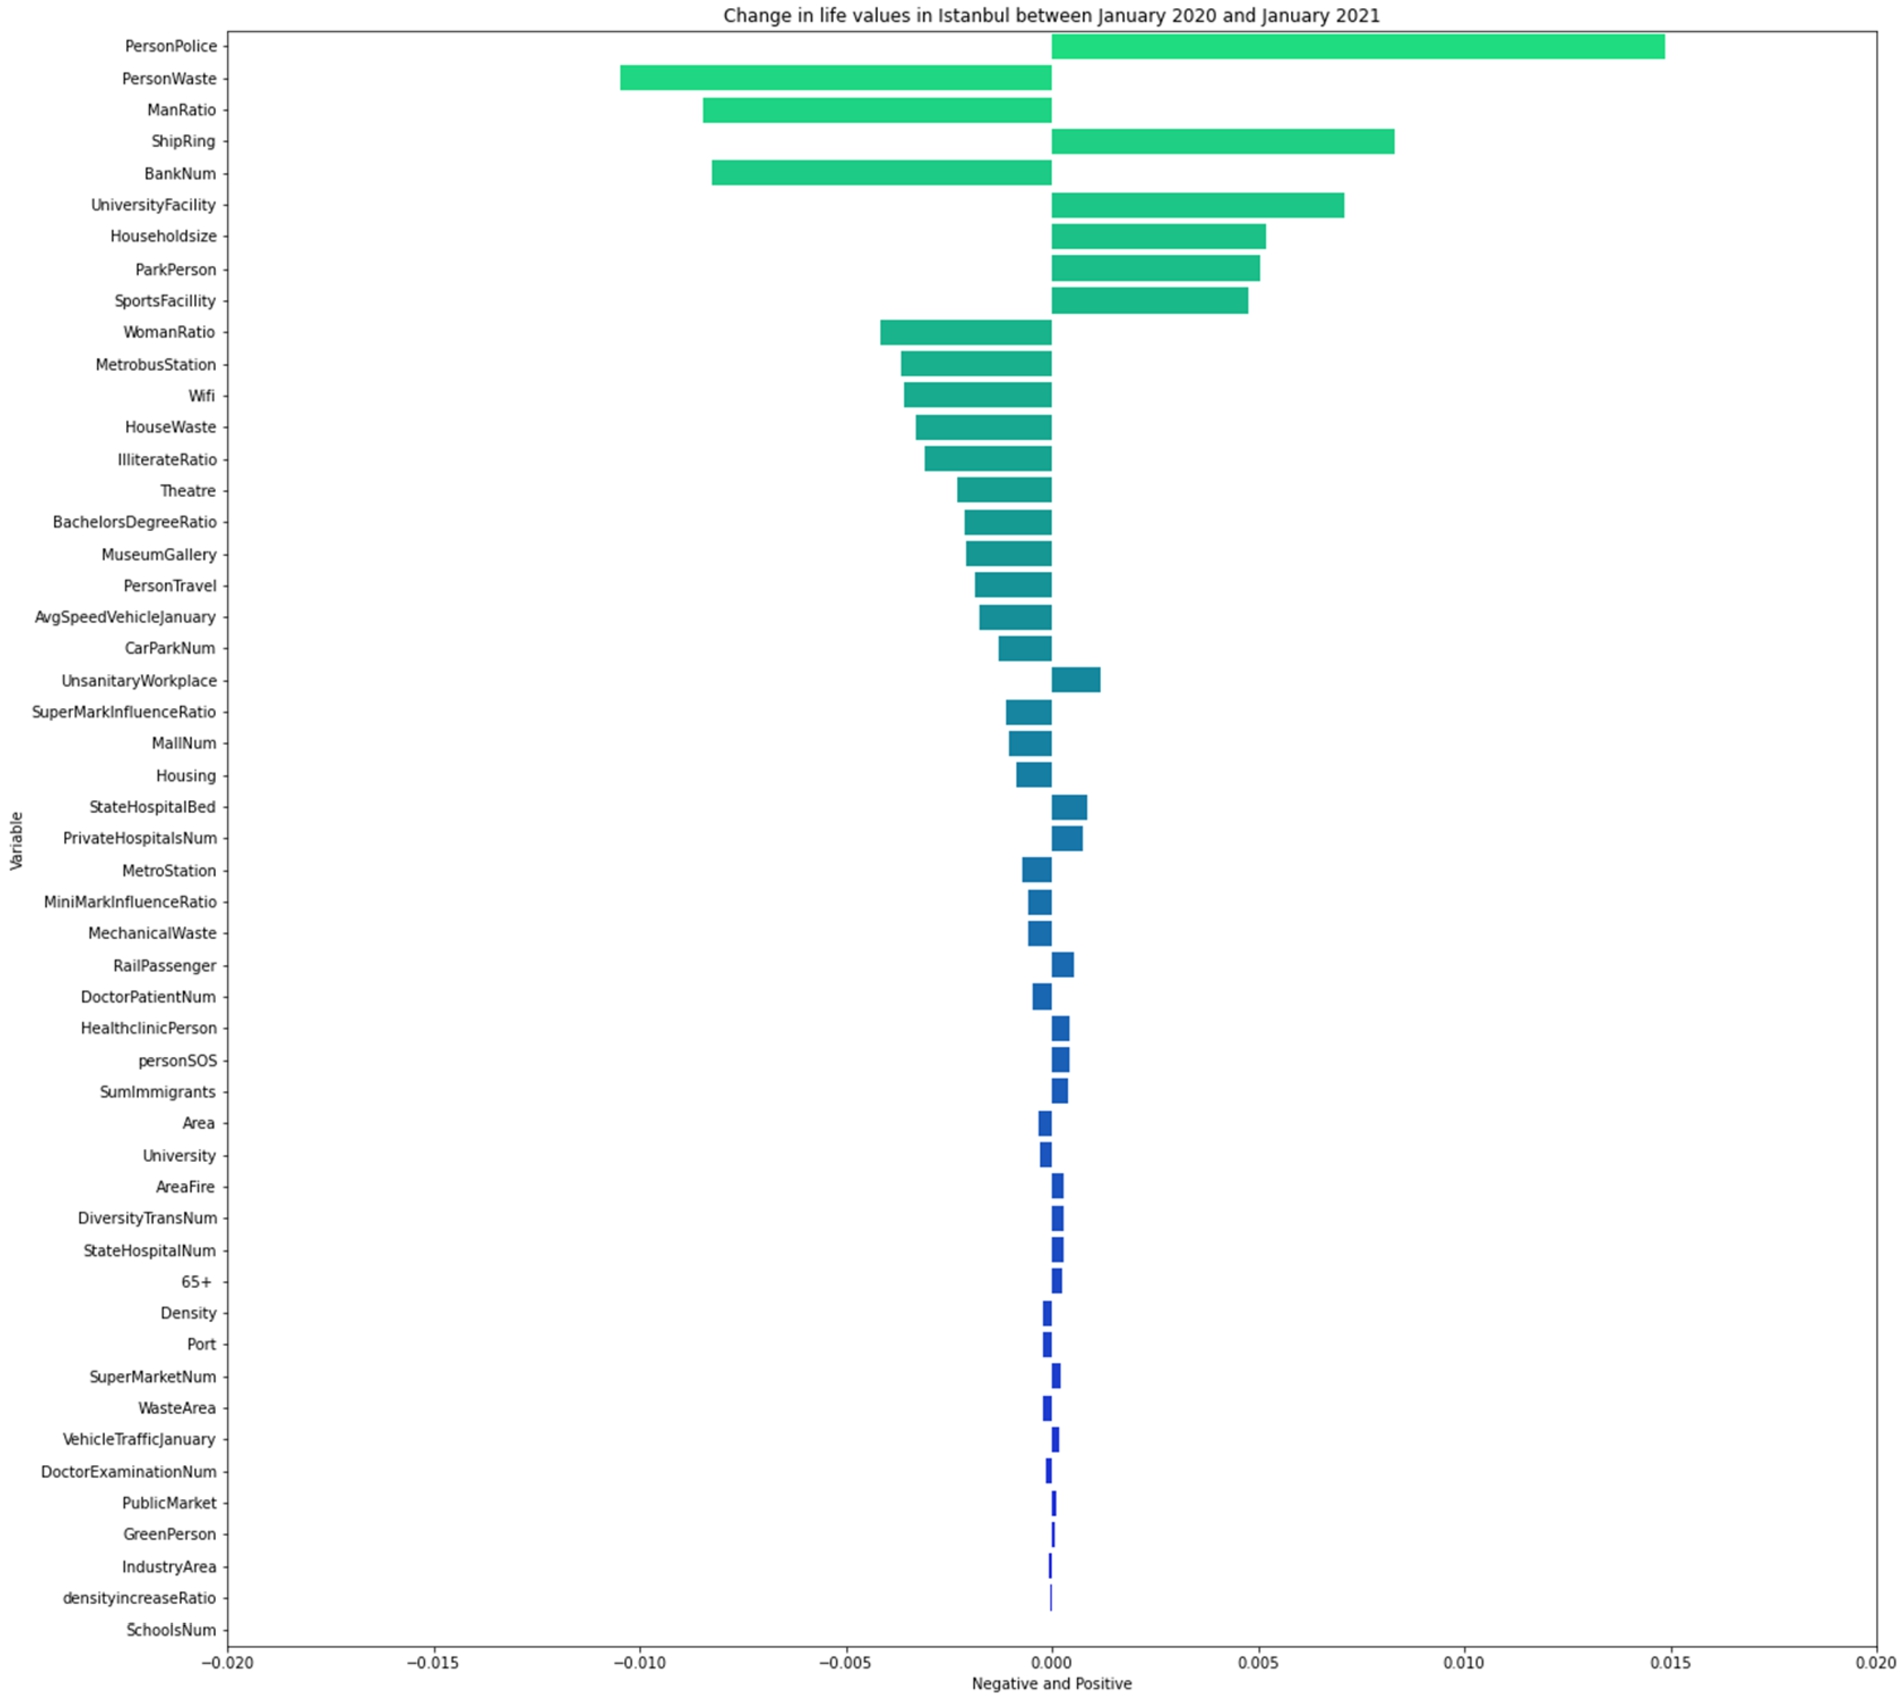
By choosing the best model, estimation were made for each feature and the estimation indicated that the effect of each feature on the output exactly matched with Table 3. Table 3 shows the changes in the weights of the features sequentially as absolute values. According to Table 3, the greatest change is seen in the feature of green area per capita. The feature of PersonPolice has a positive relationship with the property values determined for both 2020 and 2021 according to the correlation table in Fig. 4. In other words, waste per person decreases square meter costs. Our study shows a 1.6% decrease in Istanbulites’ preference for green spaces compared to the pre-COVID-19 period. Although this ratio varies for the different models in the study, the change in this feature stands out for each trial.
Due to increased immigration in Istanbul, the population of some districts has increased significantly over the past 20 years (Turkish Statistical Institute [TurkStat]). Owing to the new dense population structure in these districts, the number of police officers per capita has remained quite low, which causes the security gap in the districts [41]. According to the results of the model, the demand for housing in the areas where the number of police officers per capita is low and immigration continues decreased during the pandemic. This situation can be interpreted as that the pandemic has led to safety concerns among Istanbulers. According to the model, this trend shows a rate of 2.2% for one year. The demand is declining especially where most of Istanbul’s residents live. While both immigration and new housing construction increased demand in these regions pre-pandemic, this trend seems to be turned upside down during the pandemic, as shown in Fig. 3.
The first settlements of Istanbul are the central points of the city, where there are relatively small flats, which are preferred by young people and active workers. In these regions, the number of employed people, the consumption of fast-food and the amount of waste per person are high comparing to other regions. In addition, since these areas are old settlements, there are very few green spaces and parks, which even decreased more by 1.6% during the pandemic. With the increase in remote working conditions, there is a decrease in demand of real estate in these regions according to the results of the model. During the pandemic, Istanbulers were put on lockdown, which in return caused a decrease in physical activities. The demand for the districts that include sport facilities increased during the pandemic.
Table 3
How istanbulites’ priorities have changed throughout COVID-19
| Features | Difference | Absolute difference |
| PersonPolice | 0.02197 | 0.02197 |
| PersonWaste | −0.01693 | 0.016932 |
| SportsFacilIity | 0.01676 | 0.016759 |
| UnsanitaryWorkplace | 0.01414 | 0.014137 |
| MetrobusStation | −0.00797 | 0.00797 |
| BankNum | −0.00794 | 0.00794 |
| ShipRing | 0.00598 | 0.005977 |
| IlliterateRatio | −0.00593 | 0.005929 |
| Theatre | −0.00513 | 0.00513 |
| UniversityFacility | 0.00392 | 0.003915 |
| HouseholdSize | −0.00353 | 0.003518 |
The unsanitary workplaces such as the automotive supply industry, chemical industry, and leather industry are located in the Istanbul’s remote districts, where the settlement is low, urbanization is still ongoing, and the proportion of forests is high. According to the results of the model, the demand for these regions has increased. This trend has shown that people tend to move away from the city centers during the pandemic. A similar trend is observed among those who live near to metro bus stations. 13% of public transportation in Istanbul is conducted by BRT. In 2019, BRT carried an average of 2,059,151 passengers per day [17]. According to Table 3, 0.7% of Istanbul residents tend to move away from BRT stations. As the change rate of the features presented in Table 3 becomes smaller, the tendency of the society is difficult to interpret, because the error of the model may cause the sign of the trend (positive, negative) to change.
In general, features such as the number of theaters or the number of banks is higher in downtown districts than in other districts. A negative trend in these features can be observed from Table 3. The number of features in the study is reduced from 80 to 50 parameters. Having 50 features for 39 districts simplified the model. In other words, a simplified set of features made the results easier to interpret. Furthermore, including two features with a very strong relationship (above 0.8 rate) and with different weights into the model makes it difficult to interpret the results of the model [11]. This is unusual that the number of features is higher than the number of districts. However, the consistency of the training and test values is the strength of the model [22].
Unpredictable trends in the city may lead to unpredictable migration, which can lead to infrastructural and sociological problems especially for the regions that are not prepared for immigration. Unwanted population mobility can be stopped only if the reason of mobility is known by the managers. For instance, the number of police officers per capita (given in the model’s results) can be balanced by taking the necessary planning, which in return may partially prevent the potential human mobility. In addition, anticipating potential mobility to the business centers that are located outside of the city may help managers to prioritize improving the infrastructure in those regions. Creating smart cities require the collaboration of several disciplines [2]. Therefore, it may be insufficient to interpret the results of the model using only one discipline.
The digital opportunities society have newly encountered during the COVID-19 period and the increases in online orders have changed the preference values of city centers. Many situations that we describe as the new-normal will continue after COVID-19. Therefore, these may become permanent in people’s value priorities. When considering these factors, the smart city index, life index, and sustainability index will need to be updated with the new-normal. This study shows how the weights of certain features have changed in Istanbul. Variations in the preference values of approximately 16 million Istanbulites may reflect similar results for the pandemic conditions experienced by the whole world. However, each city has its own geopolitical, cultural, and social dynamics, so these variations cannot be expected to be the same for other cities.
6.Discussion
Mujahed’s study in Amman, Jordan observed changes in its citizens’ living habits during the COVID-19, observing a decrease in green space usage preferences while the quarantine and virus panic during COVID-19 caused people’s home preferences to be mandatory [28]. The low number of COVID-19 cases outside of cities with green spaces led to this change in their study. The security needs of Istanbul’s residents also changed significantly in this study. Chen et al.’s study conducted during COVID-19 in China determined districts with high mobility to display high rates of the spread of COVID-19 [7]. The green rate is low in districts with high mobility in Istanbul. As in Chen et al.’s study, the preference of green areas thus also caused a decrease in the preference weight of places with high mobility in our study.
Onnom et al.’s study conducted in pre-COVID-19 Thailand showed the sustainability value in the city to have been weighted as 5.553 for environment, 4.817 for safety, 3.168 for health, 2.362 for transportation, 1.926 for public utility, and 1.663 for education [30]. Although these values parallel those in Table 2 (pre-COVID) from our study, the weights for the factors of health and environment regarding the sustainability value in post-COVID-19 Thailand need to be updated. Saez et al. mentioned each city having different dynamics in terms of sustainability to make standardization difficult [34].
Development proposal for further studies; Our study determined people’s tendencies using a statistical method and will help future studies to be conducted determine country-specific dynamics. Because expert opinions are provided for current country conditions, the attributes are likely to have different significance weights for each country. Due to the lack of high reliability from experts in sudden events such as pandemics, our study has avoided subjective values by using statistical methods.
The proposed framework does not provide meaningful results only for COVID-19 but also for other disasters such as global warming, earthquake, flood, cyber-attack, drought etc. [19,39]. The same logic may be applied to parameter measuring before and during a disease and the changes in these parameters with high accuracy. One of this study’s innovative aspects is to show such effects on society. The community managers to redesign more sustainable and robust cities can easily use the proposed approach. With the dynamic changes in the structures of the cities the expectations of the people may change as well. Changes and trends in the priorities of the society are the elements that smart cities should detect. To observe the changes, it is necessary to conduct the same survey pre and post disaster. However, this may not be viable or sustainable, because there is a shortage in number of experts as experienced in COVID-19. To keep the process under control, determining the social orientation is a very important information. Otherwise, sudden events may cause chaos in the society and this chaos may have profound irreparable results in the society.
7.Limitations
Some features in this study have been observed to not affect a single category. For example, whether the number of cafes in a district should be considered a social or economic feature is unclear. As such, the category to which the weights for such features belongs is subjective. Therefore, statistical approaches and larger datasets apart from expert opinions from city index studies will increase the reliability of studies. A comparison of the study with similar cities in other cultures of the world could expand the scope of the study.
Acknowledgement
The authors would like to acknowledge that this paper is submitted in partial fulfilment of the requirements for PhD degree at Yildiz Technical University. This study is produced within the scope of Kenan Mengüç’s Phd dissertation.
Conflict of interest
None to report.
References
[1] | O.F. AlThuwaynee, S.W. Kim, M.A. Najemaden, A. Aydda, A.L. Balogun, M.M. Fayyadh and H.J. Park, Demystifying uncertainty in PM10 susceptibility mapping using variable drop-off in extreme-gradient boosting (XGB) and random forest (RF) algorithms, Environmental Science and Pollution Research 28: ((2021) ), 43544–43566. doi:10.1007/s11356-021-13255-4. |
[2] | O. Andrisano, I. Bartolini, P. Bellavista, A. Boeri, L. Bononi, A. Borghetti et al., The need of multidisciplinary approaches and engineering tools for the development and implementation of the smart city paradigm, Proceedings of the IEEE 106: (4) ((2018) ), 738–760. doi:10.1109/JPROC.2018.2812836. |
[3] | Y. Bi, D. Xiang, Z. Ge, F. Li, C. Jia and J. Song, An interpretable prediction model for identifying N7-methylguanosine sites based on XGBoost and SHAP, Molecular Therapy-Nucleic Acids 22: ((2020) ), 362–372. doi:10.1016/j.omtn.2020.08.022. |
[4] | E. Bisong, More supervised machine learning techniques with scikit-learn, in: Building Machine Learning and Deep Learning Models on Google Cloud Platform, Apress, Berkeley, CA, (2019) , pp. 287–308. doi:10.1007/978-1-4842-4470-8_24. |
[5] | R. Carli, M. Dotoli and R. Pellegrino, A hierarchical decision making strategy for the energy management of smart cities, IEEE Trans. Autom. Sci. Eng. 14: (2) ((2017) ), 505–523. doi:10.1109/TASE.2016.2593101. |
[6] | R. Carli, M. Dotoli and R. Pellegrino, Multi-criteria decision-making for sustainable metropolitan cities assessment, Journal of environmental management 226: ((2018) ), 46–61. doi:10.1016/j.jenvman.2018.07.075. |
[7] | J. Chen, X. Guo, H. Pan and S. Zhong, What determines city’s resilience against epidemic outbreak: Evidence from China’s COVID-19 experience, Sustainable cities and society 70: ((2021) ), 102892. doi:10.1016/j.scs.2021.102892. |
[8] | T. Chen and C. Guestrin, August. Xgboost: A scalable tree boosting system, in: Proceedings of the 22nd Acm Sigkdd International Conference on Knowledge Discovery and Data Mining, (2016) , pp. 785–794. doi:10.1145/2939672.2939785. |
[9] | Y. Chen and D. Zhang, Evaluation of city sustainability using multi-criteria decision-making considering interaction among criteria in Liaoning province China, Sustainable Cities and Society 59: ((2020) ), 102211. doi:10.1016/j.scs.2020.102211. |
[10] | J. Chin, V. Callaghan and I. Lam, Understanding and personalising smart city services using machine learning, the Internet-of-things and big data, in: 2017 IEEE 26th International Symposium on Industrial Electronics (ISIE), IEEE, (2017) , pp. 2050–2055. doi:10.1109/ISIE.2017.8001570. |
[11] | B.F. Darst, K.C. Malecki and C.D. Engelman, Using recursive feature elimination in random forest to account for correlated variables in high dimensional data, BMC genetics 19: (1) ((2018) ), 1–6. |
[12] | W. De Vazelhes, C.J. Carey, Y. Tang, N. Vauquier and A. Bellet, metric-learn: Metric learning algorithms in python, J. Mach. Learn. Res. 21: ((2020) ), 138. |
[13] | G. Egilmez, S. Gumus and M. Kucukvar, Environmental sustainability benchmarking of the US and Canada metropoles: An expert judgment-based multi-criteria decision making approach, Cities 42: ((2015) ), 31–41. doi:10.1016/j.cities.2014.08.006. |
[14] | M. Feurer and F. Hutter, Hyperparameter optimization, in: Automated Machine Learning, Springer, Cham, (2019) , pp. 3–33. doi:10.1007/978-3-030-05318-5_1. |
[15] | J. Frost, Regression Analysis: An Intuitive Guide for Using and Interpreting Linear Models, Statisics By Jim Publishing, (2019) . |
[16] | T.K. Ho, August. Random decision forests, in: Proceedings of 3rd international conference on document analysis and recognition, Vol. 1: , IEEE, (1995) , pp. 278–282. doi:10.1109/ICDAR.1995.598994. |
[17] | IETT, istanbulda-toplu-ulasim, 2022, https://iett.istanbul/icerik/istanbulda-toplu-ulasim. |
[18] | D. Ivanov and A. Dolgui, OR-methods for coping with the ripple effect in supply chains during COVID-19 pandemic: Managerial insights and research implications, International Journal of Production Economics 232: ((2021) ), 107921. doi:10.1016/j.ijpe.2020.107921. |
[19] | S. Janizadeh, M. Vafakhah, Z. Kapelan and N. Mobarghaee Dinan, Hybrid XGboost model with various Bayesian hyperparameter optimization algorithms for flood hazard susceptibility modeling, Geocarto International ((2021) ), 1–20. doi:10.1080/10106049.2021.1996641. |
[20] | R. Khatoun and S. Zeadally, Smart cities: Concepts, architectures, research opportunities, Communications of the ACM 59: (8) ((2016) ), 46–57. doi:10.1145/2858789. |
[21] | H.M. Kim and S.S. Han, City profile, Seoul. Cities 29: (2) ((2012) ), 142–154. doi:10.1016/j.cities.2011.02.003. |
[22] | K. Levi and Y. Weiss, Learning object detection from a small number of examples: The importance of good features, in: Proceedings of the 2004 IEEE Computer Society Conference on Computer Vision and Pattern Recognition, 2004, CVPR 2004, Vol. 2: , IEEE, (2004) , pp. II–II. |
[23] | C.D. Lewis, Industrial and Business Forecasting Methods: A Practical Guide to Exponential Smoothing and Curve Fitting, Butterworth-Heinemann, (1982) . |
[24] | Y. Lin, Z. Ma, K. Zhao, W. Hu and J. Wei, The impact of population migration on urban housing prices: Evidence from China’s major cities, Sustainability 10: (9) ((2018) ), 3169. doi:10.3390/su10093169. |
[25] | S.M. Lundberg and S.I. Lee, A unified approach to interpreting model predictions, in: Advances in Neural Information Processing Systems, MIT Press, Cambridge, (2017) , pp. 4765–4774. |
[26] | Mahallem İstanbul, http://www.mahallemistanbul.com/ (9.11.2021). |
[27] | M. Mohammadi and A. Al-Fuqaha, Enabling cognitive smart cities using big data and machine learning: Approaches and challenges, IEEE Communications Magazine 56: (2) ((2018) ), 94–101. doi:10.1109/MCOM.2018.1700298. |
[28] | L. Mujahed, Urban resilience: Relation between COVID-19 and urban environment in amman city, International Journal of Urban and Civil Engineering 15: (3) ((2021) ), 172–181. |
[29] | P. Neirotti, A. De Marco, A.C. Cagliano, G. Mangano and F. Scorrano, Current trends in smart city initiatives: Some stylised facts, Cities 38: ((2014) ), 25–36. doi:10.1016/j.cities.2013.12.010. |
[30] | W. Onnom, N. Tripathi, V. Nitivattananon and S. Ninsawat, Development of a liveable city index (LCI) using multi criteria geospatial modelling for medium class cities in developing countries, Sustainability 10: (2) ((2018) ), 520. doi:10.3390/su10020520. |
[31] | S. Portnoy and R. Koenker, The Gaussian hare and the Laplacian tortoise: Computability of squared-error versus absolute-error estimators, Statistical Science 12: (4) ((1997) ), 279–300. doi:10.1214/ss/1030037960. |
[32] | V. Rodriguez-Galiano, M.P. Mendes, M.J. Garciasoldado, M. Chicaolmo and L. Ribeiro, Predictive modeling of groundwater nitrate pollution using random forest and multisource variables related to intrinsic and specific vulnerability: A case study in an agricultural setting (Southern Spain), Science of the Total Environment 476–477: (4) ((2014) ), 189–206. doi:10.1016/j.scitotenv.2014.01.001. |
[33] | G. Rosenthal and J. Rosenthal, Statistics and Data Interpretation for Social Work, Springer Publishing Company, (2011) . |
[34] | L. Saez, I. Heras-Saizarbitoria and E. Rodriguez-Nunez, Sustainable city rankings, benchmarking and indexes: Looking into the black box, Sustainable Cities and Society 53: ((2020) ), 101938. doi:10.1016/j.scs.2019.101938. |
[35] | M. Sakurai and J. Kokuryo, Fujisawa sustainable smart town: Panasonic’s challenge in building a sustainable society, Communications of the Association for Information Systems 42: (1) ((2018) ), 19. doi:10.17705/1CAIS.04219. |
[36] | A. Sharifi, A.R. Khavarian-Garmsir and R.K.R. Kummitha, Contributions of smart city solutions and technologies to resilience against the COVID-19 pandemic: A literature review, Sustainability 13: (14) ((2021) ), 8018. doi:10.3390/su13148018. |
[37] | M. Strohbach, H. Ziekow, V. Gazis and N. Akiva, Towards a big data analytics framework for IoT and smart city applications, in: Modeling and Processing for Next-Generation Big-Data Technologies, Springer, Cham, (2015) , pp. 257–282. doi:10.1007/978-3-319-09177-8_11. |
[38] | D. Sun, H. Wen, D. Wang and J. Xu, A random forest model of landslide susceptibility mapping based on hyperparameter optimization using Bayes algorithm, Geomorphology 362: ((2020) ), 107201. doi:10.1016/j.geomorph.2020.107201. |
[39] | D. Sun, J. Xu, H. Wen and D. Wang, Assessment of landslide susceptibility mapping based on Bayesian hyperparameter optimization: A comparison between logistic regression and random forest, Engineering Geology 281: ((2021) ), 105972. doi:10.1016/j.enggeo.2020.105972. |
[40] | D. Toppeta, The Smart City Vision: How Innovation and ICT Can Build Smart, “Livable”, Sustainable Cities: The Innovation Knowledge Foundation, 2010, available at: http://www.thinkinnovation.org/file/research/23/en/Toppeta_Report_005_2010. |
[41] | C. Türk, İstanbul’un suç karnesi açıklandı, 2022, https://www.cnnturk.com/video/turkiye/istanbulda-hirsizlik-ve-cinayet-azaldi. |
[42] | R. Warner, Applied Statistics: From Bivariate Through Multivariate Techniques, SAGE, (2013) . |
[43] | S. Weisberg, Applied Linear Regression, Vol. 528: , Wiley, (2005) . |
[44] | World Health Organization, Coronavirus disease 2019 (COVID-19) situation report-51, 2020. |
[45] | W. Yuchi, E. Gombojav, B. Boldbaatar, J. Galsuren, S. Enkhmaa, B. Beejin and R.W. Allen, Evaluation of random forest regression and multiple linear regression for predicting indoor fine particulate matter concentrations in a highly polluted city, Environmental pollution 245: ((2019) ), 746–753. doi:10.1016/j.envpol.2018.11.034. |
[46] | M. Zarrabi, S.A. Yazdanfar and S.B. Hosseini, COVID-19 and healthy home preferences: The case of apartment residents in Tehran, Journal of Building Engineering 35: ((2021) ), 102021. doi:10.1016/j.jobe.2020.102021. |
[47] | M. Zheng, W. Tang and X. Zhao, Hyperparameter optimization of neural network-driven spatial models accelerated using cyber-enabled high-performance computing, International Journal of Geographical Information Science 33: (2) ((2019) ), 314–345. doi:10.1080/13658816.2018.1530355. |
[48] | L. Zhuhadar, E. Thrasher, S. Marklin and P.O. de Pablos, The next wave of innovation – review of smart cities intelligent operation systems, Computers in Human Behavior 66: ((2017) ), 273–281. doi:10.1016/j.chb.2016.09.030. |

