
Assessing the Impacts of Human Activities on Air Quality during the COVID-19 Pandemic through Case Analysis


1
Faculty of Information Engineering, Shaoyang University, Shaoyang 422000, China
2
Faculty of Engineering, University of Sydney, Sydney, NSW 2007, Australia
*
Author to whom correspondence should be addressed.
Atmosphere 2022, 13(2), 181; https://doi.org/10.3390/atmos13020181
Submission received: 12 January 2022
/
Revised: 21 January 2022
/
Accepted: 21 January 2022
/
Published: 23 January 2022
(This article belongs to the Special Issue Quantifying the Impact of COVID-19 on Air Pollutant Emissions, Air Quality, and Climate Change)
Abstract
:COVID-19 is the latest of many pandemic affecting the world in the past few decades, and it has had a significant impact on the global environment. Some research has analysed the effects of the pandemic on air quality; however, very few studies have employed relationship analytics. In order to analyse the potential relationship between pandemic-related information and air quality data from a more holistic and detailed point of view, we propose a methodology based on pure data analysis. Three types of data were collected, namely air quality index, pandemic-related events, and number of COVID cases. Data were collected from five cities—Wuhan, New York, Seoul, Melbourne, and Singapore—to further analyse the response of air quality index to COVID events, thus revealing how human activity influences air quality from a pandemic perspective. The results show that a potential connection does exist in most cases and provide more evidence showing that air pollution declined during the pandemic. However, the strength of this relationship may also be related to other factors, such as geography, politics, population density, and measures imposed by local authorities, etc. This study provides another perspective to assist stakeholders in improving environmental decision making.
1. Introduction
Coronavirus disease (COVID-19) has become a worldwide pandemic since it first appeared in Wuhan, China in December 2019 [1]. As of 3 December 2021, 263,563,622 confirmed coronavirus cases had been reported worldwide, including 5,232,562 deaths [2]. The global outbreak and spread of COVID-19 have posed a severe threat to public health and caused significant interference in worldwide economic activities [3]. The COVID-19 pandemic forced most countries to take preventive measures to stop its disease spread, with local lockdowns being one of the main preventive measures employed [4]. Air quality is also thought to strongly interact with the mortality rate of COVID-19 [5]. A study showed that when PM2.5 (fine particulate matter defined as particles with diameters ≤2.5 microns) increased by one µg/m3, the COVID mortality rate increased by 8% in the United States [6]. Ironically, one of the few positive effects during a pandemic may be the health “benefits” of reduced air pollution [7], and there were significant reductions in air-pollutant levels in areas in which lockdowns were imposed [8].
Some studies have explored the interaction between COVID and air quality across the globe during the pandemic [9,10]. In China, studies have been conducted to evaluate changes in air quality by analysing the concentrations of major air pollutants, such as NO2, SO2, C.O., O3 (ozone), and PM2.5, etc. before and during the pandemic [11,12] and to quantify the effects of reduced human activities on air quality [13]. In central China, where the novel coronavirus first broke out, atmospheric concentrations of PM2.5, PM10 (particulate matter with diameters ≤ 10), NO2, C.O., and SO2 (sulphur dioxide) decreased significantly in 2020 (as compared with the past three years) [14]. According to air quality data monitored from 2017 to 2020, in the U.S., PM2.5 and NO2 levels decreased by 11% and 26%, respectively, during the pandemic [6,15]. Similar research has been carried out in Milan, Italy [16]; Baghdad, Iraq [17]; Canada [18]; Brazil [19,20,21]; and South Korea [14]. Overall, during the pandemic, air quality may have improved to a certain extent due to the indirect impact of reduced traffic, tourism [22], and economic activity [23].
Relevant information and communications technologies (ICT), such as machine learning, big data, and data visualisation, have been applied to analyse COVID data in order to glean decision-making insights. The capability of generating visually appealing raw data representations is valuable in COVID data analysis [24], and such visual representations can be utilised to analyse pandemic risk [25], such as severe acute respiratory syndrome (SARS) outbreak data [26]. At this stage, improved visualisation of infection rates analysis is required to rapidly detect patients with the disease [27]. Big-data visualisations and visual analytics tools were introduced in COVID data analytics to assist users in obtaining a better understanding of information concerning confirmed cases [28]. Additionally, some research has been conducted from a visualisation point of view in order to analyse air pollution and COVID data. An online questionnaire was circulated to look into the pandemic situation and air quality data through related visualisation techniques [29]; a visual application was established based on an assessment of air quality and air pollution by evaluating various relevant parameters [30]. A multi-source dataset was imported to examine the epidemic data using visualisation and machine learning methods [31]. Some studies have implemented descriptive statistics and outlier analysis of air quality datasets [15], while others have used time-series [1] and chemical analysis [4]. An augmented-reality application, AiR, was proposed that can assist users in visualising pollutants in the air and create an immersive user experience on Android devices [31].
In our study, to investigate air quality trends worldwide during the pandemic, we collected air quality data from five representative cities in Western and Asian countries for experiments. In particular, the PM2.5 index was imported to represent air quality, covering the first six months of 2019 and the whole year of 2020. It is important to note that Melbourne’s changes in air quality seem to be acting alone. We collected PM2.5 data from Wuhan, New York, Seoul, Melbourne, and Singapore before and during the outbreak as input for experiments. The reasons for choosing these cities are: Wuhan is the city in which the pandemic began; as one of the cities with the worst outbreaks, New York has a high population density, did not pay enough attention to the epidemic [32], and had multiple protests during the outbreak [33,34]; Seoul was severely affected at the beginning of the pandemic but managed to control the situation without an official lockdown [35]; Melbourne has been closed for the longest time of all cities worldwide [36] and also had mass demonstrations [37,38]; Singapore is a country with a small land area but a high population density, which might accelerate disease spread during the pandemic, and was also one of a few counties that maintained opened borders in 2020 [39].
Actual air-pollution reduction varies [40], and lockdown mandates were not strictly implemented in many cities around the world [41,42].
To the best of our knowledge, most of the existing studies on air quality data were conducted through relevant raw data analysis, mainly focusing on air quality in a single period or area. Few studies have been conducted from the perspective of multiple periods or combined with relevant social events. The purpose of this work is to analyse the relationship between the COVID-19 pandemic-related events and air quality from a more holistic and detailed point of view and to analyse the potential relationship, mainly through visualisation technology, such as line chart, bar chart, stack area chart, etc., combined with PM2.5 and COVID-related data, for a comprehensive analysis. We also explored whether new cases during the pandemic affected the volatility of PM2.5, linking the three sets of data and extracting deeper insights from the dataset. Our hypotheses are as follows.
Hypothesis 1 (H1).
The reduction in human activity during the outbreak may positively improve air quality.
Hypothesis 2 (H2).
During the pandemic lockdown, air-quality improvement may be more significant.
Hypothesis 3 (H3).
During the outbreak, changes in new cases may affect human social activities, thus indirectly affecting shifts in air quality.
Hypothesis 4 (H4).
The improvement of air quality in cities that imposed lockdowns may be more significant than in cities without restrictions.
Hypothesis 5 (H5).
The degree of variability in air quality may vary due to cultural diversity and the implementation strength of prevention measures.
Hypothesis 6 (H6).
During the epidemic, city-closure policies may have an impact on air quality.
The rest of this article is organised into several parts. In Section 2, relevant data and details of analysis are given; we also introduce related methods and features involved in experiments. In Section 3, we offer visual results, as well as some descriptions, we also summarise statistical data and discuss issues here. In Section 4, the conclusion of this work and a discussion of future research are given.
2. Materials and Methods
We downloaded and collected three types of raw data [43] for analysis, ranging from 1 January 2019 to 30 June 2021; data from 1 July to 31 December 2019 were excluded. The weeks used in this experiment refer to the sequential weeks of the year. For example, week1 represents 1–7 January.
- (1)
- Air quality index data
Air quality index data mainly refer to PM2.5 index data, including the daily average PM2.5 value from Wuhan, New York, Seoul, Melbourne, and Singapore. Original data were downloaded from aqicn.org [44], with a total of 1074 data entries finalised.
- (2)
- COVID-19 new-case data
The raw data covering five cities worldwide reflect daily new cases during the pandemic, involving 2020 and 2021. The data were downloaded and collected from several official government websites: Hubei Provincial Health Commission [45], NYC Open Data [46], Korea Centers for Disease Control and Prevention [47], Ministry of Health of Victoria [48], and the Ministry of Health of Singapore [49]. A total of 890 data entries were imported.
- (3)
- COVID-19-related event data
These raw data include the lockdown period of cities involved and significant protests. Details and sources can be found in [43]. Event data were included as supplementary evidence, in addition to COVID new-case data, in order to complete the analysis.
2.1. Data Processing
All collected raw data were cleaned and formatted. The processes are as follows.
- (1)
- PM2.5 weekly value process
In experiments, data were processed on a weekly basis. Specifically, collected raw data were transformed from daily to weekly format. For each week, the median value of PM2.5 during the week is selected as the present week’s PM2.5 data. Please refer to Table 1 for details (data for the other four cities can be found in [50]). Since not all PM2.5 values are available, there are invalid data for some weeks. In this case, we assume that pmw is the present week’s PM2.5 value yet has no valid value, pmw−1 is the PM2.5 value of the previous week, pmw+1 is the value of the next week. Then, the average value of week w − 1 and w + 1 is applied to fill in missing data. Weekly new cases is the sum of case numbers for each week, cni is the value of new cases on the ith day in a week, an week w’s case number is cnw (each week starts on Monday and ends on Sunday in this study).
- (2)
- PM2.5 weekly changing-rate process
The changing rate of the PM2.5 index was determined based on data from the same week in 2019, 2020, and 2021. For details, please refer to Table 2 (data for the other four cities can be found in [50]). pmwy is the value of the PM2.5 on week w of the year, y; and pmwy+1 is the value of the PM2.5 on week w of the year y + 1; and pmcw represents the corresponding rate of change of the PM2.5 index on week w between those two years.
- (3)
- PM2.5 yearly changing-rate process
The average changing rate of PM2.5 was calculated between every two years of 2019, 2020 and 2021. pmcy represents the corresponding rate of change of the PM2.5 index between two years. For more information, please refer to Table 3. Table 4 gives details of the relevant changing rates of four cities during lockdowns (Seoul excluded).
To discover the connection between COVID pandemic data and the PM2.5 index, we generated visual plots corresponding to the outbreak and PM2.5, as well as changes in new cases, based on the final data produced from the above processes [50]. Here, we use dates to bridge the related contact. Then, we integrated the three data types in Section 2. These include the changing trend of PM2.5 and new cases in Wuhan, New York, Seoul, Melbourne, and Singapore in 2019, 2020, and 2021. Ultimately, 260 records were retained for analysis.
2.2. Methods
This section introduces the relevant methods, including visualisation methods and study procedures.
2.2.1. Feature Selection
The raw data involved can be found in Section 2. PM2.5 refers to the particles in the ambient air with an aerodynamic equivalent diameter ≤ 2.5 microns, which is the main characteristic of smoke. PM2.5 can be suspended in the air for a long time, and the higher its concentration in the air, the more serious the air pollution. PM2.5 particles are also a dangerous form of pollution because they are so small that they can bypass the nose and throat, enter the lungs, and possibly enter the circulatory system [51]. Therefore, the PM2.5 index is suitable to measure air-quality performance. Wuhan, New York, Seoul, Melbourne, and Singapore are representative cities for which PM2.5 and COVID new-case data were available from public sources. Therefore, in this study, PM2.5 data of those five cities were processed to reflect the air quality of cities. Additionally, we collected data concerning newly confirmed cases of COVID-19 in the five representative cities during the pandemic, along with data concerning other events, to measure impacts on air quality.
2.2.2. Graph Visualisation Method
In this study, line chart, bar chart, and stack area charts were applied to present the experimental results. The broken-line/bar-chart component can display multiple series of data on the chart and can be used to show details of each city’s PM2.5 data. The stacking area map, on the other hand, is capable of delivering the trend lines of the PM2.5 index and changing rate of each city over time and can highlight relevant intersections between PM2.5 and the numerical values on the series axes, which makes it appropriate to assist in analysis of the variances in air-quality changes in different cities. In addition, Tableau, a powerful tool widely used in the data-analytics field, is also used for visualisation, owing to its capability of visualising complex datasets [52,53].
2.2.3. Cross-Sectional and Time-Series Analysis
In this study, two types of evaluation were carried out, namely cross-sectional and time-series analysis. We compared behaviours from week 1 to 26 in 2019, 2020, and 2021, respectively, in order to look into the differences during the same period across three years. In addition, relevant data were analysed following the time series of 2020, which is not the worst pandemic year but the first year that COVID spread worldwide; 2020 also might be the year in which people panicked the most due to the fear of an unknown virus.
2.2.4. Procedure
The collected raw data were imported as input for processing, and five factors were taken into account: date, PM2.5 index, weekly changing rate of PM2.5, yearly changing rate of PM2.5, and weekly new cases of COVID. Then, the response results of the five cities, combined with relevant social events, were compared to examine the relationships among them, i.e., whether the epidemic impacted air quality, as well as other research questions mentioned in Section 1. The workflow is as follows.
- (a)
- Collecting relevant raw data from multiple sources.
- (b)
- Data filtering and formatting to process all collected data, deal with invalid values, etc., and then format and import the data file for graph generation.
- (c)
- Comparing visual results via observation and statistics.
- (d)
- Discussion of findings according to the hypotheses.
3. Results and Discussion
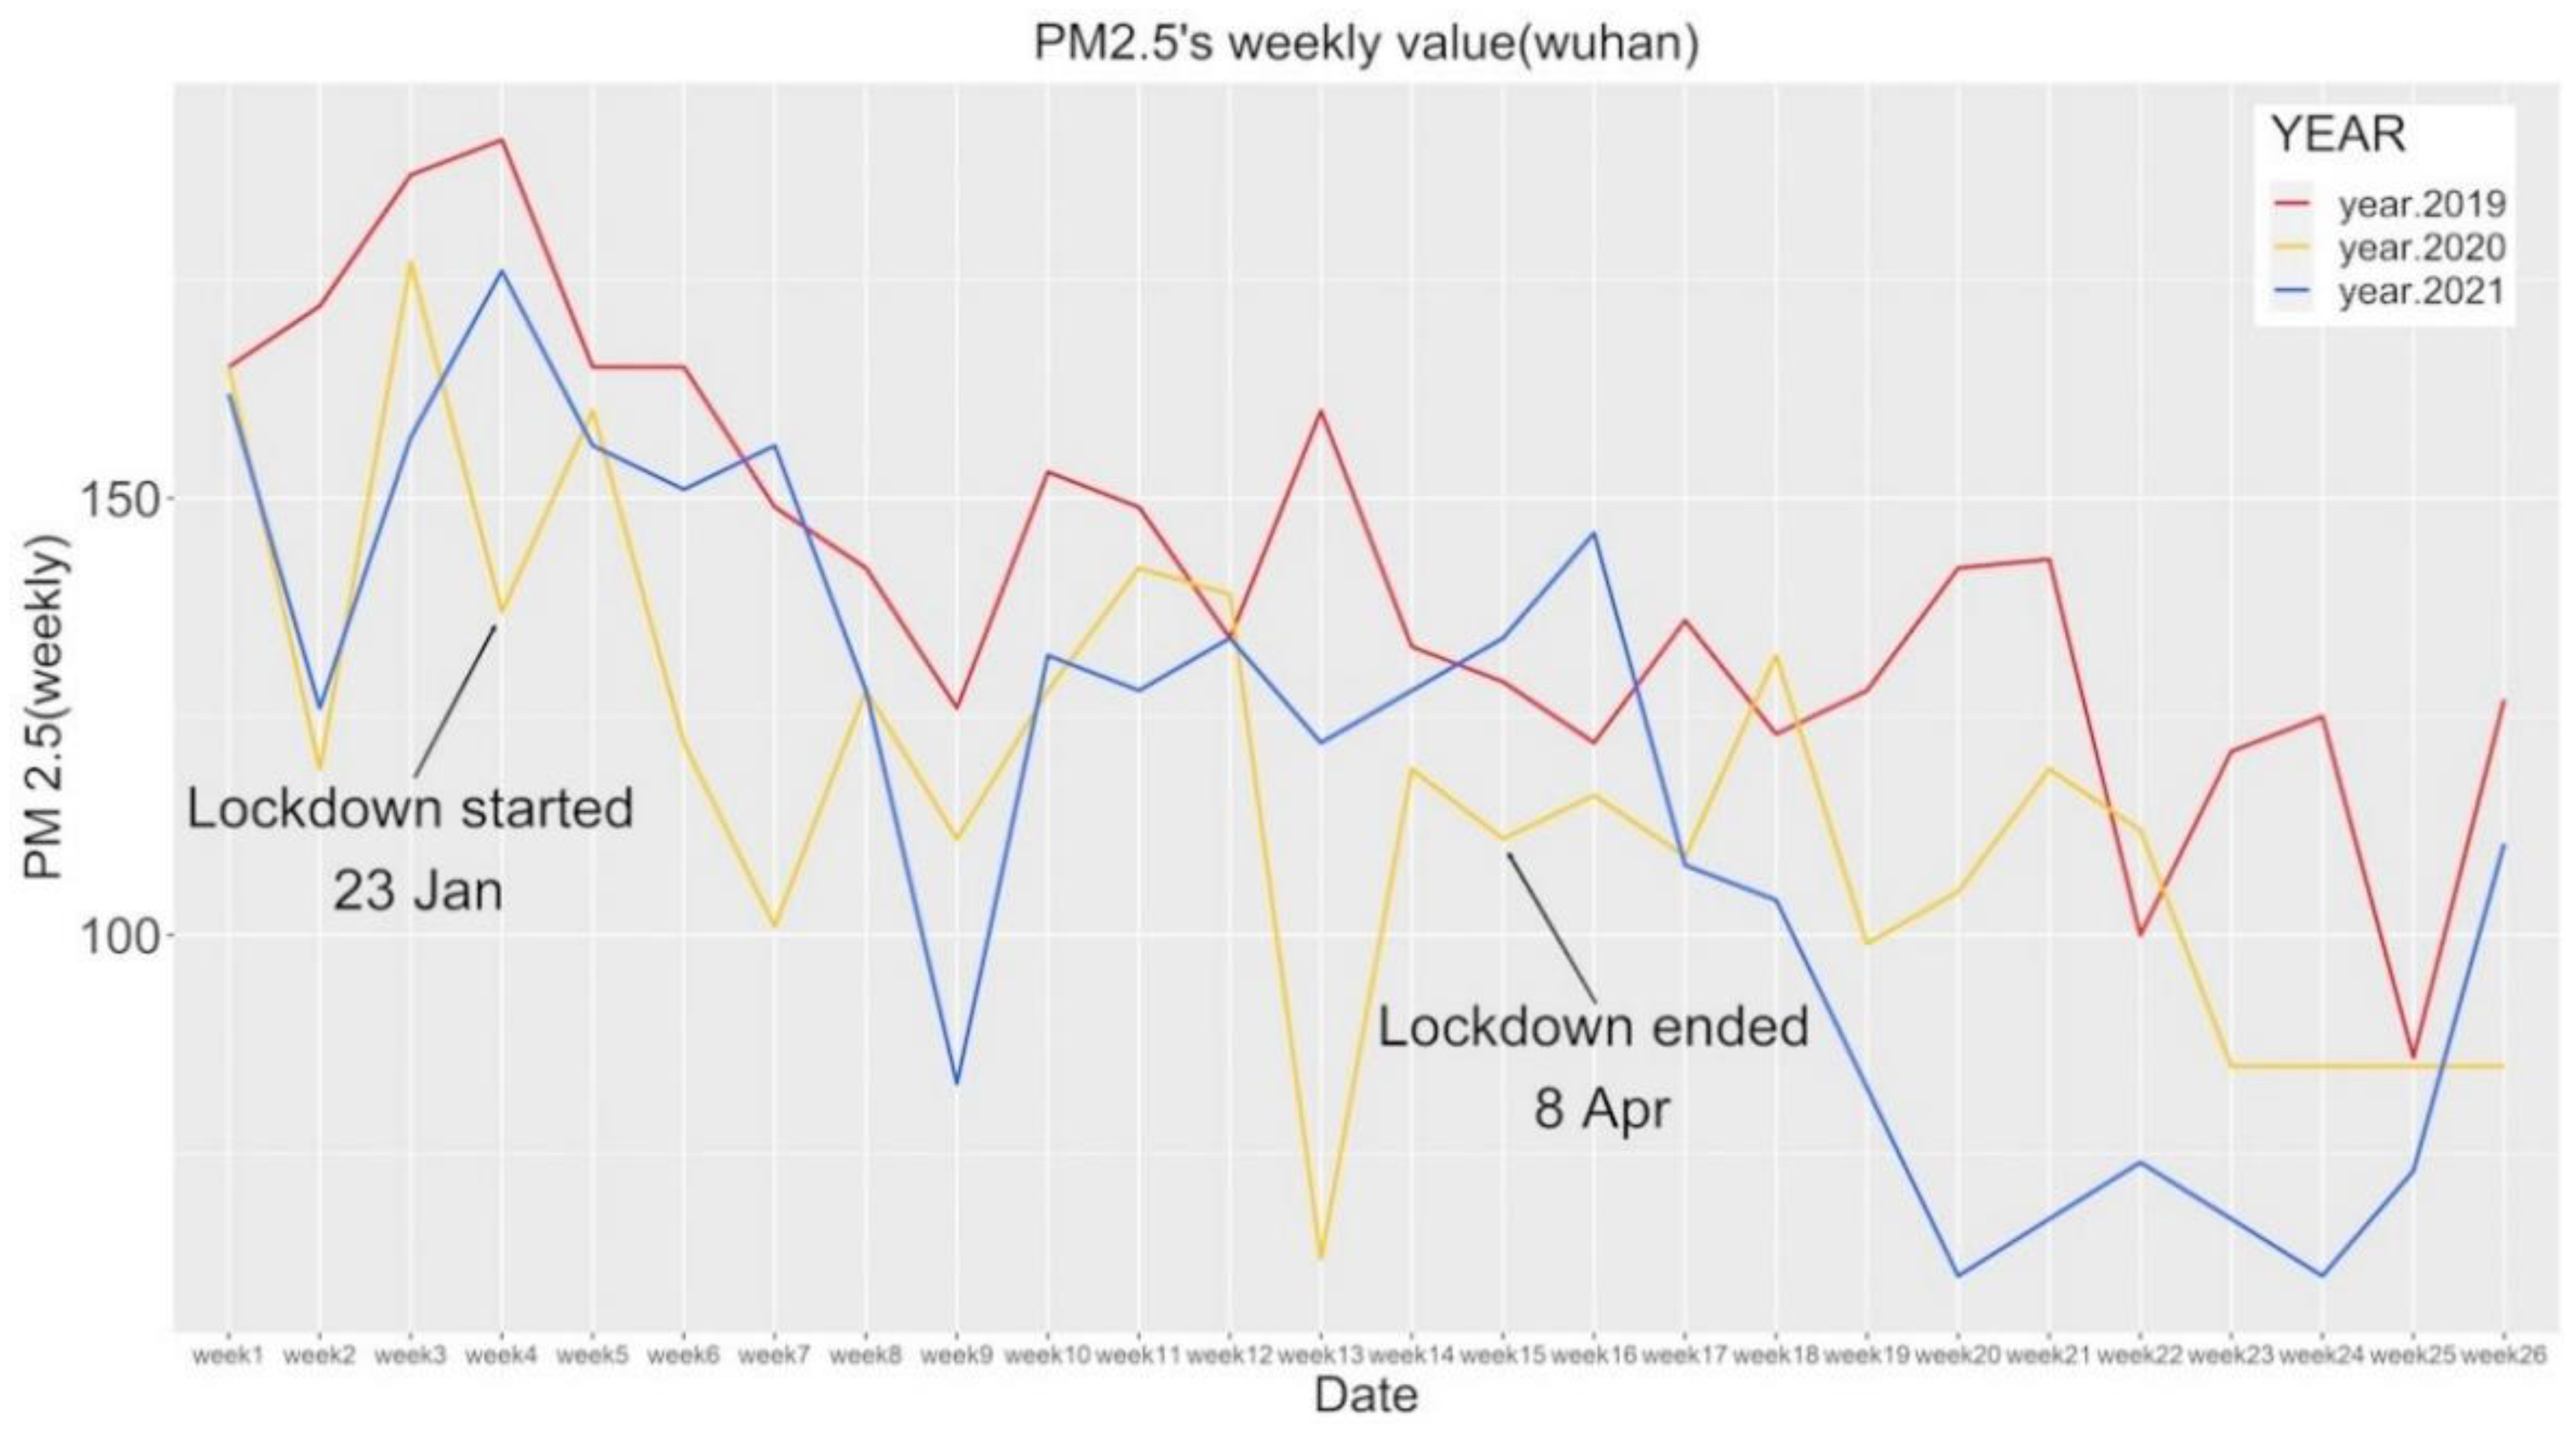
In the experiments, five factors were compared across five cities based on data for first six months of 2019, 2020, and 2021 for cross-sectional analysis. Time-series analysis was performed by importing relevant social events from the five representative cities in 2020. Figure 1, Figure 2, Figure 3, Figure 4 and Figure 5 show the weekly median values of the PM2.5 index for the five cities from January to June in 2019, 2020, and 2021. Some statistics regarding PM2.5 values are presented below.
As seen in Figure 1, Wuhan’s PM2.5 levels in 2020 was significantly lower than in 2019; only weeks 12, 18, and 22 out of 26 weeks had higher PM2.5 values in 2020 than in 2019, with lower values than in 2019 for all other weeks. During the same period, compared with 2019 PM2.5 values, in 2020, the proportion of weeks with declining PM2.5 values was 88.5%, and that of increasing week was 11.5%. Additionally, compared with same period in 2019, in 2021, the proportion of weeks with declining and increasing PM2.5 values was 84.6% and 11.5%, respectively. Comparing 2020 and 2021 data, the proportion of weeks with declining and increasing PM2.5 values was 57.7% and 38.5%, respectively. Furthermore, the yearly PM2.5 value dropped by 16.03% between 2019 and 2020 and decreased by 18.02% between 2019 and 2021.
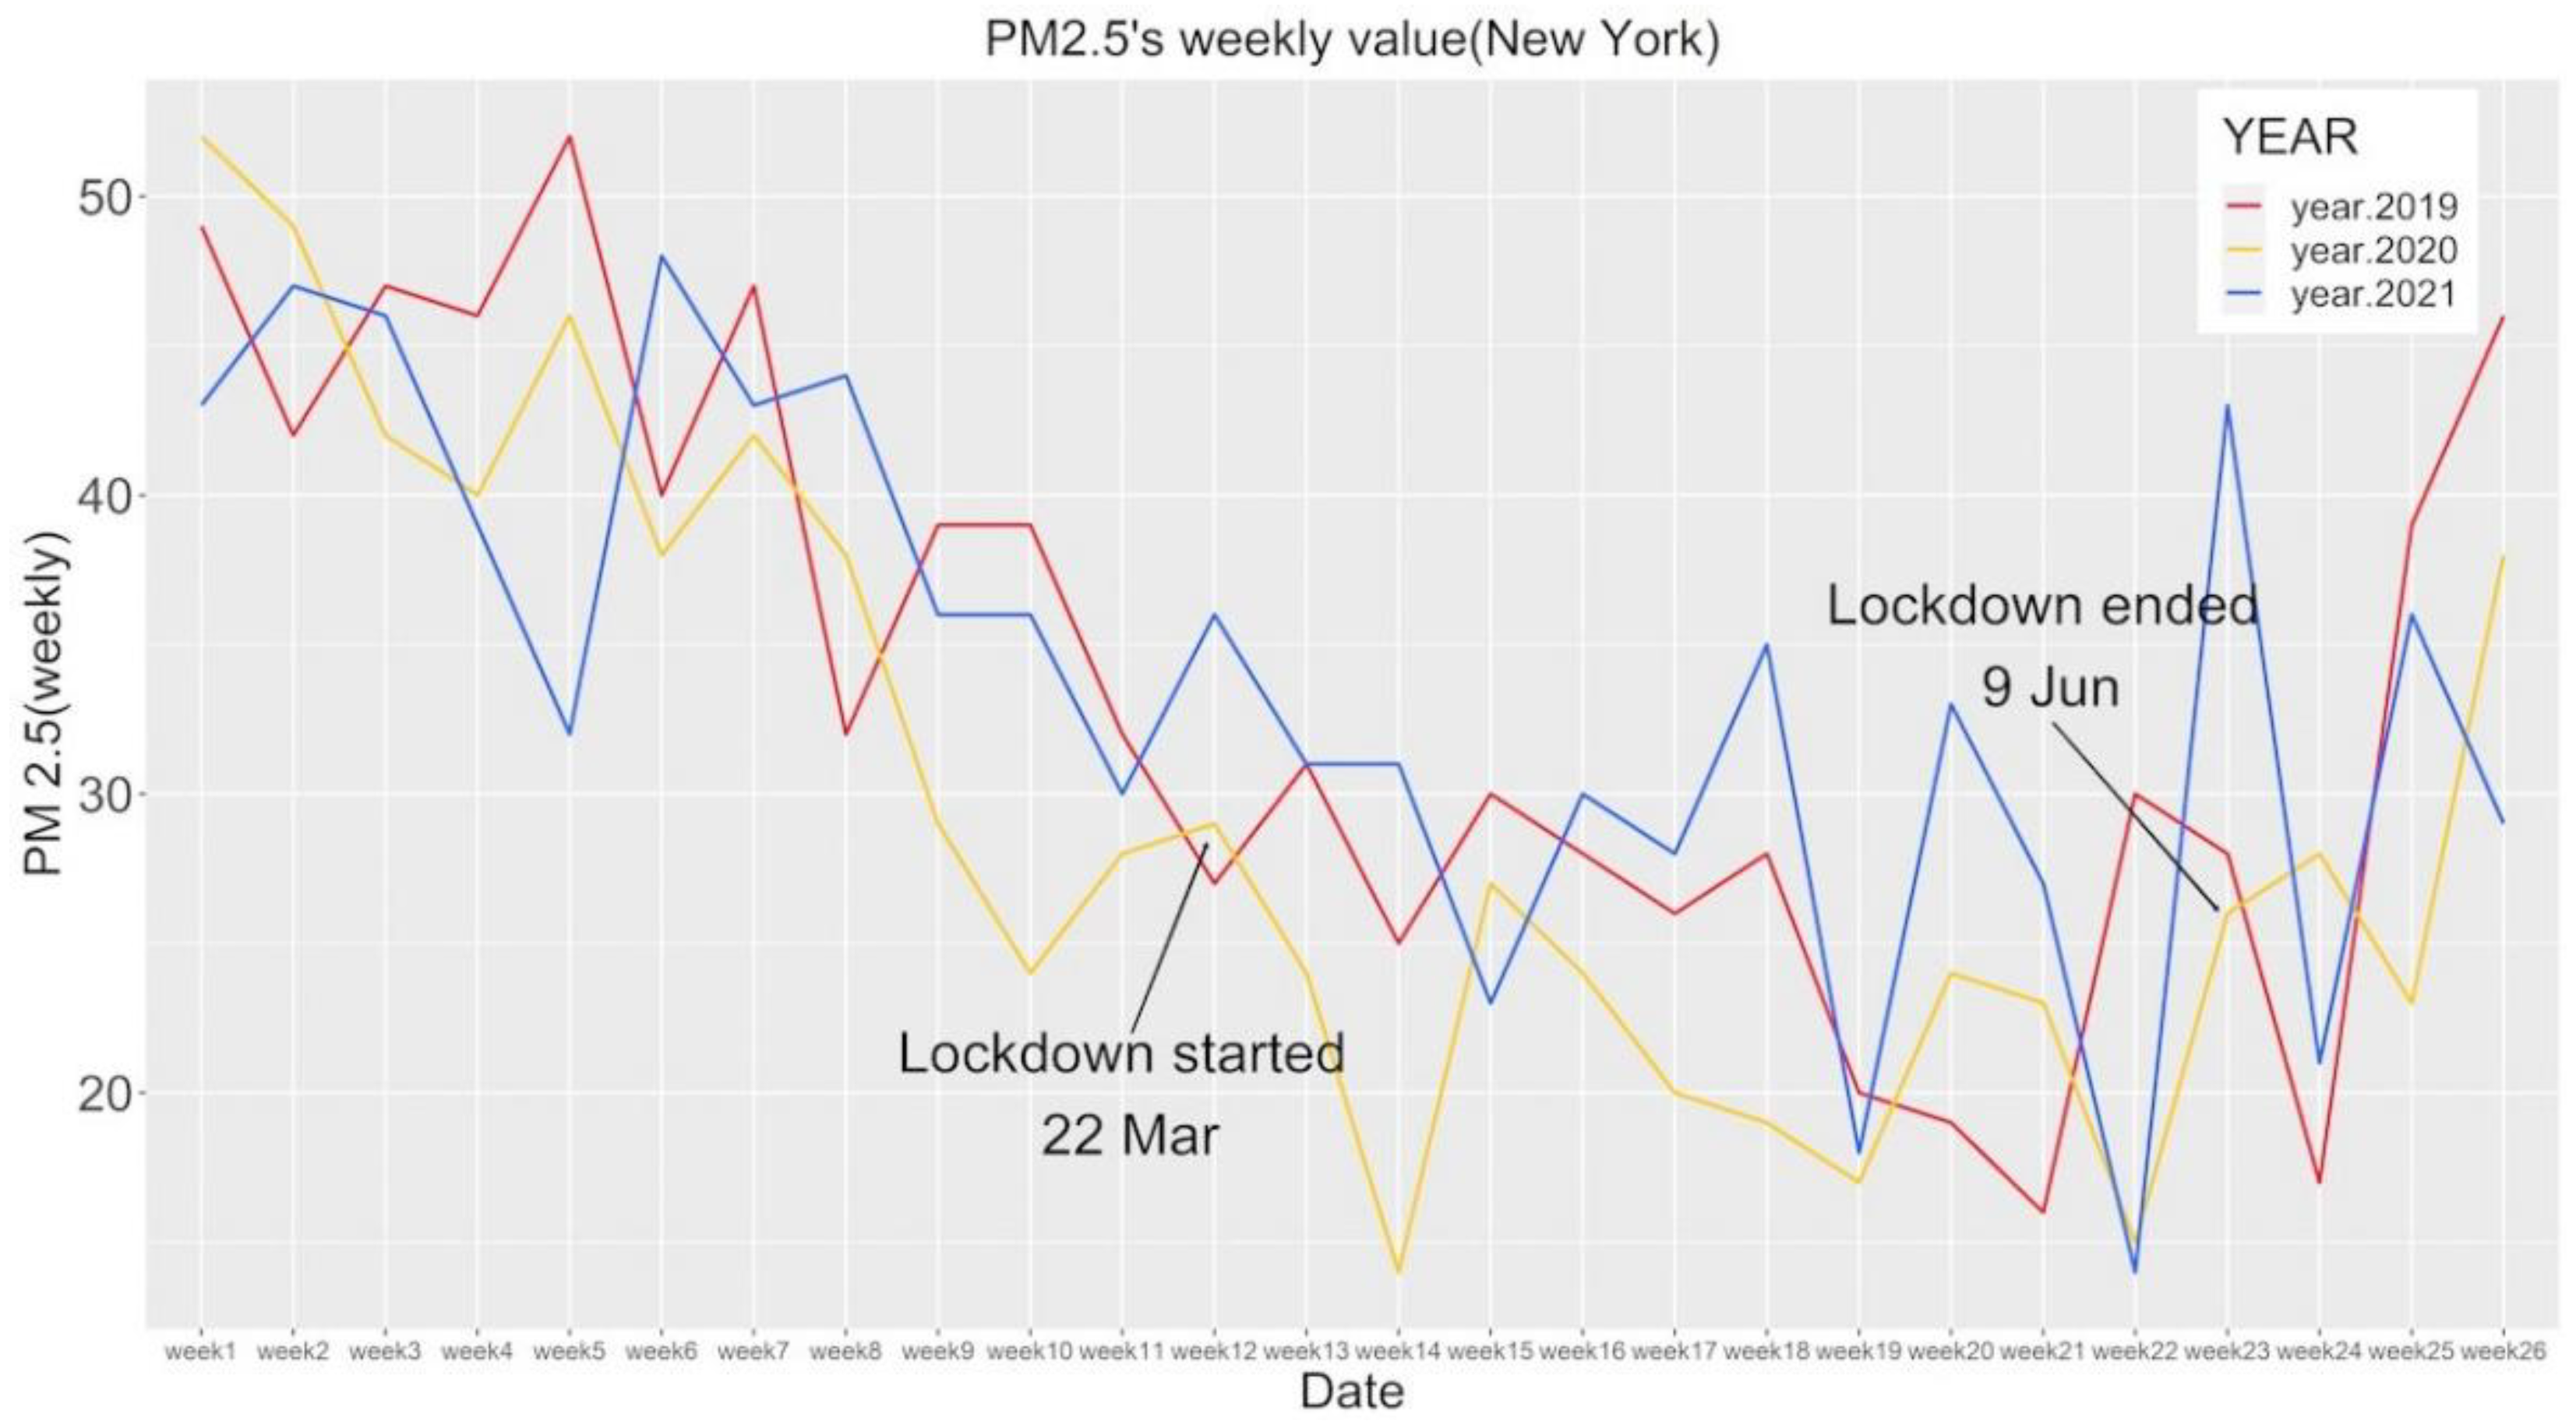
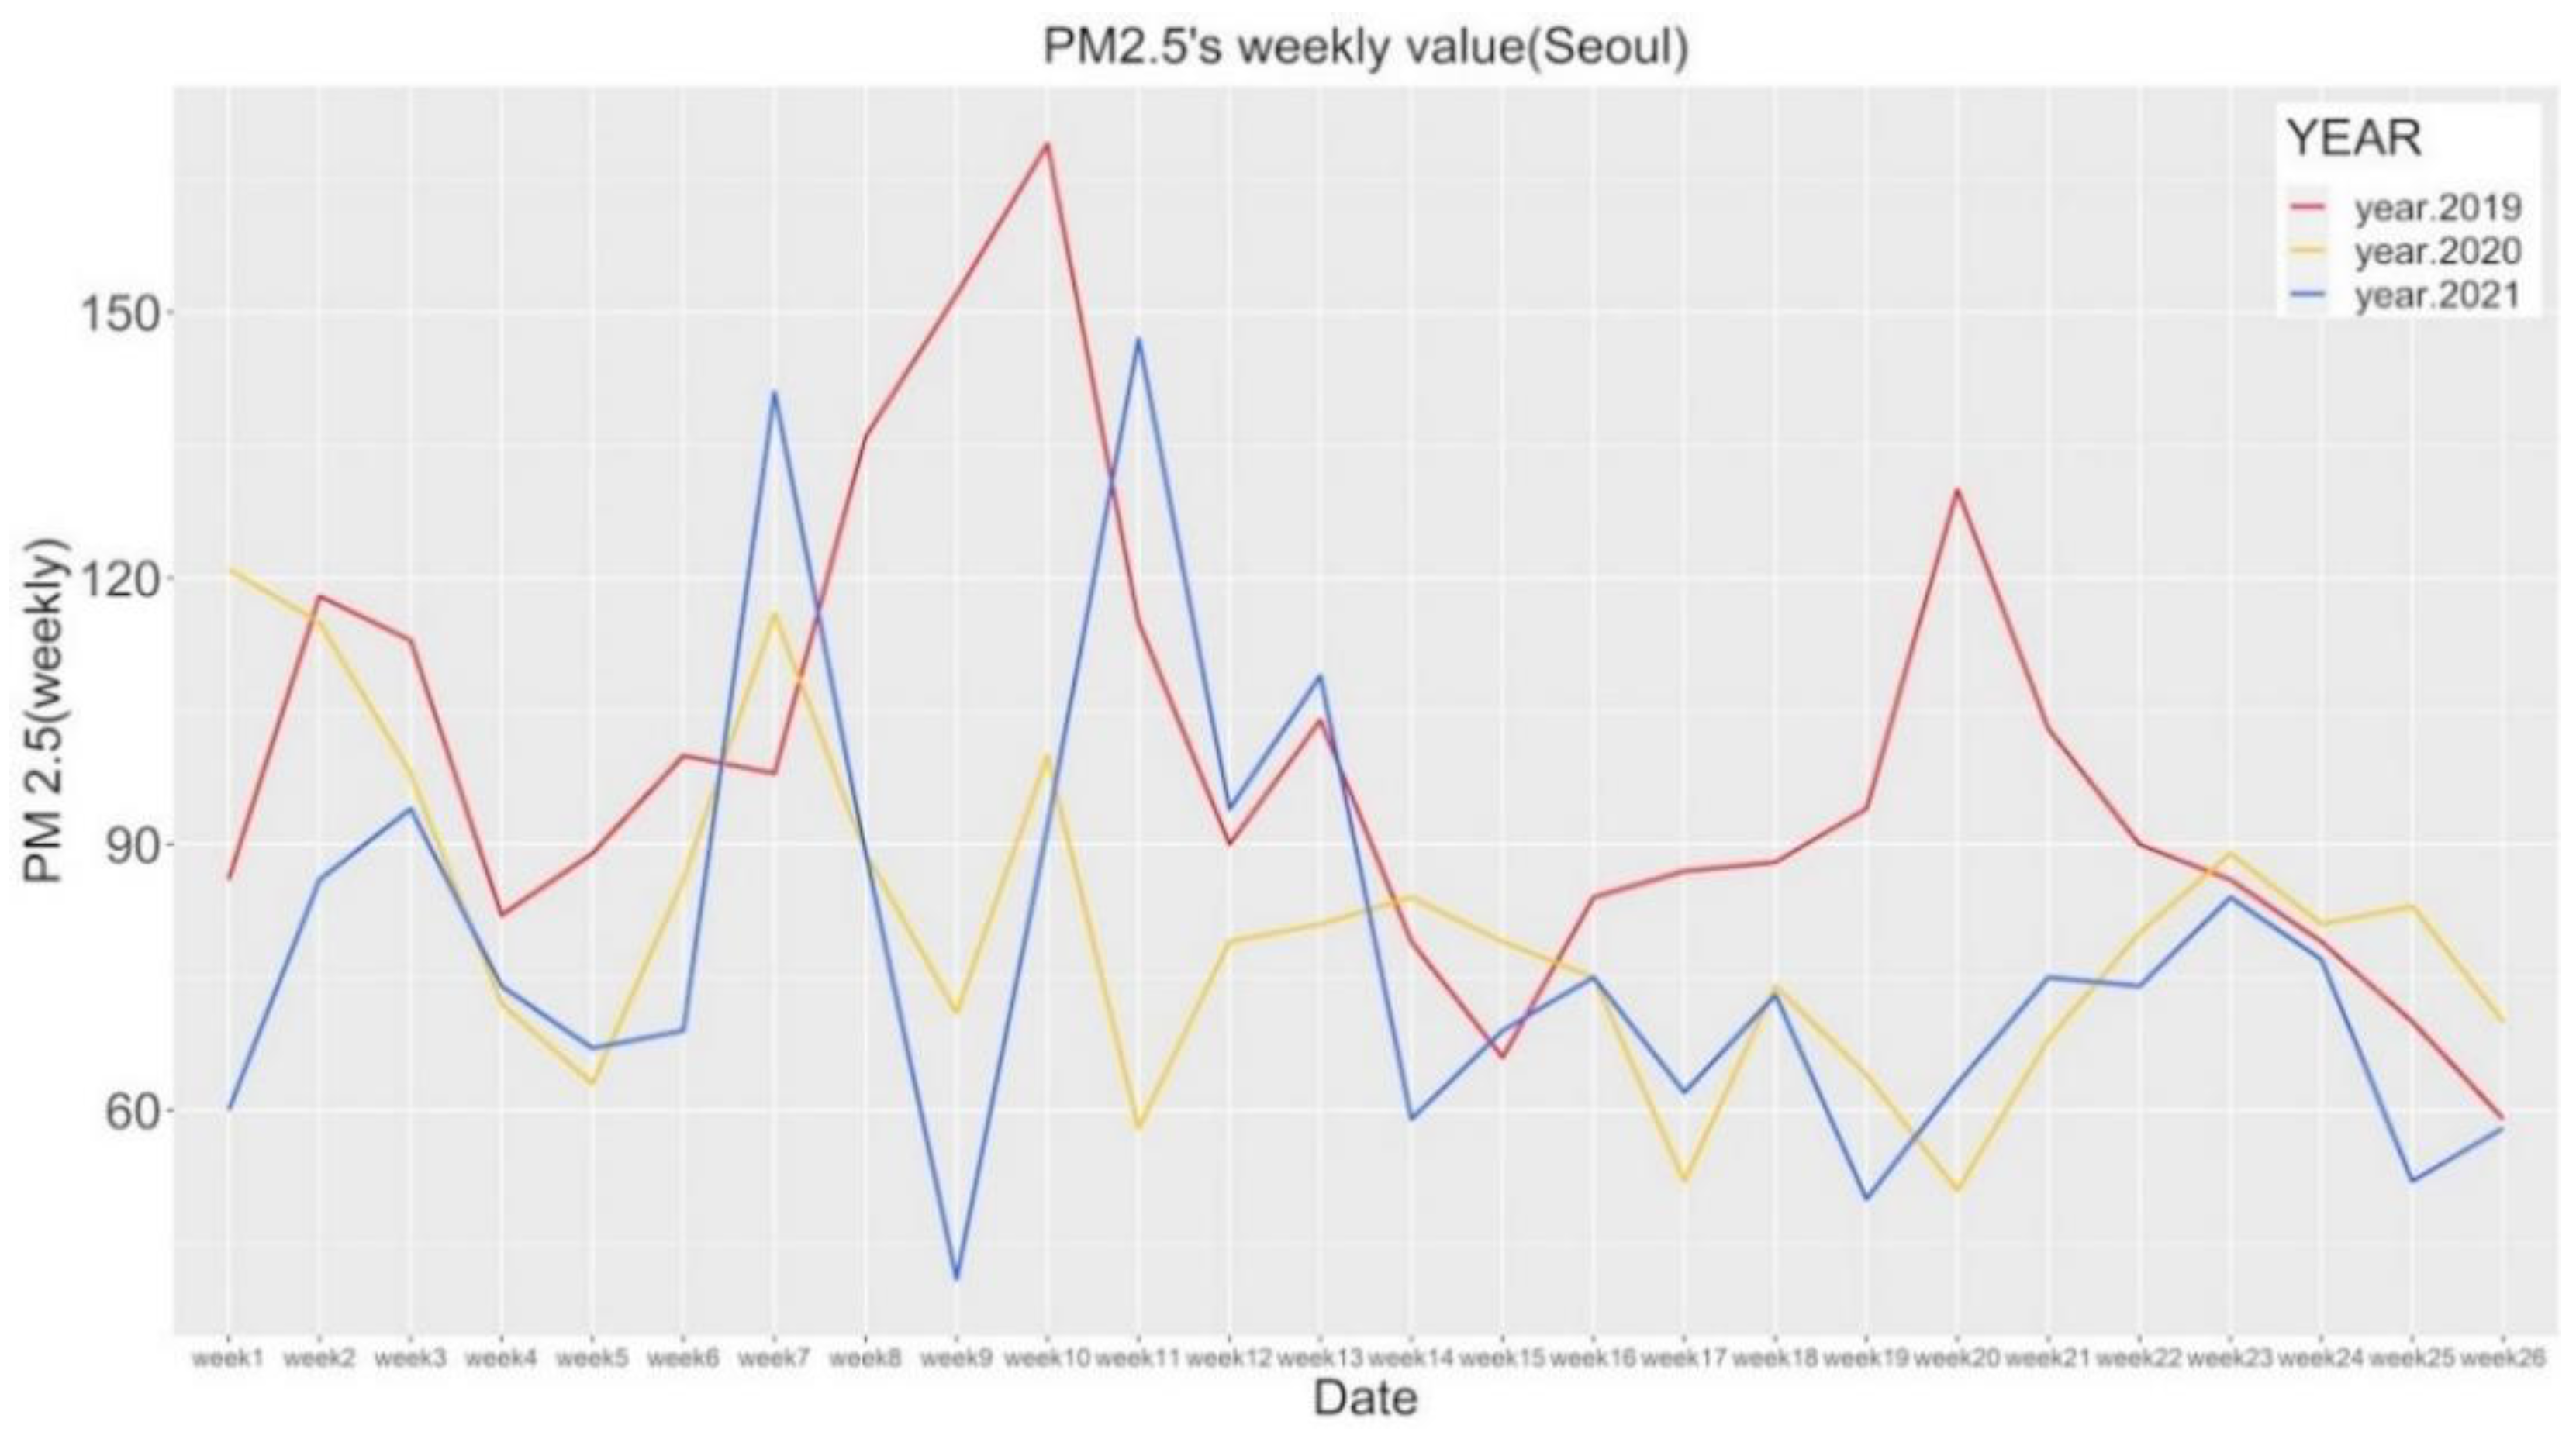
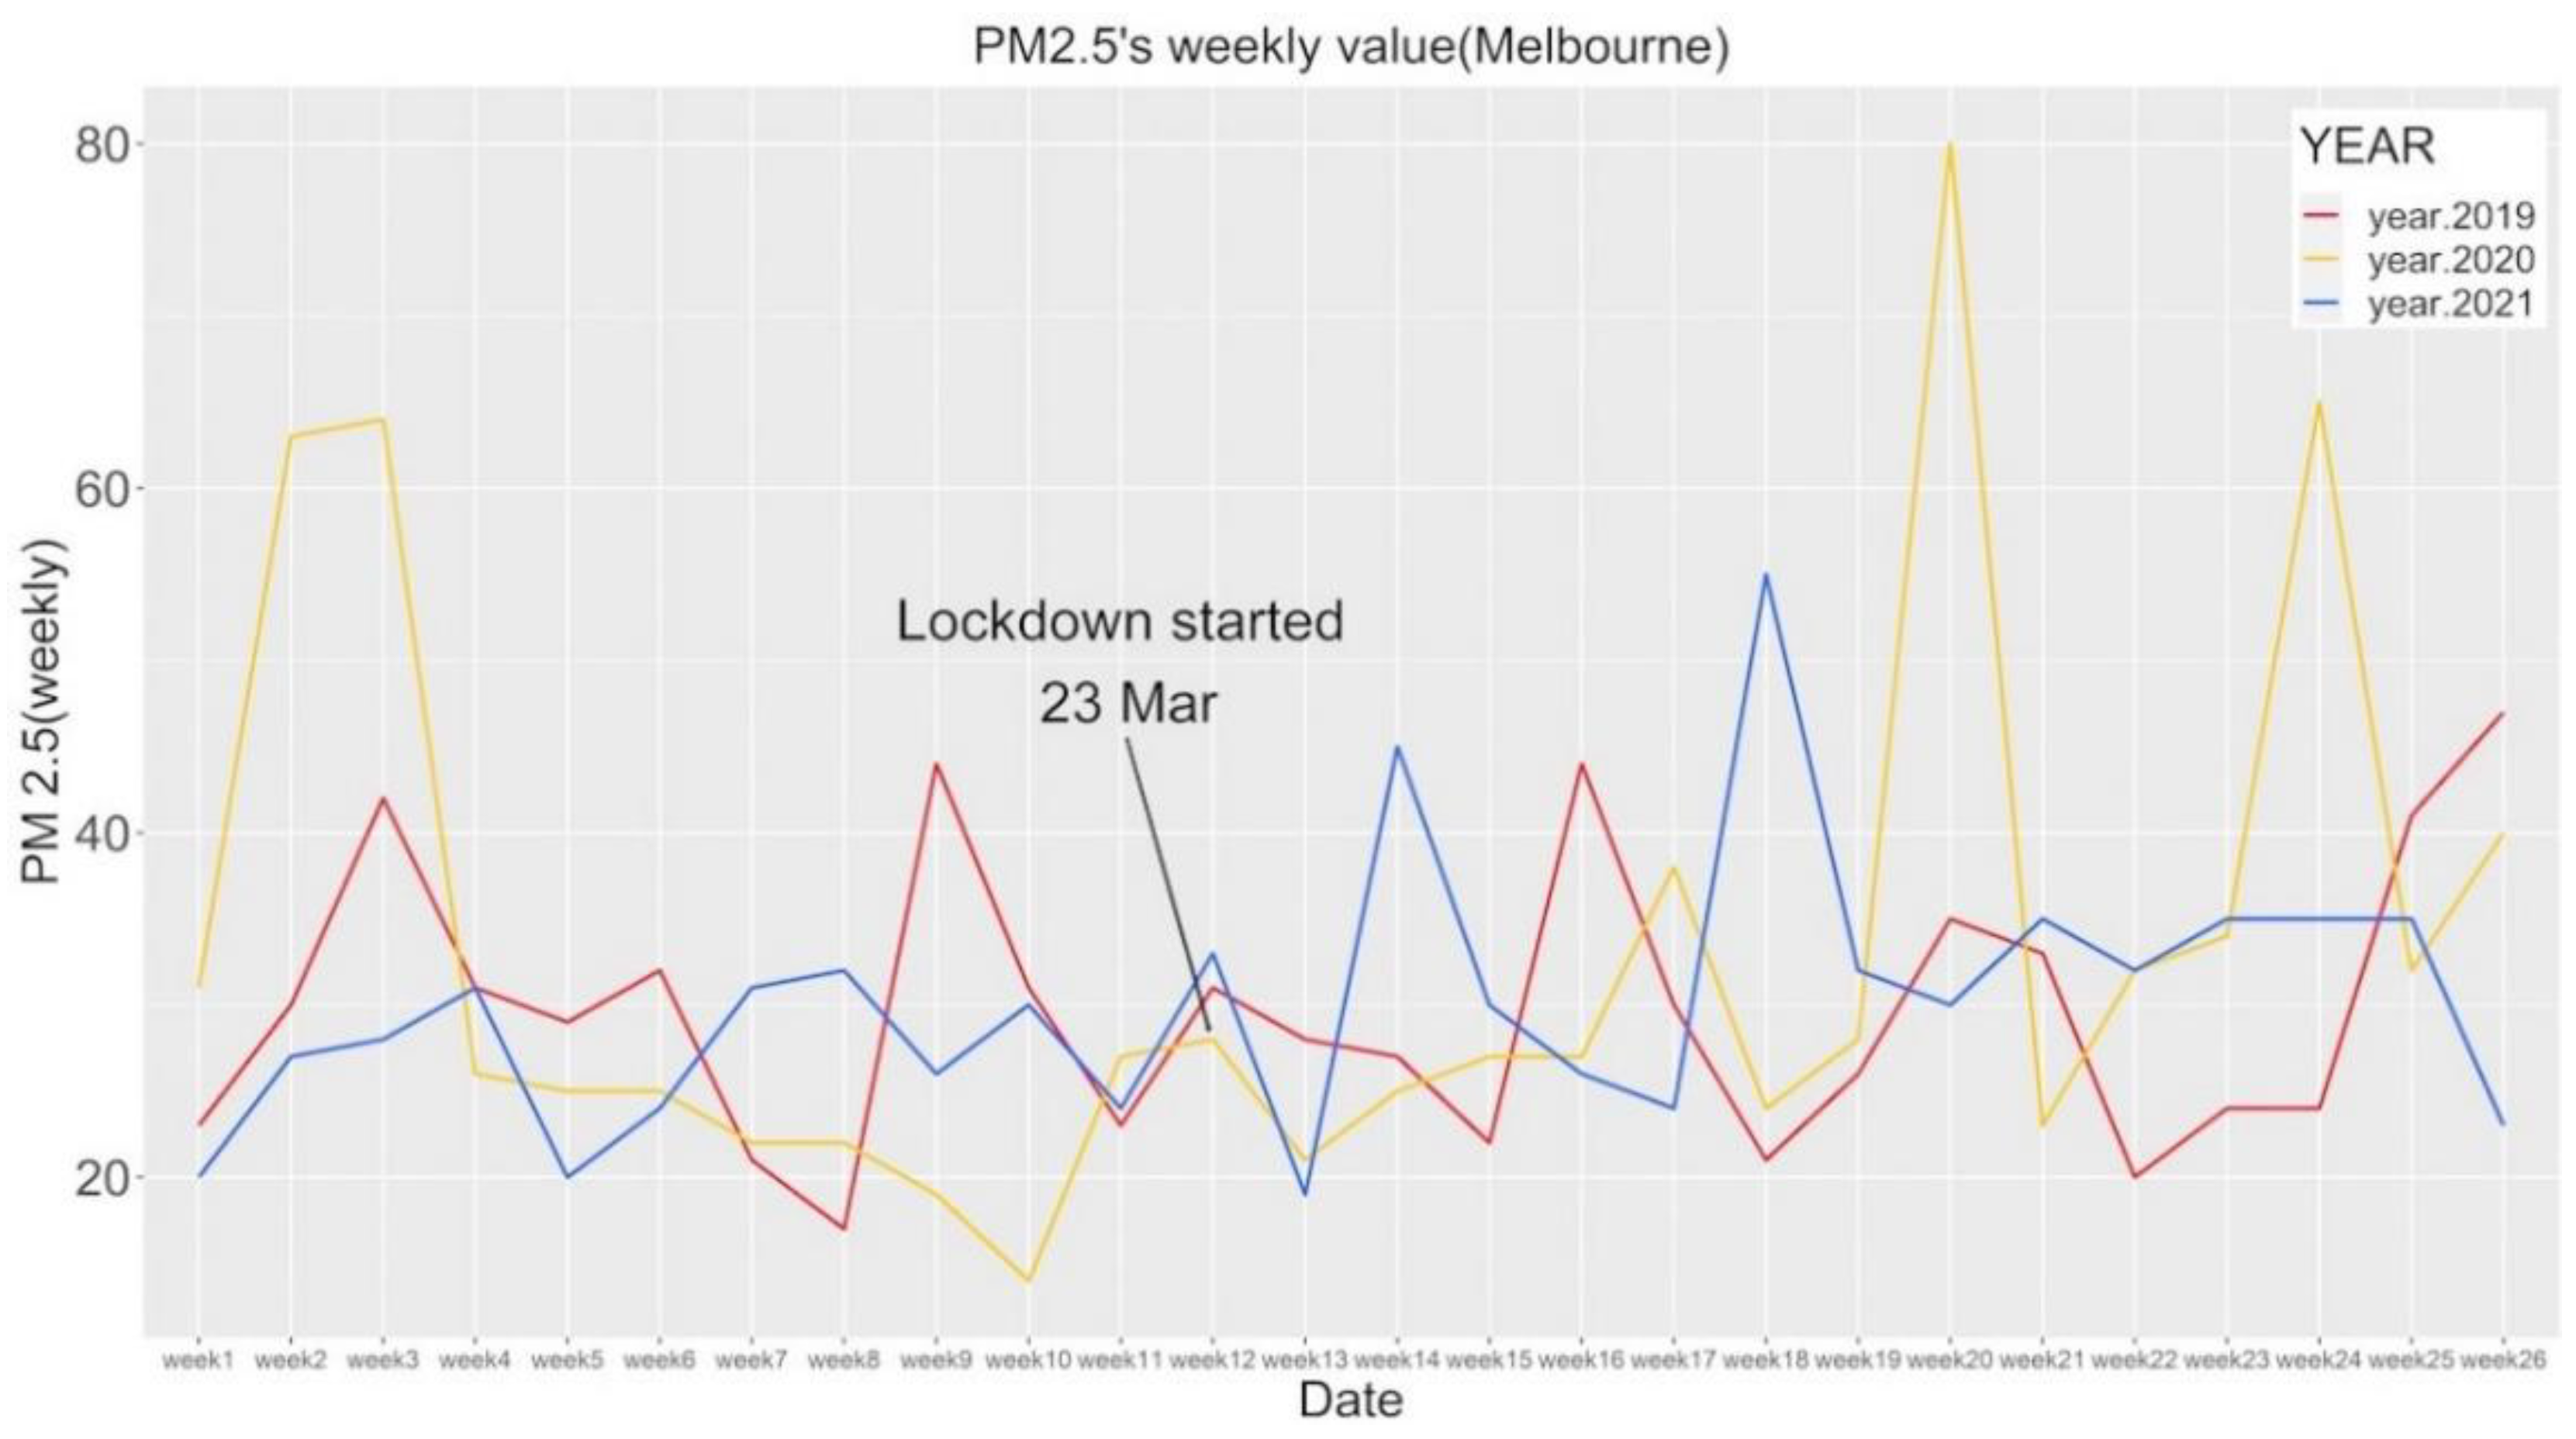
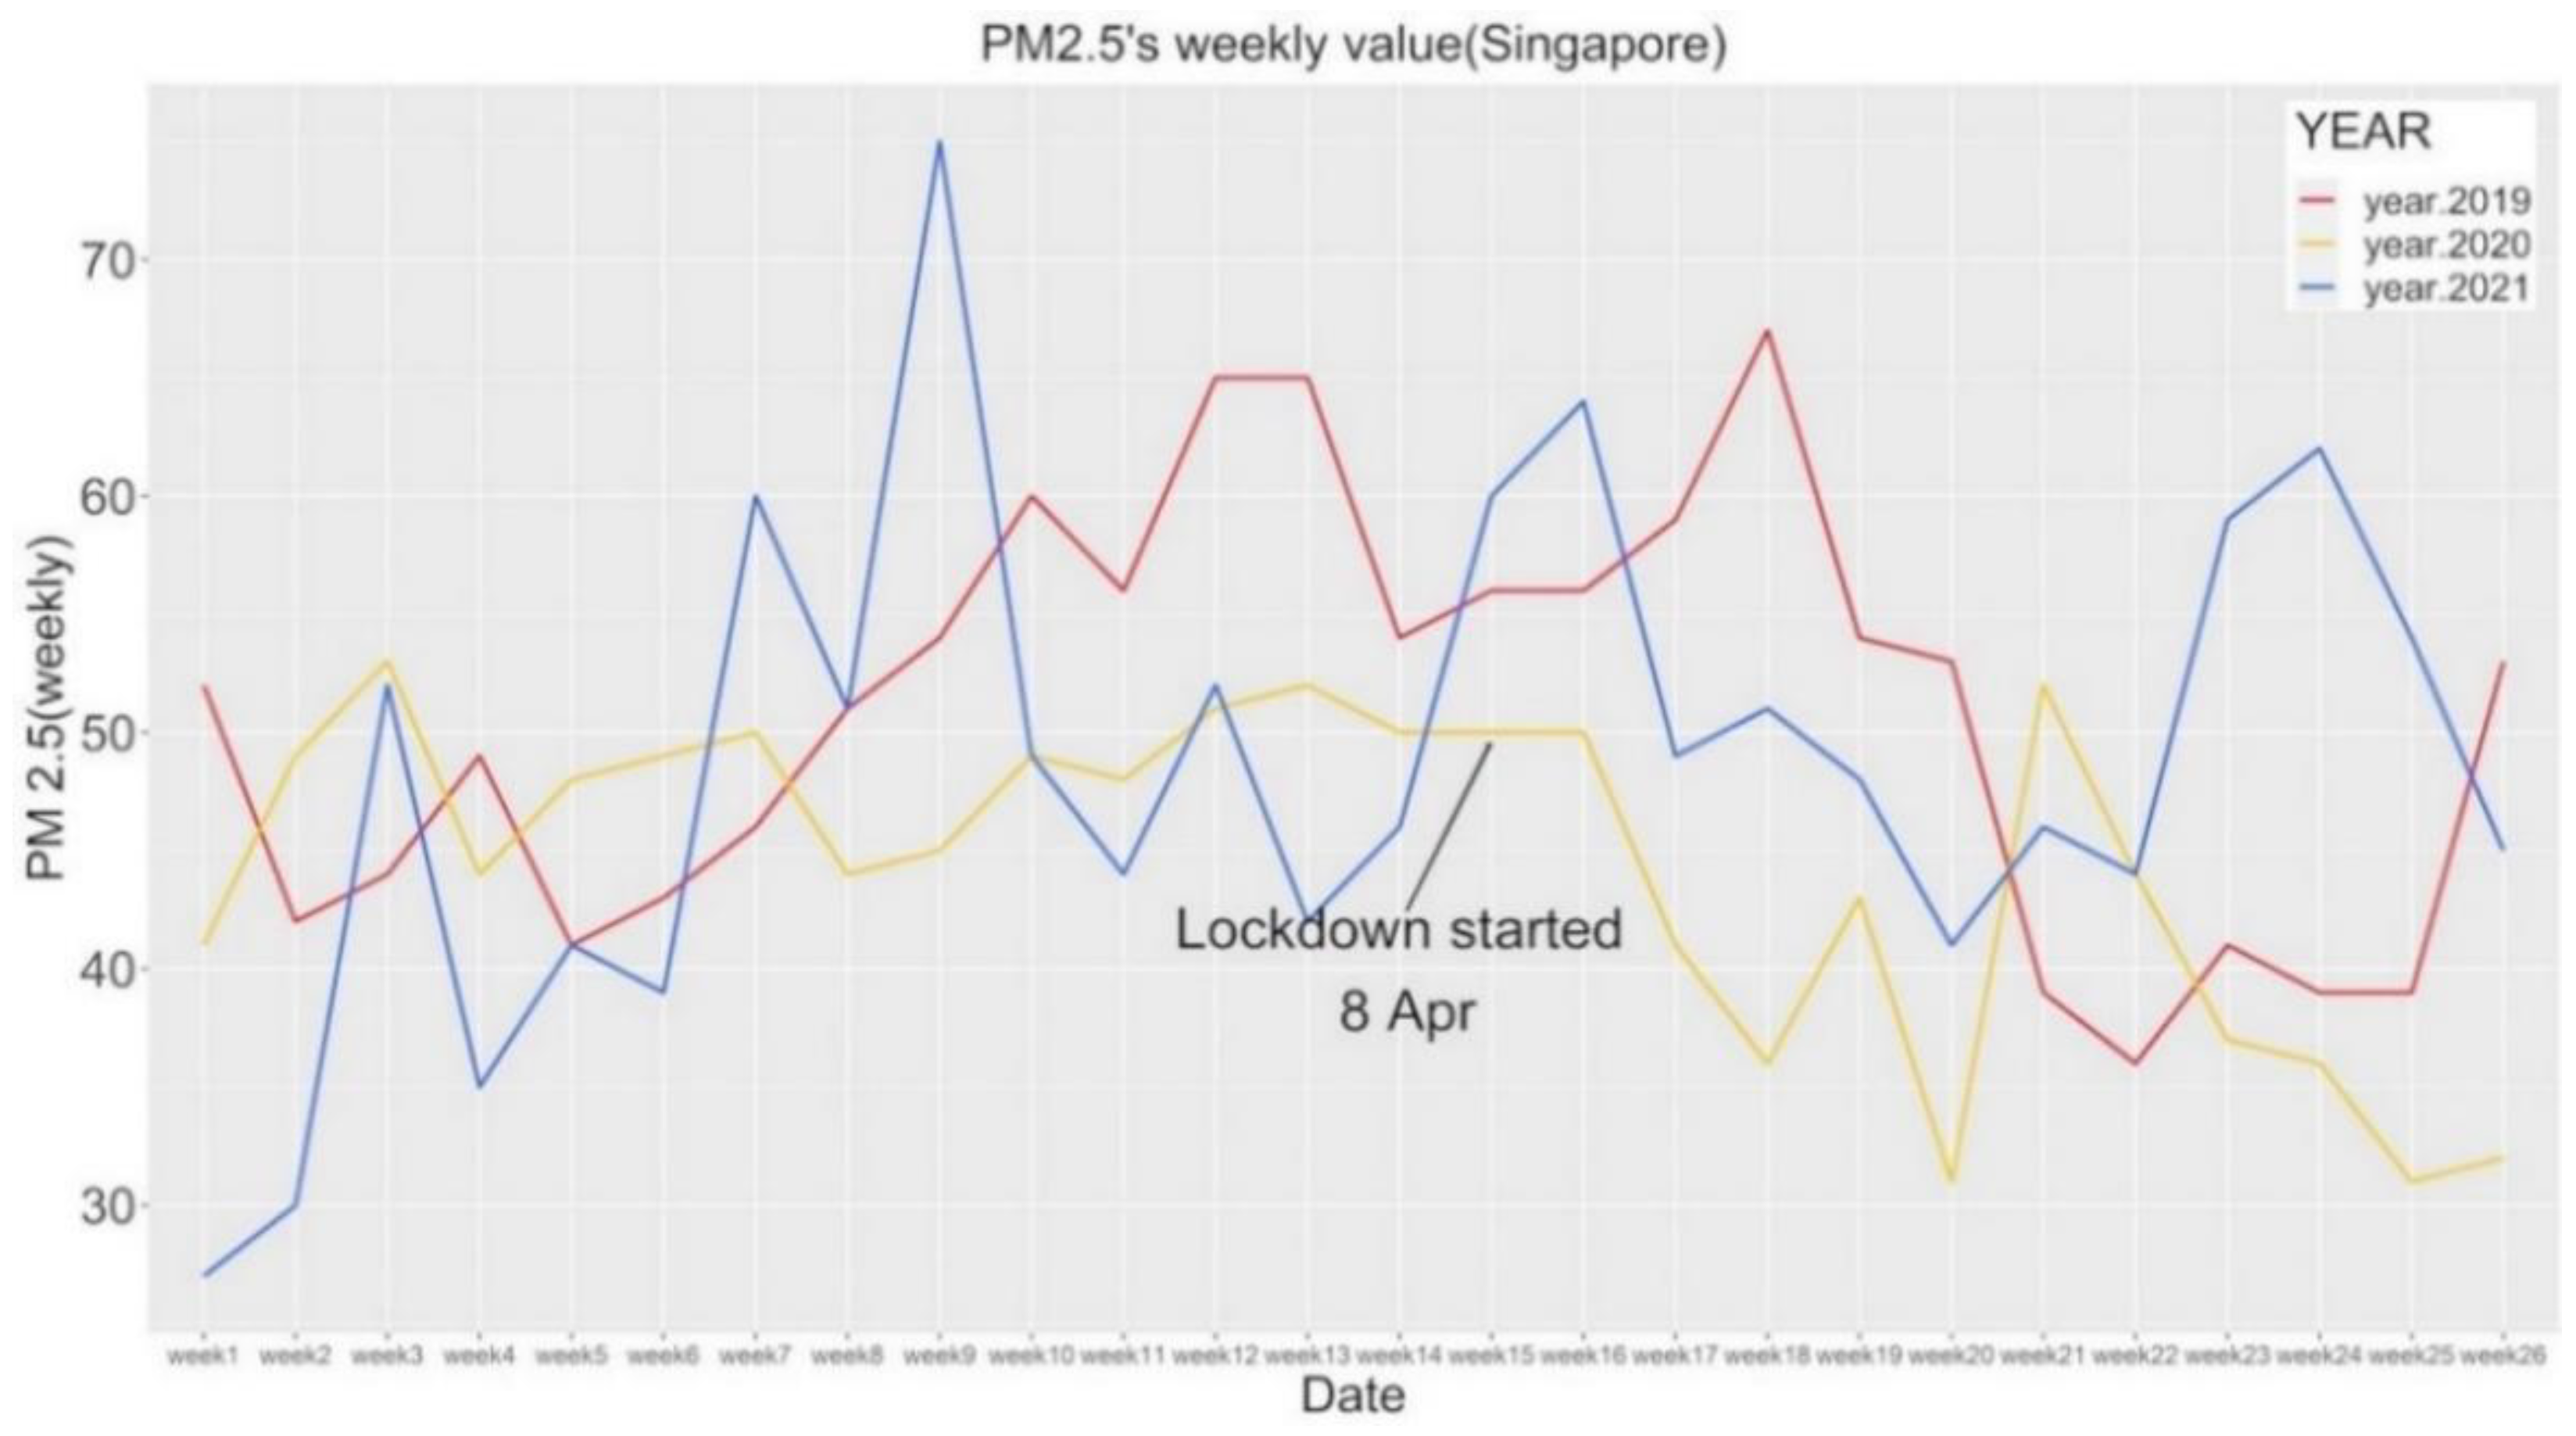
Figure 2, Figure 3, Figure 4 and Figure 5 show that from the perspective of weekly PM2.5 values, compared to the values of each week in the first 26 weeks in 2019, for the first 26 weeks in 2020: PM2.5 values fell in 73% of weeks and rose in 27% of weeks in New York; the proportion of weeks with declining and increasing PM2.5 values was 69.2% and 30.8%, respectively, in Seoul; in Melbourne, the proportion of weeks with declining and increasing PM2.5 values was 46.2% and 53.8%, respectively; and in Singapore, the proportion of weeks with declining and increasing PM2.5 values was 73% 27%, respectively.
Regarding the yearly PM2.5 value, it was found that the PM2.5 level in 2020 was significantly lower than that in 2019 during the same period, with reductions ranging from 8.48% to 13.85%, except for Melbourne (its data shows that PM2.5 levels in 2020 were higher than those in 2019 during the same period for most weeks). However, between 2019 and 2021, PM2.5 values declined only in Asian cities (Wuhan, Seoul, and Singapore; there was a slight drop in Singapore); and between 2020 and 2021, although PM2.5 yearly values rose in all five cities, the values for Wuhan and Seoul remained relatively at the same levels. Details can be referred to in Table 3. The PM2.5 indices of Wuhan, New York, Singapore, and Seoul all exhibited similar trend during the pandemic. When the outbreak was severe or the number of new cases increased, the PM2.5 index decreased, especially during periods of city closures. In addition, in most cases, after the pandemic situation had been improved or lockdowns were lifted, the PM2.5 index increased. Although Seoul did not implement a lockdown during studied period, increasing case number had a similar impact, sometimes (weeks 2–6, 8–13, and 16–22) even more significant than in Wuhan and Singapore.
Interestingly, the PM2.5 index in Melbourne seems either not to be affected by outbreak conditions or to be correlated with the outbreak negatively. When a pandemic is severe, PM2.5 values may rise; when the pandemic improves or before it gets worse, PM2.5 values may fall. For example, after Melbourne was locked down in 2020, the PM2.5 index rose to relatively high levels. PM2.5 levels even increased compared to the previous year during the same weeks and showed a downward trend before the outbreak began and before lockdown was imposed.
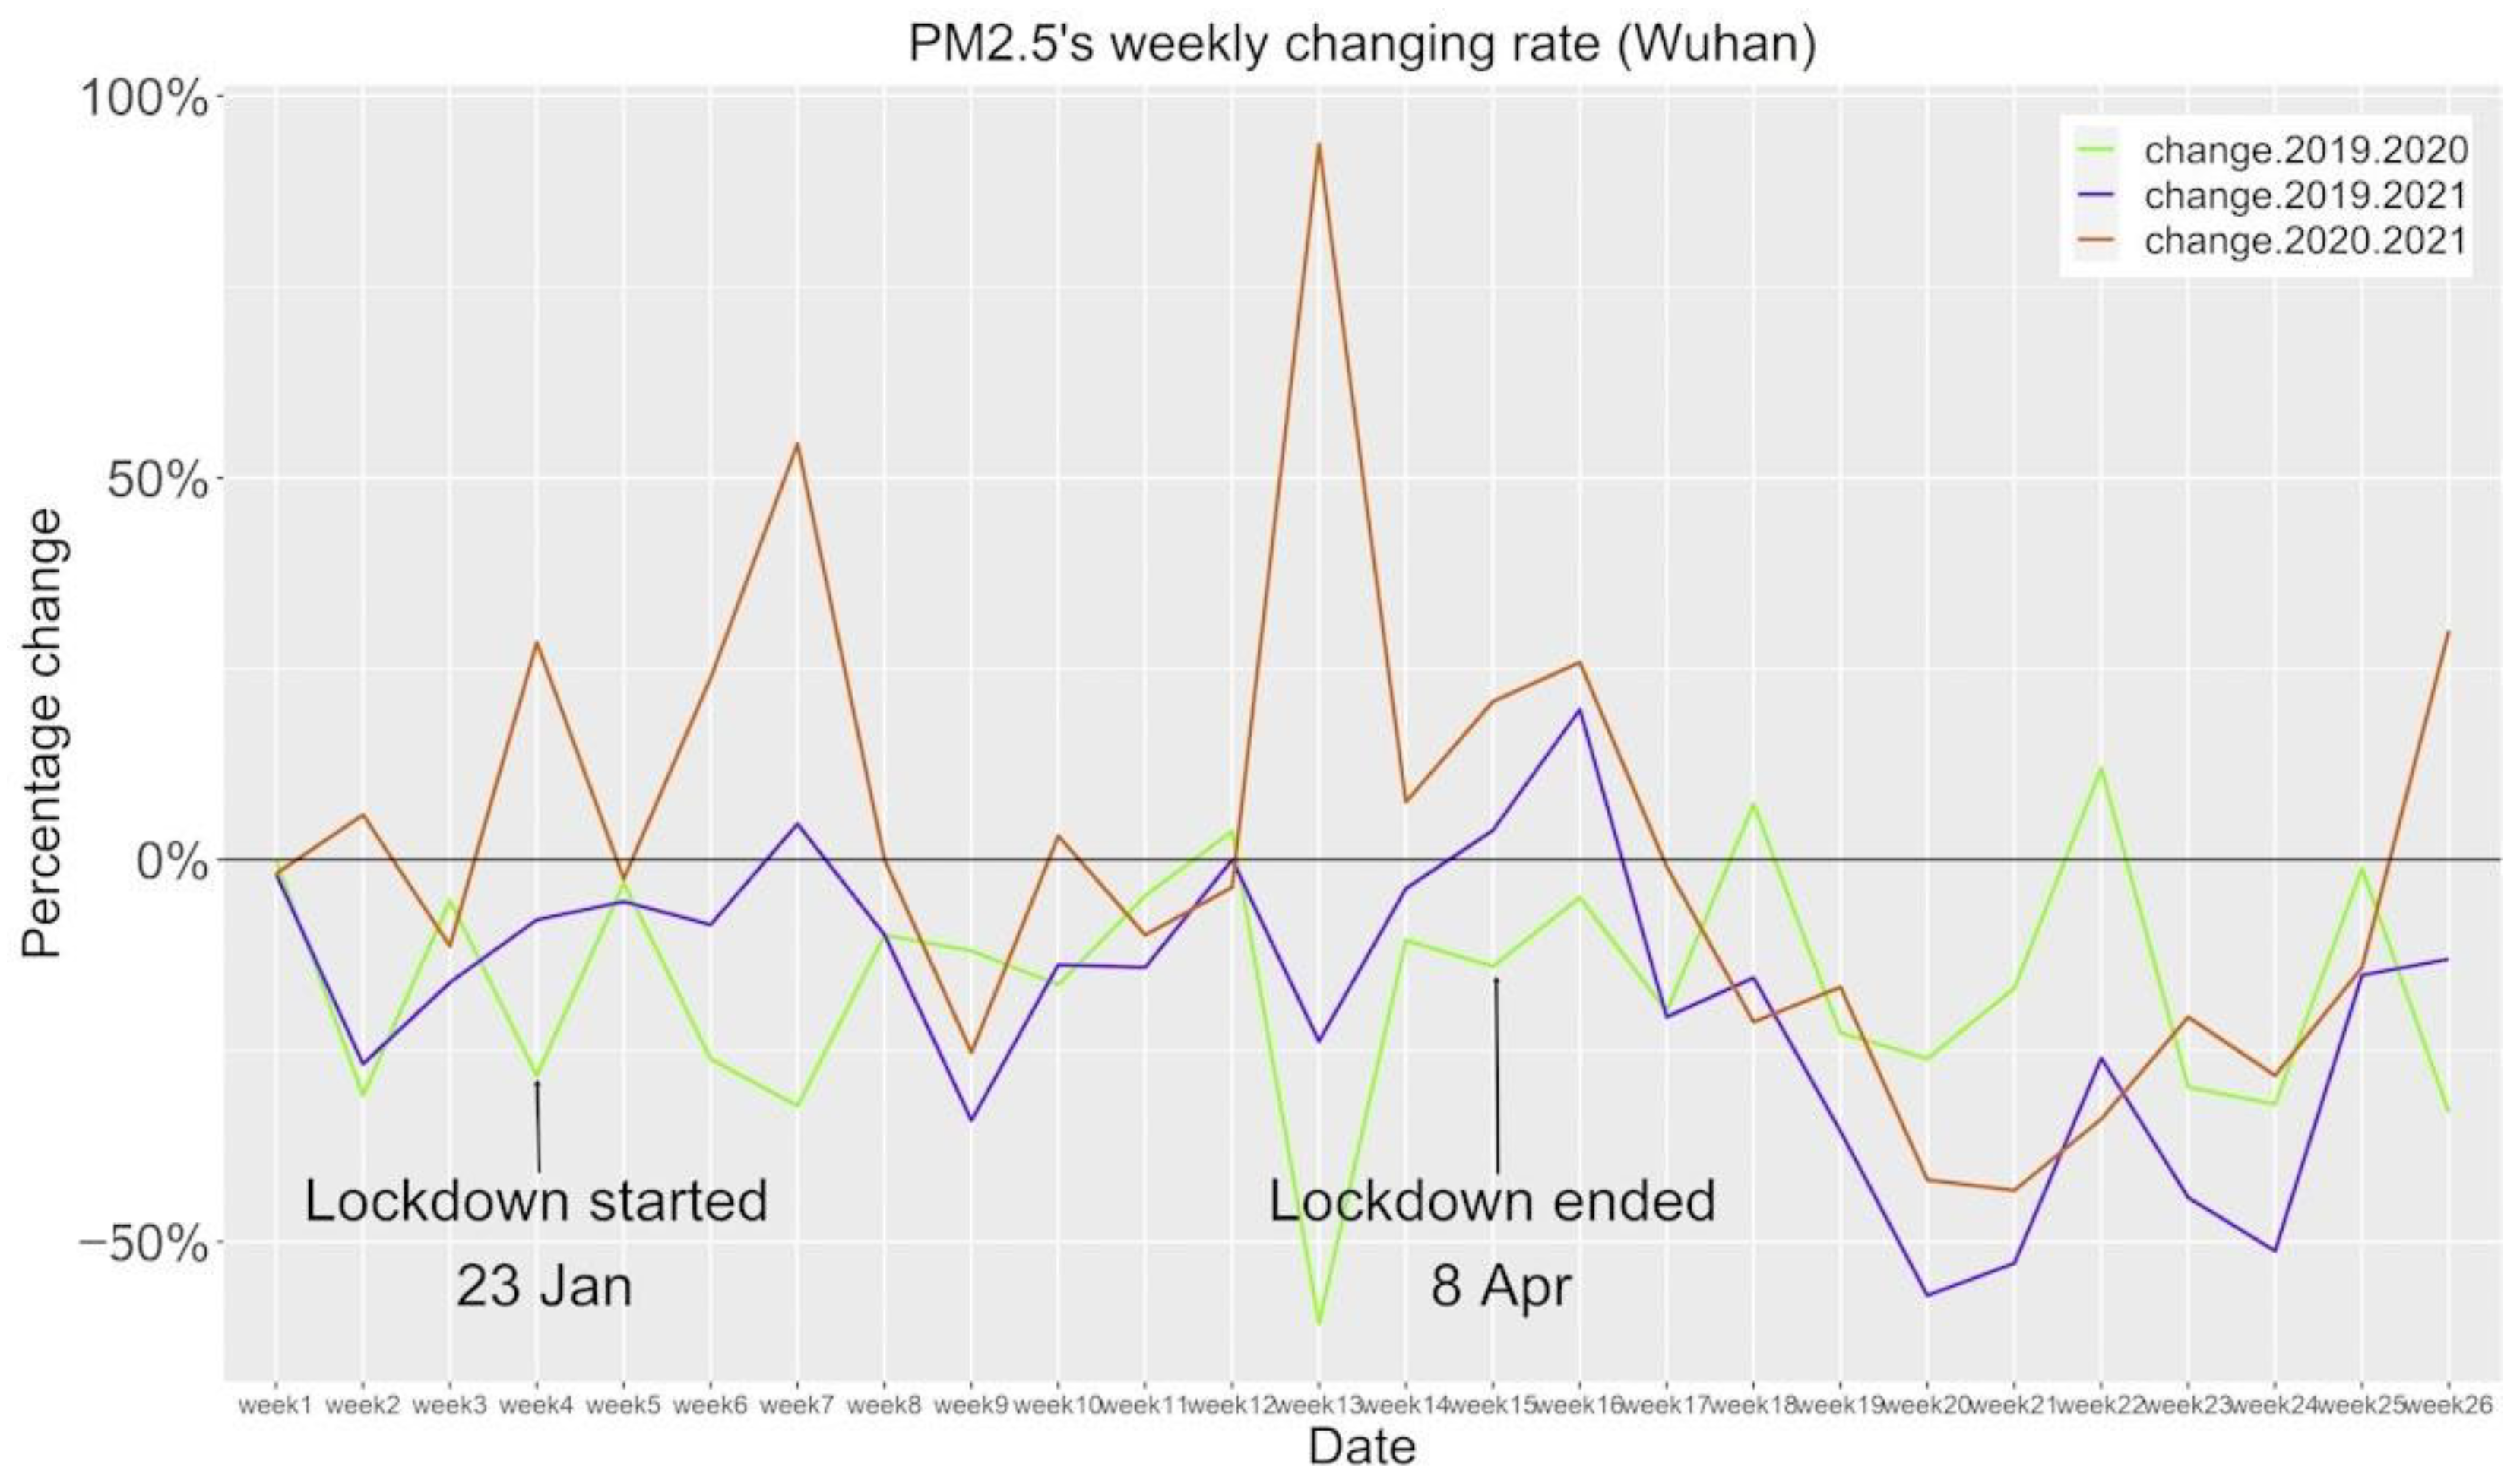
The weekly changing rate is employed to indicate the magnitude of change in PM2.5. For example, Figure 6 shows the weekly changing rate in Wuhan. The green line indicates the changing rate from 2019 to 2020. It can be seen that 23 out of 26 weeks reflect reduced PM2.5 levels in Wuhan, which means that PM2.5 levels in Wuhan were lower 88.5% of the time in the first six months of 2020 compared to the same period in 2019; in other cities, the proportion of weeks with improved air pollution was 73% in New York, 69.2% in Seoul, 46.2% in Melbourne, and 73% in Singapore. In general, the changing rates were predominantly negative in all cities, except for Melbourne, from 2019 to 2020.
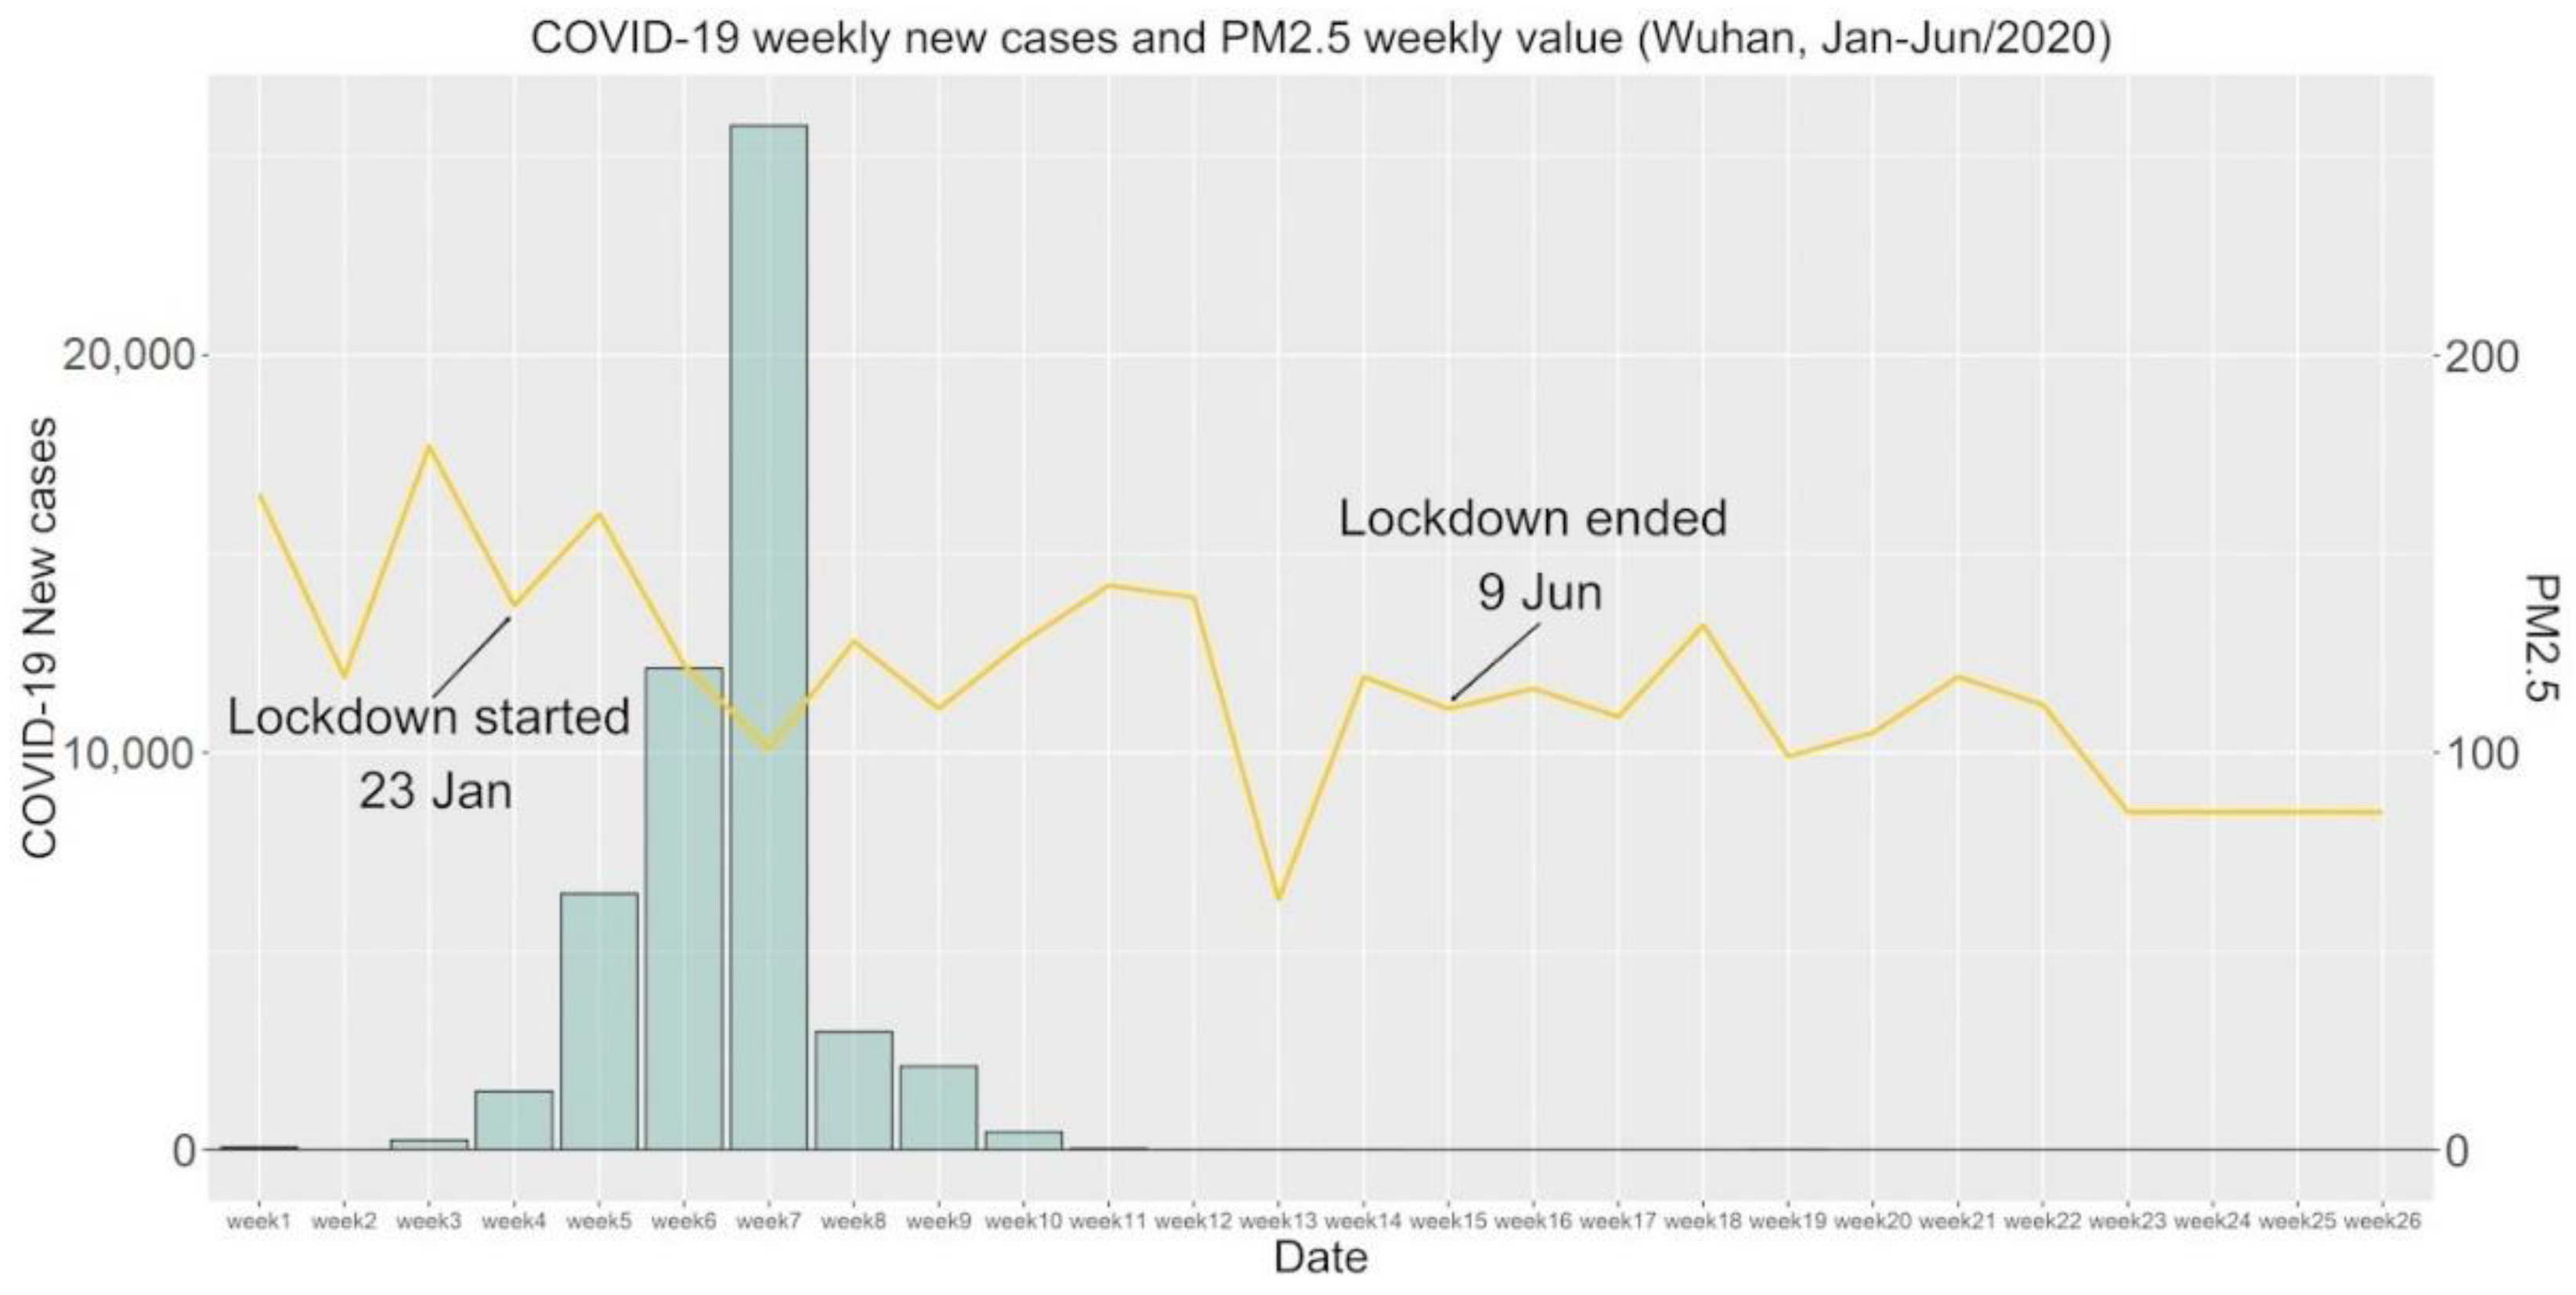
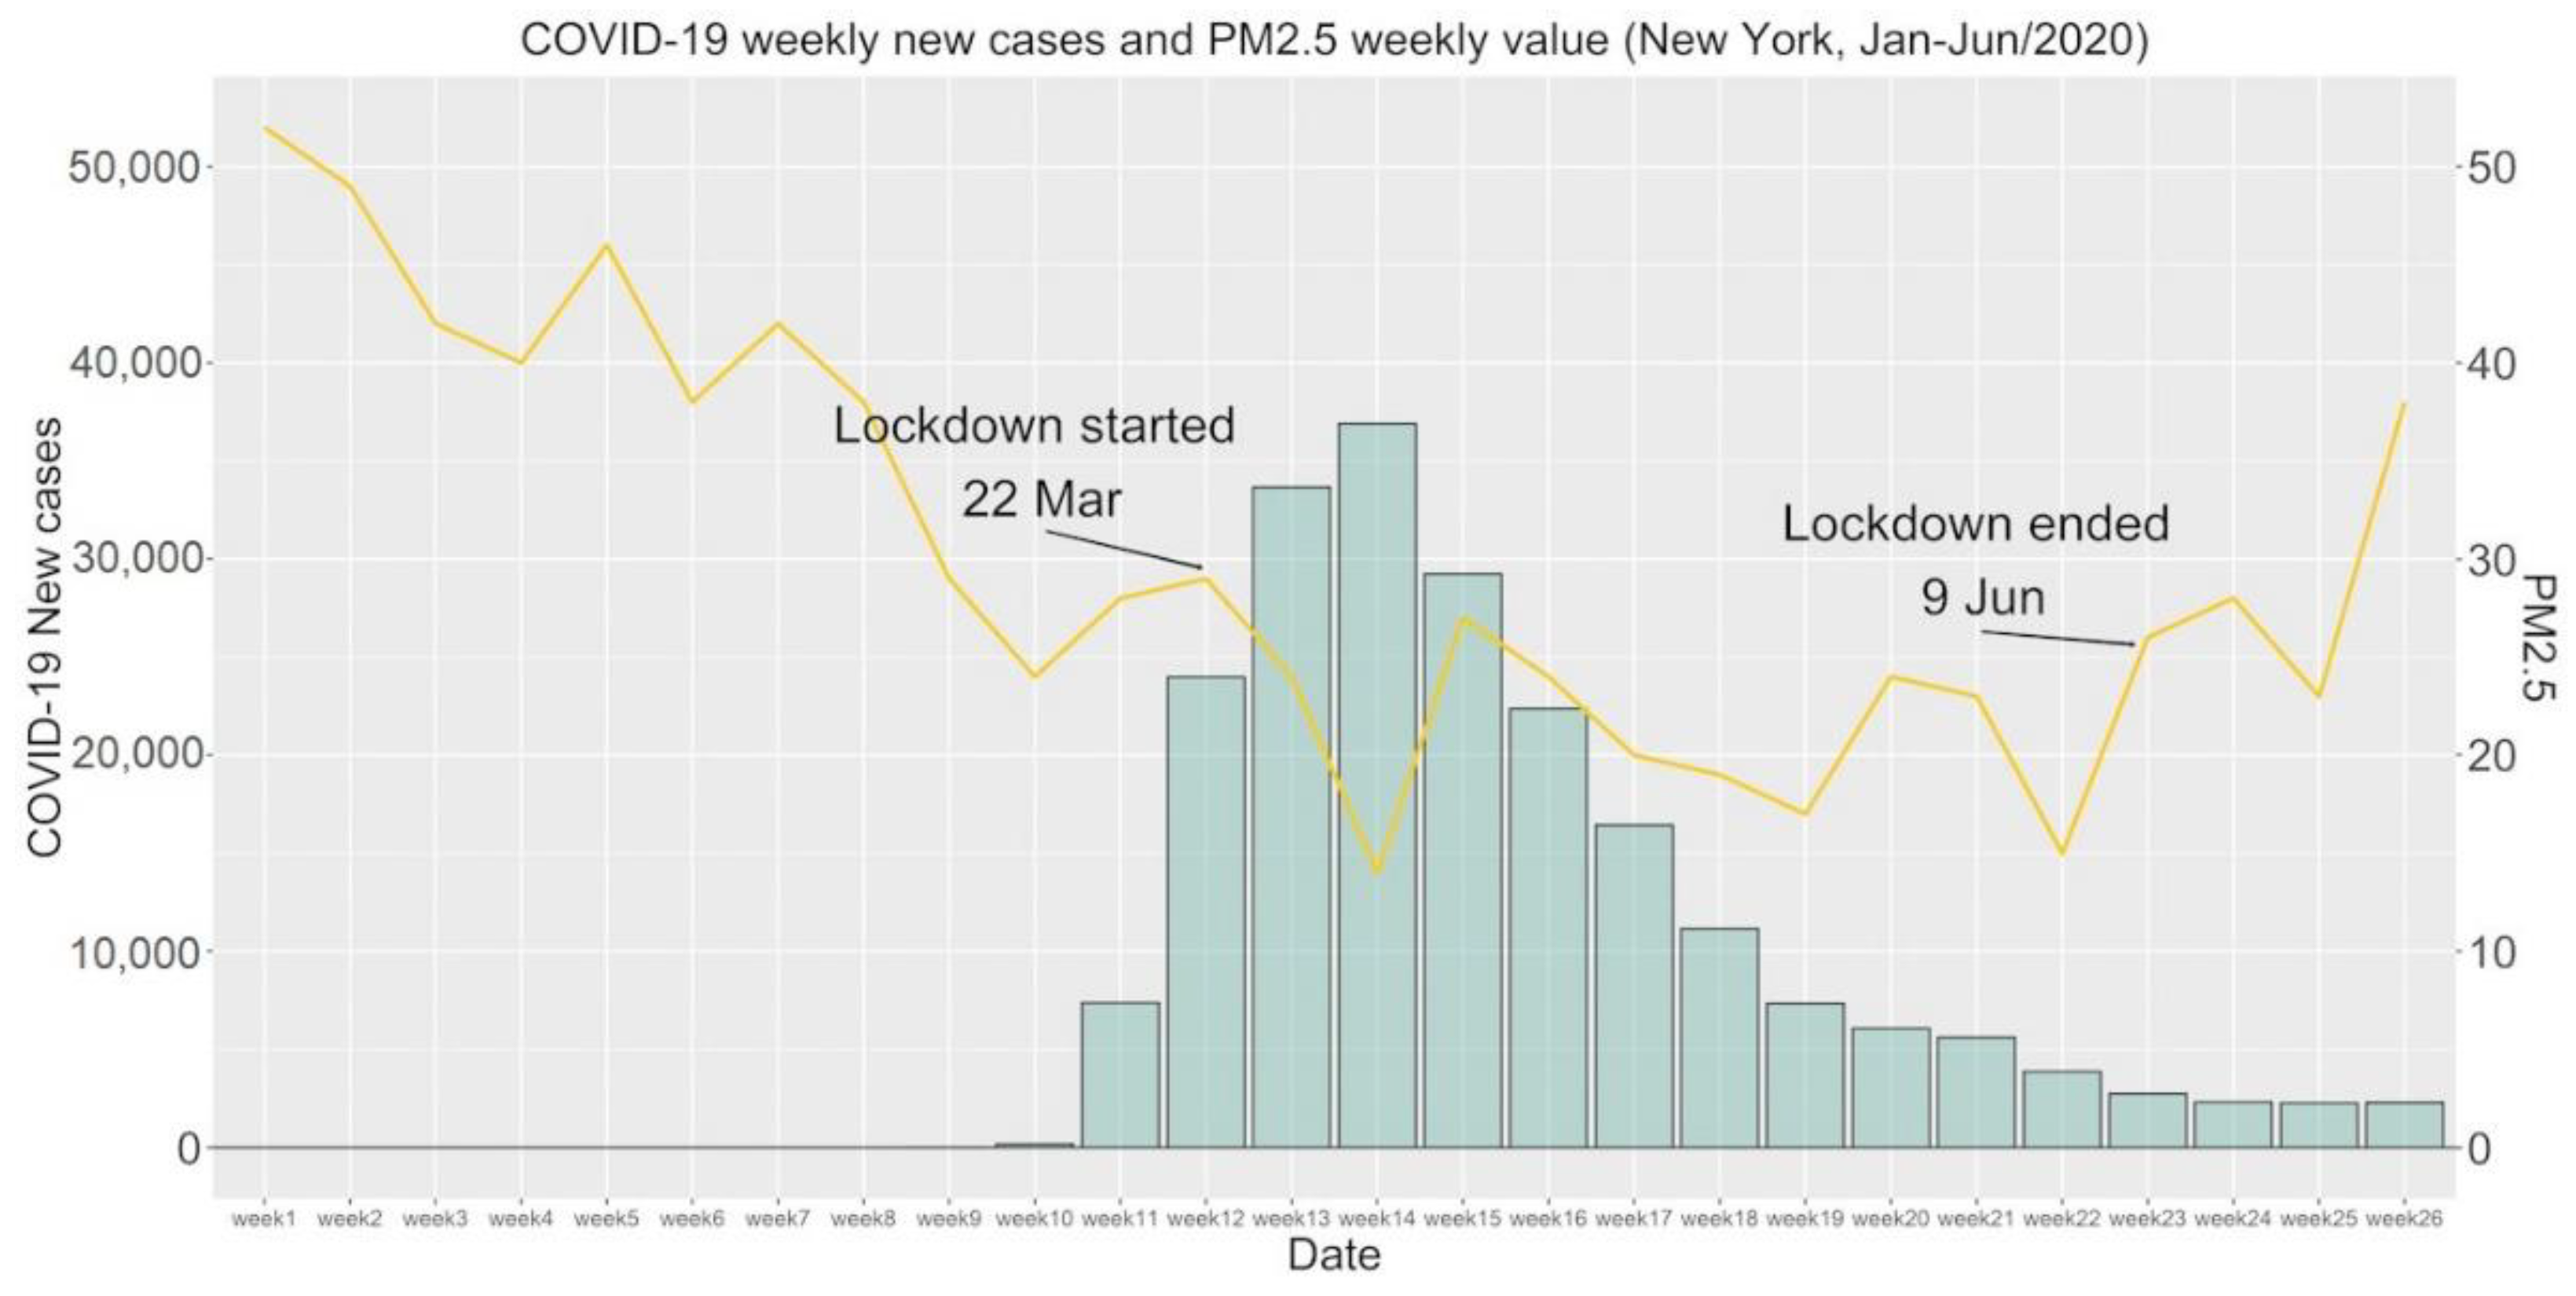
Figure 7 and Figure 8 show weekly new COVID cases and weekly PM2.5 values in Wuhan and New York for the first six months of 2020. It can be observed that in Wuhan, when weekly cases reached their peak in week 7, the PM2.5 level dropped to the lowest relative level during this period (Wuhan’s lockdown), which was 14% lower than the average and 42.9% lower than the maximum, i.e., the air quality was relatively better during the period of lockdown. In Figure 8, New York is seen to act similarly; the lowest PM2.5 value appeared in week 14, corresponding with the greatest number of new cases, which was 53.3% lower than the average and 73% lower than the peak. Similar results can be found in Melbourne, whereas Seoul and Singapore did not exhibit a clear pattern but maintained a relatively stable decrease PM2.5 values.
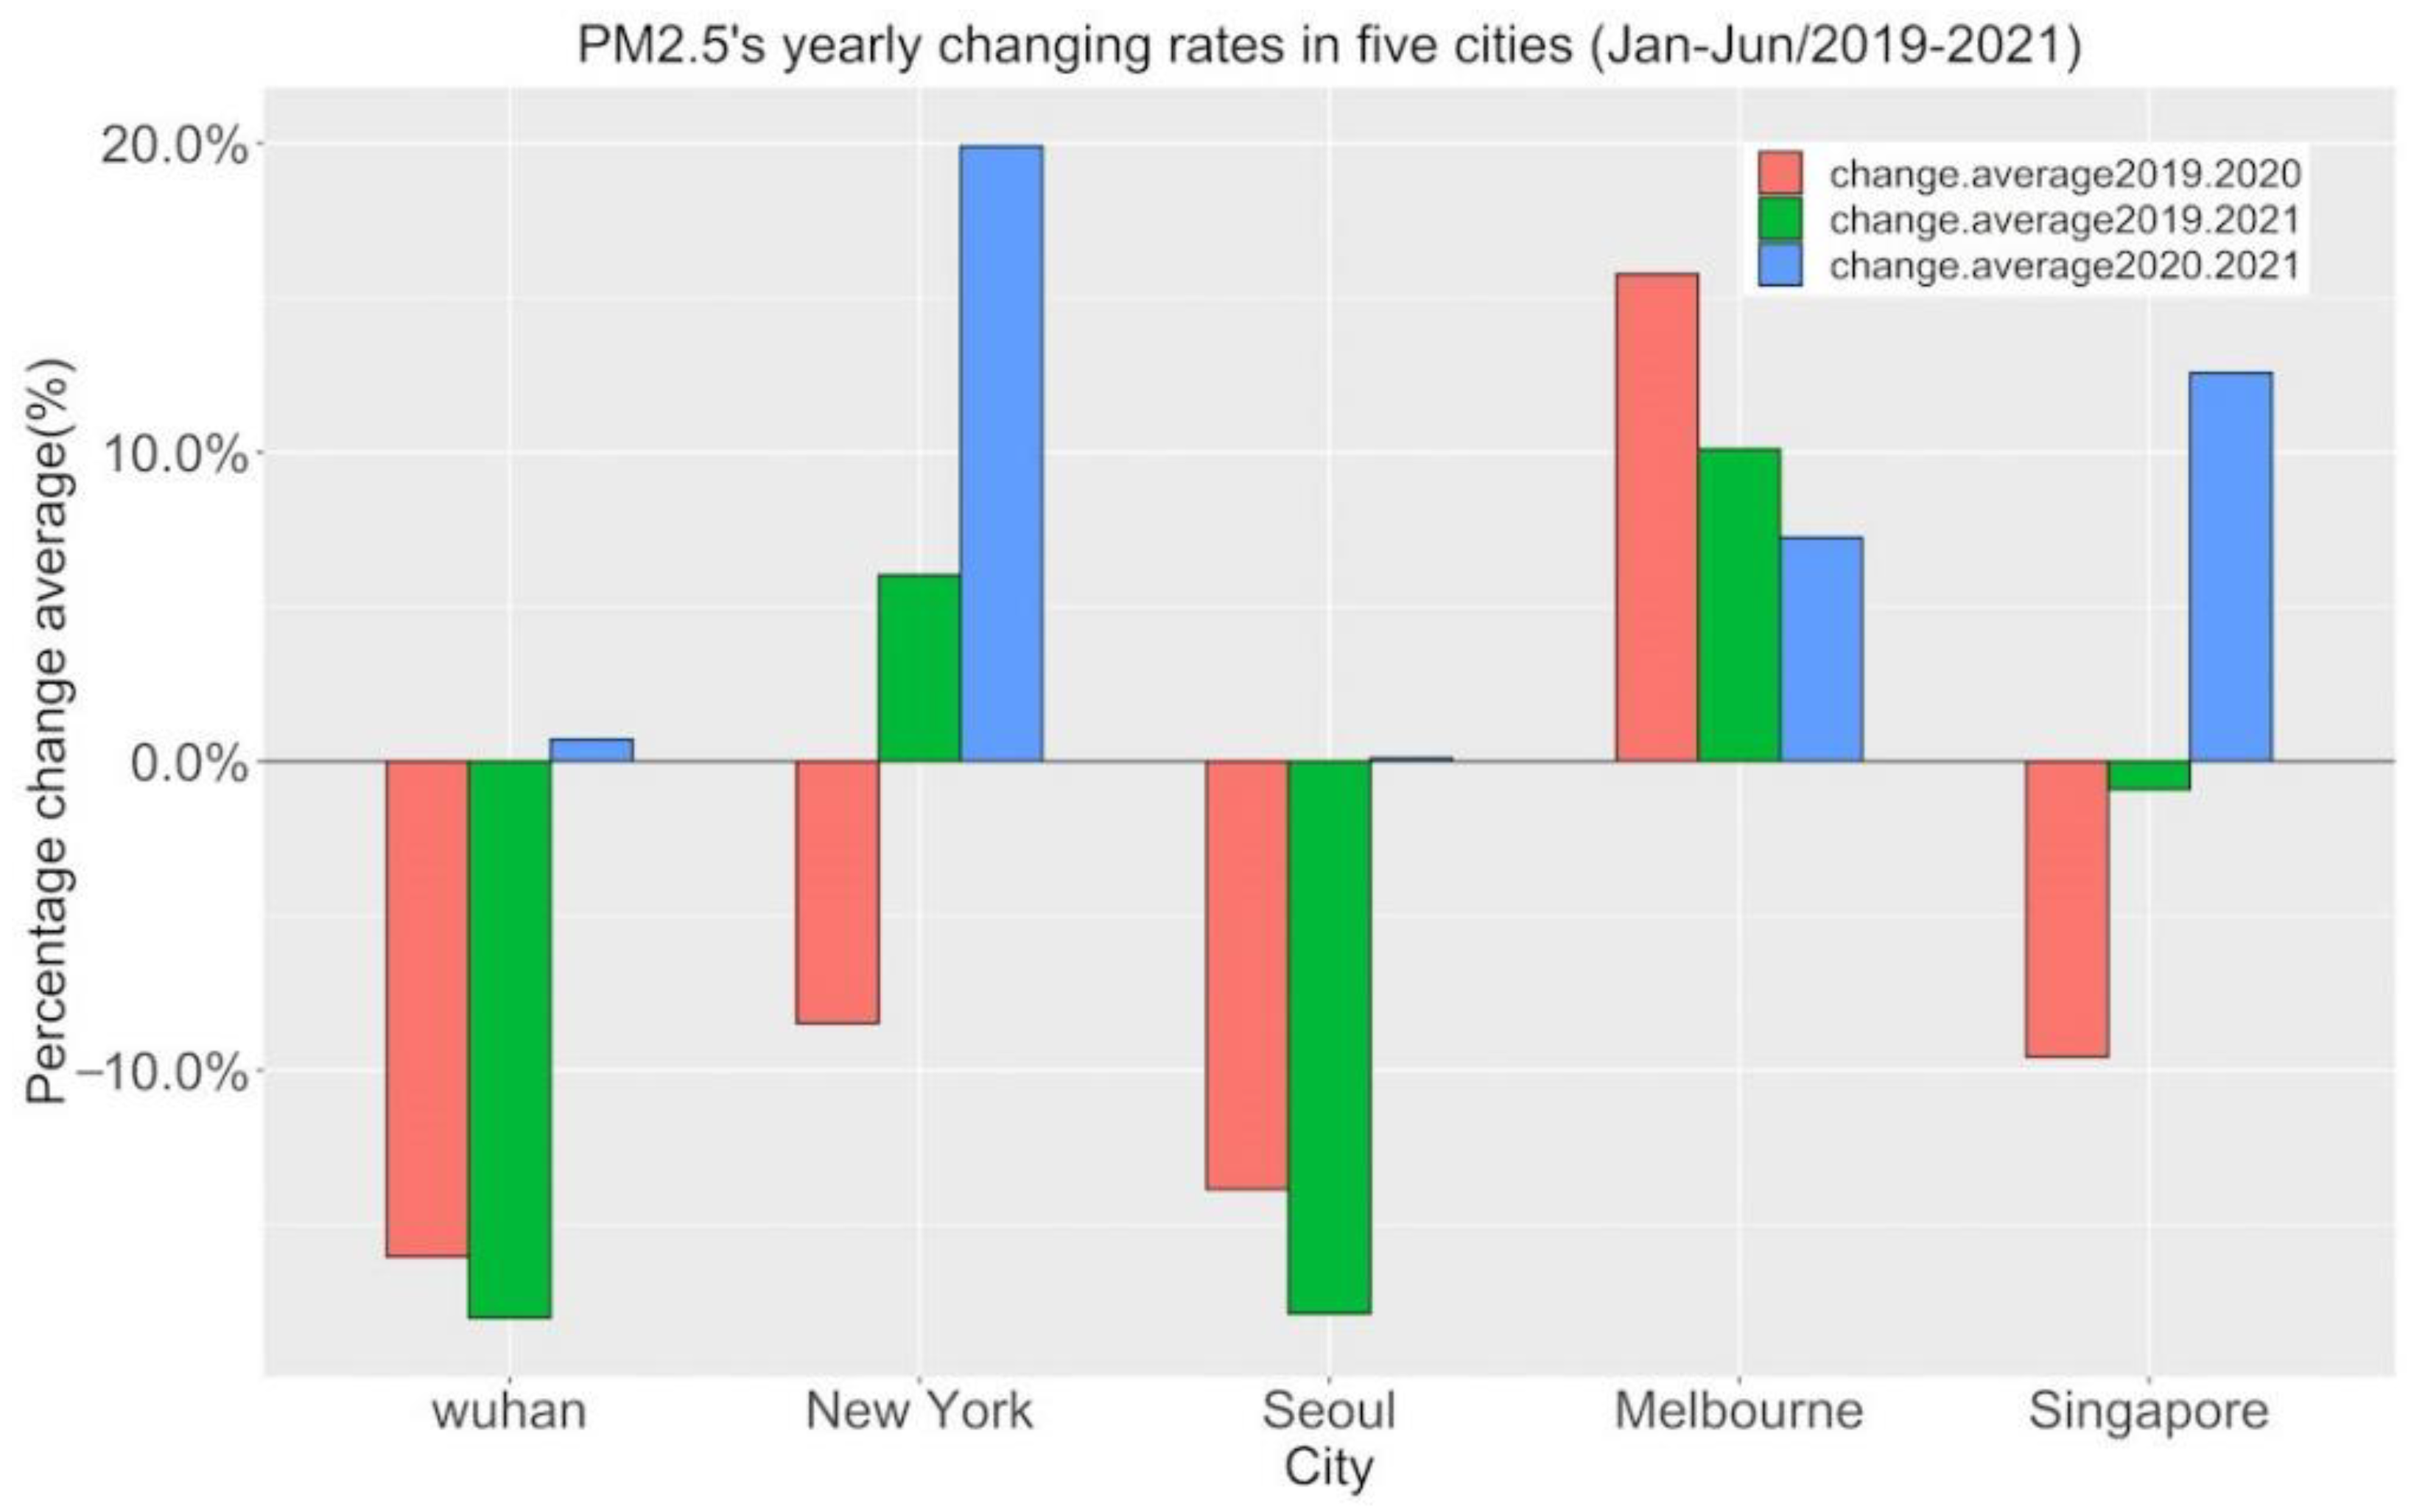
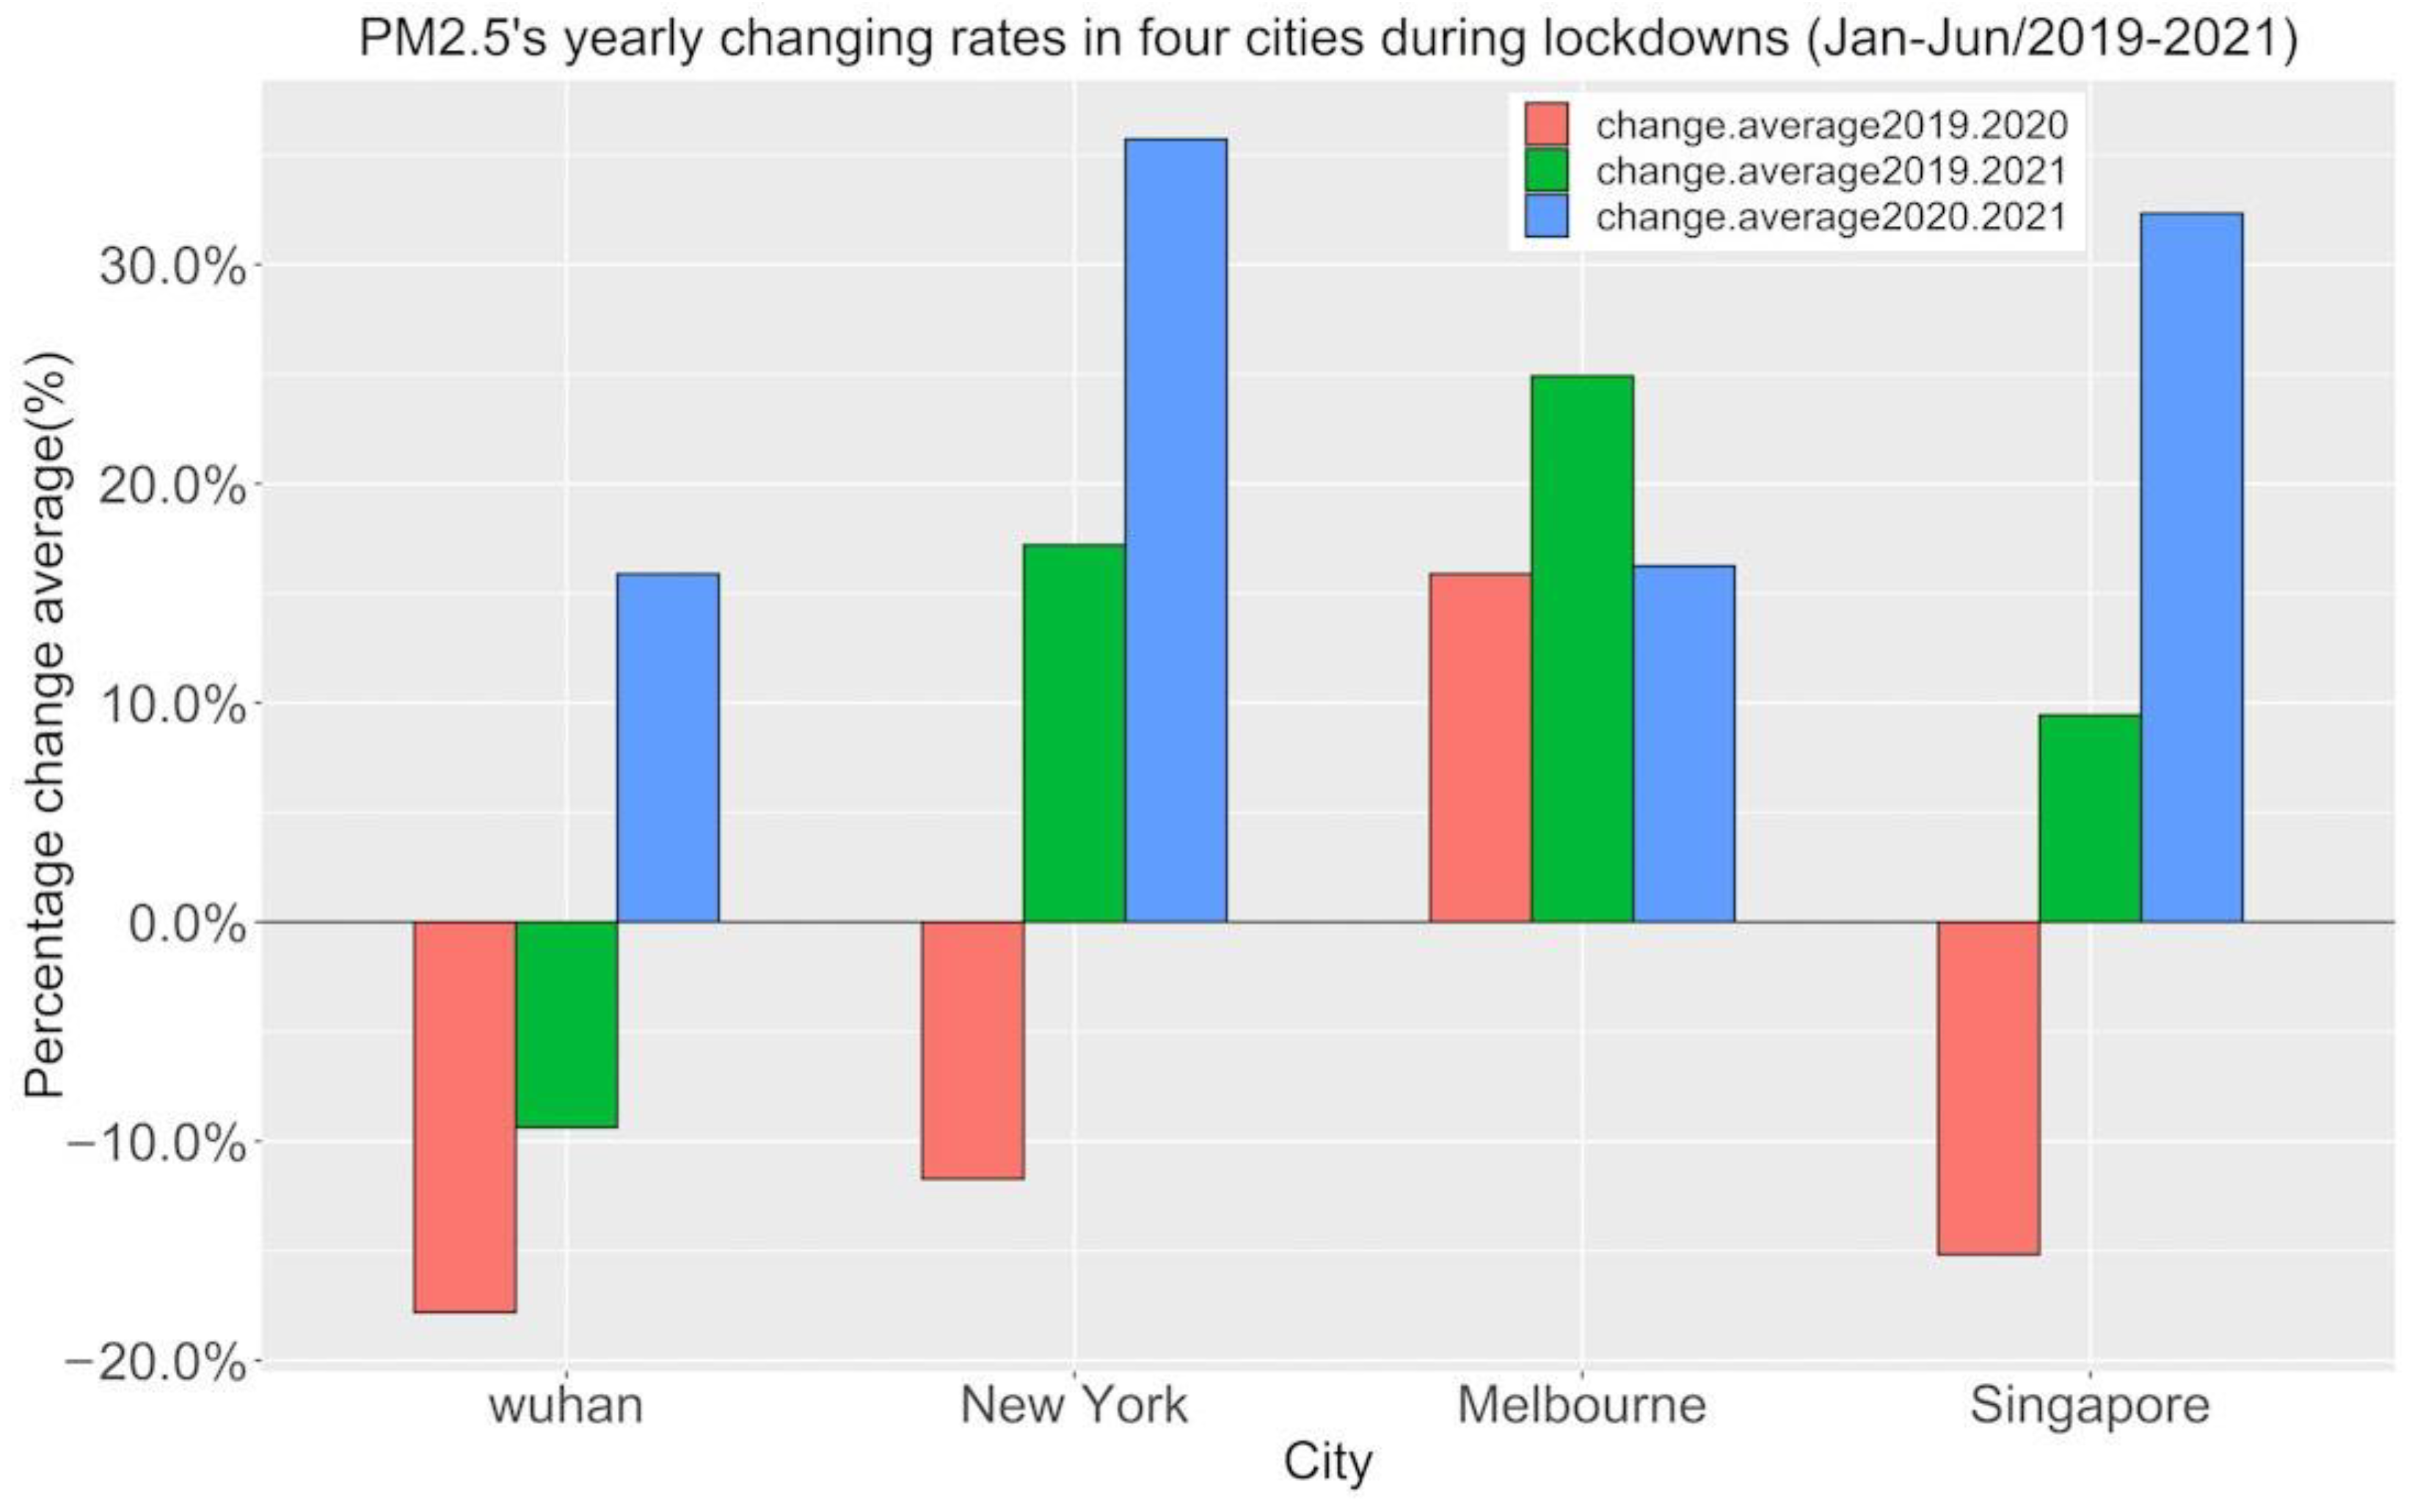
It can be seen from Figure 9 and Figure 10 that PM2.5 dropped in all cities from 2019 to 2020, except for Melbourne. Wuhan had the most significant drops (negative values). In Figure 9, the blue columns representing the change from 2020 to 2021 are all positive; from 2019 to 2021, Wuhan, Seoul, and Singapore are negative, and New York and Melbourne are positive. Figure 10 is a subset of Figure 9, and it shows only four cities during lockdown periods (there was no lockdown in Seoul). Comparing data from Figure 9 and Figure 10, the yearly changing rates from 2019 to 2020 were −17.81% and −16.03% in Wuhan, −11.72% and −8.47% in New York, and −15.17% and −9.56% in Singapore. For details, please refer to Table 3 and Table 4. Cities that implemented closures tended to have greater yearly PM2.5 changing rates than those without lockdowns, with the exception of Melbourne.
Regarding Melbourne, even when it was in lockdown, that city still showed an extreme opposite reaction in comparison to other cities; its air quality was worse during the closure period than during the open period. Its “individual” behaviour may be related to the mass demonstrations and protests that occurred in response to its six lockdowns, as well as government policies and, of course, repeatedly being affected by the pandemic [37]. However, relevant data have not yet been collected, and the specific influencing factors are not within the scope of the current study. We plan to introduce relevant major events and policies in the next phase of our research to reveal how air quality was affected by the outbreak in this particular city.
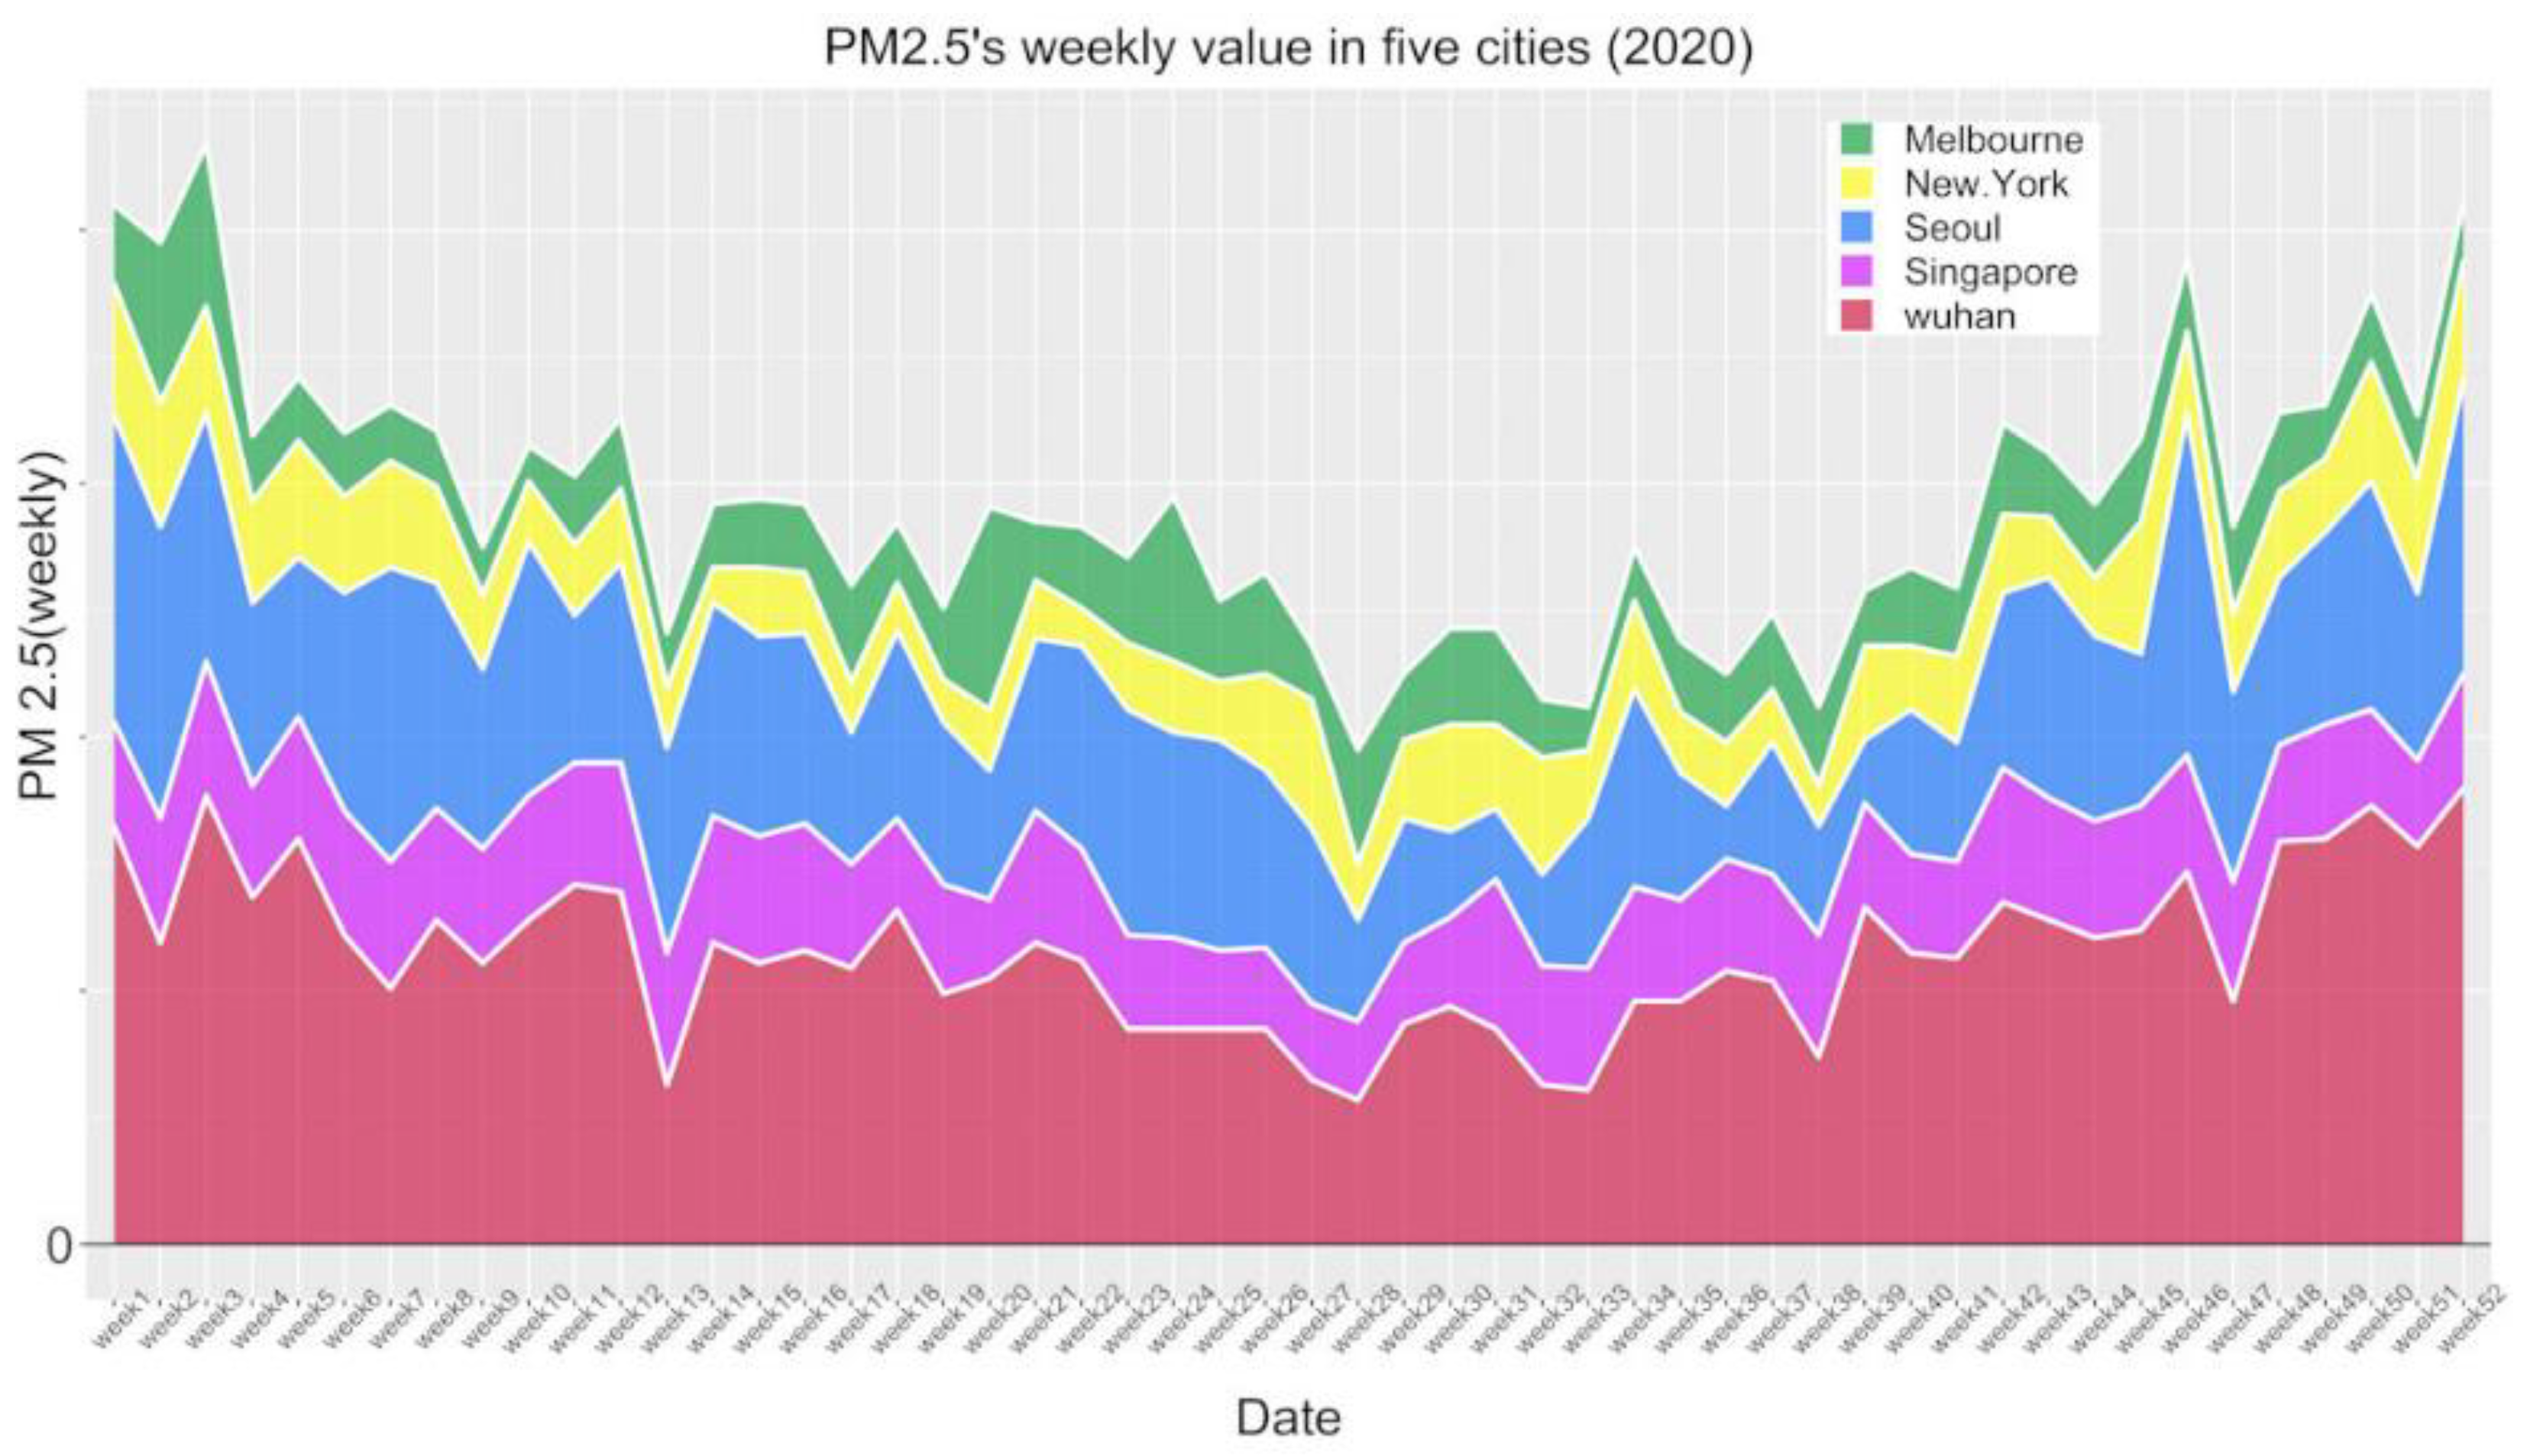
As shown in Figure 11, Wuhan was in lockdown or partial lockdown for the first six months of 2020, and its PM2.5 levels changed substantially; in the second half of the year, due to the improvement of the pandemic situation, the closure did not continue, and PM2.5 levels increased. Singapore imposed two closures in 2020. PM2.5 levels dropped slightly after lockdowns and remained stable, not changing significantly. During the first six months in 2020 in Seoul, PM2.5 was been stable, at around 80, with slight fluctuations. Melbourne and New York implemented secondary and additional lockdowns in 2020. Melbourne was closed for the longest time of all cities in the world during this period but did not experience any significant changes in PM2.5 levels.
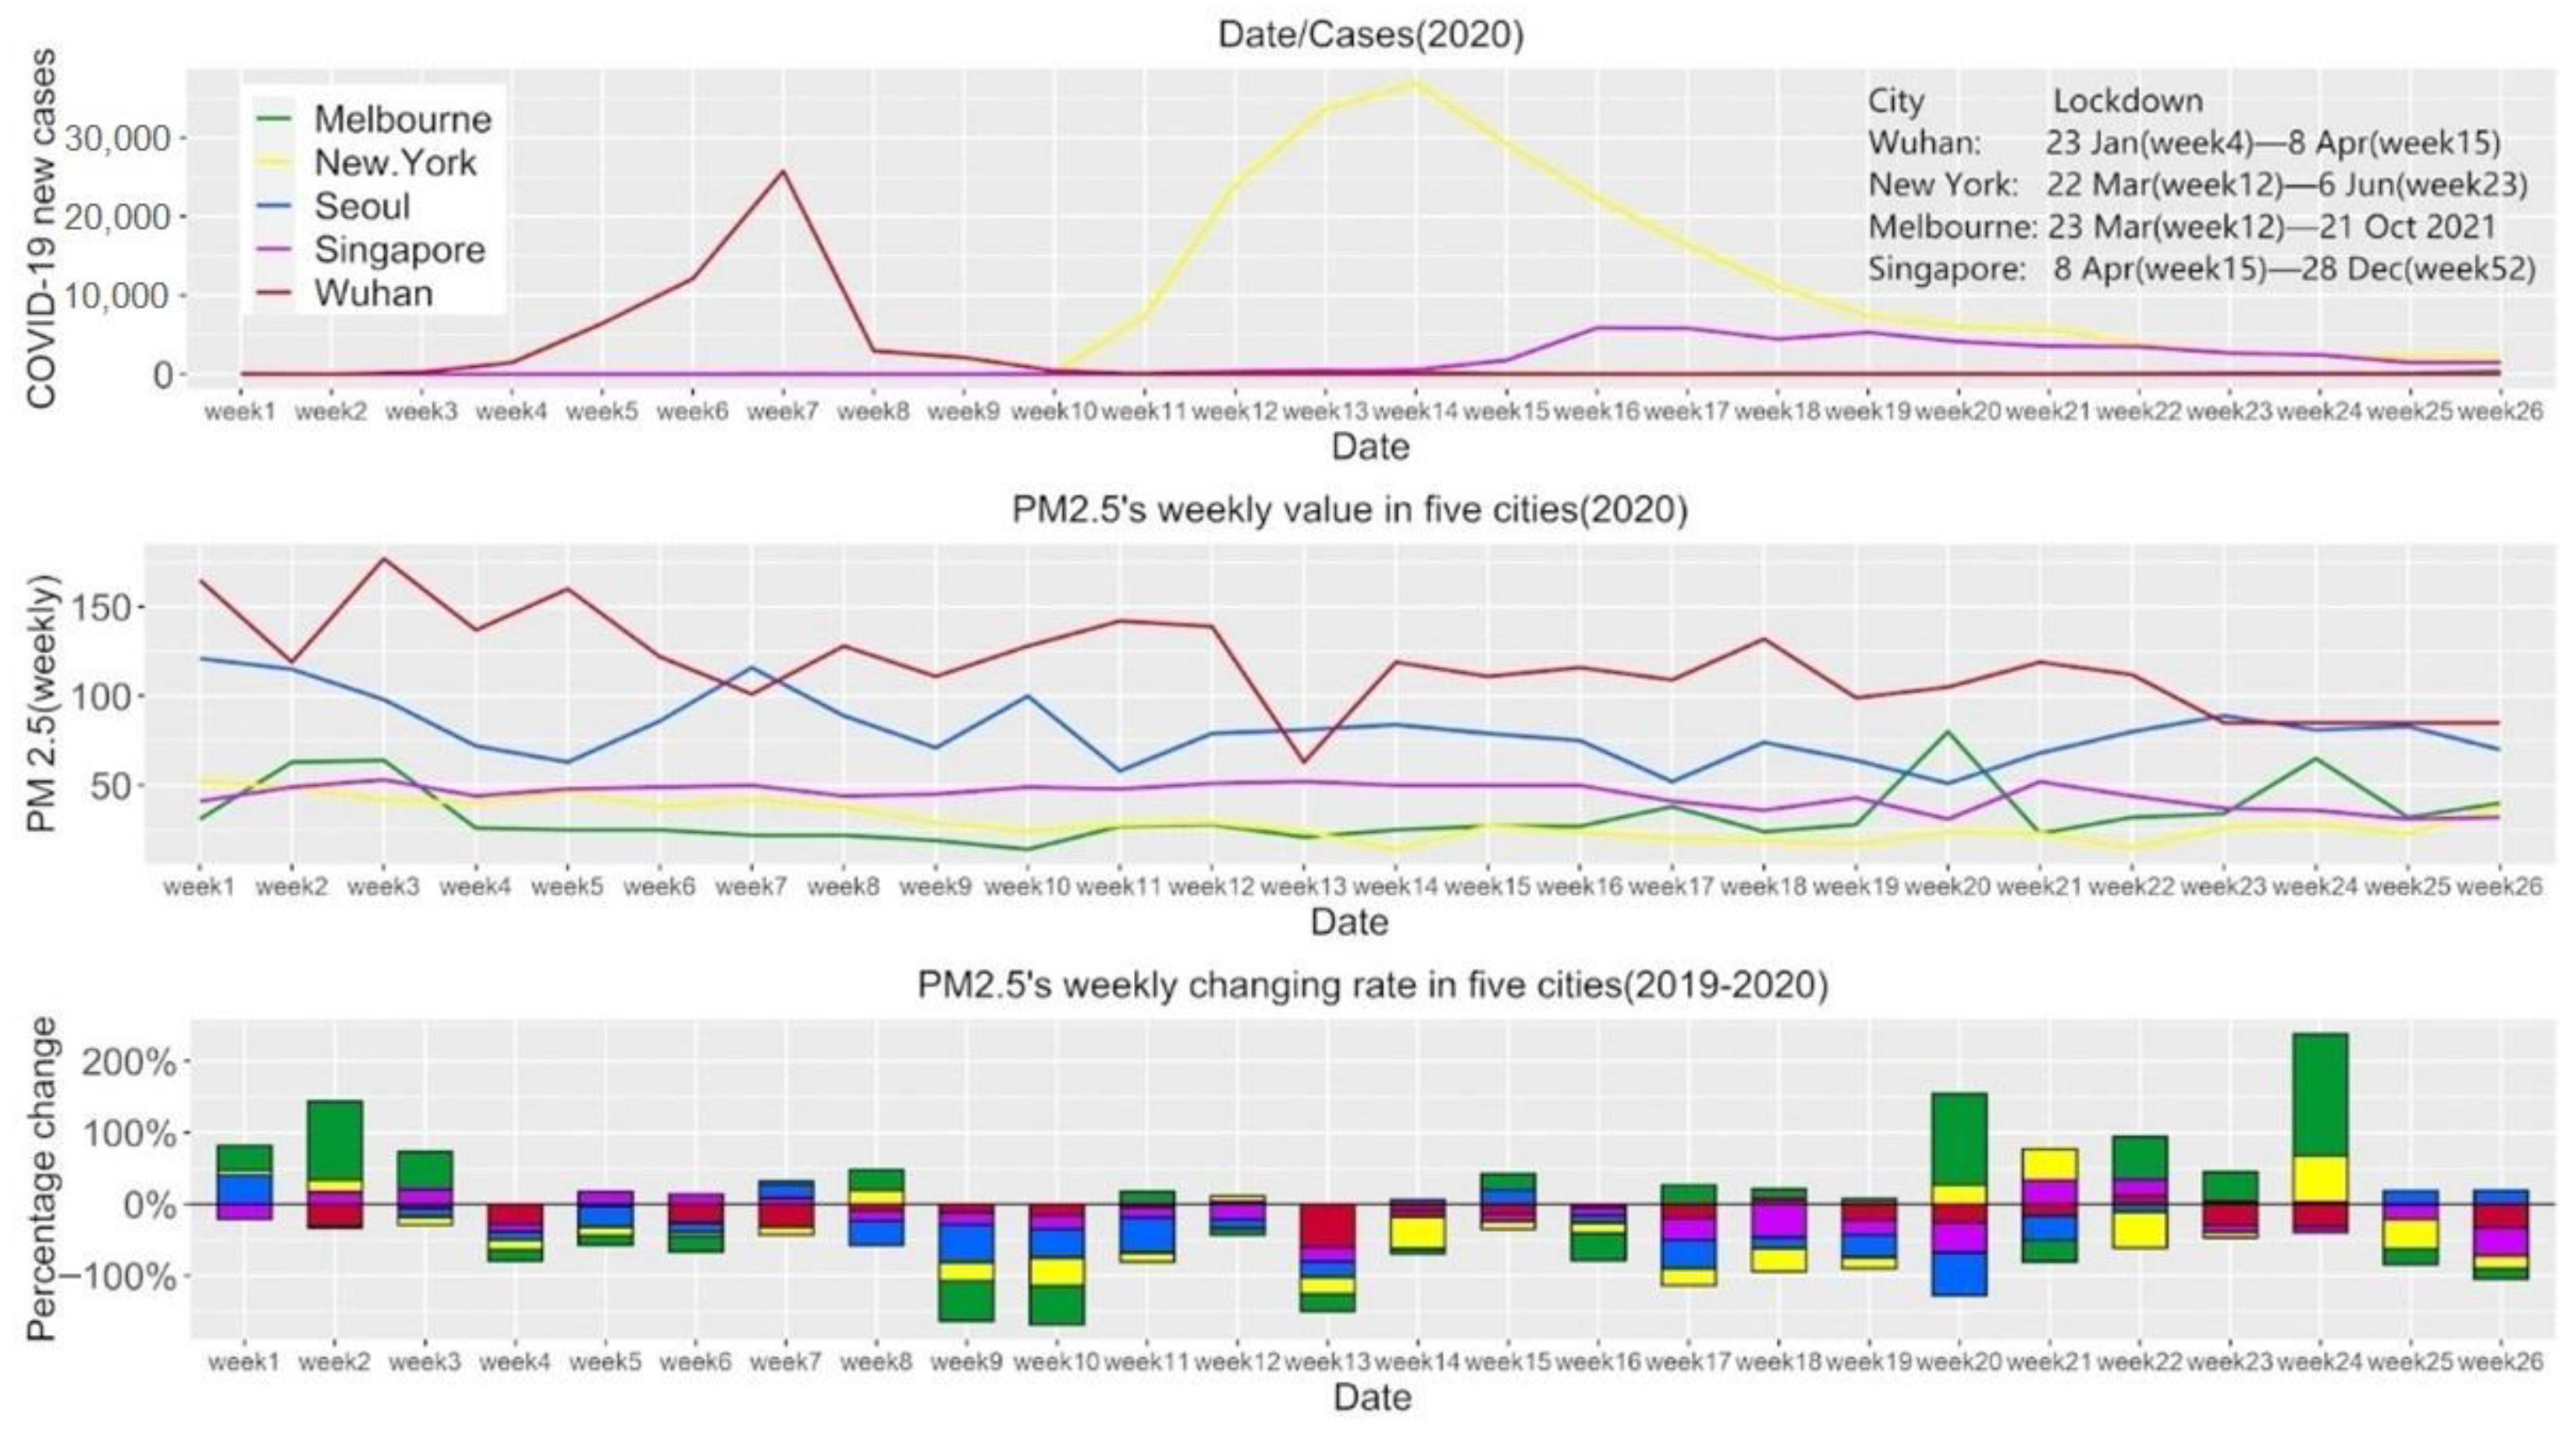
In Figure 12, it can be observed that: In Wuhan, the number of new cases reached its peak 3 weeks after the lockdown and went back to being under control within 4 weeks. PM2.5 reached its new low 3 weeks after the closure and reached its minimum 9 weeks after the lockdown. In New York, the number of new cases reached its peak 2 weeks after the lockdown and went back to being under control within 4 weeks. PM2.5 reached its new low 2 weeks after the lockdown and has remained stable since. In Melbourne, there were not many cases during the studied period (the first 26 weeks in 2020), and PM2.5 levels increased following lockdowns. In Singapore, the number of new cases reached its peak 1 week after the lockdown and went back to being under control within 8 weeks. PM2.5 reached its new low 5 weeks after the lockdown. In Seoul, no lockdown was imposed, and there were not many cases during the studied period. PM2.5 in all cities tended to decrease during the first 26 weeks in 2020, except for Melbourne. Additionally, for the two cities with the most cases among the five representative cities, Wuhan and New York, they both took 2–3 weeks to reach the peak number of cases and 4 weeks to get the outbreak under control after lockdown; PM2.5 levels in these two cities reached relative low points within 2–3 weeks following lockdowns.
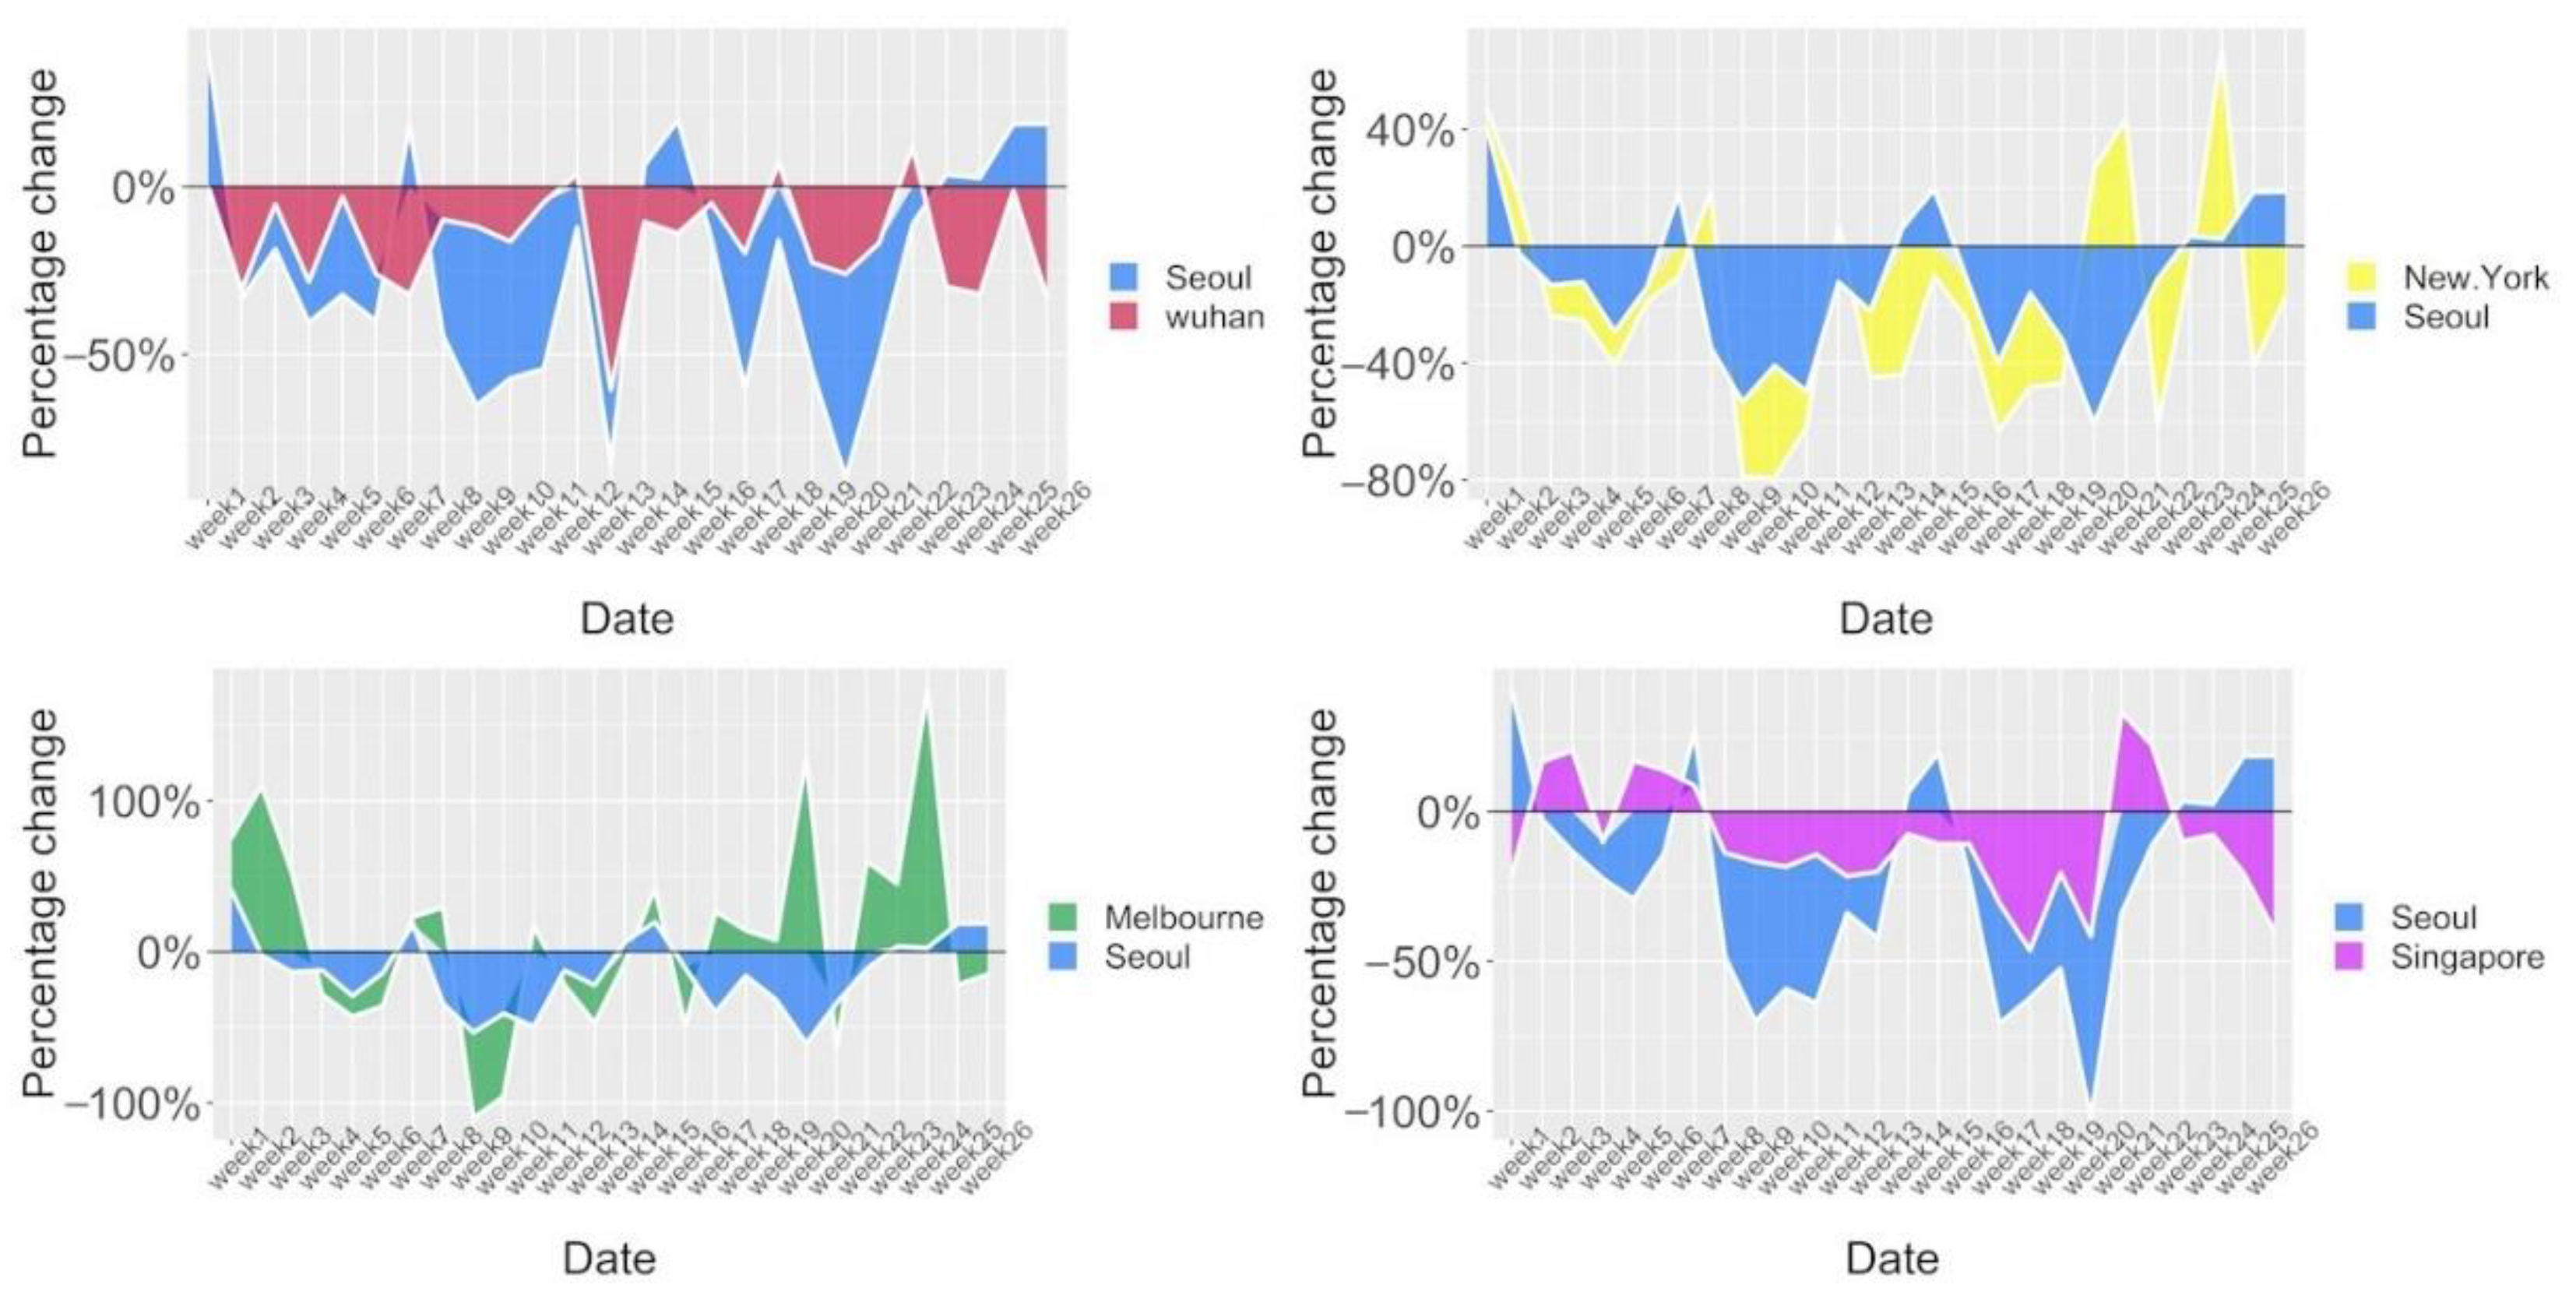
As seen in Figure 13, we compared Seoul with four other representative cities. In the top-left chart, it can be seen that the blue area with negative values is larger than the red area with negative values, which implies that PM2.5 dropped more noticeably in Seoul than in Wuhan during the studied period (weeks 1–26 in 2020). Furthermore, based on the three other charts, Seoul’s PM2.5 levels decreased more evidently than those of Singapore but less intensely than those of New York. The reduction in PM2.5 levels in Seoul were similar to in Melbourne during this period.
During 2020, except for Seoul, all four other representative cities implemented city closures. The combination of graphs and statistics shows that PM2.5 levels remained in the range of ±15.7% of 127 from week 39 to 46 in Wuhan, and ±11.6% of 43 from week 32 to 41 in Singapore. This suggests that PM2.5 levels in Wuhan and Singapore were essentially stable during the second half of 2020. In contrast, PM2.5 levels in New York and Melbourne fluctuated during the same period. Air quality may be affected by the implementation of lockdown policies by local governments, though this effect has not yet been studied.
With regards to our hypotheses, based on the generated graphs, observation, and statistics, the following can be concluded:
For H1, except for Melbourne, there were significant changes in air quality in all cities during the outbreak, following a similar trend. During the pandemic, various restrictions led to a reduction in human industrial activity and traffic movement, which may improve air quality [17]. Similar trends may enhance air quality, but in our experiments, this held true for four cities, excluding Melbourne excluded. Melbourne’s PM2.5 changing rate was the opposite affected in many ways. Furthermore, this represents only a general outcome of the reduction in human activity, as actual impact varies.
For H2, based on analysis of the relevant values and changing rates, the magnitude of PM2.5 change in cities in which lockdowns were imposed was greater than in cities without closures. Based on our experiments, it can be concluded that during the outbreak, air quality improved to a greater extent (more than 10%) during lockdown in most cases; it can be noticed that lockdowns caused an improvement in air quality in all cities compared to 2019 (Seoul excluded), as seen in Table 4. The reason for this outcome might be that 2020 was the year that people panicked the most due to fear of an unknown virus. Hence, lockdowns are not likely the main contributing factor to improved air quality, which could be dependent on the strictness of enforcement instead. This finding does not apply to Melbourne, which may be affected by factors such as mass demonstrations [37], although such factors remain uncertain at this stage.
For H3, when weekly new cases reached their highest points in New York, Wuhan, and Melbourne in week 14, week 7, and week 13, PM2.5 values were 53.3%, 14%, and 36.7% lower than the average, and 73%, 42.9%, and 73.8% lower than the peak, respectively. Overall, PM2.5 levels fell to relative lows when the number of new cases highest was peaking; however, a similar trend was not observed in Seoul and Singapore. Therefore, it can be concluded that changes in the number of new cases could potentially affect social activities, thus indirectly inducing changes in air quality; however, the significance of this correlation remains unknown.
For H4, although no lockdowns were implemented in Seoul, the city exhibited similar patterns in air-quality change to other cities, with significant air-quality improvements compared to 2019 (PM2.5 dropped 13.85% from 2019 to 2020). Therefore, it cannot be confirmed that air quality improves more in cities with lockdowns than those without. Many factors may be involved, and there is no solid evidence showing that cities with lockdowns have less human activity than cities without closures. Therefore, implementation strength of prevention measures may play a role, although we have not yet been able to take such factors into account, so this assumption has not yet been confirmed.
For H5, as did not discover consistent patterns among Asian cities and Western cities, it cannot be inferred whether cultural diversity and the implementation strength of prevention measures impact air pollution. Thus, this hypothesis cannot be confirmed. However, three Asian cities, particularly Wuhan and Seoul, did show greater improvements PM2.5 when comparing data between 2019 and 2020, as well as 2019 and 2021 (see Table 3), and Singapore was one of few counties that maintained opened borders in 2020 [39].
For H6, the implementation of lockdowns in Wuhan and Singapore was relatively strong, and their PM2.5 levels exhibited a steady downward trend in 2020. City closures in New York and Melbourne were relatively weak due to multiple protests. There were 17 COVID-related demonstrations in New York and 18 in Melbourne from 2020 to 2021, all for anti-lockdown and anti-mandate purposes [33,34,38]. There was also one protest over the student COVID-19 vaccine pass mandate in Seoul in 2021 [54]; however, only 70 people were involved. There were no COVID related demonstrations in Singapore and Wuhan. PM2.5 levels fluctuated in all five cities during the studied period. Among them, Melbourne was closed for the longest time [55], although PM2.5 levels for that city sometimes showed an upward trend. However, considering its many protests, Melbourne’s closures might not have been as strict as in other cities. It is a well-known fact that lockdown mandates were not strictly implemented in many cities around the world [41,42]. Therefore, it can be concluded that the implementation strength of city-closure policies has an impact on air quality in most cases.
Overall, with Melbourne excluded, H4, H5, and H3 (the peak of new cases affected human activity and thus indirectly influenced air quality in New York, Wuhan, Singapore, and Seoul) cannot be proven. Other hypotheses have been confirmed in this work. The outlying behaviour of air-quality changes in Melbourne during the outbreak may have been caused by multiple factors, such as geographical, political, population density, and economic reasons, that lie beyond the scope of the current study.
4. Conclusions
Frequent air-quality fluctuations were reflected in changing PM2.5 values in 2020. The fear of unknown viruses may have led to a significant reduction in human activity in the early stages of the pandemic, resulting in a decrease in air pollution and, ultimately, improved air quality [13]. This study generated graphs and statistics to analyse the potential connections between COVID pandemic data and air quality. PM2.5 fluctuations were found to be more evident before and after lockdowns. PM2.5 levels were greatly affected by the outbreak in Wuhan, Seoul, and Singapore; its impact in New York was mediocre; and it was tangential in Melbourne, showing an opposite effect as compared to the four other representative cities. Our hypotheses have been partially verified, and an outbreak is likely to reduce human activity (though not in all cases) and therefore affect air quality. According to the experimental results, in most cases, worse epidemic situations, such as a greater number of infections, leads to less human activity (owing to lockdowns, etc.), resulting in air-quality improvement. In contrast, improved epidemic situations cause city closures to lifted, resulting in more human activity, leading to air-quality deterioration to some extent. However, due to many other factors, such as government prevention measurements and their implementation strength, a city’s geographical location, cultural diversity, etc. that have not been investigated at this stage, the detailed indirect impact of the outbreak on air quality is uncertain, and actual reduction in air pollution varies. To the best of our knowledge, a study involving multiple cities and periods has not been carried out before. This work may be helpful for the analysis of air quality data from another perspective—the relationship between air pollution and pandemic data. Additionally, this research could potentially assist stakeholders in understanding interactions among various factors (major social events and outbreak data, etc.), offering more comprehensive evidence from which to deduce the effects of human activities on air quality.
This work is the first step in analysing the relationship between the outbreak data and air quality. The limitations of this work include several aspects. Regarding the complexity of air quality data, PM2.5 was the only imported for analysis in this study, which may be an essential element, although additional factors could also contribute to the study of air quality during the pandemic. Additionally, we only collected data from five cities in Asia, North America, and Oceania, and our study lacked data from other continents (especially Europe, for which relevant open datasets are available). This study also lacks air quality data from other months/years. Political, economic, and population density factors are also important, as they relate to research on air pollution during the epidemic and have not been taken into account. Furthermore, from a visualisation perspective, this study could import spatial and temporal settings to present a better dashboard for further analytics.
We will address the above limitations in our future work, collect more air pollution factors, and import those factors into our research. We will also introduce a novel interactive visualisation method to show the relationship between COVID-19 data and air quality index data, diving deeper into the relationship and eventually providing a more comprehensive understanding of this topic based on pure data analytics.
Author Contributions
Conceptualisation, J.H. and X.C.; methodology, J.H. and X.C.; software, J.H. and X.C.; validation, J.H., X.C., and S.H.; formal analysis, J.H. and X.C.; investigation, J.H., X.C., and S.H.; resources, J.H., X.C., and S.Y.; data curation, X.C., J.H., and X.R.; writing—original draft preparation, J.H., X.C., and S.H.; writing—review and editing, J.H., X.C., and S.H.; visualisation, J.H. and X.C. All authors have read and agreed to the published version of the manuscript.
Funding
This research was funded by the Innovation Foundation for Postgraduate of Shaoyang University, grant number CX2021SY019.
Institutional Review Board Statement
Not applicable.
Informed Consent Statement
Not applicable.
Data Availability Statement
Conflicts of Interest
The authors declare no conflict of interest.
References
- Jiang, Y.; Wu, X.-J.; Guan, Y.-J. Effect of ambient air pollutants and meteorological variables on COVID-19 incidence. Infect. Control Hosp. Epidemiol. 2020, 41, 1011–1015. [Google Scholar] [CrossRef] [PubMed]
- WHO. Coronavirus Disease (COVID-19). 2021. Available online: https://COVID19.who.int (accessed on 3 December 2021).
- Tian, X.; An, C.; Chen, Z.; Tian, Z. Assessing the impact of COVID-19 pandemic on urban transportation and air quality in Canada. Sci. Total Environ. 2021, 765, 144270. [Google Scholar] [CrossRef] [PubMed]
- Mor, S.; Kumar, S.; Singh, T.; Dogra, S.; Pandey, V.; Ravindra, K. Impact of COVID-19 lockdown on air quality in Chandigarh, India: Understanding the emission sources during controlled anthropogenic activities. Chemosphere 2021, 263, 127978. [Google Scholar] [CrossRef] [PubMed]
- Liu, Q.; Sha, D.; Liu, W.; Houser, P.; Zhang, L.; Hou, R.; Lan, H.; Flynn, C.; Lu, M.; Hu, T.; et al. Spatiotemporal patterns of COVID-19 impact on human activities and environment in mainland China using night time light and air quality data. Remote Sens. 2020, 12, 1576. [Google Scholar] [CrossRef]
- Adhikari, A.; Yin, J. Short-term effects of ambient ozone, PM2.5, and meteorological factors on COVID-19 con-firmed cases and deaths in Queens, New York. Int. J. Environ. Res. Public Health 2020, 17, 4047. [Google Scholar] [CrossRef] [PubMed]
- Li, J.; Tartarini, F. Changes in air quality during the COVID-19 lockdown in Singapore and associations with hu-man mobility trends. Aerosol Air Qual. Res. 2020, 20, 1748–1758. [Google Scholar] [CrossRef]
- Ropkins, K.; Tate, J.E. Early observations on the impact of the COVID-19 lockdown on air quality trends across the U.K. Sci. Total Environ. 2021, 754, 142374. [Google Scholar] [CrossRef]
- Chauhan, A.; Singh, R.P. Decline in PM2.5 concentrations over major cities around the world associated with COVID-19. Environ. Res. 2020, 187, 109634. [Google Scholar] [CrossRef]
- Kumari, P.; Toshniwal, D. Impact of lockdown on air quality over major cities across the globe during COVID-19 pandemic. Urban Clim. 2020, 34, 100719. [Google Scholar] [CrossRef]
- Chu, B.; Zhang, S.; Liu, J.; Ma, Q.; He, H. Significant concurrent decrease in PM2.5 and NO2 concentrations in China during COVID-19 epidemic. J. Environ. Sci. 2021, 99, 346–353. [Google Scholar] [CrossRef]
- Chen, Q.X.; Huang, C.L.; Yuan, Y.; Tan, H.P. Influence of COVID-19 event on air quality and their association in Mainland China. Aerosol Air Qual. Res. 2020, 20, 1541–1551. [Google Scholar] [CrossRef]
- Li, L.; Li, Q.; Huang, L.; Wang, Q.; Zhu, A.; Xu, J.; Liu, Z.; Li, H.; Shi, L.; Li, R.; et al. Air quality changes during the COVID-19 lockdown over the Yangtze River Delta Region: An insight into the impact of human activity pattern changes on air pollution variation. Sci. Total Environ. 2020, 732, 139282. [Google Scholar] [CrossRef] [PubMed]
- Seo, J.H.; Jeon, H.W.; Sung, U.J.; Sohn, J.R. Impact of the COVID-19 outbreak on air quality in Ko-rea. Atmosphere 2020, 11, 1137. [Google Scholar] [CrossRef]
- Anil, I.; Alagha, O. The impact of COVID-19 lockdown on the air quality of Eastern Province, Saudi Arabia. Air Qual. Atmos. Health 2021, 14, 117–128. [Google Scholar] [CrossRef]
- Zoran, M.A.; Savastru, R.S.; Savastru, D.M.; Tautan, M.N. Assessing the relationship between surface levels of PM2.5 and PM10 particulate matter impact on COVID-19 in Milan, Italy. Sci. Total Environ. 2020, 738, 139825. [Google Scholar] [CrossRef] [PubMed]
- Hashim, B.M.; Al-Naseri, S.K.; Al-Maliki, A.; Al-Ansari, N. Impact of COVID-19 lockdown on NO2, O3, PM2.5 and PM10 concentrations and assessing air quality changes in Baghdad, Iraq. Sci. Total Environ. 2021, 754, 141978. [Google Scholar] [CrossRef] [PubMed]
- Stieb, D.M.; Evans, G.J.; To, T.M.; Brook, J.R.; Burnett, R.T. An ecological analysis of long-term exposure to PM2.5 and incidence of COVID-19 in Canadian health regions. Environ. Res. 2020, 191, 110052. [Google Scholar] [CrossRef] [PubMed]
- Jain, S.; Sharma, T. Social and travel lockdown impact considering coronavirus disease (COVID-19) on air quality in megacities of India: Present benefits, future challenges and way forward. Aerosol Air Qual. Res. 2020, 20, 1222–1236. [Google Scholar] [CrossRef]
- Dantas, G.; Siciliano, B.; França, B.B.; da Silva, C.M.; Arbilla, G. The impact of COVID-19 partial lockdown on the air quality of the city of Rio de Janeiro, Brazil. Sci. Total Environ. 2020, 729, 139085. [Google Scholar] [CrossRef]
- Nakada, L.Y.K.; Urban, R.C. COVID-19 pandemic: Impacts on the air quality during the partial lockdown in São Paulo state, Brazil. Sci. Total Environ. 2020, 730, 139087. [Google Scholar] [CrossRef]
- Shehzad, K.; Sarfraz, M.; Shah, S.G.M. The impact of COVID-19 as a necessary evil on air pollution in India during the lockdown. Environ. Pollut. 2020, 266, 115080. [Google Scholar] [CrossRef] [PubMed]
- Kumari, P.; Toshniwal, D. Impact of lockdown measures during COVID-19 on air quality—A case study of In-dia. Int. J. Environ. Health Res. 2020, 1–8. [Google Scholar] [CrossRef] [PubMed]
- Callaghan, S. COVID-19 Is a Data Science Issue. Patterns 2020, 1, 100022. [Google Scholar] [CrossRef] [PubMed]
- So, M.K.; Tiwari, A.; Chu, A.M.; Tsang, J.T.; Chan, J.N. Visualising COVID-19 pandemic risk through network connectedness. Int. J. Infect. Dis. 2020, 96, 558–561. [Google Scholar] [CrossRef]
- Hua, J.; Wang, G.; Huang, M.; Hua, S.; Yang, S. A Visual Approach for the SARS (Severe Acute Respiratory Syndrome) Out-break Data Analysis. Int. J. Environ. Res. Public Health 2020, 17, 3973. [Google Scholar] [CrossRef]
- Panwar, H.; Gupta, P.K.; Siddiqui, M.K.; Morales-Menendez, R.; Bhardwaj, P.; Singh, V. A deep learning and grad-CAM based color visualisation approach for fast detection of COVID-19 cases using chest X-ray and CT-Scan images. Chaos Solitons Fract. 2020, 140, 110190. [Google Scholar] [CrossRef]
- Leung, C.K.; Chen, Y.; Hoi, C.S.; Shang, S.; Wen, Y.; Cuzzocrea, A. Big data visualisation and visual analytics of COVID-19 data. In Proceedings of the 2020 24th International Conference Information Visualisation (IV), Melbourne, Australia, 7–11 September 2020; pp. 415–420. [Google Scholar]
- Barbieri, D.M.; Lou, B.; Passavanti, M.; Hui, C.; Lessa, D.A.; Maharaj, B.; Banerjee, A.; Wang, F.; Chang, K.; Naik, B.; et al. Survey data regarding per-ceived air quality in Australia, Brazil, China, Ghana, India, Iran, Italy, Norway, South Africa, United States before and dur-ing COVID-19 restrictions. Data Brief 2020, 32, 106169. [Google Scholar] [CrossRef]
- Jain, P.; Kaur, G. A Learning-Based Visualisation Application for Air Quality Evaluation During COVID’19 Pan-demic in Open Data Centric Services. Mach. Learn. Algorithms Appl. 2021, 1–22. [Google Scholar] [CrossRef]
- Wu, C.; Zhou, M.; Liu, P.; Yang, M. Analysing COVID-19 using multi-source data: An integrated approach of visual-isation, spatial regression, and machine learning. GeoHealth 2021, 5, e2021GH000439. [Google Scholar] [CrossRef] [PubMed]
- Melbourne, the World’s “Sealed City”, the Great Wall City, Is Unsealed. Available online: https://baijiahao.baidu.com/s?id=1714319549540631904&wfr=spider&for=pc (accessed on 4 December 2021).
- NBC New York. 2021. Available online: https://www.nbcnewyork.com/?s=COVID+protest+ (accessed on 3 January 2022).
- Brennan, E. Coronavirus and Protest: How COVID-19 Has Changed the Face of American Activism; United States Studies Centre, The University of Sydney: Sydney, Australia, 2020. [Google Scholar]
- What Did Korea Do to Fight against the Epidemic and Why It Could Control COVID-19 Quickly? Available online: https://baijiahao.baidu.com/s?id=1661478619605344325&wfr=spider&for=pc (accessed on 4 December 2021).
- Why Did the Epidemic suddenly Break Out in the United States? New York Times: Previously, a Series of Warnings Were Ignored. Available online: https://baijiahao.baidu.com/s?id=1661940151506161530&wfr=spider&for=pc (accessed on 4 December 2021).
- The Protests Escalated! Melbourne, Australia, Was Blocked for 235 Days due to the Epidemic, Setting a New Global Record. Available online: https://baijiahao.baidu.com/s?id=1711685725346024769&wfr=spider&for=pc (accessed on 4 December 2021).
- wikipedia. COVID-19 Protests in Australia. 2021. Available online: https://en.wikipedia.org/wiki/COVID-19_protests_in_Australia#Victoria (accessed on 3 January 2022).
- MOH|News Highlights. 2022. Available online: https://www.moh.gov.sg/news-highlights/details/gradual-re-opening-of-travel-and-changes-to-border-measures (accessed on 6 January 2022).
- Singh, V.; Singh, S.; Biswal, A.; Kesarkar, A.P.; Mor, S.; Ravindra, K. Diurnal and temporal changes in air pollution during COVID-19 strict lockdown over different regions of India. Environ. Pollut. 2020, 266, 115368. [Google Scholar] [CrossRef]
- Ren, X. Pandemic and lockdown: A territorial approach to COVID-19 in China, Italy and the United States. Eurasian Geogr. Econ. 2020, 61, 423–434. [Google Scholar] [CrossRef]
- Oum, T.H.; Wang, K. Socially optimal lockdown and travel restrictions for fighting communicable virus including COVID-19. Transp. Policy 2020, 96, 94–100. [Google Scholar] [CrossRef] [PubMed]
- COVID-19 Related Event Data. 2022. Available online: https://studentutsedu-my.sharepoint.com/:x:/g/personal/jie_hua_uts_edu_au/EdH27uqFlEtDlm58rp6NQMIBkXLuwJPdVbUhkuLfIta1lw?e=sc4mMv (accessed on 6 January 2022).
- Urban Air Quality Index. 2022. Available online: https://aqicn.org/city/ (accessed on 4 January 2022).
- Health Commission of Hubei Provincial. New Cases of COVID-19 in Hubei. 2022. Available online: http://wjw.hubei.gov.cn/bmdt/ztzl/fkxxgzbdgrfyyq/xxfb/index_123.shtml (accessed on 4 January 2022).
- NYC Open Data. New York City Open Data. 2022. Available online: https://data.cityofnewyork.us/Health/COVID-19-Daily-Counts-of-Cases-Hospitalizations-an/rc75-m7u3 (accessed on 4 January 2022).
- Seoul Open Data Square. Korean Center for Disease Control and Prevention. 2022. Available online: https://data.seoul.go.kr/dataList/OA-20461/S/1/datasetView.do#AXexec (accessed on 4 January 2022).
- VIC.GOV.AU. Victoria Ministry of Health. 2022. Available online: https://www.coronavirus.vic.gov.au/victorian-coronavirus-COVID-19-data (accessed on 4 January 2022).
- Ministry of Health Singapore. Ministry of the health of Singapore. 2022. Available online: https://www.moh.gov.sg/COVID-19/past-updates (accessed on 4 January 2022).
- COVID-19 and Air Pollution. 2022. Available online: https://studentutsedu-my.sharepoint.com/:x:/g/personal/jie_hua_uts_edu_au/Ee7X5pwfuJhLuRnZipns8MQByjJXrT6PIumJ_3iJvjXAyA?e=O6hLSQ (accessed on 6 January 2022).
- Rodríguez-Urrego, D.; Rodríguez-Urrego, L. Air quality during the COVID-19: PM2.5 analysis in the 50 most pol-luted capital cities in the world. Environ. Pollut. 2020, 266, 115042. [Google Scholar] [CrossRef]
- Akhtar, N.; Tabassum, N.; Perwej, A.; Perwej, Y. Data analytics and visualisation using Tableau utilitarian for COVID-19 (Coronavirus). Glob. J. Eng. T Echnol. Adv. 2020, 3, 28–50. [Google Scholar] [CrossRef]
- Batt, S.; Grealis, T.; Harmon, O.; Tomolonis, P. Learning Tableau: A data visualisation tool. J. Econ. Educ. 2020, 51, 317–328. [Google Scholar] [CrossRef]
- Channelnewsasia. South Korea Parents Protest over Student COVID-19 Vaccine Pass Mandate—CNA. 2021. Available online: https://www.channelnewsasia.com/asia/south-korea-parents-protest-students-vaccine-pass-2368856 (accessed on 3 January 2022).
- Boroujeni, M.; Saberian, M.; Li, J. Environmental impacts of COVID-19 on Victoria, Australia, witnessed two waves of Coronavirus. Environ. Sci. Pollut. Res. 2021, 28, 14182–14191. [Google Scholar] [CrossRef]
Figure 1.
Weekly PM2.5 value (Wuhan).

Figure 2.
Weekly PM2.5 value (New York).

Figure 3.
Weekly PM2.5 value (Seoul).

Figure 4.
Weekly PM2.5 value (Melbourne).

Figure 5.
Weekly PM2.5 value (Singapore).

Figure 6.
Weekly PM2.5 changing rate (Wuhan).

Figure 7.
Weekly new COVID-19 cases and weekly PM2.5 values (Wuhan, Jan–Jun/2020).

Figure 8.
Weekly new COVID-19 cases and weekly PM2.5 values (New York, Jan-Jun/2020).

Figure 9.
Yearly PM2.5 yearly changing rates in five cities (Jan–Jun/2019–2021).

Figure 10.
Yearly PM2.5 changing rates in four cities during lockdowns (Jan–Jun/2019–2021).

Figure 11.
Weekly PM2.5 values in five cities in 2020 (area of each colour indicates the present week’s PM2.5 values).
Figure 11.
Weekly PM2.5 values in five cities in 2020 (area of each colour indicates the present week’s PM2.5 values).

Figure 12.
The relationship between PM2.5, new cases, and lockdowns in five cities during weeks 1 to 26 of 2020.
Figure 12.
The relationship between PM2.5, new cases, and lockdowns in five cities during weeks 1 to 26 of 2020.

Figure 13.
Weekly PM2.5 changing rate comparing Seoul and other cities in 2020.


Table 1.
Median PM2.5 value for each week and weekly new COVID cases in Wuhan.
| Date | PM2.5 (2019) | PM2.5 (2020) | PM2.5 (2021) | New Cases (2020) | New Cases (2021) |
|---|---|---|---|---|---|
| week1 | 165 | 165 | 162 | 59 | 0 |
| week2 | 172 | 119 | 126 | 0 | 0 |
| week3 | 187 | 177 | 157 | 241 | 1 |
| week4 | 191 | 137 | 176 | 1472 | 0 |
| week5 | 165 | 160 | 156 | 6446 | 0 |
| week6 | 165 | 122 | 151 | 12,119 | 0 |
| week7 | 149 | 101 | 156 | 25,767 | 1 |
| week8 | 142 | 128 | 128 | 2971 | 0 |
| week9 | 126 | 111 | 83 | 2099 | 0 |
| week10 | 153 | 128 | 132 | 438 | 0 |
| week11 | 149 | 142 | 128 | 27 | 0 |
| week12 | 134 | 139 | 134 | 1 | 1 |
| week13 | 160 | 63 | 122 | 1 | 0 |
| week14 | 133 | 119 | 128 | 1 | 0 |
| week15 | 129 | 111 | 134 | 0 | 1 |
| week16 | 122 | 116 | 146 | 0 | 2 |
| week17 | 136 | 109 | 108 | 0 | 1 |
| week18 | 123 | 132 | 104 | 0 | 0 |
| week19 | 128 | 99 | 82.5 | 6 | 0 |
| week20 | 142 | 105 | 61 | 0 | 0 |
| week21 | 143 | 119 | 67.5 | 0 | 0 |
| week22 | 100 | 112 | 74 | 0 | 0 |
| week23 | 121 | 85 | 67.5 | 0 | 0 |
| week24 | 125 | 85 | 61 | 0 | 1 |
| week25 | 86 | 85 | 73 | 0 | 0 |
| week26 | 127 | 85 | 110.5 | 0 | 2 |
Table 2.
Weekly PM2.5 changing rate in Wuhan.
| Date | Changing Rate (%) (2019–2020) | Changing Rate (%) (2020–2021) | Changing Rate (%) (2019–2021) |
|---|---|---|---|
| week1 | 0.00 | −1.82 | −1.82 |
| week2 | −30.81 | 5.88 | −26.74 |
| week3 | −5.35 | −11.30 | −16.04 |
| week4 | −28.27 | 28.47 | −7.85 |
| week5 | −3.03 | −2.50 | −5.45 |
| week6 | −26.06 | 23.77 | −8.48 |
| week7 | −32.21 | 54.46 | 4.70 |
| week8 | −9.86 | 0.00 | −9.86 |
| week9 | −11.90 | −25.23 | −34.13 |
| week10 | −16.34 | 3.13 | −13.73 |
| week11 | −4.70 | −9.86 | −14.09 |
| week12 | 3.73 | −3.60 | 0.00 |
| week13 | −60.63 | 93.65 | −23.75 |
| week14 | −10.53 | 7.56 | −3.76 |
| week15 | −13.95 | 20.72 | 3.88 |
| week16 | −4.92 | 25.86 | 19.67 |
| week17 | −19.85 | −0.92 | −20.59 |
| week18 | 7.32 | −21.21 | −15.45 |
| week19 | −22.66 | −16.67 | −35.55 |
| week20 | −26.06 | −41.90 | −57.04 |
| week21 | −16.78 | −43.28 | −52.80 |
| week22 | 12.00 | −33.93 | −26.00 |
| week23 | −29.75 | −20.59 | −44.21 |
| week24 | −32.00 | −28.24 | −51.20 |
| week25 | −1.16 | −14.12 | −15.12 |
| Week26 | −33.07 | 30.00 | −12.99 |
Table 3.
Yearly (the first 26 weeks only) PM2.5 changing rate in five cities.
| City | Changing Rate (%) (2019–2020) | Changing Rate (%) (2020–2021) | Changing Rate (%) (2019–2021) |
|---|---|---|---|
| Wuhan | −16.03 | 0.71 | −18.02 |
| New York | −8.48 | 19.90 | 6.02 |
| Seoul | −13.85 | 0.11 | −17.87 |
| Melbourne | 15.76 | 7.25 | 10.11 |
| Singapore | −9.56 | 12.57 | −0.91 |
Table 4.
Yearly (the first 26 weeks only) PM2.5 changing rates in four cities during lockdowns.
| City | Changing Rate (%) (2019–2020) | Changing Rate (%) (2020–2021) | Changing Rate (%) (2019–2021) |
|---|---|---|---|
| Wuhan | −17.81 | 15.88 | −9.37 |
| New York | −11.72 | 35.71 | 17.20 |
| Melbourne | 15.88 | 16.24 | 24.91 |
| Singapore | −15.17 | 32.33 | 9.43 |
Publisher’s Note: MDPI stays neutral with regard to jurisdictional claims in published maps and institutional affiliations. |
© 2022 by the authors. Licensee MDPI, Basel, Switzerland. This article is an open access article distributed under the terms and conditions of the Creative Commons Attribution (CC BY) license (https://creativecommons.org/licenses/by/4.0/).
Share and Cite
MDPI and ACS Style
Chi, X.; Hua, J.; Hua, S.; Ren, X.; Yang, S. Assessing the Impacts of Human Activities on Air Quality during the COVID-19 Pandemic through Case Analysis. Atmosphere 2022, 13, 181. https://doi.org/10.3390/atmos13020181
AMA Style
Chi X, Hua J, Hua S, Ren X, Yang S. Assessing the Impacts of Human Activities on Air Quality during the COVID-19 Pandemic through Case Analysis. Atmosphere. 2022; 13(2):181. https://doi.org/10.3390/atmos13020181
Chicago/Turabian StyleChi, Xin, Jie Hua, Shuyang Hua, Xiao Ren, and Shuanghe Yang. 2022. "Assessing the Impacts of Human Activities on Air Quality during the COVID-19 Pandemic through Case Analysis" Atmosphere 13, no. 2: 181. https://doi.org/10.3390/atmos13020181
Note that from the first issue of 2016, this journal uses article numbers instead of page numbers. See further details here.