
Fintech and Financial Health in Vietnam during the COVID-19 Pandemic: In-Depth Descriptive Analysis


1
Faculty of Business, Multimedia University, Melaka 75450, Malaysia
2
Faculty of Economics, Universitas Indo Global Mandiri, Palembang 30129, Indonesia
3
Doctoral School of Economic and Regional Sciences, Hungarian University of Agriculture and Life Sciences, 2100 Godollo, Hungary
4
Department of Planning and General Affairs, Vietnam Chamber of Commerce and Industry, Hanoi 10000, Vietnam
*
Authors to whom correspondence should be addressed.
J. Risk Financial Manag. 2022, 15(3), 125; https://doi.org/10.3390/jrfm15030125
Submission received: 26 January 2022
/
Revised: 17 February 2022
/
Accepted: 4 March 2022
/
Published: 6 March 2022
(This article belongs to the Special Issue The Impact of COVID-19 Outbreak on Business Sustainability & Financial Risk Analysis)
Abstract
:The growing popularity of smartphones and the proliferation of technology have accelerated the development of the digital payment industry. Fintech enables customers to access financial services more efficiently and faster than traditional business, especially during the COVID-19 pandemic due to health protocols, including restrictions on physical contact. This study investigates financial literacy, fintech adoption, and the impact of the COVID-19 crisis on the financial health of consumers in Vietnam. The relatively higher level of the unbanked population in Vietnam and the lower level of adult financial literacy compared with the ASEAN region motivated this study. Based on judgment sampling, participants were approached using the mall intercept technique, and those familiar with fintech were selected for the research interview. Thirty participants were interviewed and were given a survey form to be filled online using their mobile phones. Data analysis was conducted using IBM SPSS software version 23. Perceived ease of use, perceived usefulness, trust, brand image, government support, user innovativeness, and attitude are found to be significantly correlated with fintech adoption in Vietnam, while financial literacy was found to be not significantly correlated with fintech adoption. Furthermore, further analysis using multiple linear regression revealed user innovativeness and attitude have a positive impact towards fintech adoption, and in contrast, financial literacy showed significant negative impact on fintech. This inverse relationship could indicate that in Vietnam, fintech may play a role of bringing financial inclusion where people with lower financial literacy are able to use technology for financial transactions, which was previously inaccessible to them. This could also mean that Vietnamese with higher financial literacy do not see fintech as an important tool for their financial transactions, as they may already have strong access to traditional financial facilities. This research contributes to knowledge in the field of Fintech adoption in Vietnam at the time of the COVID-19 outbreak. To foster greater financial inclusivity and access for the Vietnamese consumers, policy makers could promote the development of fintech business infrastructure and regulatory sandboxes to foster fintech startups.
1. Introduction
The Vietnam economy has grown at an average rate of 6.7% annually from 1990 to 2020, higher than the ASEAN-5 (Indonesia, Malaysia, Singapore, Thailand, and the Philippines) economic growth of 4.8% in the same timeframe. In 2019, the income per capita in Vietnam was USD 2163, growing 2.570% from 1990 to 2019. The ASEAN-5 economies on the other hand grew at a lesser pace of 3.87% in the same period. Despite the steady economic growth and income per capita in Vietnam, the income distribution gap as measured by the Gini index reveals that the Gini index in Vietnam is 35.7 in 2018.
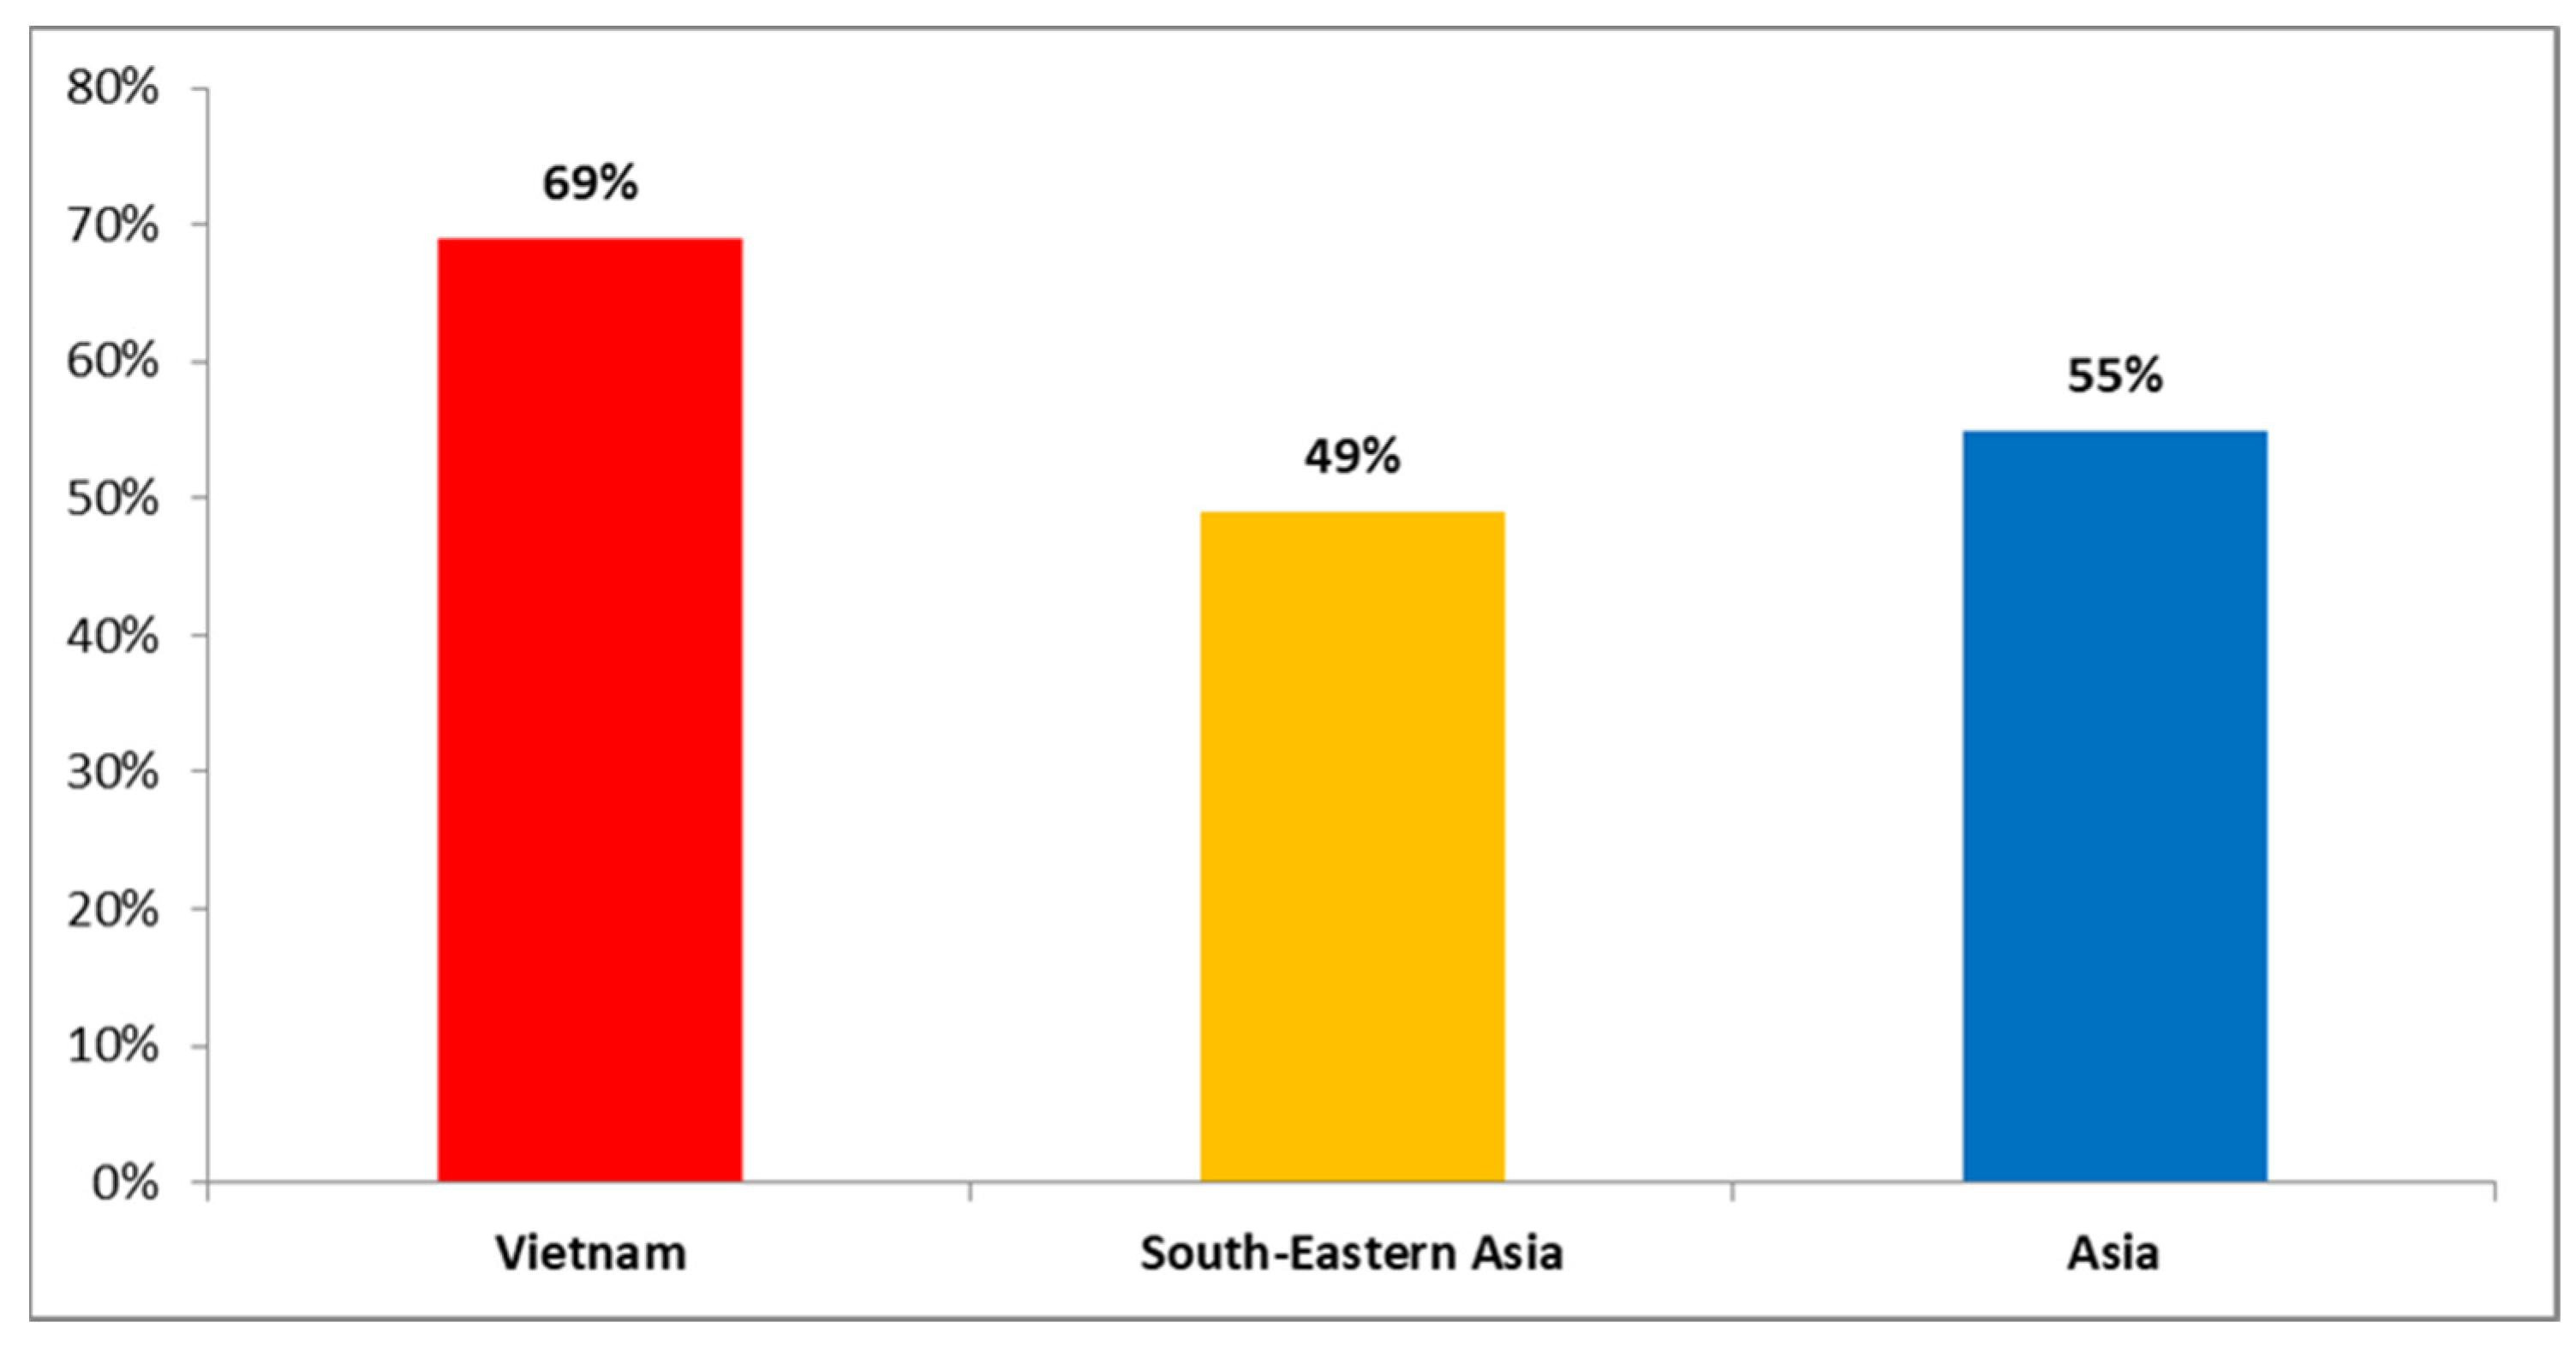
One of the strategies to narrow the income distribution gap is making policies that support the growth of the financial sector including financial technology (fintech) to increase financial inclusion, especially for unbanked people. Beck (2020) explains the unbanked population of individuals or businesses as those that do not have access to the financial institution. Unbanked individuals are often associated with the lower-income segment of the populatoin. In Vietnam, the unbanked population groups over the age of 15 are still relatively high (69%) compared with Southeastern Asia and Asia at 49% and 55% in 2017, respectively (World Bank 2017); as depicted in Figure 1 below.
The problem associated with the unbanked population can be seen from individual and country levels. For individuals, unbanked people relatively do not have a good saving habit. Karlan et al. (2014) explain that saving helps individuals and households in facilitating consumption and productive investment. Bruhn and Love (2014) explain that public access to the formal financial sector has a positive correlation with firm creation, economic growth, and reducing poverty levels.
Previous studies suggest that among the strategies that can be used to reduce unbanked population is the use of fintech. Fintech can reduce financially excluded persons and increase financial inclusion among community members (Bongomin and Ntayi 2020; Sahay et al. 2020). Fintech firms do this by bridging unbanked people to financial services through reducing transaction costs and unbundling services to provide products fit with customers’ needs (Patwardhan et al. 2018). In Ghana, fintech has revolutionized product design, delivery, and e-money to increase grocery businesses and the financial ecosystem (Government of Ghana 2020).
Another of fintech’s contributions to financial inclusion comes from Kenya. Mobile money transfer (m-Pesa) has been connecting more than 80% of Kenyan people to access financial services in 2019—the highest in Africa (Pazarbasioglu et al. 2020). New evidence from India depicts that fintech companies (FINO) provide services to enable unbanked people to have access to financial products using end to end and IT solutions with low cost and reliable financial transactions (Pazarbasioglu et al. 2020). Moreover, fintech development also shows spillover impact to social development, where it is found to promote a more equitable society (Bisht and Mishra 2016; Salampasis and Mention 2018). A recent study from Korynski (2019) found fintech has beneficial effects on financial health by providing users with easy access to information related to money management, including managing income and expenses in real time. Besides, the way fintech firms reach more customers by reducing cost of accessing financial services also plays a role in fostering financial health (Barefoot 2020).
Government support for fintech is necessary in this regard to encourage fintech proliferation in the economy. The government and policy makers could play a strategic role to support fintech companies by empowering them in order to advance the financial literacy and participation among people. This includes creating regulatory sandboxes and a good incentive to encourage investment in fintech. Financial literacy is a basic knowledge of finance that covers several aspects of finance such as numeracy, compound interest, inflation, and risk diversification (Lusardi 2019). The understanding of basic finance plays an essential role in managing an individual’s money, shaping investment behavior, as well as utilizing the new financial product. Vietnam’s government is also playing an active role in promoting access to technology and finance for its people. A recent study by Morgan and Trinh (2020) has highlighted the importance of financial literacy and individuals’ awareness of fintech products in Vietnam. It reveals that the correlation between financial literacy, fintech awareness, and adoption is positive.
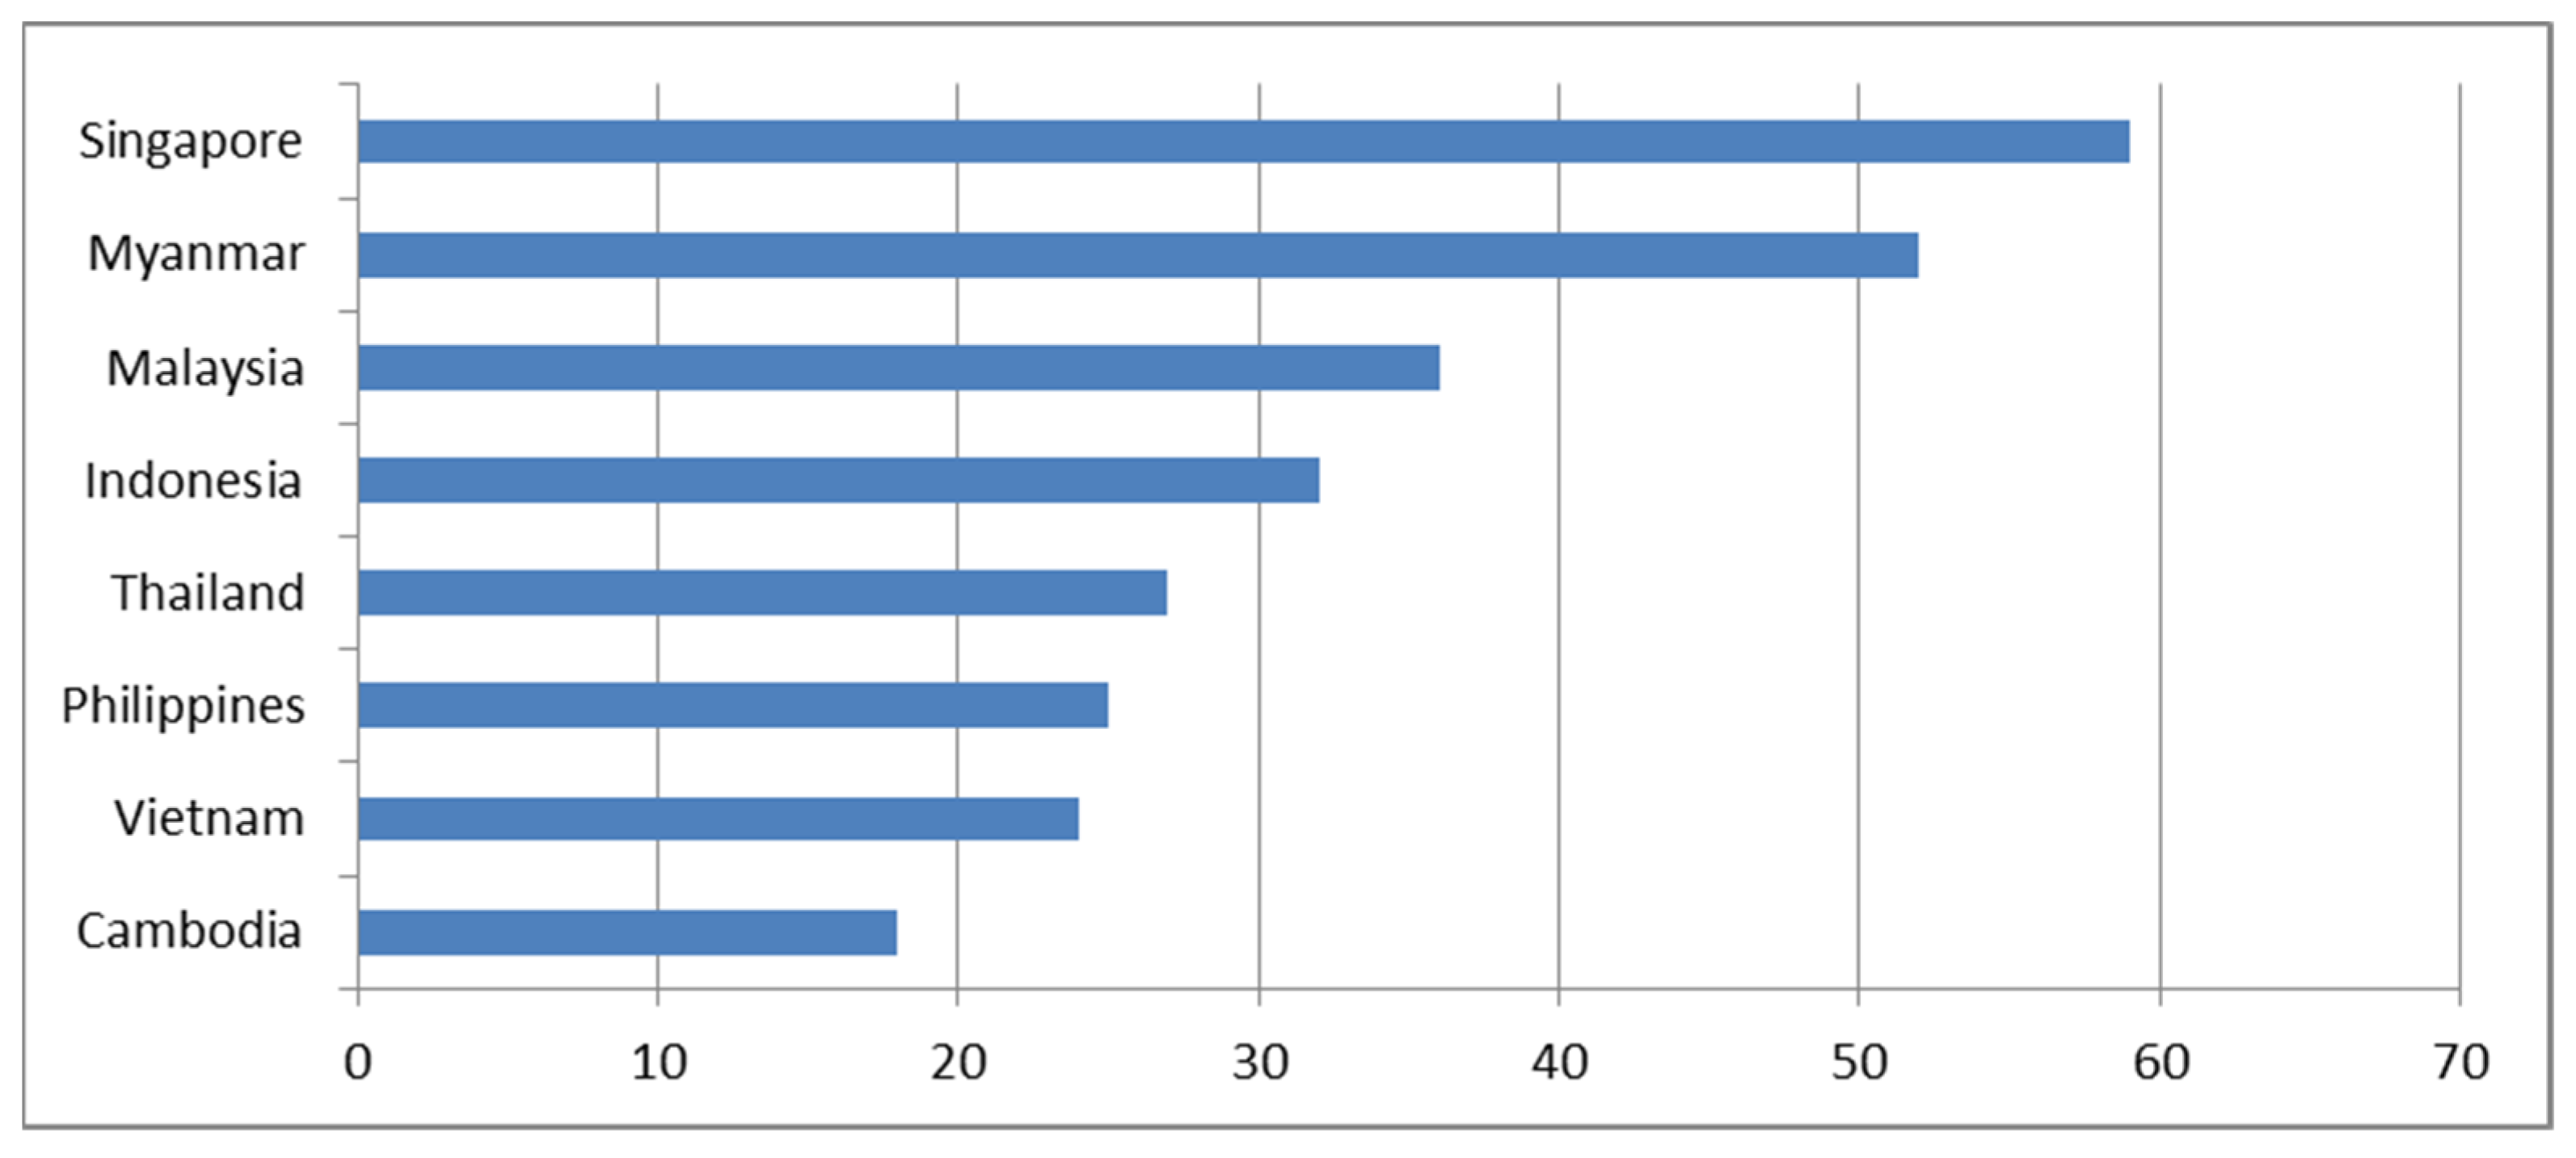
According to the Standard and Poor Global Finlit Survey 2014 reported by Klapper et al. (2015) on adult financial literacy, the score of adult financial literacy in Vietnam is 24%, lower than most in the region as visualized in Figure 2 below.
Financial literacy shows inverse correlation with the unbanked population. The higher the financial literacy of the people, the lower would be the country’s unbanked population. For instance, Vietnam, with a relatively low level of financial literacy (24%), has a high rate of unbanked population (69%). Additionally, Klapper et al. (2013) explain individuals with higher levels of financial knowledge experience lower negative impacts during a global financial crisis than a financially illiterate person. New evidence from Anand et al. (2020) also reveals that financial literacy knowledge plays a pivotal role in managing personal finance when facing the COVID-19 outbreak. In other words, a financially literate person would be more resilient during challenging economic situations.
Fintech plays an important role in democratizing finance in societies as well as making communities more financially resilient. The role of fintech, especially during the COVID-19 pandemic, is evident in how people are tech-educated in a rather short time to manage their finances digitally, having no experience with digital finance previously. During the COVID-19 pandemic, many people started obtaining access to financial transactions through mobile phones, including receiving government cash transfers via their mobile devices due to restrictions on peoples’ physical mobility.
Building on this momentum, the fintech industry needs the continuous support of government regulations and policies. According to the World Economic Forum (2020), regulatory innovation initiatives to accommodate financial innovation include regulatory sandboxes. Table 1 provides an overview of fintech service updates in six ASEAN countries including Vietnam.
Singapore continues to lead in the number of fintech companies, attracting more investment than other ASEAN countries, accounting for USD 379 million in 2020. Indonesia moved up to second place by securing a USD 180 million investment in the same year. The fintech ecosystem in Vietnam is up and coming and has improved in many aspects. Although they have only recently embarked in fintech, as of the year 2020, there are 141 companies that provide fintech services in Vietnam. Vietnam’s fintech firm (Fvndit) secured USD 30 million in 2020 for its fintech ventures. The existence of adaptive regulation is important to foster fintech to grow faster. Goo and Heo (2020) describe how regulatory sandboxes positively impact fintech development by removing the regulatory uncertainty and barriers.
Government incentive and seed funding from venture capital (VC) and private equity (PE) play a significant role in encouraging the activities of fintech companies in the early stage because banks are less willing to provide funds due to high risk (David et al. 2020). The study conducted by Jeong et al. (2020) on 363 companies explained that startups that received investment from VC at the initial stage had a better and more sustainable performance. Apart from that, investors also have a pivotal role in defining the strategy formulation of fintech companies. For example, the investment provided by the International Finance Corporation (IFC) to FINO in India of USD 7.3 million in the form of equity investment encourages companies to provide financial access for urban and low-income people, which are underserved by the current banking sector (IFC 2020).
Vietnam has been growing steadily with increasing internet access and smartphone penetration of 57% and 45%, respectively (Fintech Singapore 2020), however, as discussed earlier, the country’s financial literacy is relatively lower than the ASEAN average. However, this study argues the COVID-19 pandemic would have positively impacted people’s financially literacy as many learnt to use mobile finance during the physical distancing and lockdown phase of the pandemic. As fintech studies in Vietnam are scarce and post-pandemic financial literacy of the people are less known, this paper presents descriptive results of an ongoing study in Vietnam which is investigating financial literacy and fintech adoption in Vietnam. In this paper, the descriptive statistics of 30 respondents who participated in this research are presented and discussed.
The rest of the article is structured as follows. Section 2 presents the critical review of the existing literature, which includes a variety of findings pertaining to the factors affecting fintech adoption. The third section explains the data and methodology used in this study, and Section 4 displays empirical results based on the statistical analysis and its interpretation, followed by a discussion of the findings. Section 5 provides the conclusion and recommendation, while Section 6 discusses the limitations of the study as well as suggestions for further research.
2. Literature Review, Hypotheses, and Research Framework
Financial technology, also known as fintech, is not a new phenomenon, however, it has gained more attention in recent years. Arner et al. (2015) define fintech as a combination of financial services and information technology. Fintech adoption can be viewed as the ability to use financial applications through various electronic devices such as smartphones, tablets etc. In this study, Fintech adoption is conceptualized using the Technology Acceptance Model (TAM). Davis (1985) proposed TAM to test users’ internal belief toward the acceptance of information technology.
For some countries, fintech adoption is growing at a rapid pace. The EY report (EY 2019) states that 87 out of 100 residents in China and India have adopted fintech, followed by Russia and South Africa at 82%. The development of fintech is also driven by the convenience provided by fintech compared with traditional financial services. First, registration can be performed online and access more easily than traditional financial institutions that still do it manually. Fintech companies can reach potential consumers in rural areas as long as users have smartphones and an internet connection, in contrast to traditional financial services, which tend to open new branches to reach consumers. Itundoubtedly impacts companies’ cost of funds and ultimately impacts the costs of financial services imposed on consumers (Maurer 2012).
Currently, fintech services are not only applied in the banking industry and investment funds, but also spread to almost all sectors, including telecommunications and wholesale (Singh et al. 2020). Although fintech plays an essential role in supporting economic activities, the adoption of fintech is still facing challenges in several countries. The study from Ryu (2018) explains that the factors inhibiting fintech adoption include financial risk, legal uncertainty, security and privacy, and the inadequate operational system of fintech companies. In addition, low levels of financial literacy are also a barrier to public awareness in fintech adoption (Morgan and Trinh 2019; Yoshino et al. 2020).
Several recent works have highlighted fintech adoption and associated it with behavioral intention and continuous usage intention. Zhao et al. (2009) explain behavior intention as a person’s desire to take a particular action. Hu et al. (2019) integrate moral intention and external variables such as government support and brand image, while Troudi and Bouyoucef (2019) adopt fintech and customer behavior toward green cosmetic products. Furthermore, the movement to adopt fintech from an intention to continue using fintech has encouraged the study of continuous usage intention. Avornyo et al. (2019) integrates behavioral intention with two dimensions from perceived enjoyment and perceived innovativeness to measure the sustainable use of fintech. Meanwhile, Junger and Mietzner (2020) and Hu et al. (2019) integrate trust and transparency to utilize the technology.
Most of the previous research focused on behavior intention, but less investigated the impact of fintech adoption and its relation to financial literacy and financial health, especially during the COVID-19 pandemic. Therefore, this study seeks to investigate the relationship between factors that lead to the adoption of fintech among Vietnamese users during the COVID-19 pandemic, while assessing their overall financial health during the pandemic.
Research Hypotheses
Financial literacy is the level of individual knowledge in understanding the basics of a financial subject. Financial literacy has been found to be positively associated with fintech adoption (Morgan and Trinh 2020; Junger and Mietzner 2020). Davis (1989) explain Perceived Usefulness (PU) as a level of the extent to which technology can be useful for improving performance. This variable is an essential construct in determining technology adoption (Chen and Barnes 2007). Previous studiesconducted by Davis (1989), Hu et al. (2019), and Singh et al. (2020) explain that PU has a significant relationship to technology adoption, including fintech.
Perceived Ease of Use (PEU) is associated with the level of an individual’s effort to use technology (Davis 1989). Previous studies integrated PEU with fintech adoption by Cheng et al. (2006), Wang et al. (2003), and Hu et al. (2019). The results of these studies explain that PEU has a significant relationship with technology adoption. The manifestation of trust in technology adoption is described by Kim and Prabhakar (2002) as a form of trust, meaning that individuals are taking risks since they have placed themselves in a vulnerable situation. Trust in this study refers to user trust regarding the security of personal data and that fintech can provide good products for users. Previous research investigating the relationship between trust and technology adoption was conducted by Nathan (2009), Chong et al. (2010), and Sanchez-Torres et al. (2018).
Previous research on brand image and technology adoption was conducted by looking at various aspects, i.e., brand image associated with quality (Riyadh et al. 2010) and brand image integrated with value (Shapiro et al. 2018). This study views brand image (BI) by looking at user preferences in choosing a fintech company based on brand familiarity, including the company’s reputation. The studies by Ha and Perks (2005), Ruparelia et al. (2010), and Hu et al. (2019) explain that brand image has a significant relationship to fintech adoption.
Government Support (GS) plays an important role in the development of the fintech industry. The government can be actively involved by creating policies that support the fintech industry so that it continues to develop, both for fintech entrepreneurs and investors. The study conducted by Goo and Heo (2020) explained that the government’s active role had a positive impact on the development of fintech by reducing uncertainty. Previous studies carried out by Jaruwachirathanakul and Fink (2005), Marakarkandy et al. (2017), and Hu et al. (2019) describe that government support has a positive correlation with technology adoption. In this study, GS looks at government’s role in supporting the fintech industry in soft infrastructures, such as creating favorable legislation and regulations and hard infrastructure by expanding the Internet network.
Lu et al. (2005) depict User Innovativeness (UI) as the extent to which someone is willing to experiment with new technology. Meanwhile, Hu et al. (2019) explain user innovativeness as a level of acceptance by an individual to try new products, new technology, or new services. The readiness to accept the presence of new technologies is a major driver for technology adoption. User innovativeness in this study is defined as an intention to try new technology, become a pioneer in using the latest technology, and a willingness to experiment with fintech services. Previous research has explained that user innovativeness has a significant relationship with technology adoption (Morosan and DeFranco 2014; Zhang et al. 2018; Hu et al. 2019).
Ajzen (1993) defines attitude as an individual’s disposition to achieve likes and dislikes towards an object, behavior, person, institution, or event. In this study, this research measures attitude by seeing whether someone believes that using fintech services is a good idea, provides comfort, and creates user interest in using fintech services. Previous research related to attitude and technology adoption has explained a significant relationship between the two variables (Grabner-Krauter and Faullant 2008; Chuang et al. 2015; Hu et al. 2019). In the context of fintech adoption during the COVID-19 pandemic, Vasenska et al. (2021) revealed that there has been a shift in respondent attitudes as a result of COVID-19, with persons who utilize fintech using technology more frequently during the COVID-19 pandemic than before the crisis.
In this paper, as the COVID-19 pandemic is still ongoing during the data collection of this study, users’ Financial Health is also measured to assess their financial resilience and preparedness in times of crisis. Questions such as impulsive usage of credit cards, panic buying, and savings erosion are measured. This study proposed the hypotheses as follows:
Hypothesis 1 (H1).
There is positive relationship between financial literacy and fintech adoption in Vietnam.
Hypothesis 2 (H2).
There is positive relationship between perceived usefulness and fintech adoption in Vietnam.
Hypothesis 3 (H3).
There is positive relationship between perceived ease of use and fintech adoption in Vietnam.
Hypothesis 4 (H4).
There is positive relationship between trust and fintech adoption in Vietnam.
Hypothesis 5 (H5).
There is positive relationship between brand image and fintech adoption in Vietnam.
Hypothesis 6 (H6).
There is positive relationship between government support and fintech adoption in Vietnam.
Hypothesis 7 (H7).
There is positive relationship between user innovativeness and fintech adoption in Vietnam.
Hypothesis 8 (H8).
There is positive relationship between attitude and fintech adoption in Vietnam.
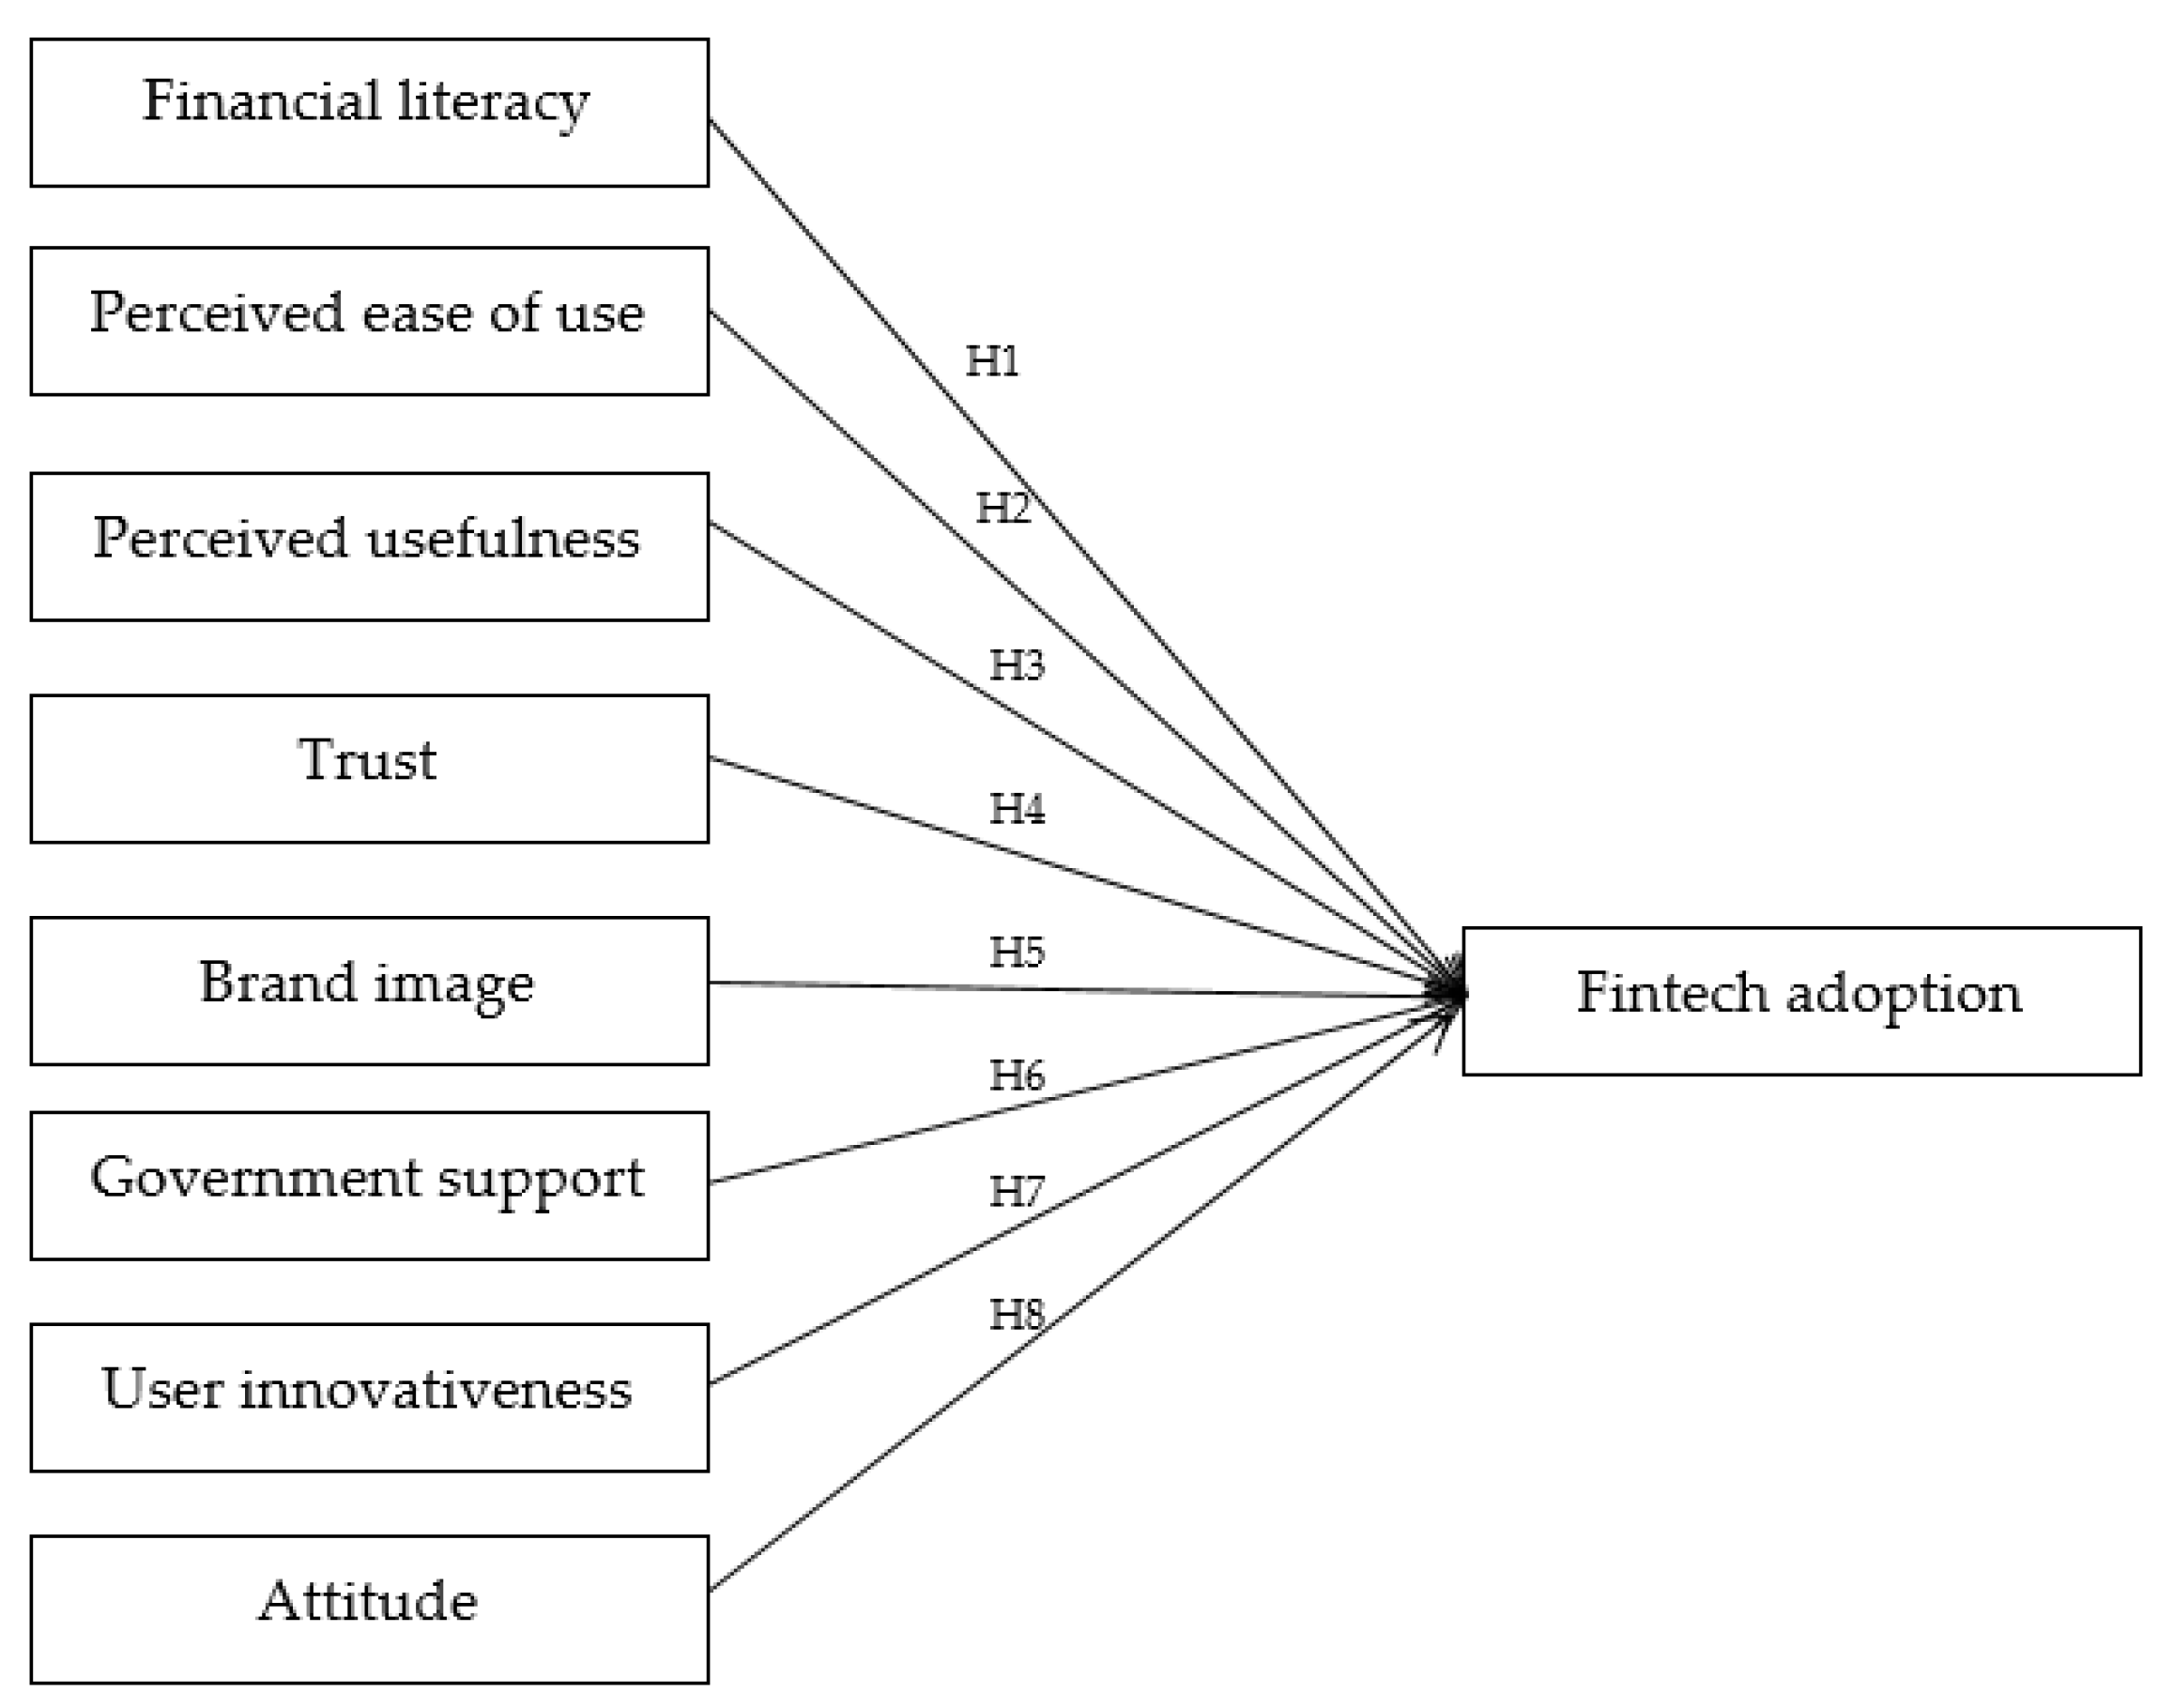
Figure 3 depicts the research variables in this study and their proposed relationship towards fintech Adoption. Altogether, eight hypotheses are forwarded for testing. Table 2 below shows the source of indicators for each research variable measured in this study. All indicators were measured using a Likert scale from 1 (strongly disagree) to 5 (strongly agree).
3. Research Methodology
This research gathered primary data to validate the research objectives. Respondents who are familiar with fintech services are selected to participate in a face-to-face interview using judgment sampling technique. The online survey questionnaire which was originally developed in English was translated into the Vietnamese language by a qualified native Vietnamese speaker. The questionnaire was divided into two sections: section one has questions on general demographic information of respondents covering gender, age, occupation, education, income range, fintech usage frequency and purpose; the second section contains indicators measuring the research independent and dependent variables.
A research assistant who is a native Vietnamese speaker personally contacted the participants and explained the objectives of this study to prospective participants. Based on participants’ familiarity with fintech services, availability, and willingness to participate, they were interviewed and provided with an online questionnaire link where they could provide their response too all the research questions. The participants could also ask for clarification from the research assistant during the entire responding process.
This study collected data from 30 respondents. The limited number of respondents is caused by restrictions of public activities and direct communication between researchers and respondents during the pandemic outbreak. However, the total sample size collected met the criteria for statistical regression analysis. Warner (2008) suggests a minimum sample size of 20 and Jenkins and Quintana-Ascencio (2020) posit that a sample size of 25 is sufficient for regression.
4. Results and Discussion
Table 3 shows the respondents age distribution. The age group of 36–45 has a higher percentage (50%), followed by the age group of 26–35 at 23.3%. Table 4 shows that people working in the public sectors accounted for the highest proportion (30%), followed by private sector employees at 26.7%.
Table 5 displays the education background of respondent, people with a bachelor’s degree and postgraduate degrees are represented by 60% and 33.3%, respectively. Table 6 shows the monthly income of the respondents. Respondents with income ranges from VND 5 M to 10 M and more than VND 20 M accounted for 30%.
Table 7 shows fintech usage frequency by respondents. Data shows 33.3% of participants use fintech services more than four times a week. Meanwhile, respondents who used Fintech from 2 to 3 times a week accounted for 23.3%. Four participants out of thirty (13.3%) had no prior experience using fintech services. Most participants, both male and female, use fintech services for personal uses, as presented in Table 8.
There were 16 male and 14 female participants, hence a gender analysis was carried out against fintech usage frequency, using cross-tabulation and Chi-Square test. The result is shown in Table 9 and Table 10.
In general, the data shows that female respondents use fintech services slightly more than male respondents. Male respondents who had never used fintech accounted for 18.8%, higher than females (7.1%). Based on the result of the Chi-Square test, there is no significant gender difference in their fintech usage frequency.
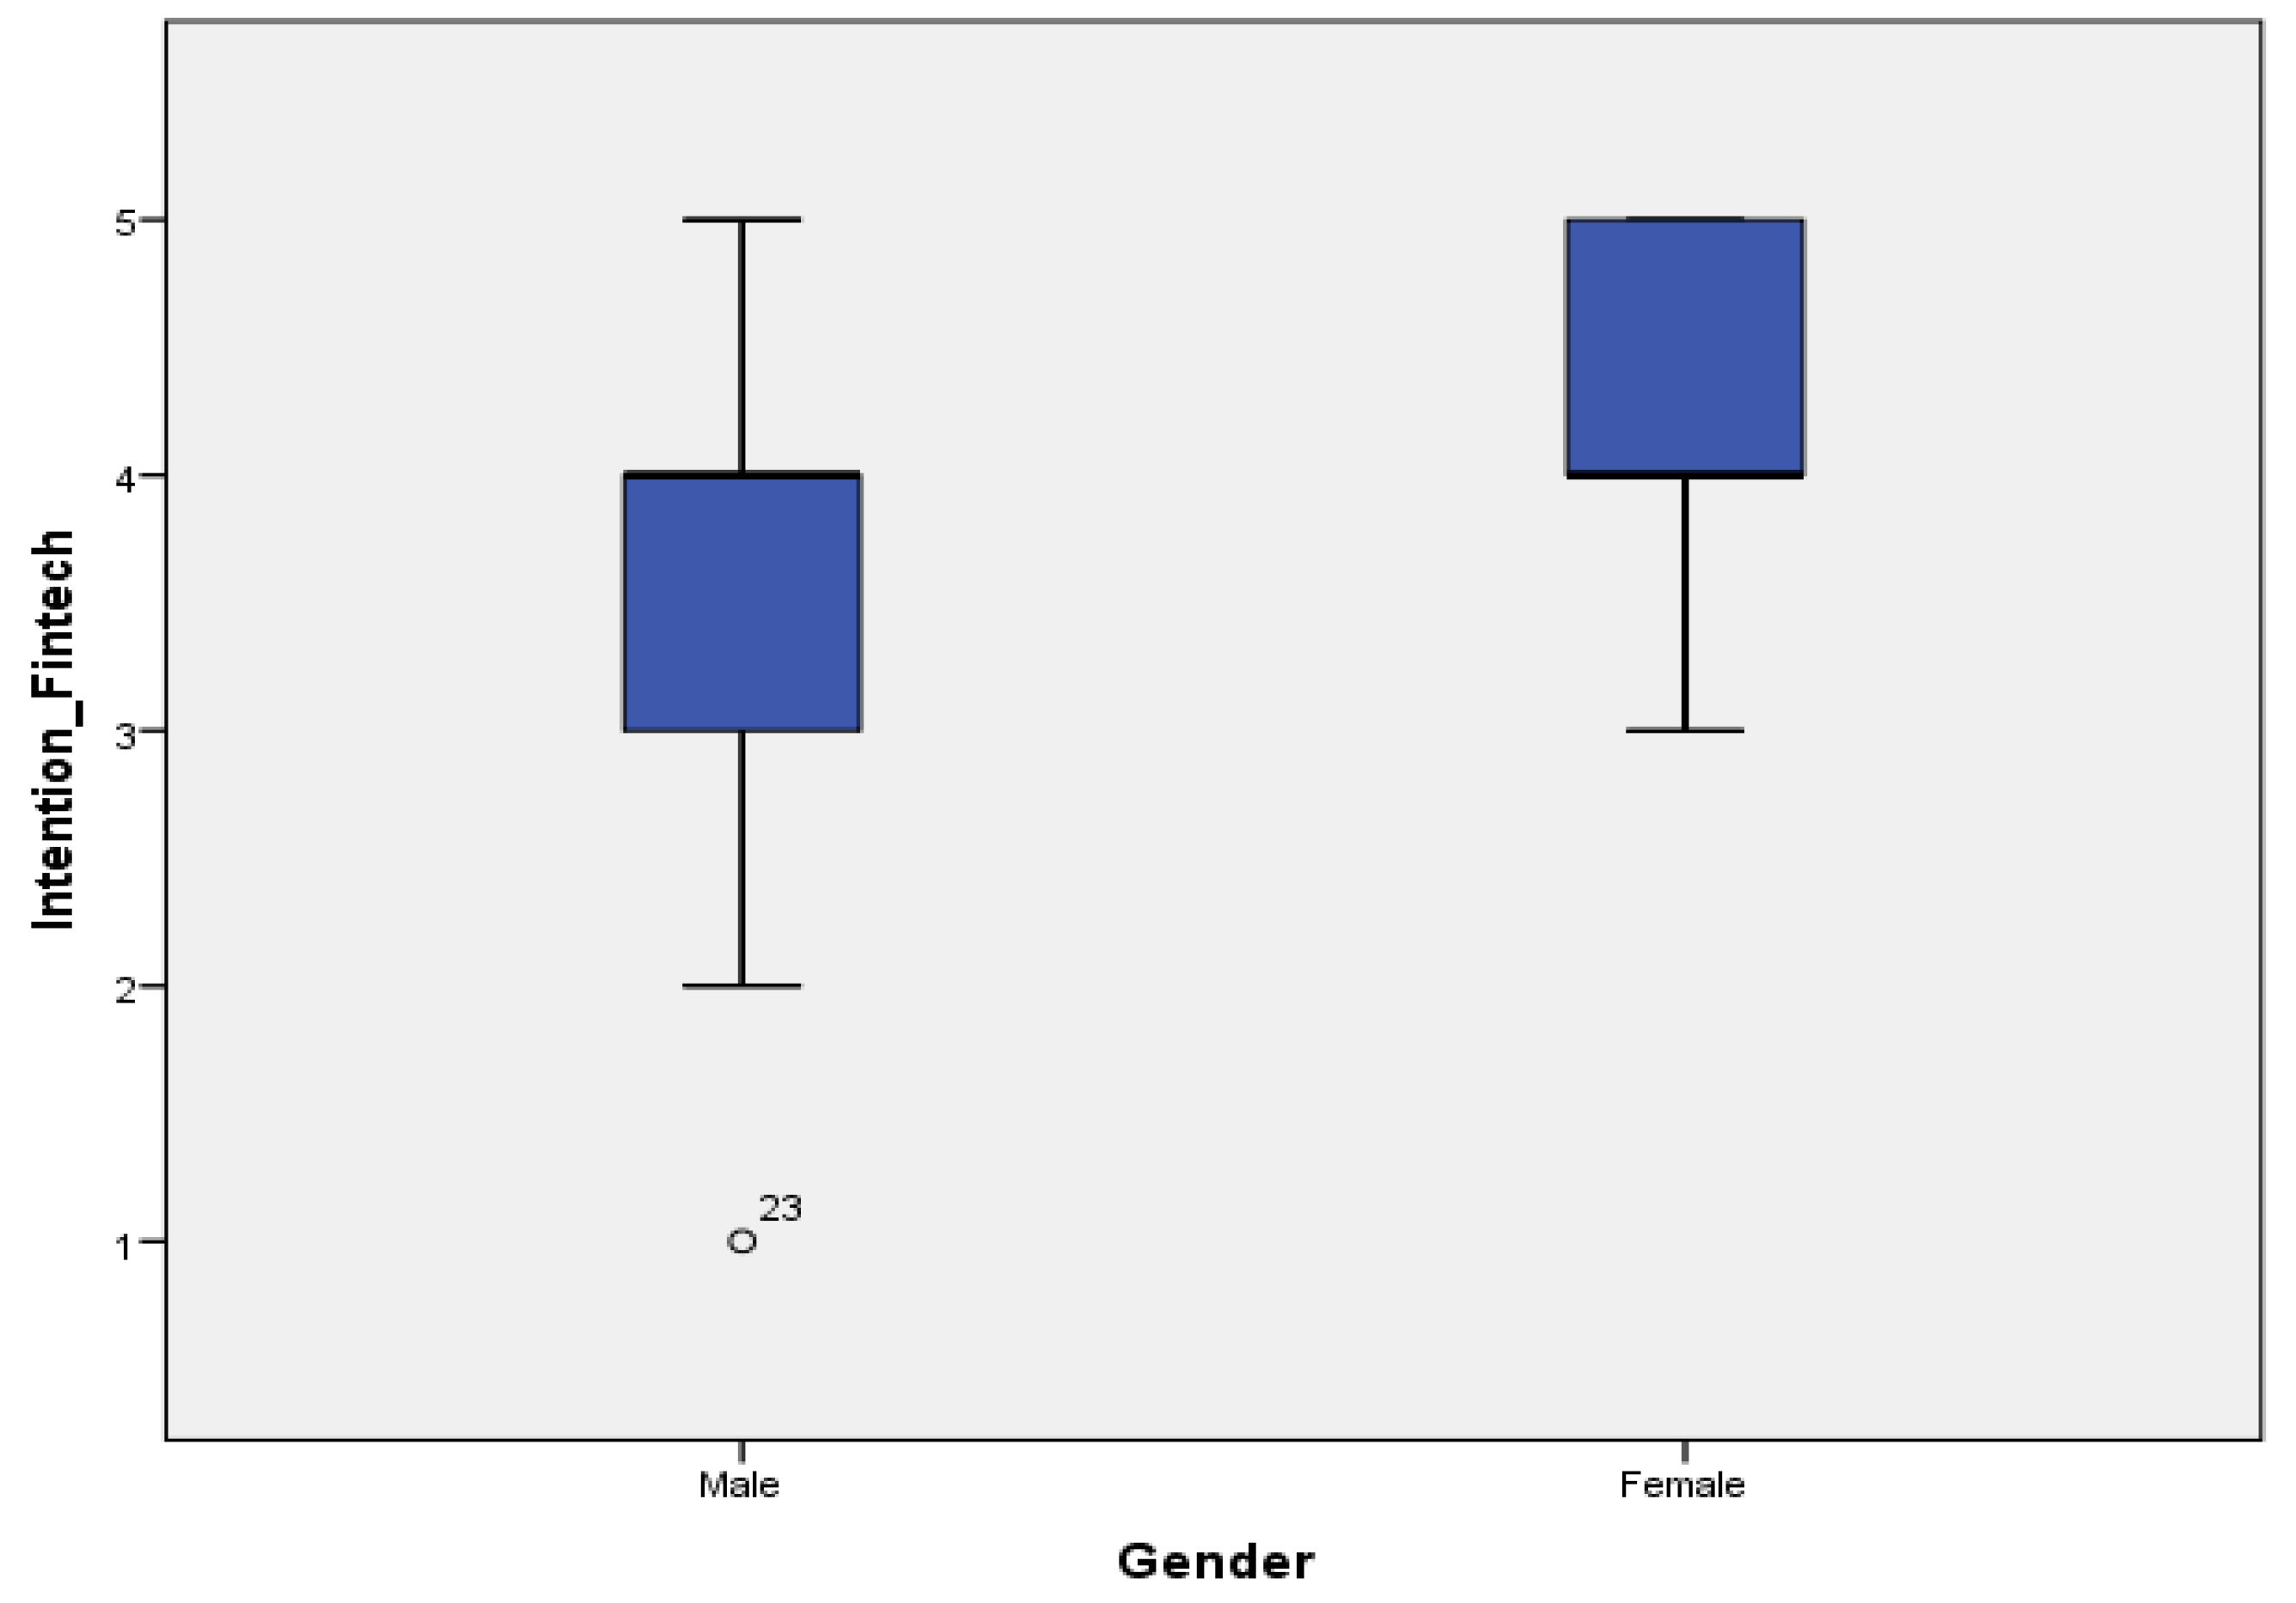
Figure 4 shows boxplots of fintech adoption by gender. Overall, female respondents had higher scores on fintech adoption than male respondents. Male respondents (23) responded very low (strongly disagree) to fintech adoption.
Table 11 shows that generally all mean scores are higher than 3 for all factors. Perceived Usefulness has the highest mean score of 4.00 followed by User Attitude (3.90). In contrast, trust has the lowest mean score of 3.03, while User Innovativeness is thesecond lowest with 3.06.
The result of Table 12 shows males and females have the highest mean score for Perceived Usefulness at 3.68 and 4.35, respectively. Overall, female respondents have higher scores for all factors compared with male respondents.
Pearson correlation analysis was performed to examine the significance and strength of association between research factors and fintech adoption, the result is presented in Table 13.
All factors are significantly correlated with fintech adoption, except for Financial Literacy which shows no significant association with fintech adoption. To further investigate the relationship of the research variables towards fintech adoption, and to confirm the research hypotheses; a multiple linear regression analysis was carried out.
Table 14 shows the model fit (p < 0.01), while Table 15 shows in detail the impact of each research factor towards fintech adoption.
The regression result shows three out of eight independent variables significantly impact fintech adoption, including financial literacy, user innovativeness, and user attitude. H7 and H8 are supported, while the other hypotheses H1 to H6 are not substantiated. Financial Literacy (H1) though significant, however the result shows a significant negative impact on users’ fintech adoption, contrary to what was predicted in Hypothesis 1, hence H1 is not supported. This result suggests that Vietnamese users with higher financial literacy have an inverse relationship with adopting fintech in Vietnam. This is a peculiar result contrary to the popular belief and findings from the previous literature, such as Morgan and Trinh (2019, 2020) and Junger and Mietzner (2020), who found a positive relationship between financial literacy and fintech adoption intention. This inverse relationship could indicate that in Vietnam, fintech may play a role of bringing financial inclusion where people with lower financial literacy are also able to use technology for financial transactions, which was previously inaccessible to them. This could also mean that Vietnamese with higher financial literacy do not see fintech as an important tool for their financial transactions, as they may have strong access already to traditional financial facilities. This concurs with the findings of a recent study by Panos et al. (2020), who also found financial literacy negatively relates to people’s adoption of financial technology-based products in a study geared towards cryptocurrencies.
In addition, findings show user innovativeness has significant positive impact on fintech adoption in Vietnam. Personal innovativeness to new technologies is essential in improving experiences and creativity, including technology adoption. A recent study by Twum et al. (2021) and Setiawan et al. (2021) also found that user innovativeness influences fintech adoption both directly and indirectly.
User attitude is also found to have significant positive impact towards fintech adoption. The perception that fintech services provide satisfaction when conducting financial transactions motivates fintech service users to adopt financial technologies. Recent studies by Rahman et al. (2021) and Setiawan et al. (2021) agree similarly that user attitude impacts financial technology adoption positively.
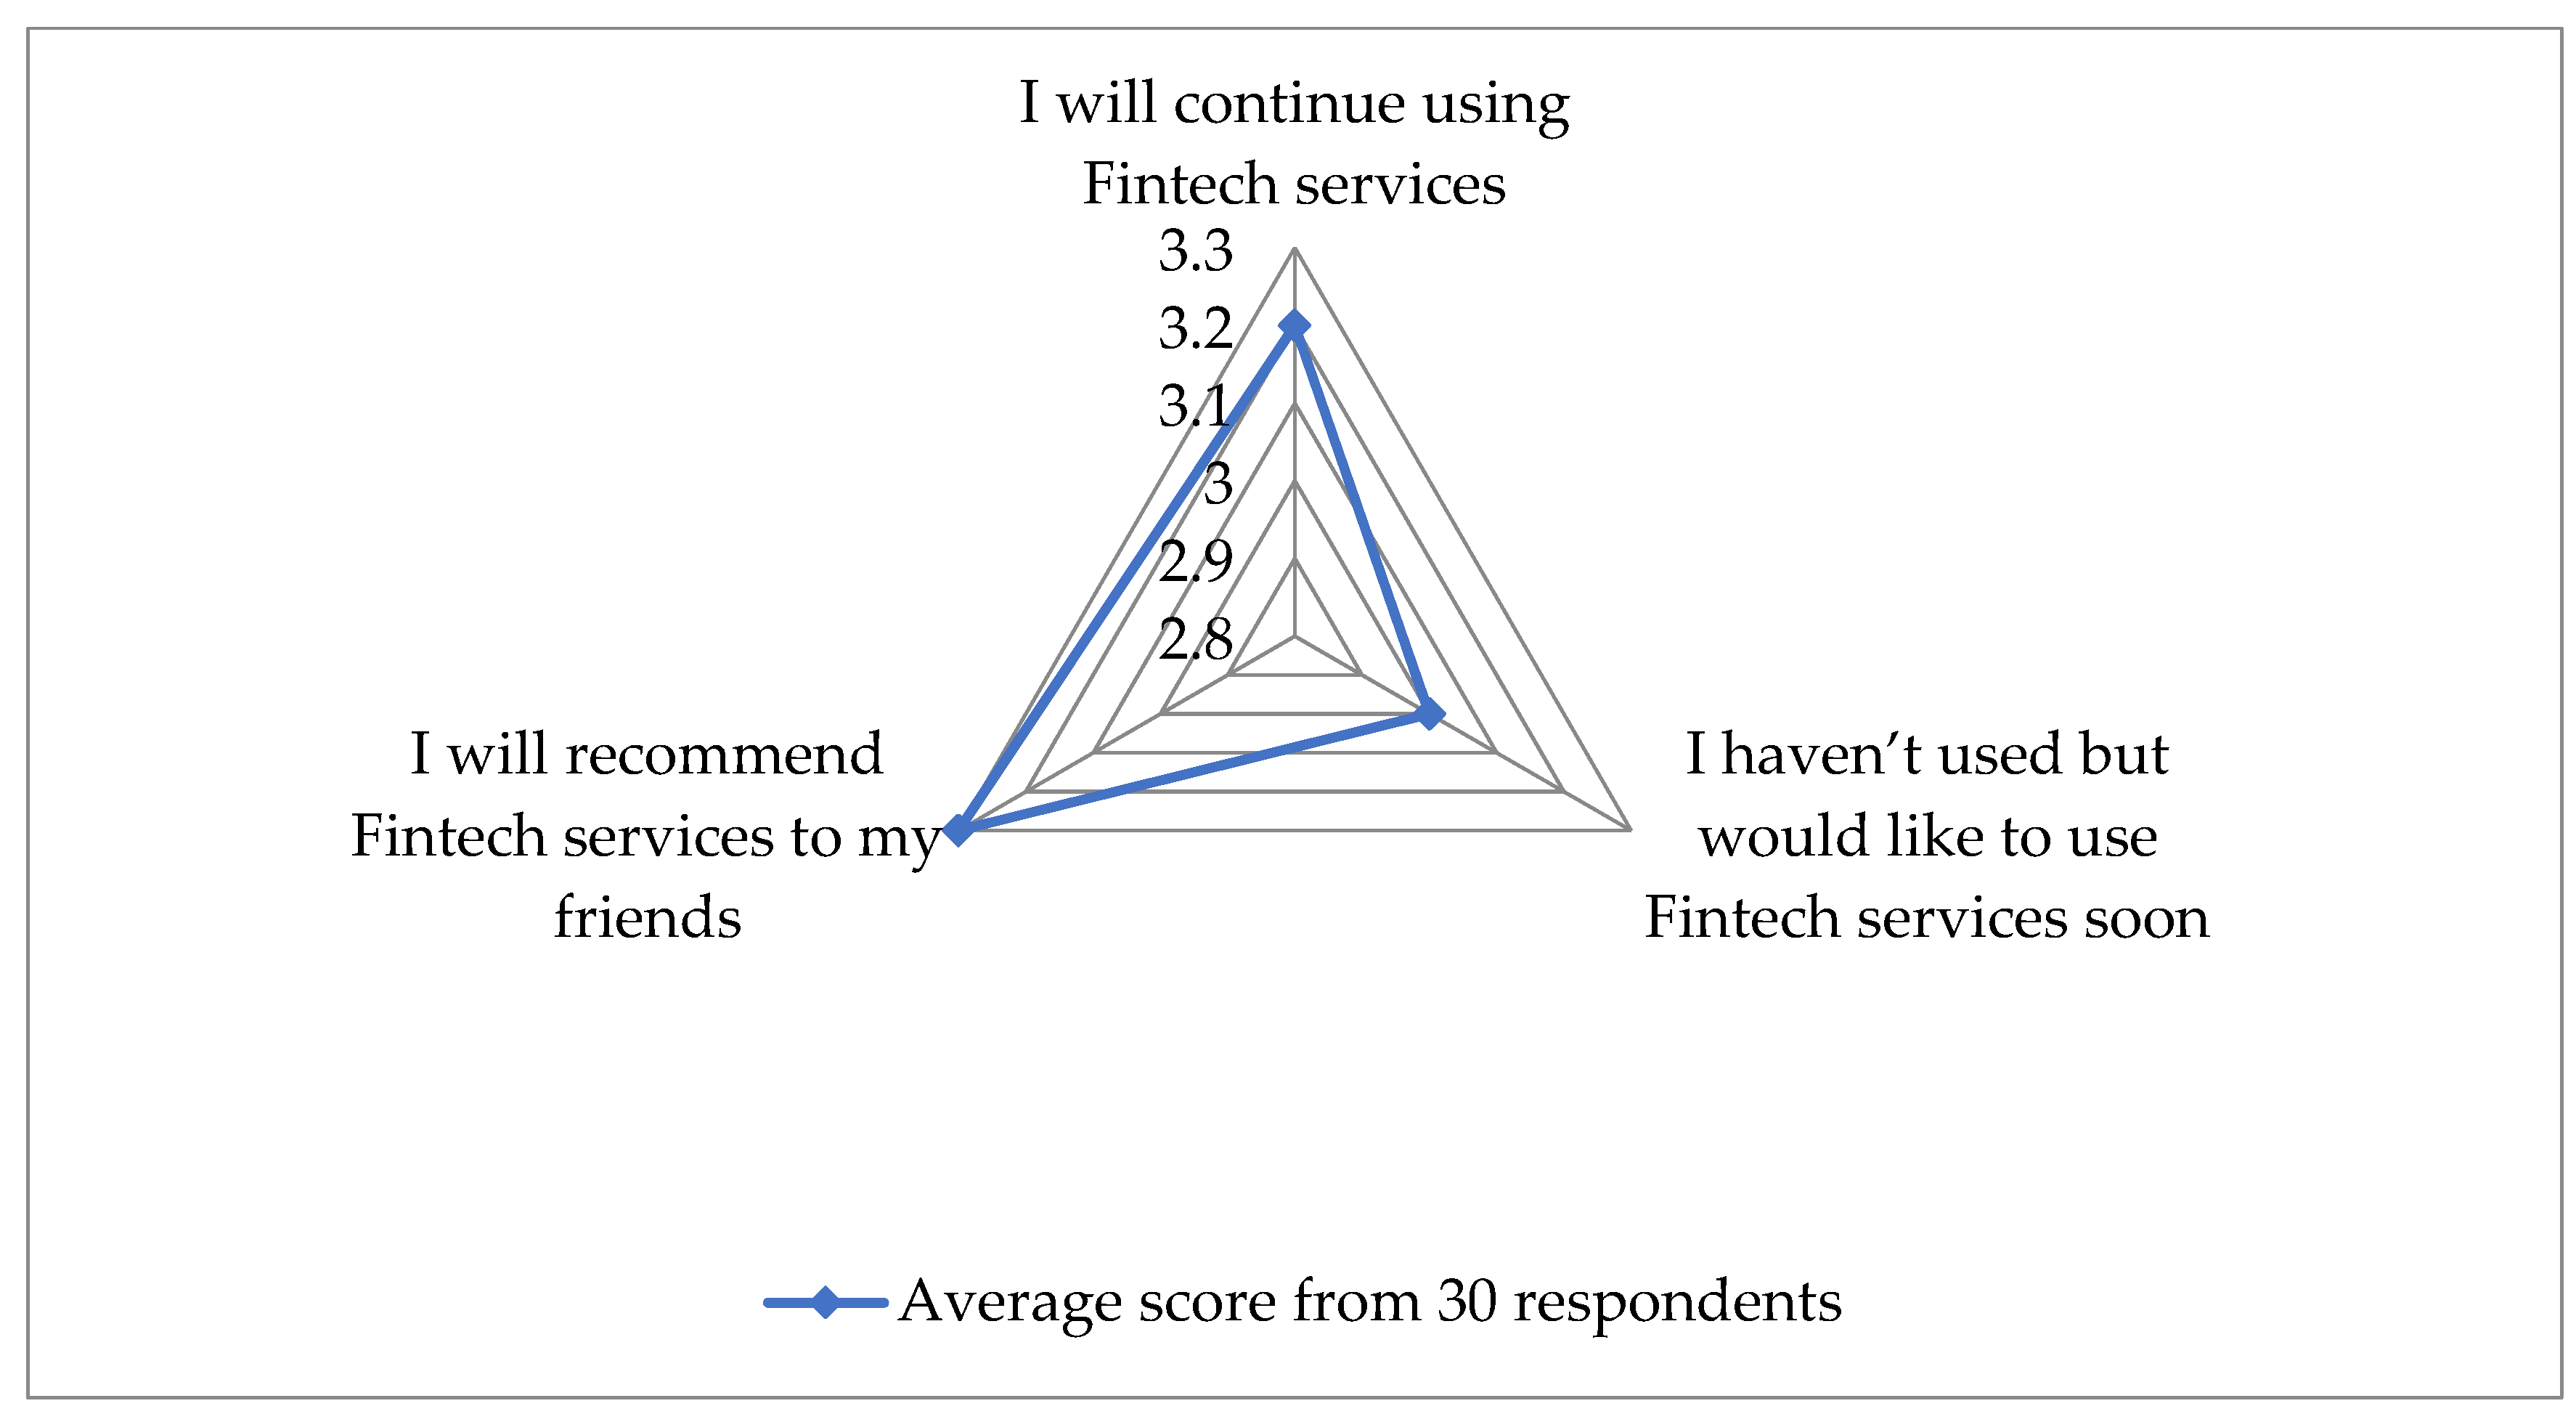
Figure 5 visually represents user agreements to statements measuring overall fintech adoption in Vietnam. It generally depicts a positive outlook for fintech among Vietnamese users.
Further analysis was carried out to examine gender differences in the results. Table 16 and Table 17 presents the analysis.
Table 16 and Table 17 show that males and females significantly differ in their perceived ease of use and user attitude. Perceived usefulness and fintech adoption are also significantly different for gender (female has a higher mean for both) at a 10% significance level. This indicates that female fintech users in Vietnam generally perceive fintech as much more favorabe compared with male users.
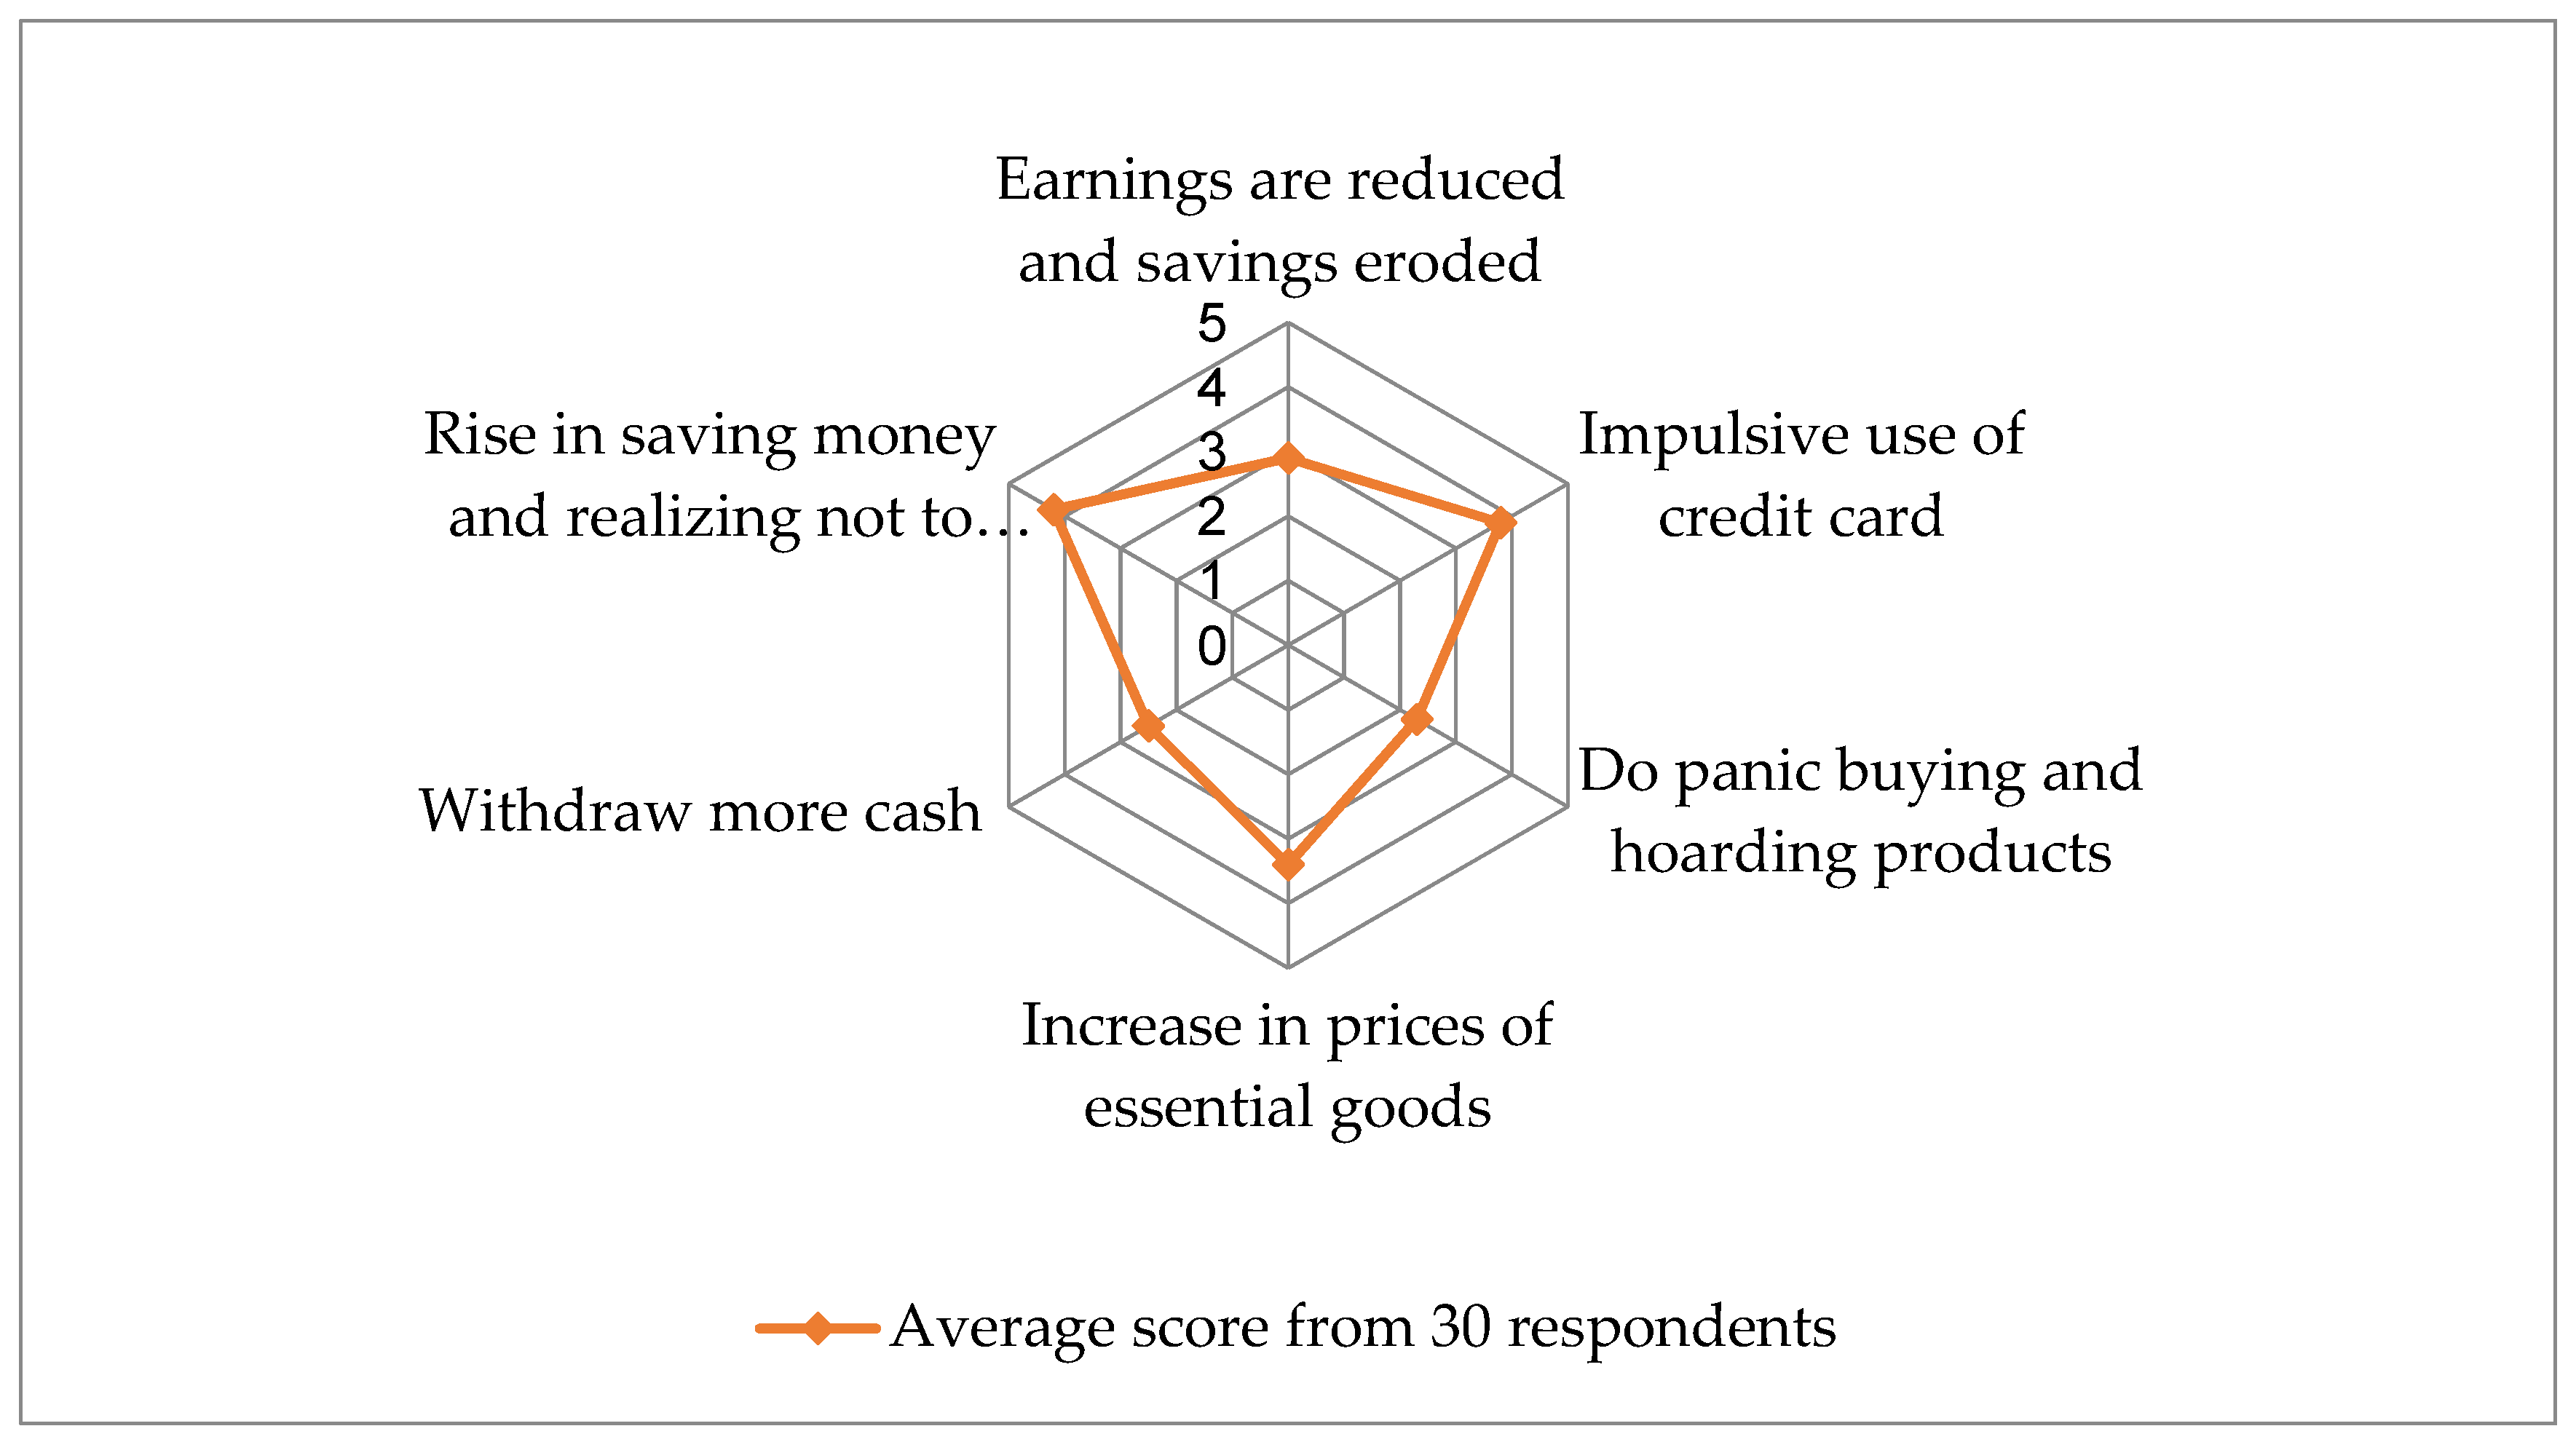
This study also collected and reported information about respondents’ financial health (FH) during the COVID-19 pandemic by measuring several indicators as pesented in Table 18.
Table 18 suggests a rise in the habit of saving money among respondents. Overall, there is a significant increase in people becoming more conscious in finance and consumption behavior. Overall, female respondents rated five financial health indicators higher than males, except for FH5. An independent sample t-test analysis was carried out to assess any statistically significant diffences among these gender-grouped means. The results show a p-value of 0.036 (below 5% sigficiance level) for FH3, while others show no statistical difference.
This finding indicates that during the recent COVID-19 pandemic, female respondents tended to do more panic buying and hoarding of products than their male counterparts. Panic buying is frequently driven by fear associated with uncertainty, which causes people to purchase more than they usually would (Lins and Aquino 2020). Zolotov et al. (2020) found that females had a higher level of fear than males during the pandemic, and this could be due to their role as mothers or purchasing essential goods for their families, as well as their concerns about product scarcity triggered by the health crisis (Yuen et al. 2020). Figure 6 illustrates COVID-19’s impact on the financial health of respondents in Vietnam.
5. Conclusions and Recommendation
This paper presents fintech adoption factors and financial health among fintech application users in Vietnam during the COVID-19 pandemic. In the last two decades, Vietnam has shown rapid economic growth compared with other ASEAN countries. However, the number of unbanked populations is still relatively high, followed by a low level of financial literacy among young generations compared with neighboring countries. Vietnam currently has 141 fintech companies, and this number is expected to grow with government initiatives and support for digitalization.
There is significant positive correlation between factors that promote fintech and fintech adoption in Vietnam. It shows that the community is digitally advanced and open for adoption of new innovations in the financial sector. Although the unbanked population data shows high unbanked populations in Vietnam, this is probably due to the unaccounted number of people who may not use conventional banking services but have started using fintech services for their financial needs, which includes mobile payments. If the rising number of fintech users can be captured, this study believes that the currently reported high figures of unbanked populations in Vietnam could be reduced. Moreover, the government could formulate a policy framework to provide regulatory sandboxes to support fintech innovation and business incubator activities to enable fintech start-up companies to grow and play an essential role in increasing financial inclusion for lower-income groups in Vietnam.
Government support and policies in accelerating the digitalization of the nation, coupled with progressive policies that allow for fintech sandbox initiatives in the country, are believed to be a step in the right direction to bring financial access to the initial financial unserved population. The government and financial industry’s initiatives to work collaboratively to promote the proliferation of a financial-based technology start-up ecosystem need to be scaled up to advance digital financial inclusion in Vietnam. This would lead to greater financial inclusion of the low-income communities and potentially lead to poverty alleviation among these communities.
6. Limitation and Suggestions for Future Studies
This research suffers limitation of large sample data collection due to the lack of access to respondents during the COVID-19 lockdown in Vietnam. However, the framework put forth in this study may be replicated for fintech adoption and financial health studies in developing economies.
Further study could investigate deeper into the financial literacy aspect of users and how it impacts their participation in fintech as well as the overall digital economy. This has been a significant peculiar finding of this study, where financial literacy is found to be inversely related to fintech adoption. Future study could test this phenomenon in other developing economies and compare this finding with developed economies. Also, the role of fintech in poverty alleviation of low-income group is to be further investigated in both urban and rural communities in Vietnam as well as other ASEAN countries. Finally, future research may also focus on business participation in fintech, including Small Medium Enterprises’ (SMEs) adoption of fintech.
There is evidence in this study that suggests Vietnamese women tend to participate more in fintech, as well as do more panic buying during the pandemic. As previously Vietnam is believed to be a matriarchal society, coupled with this finding; this calls for a further investigation into the current and future role of women in the fast advancing digital economy of the Socialist Republic of Vietnam.
Author Contributions
Conceptualization, R.J.N., B.S. and M.N.Q.; methodology, B.S. and R.J.N.; software, B.S. and R.J.N.; validation, R.J.N., B.S. and M.N.Q.; formal analysis, B.S. and R.J.N.; investigation, R.J.N., B.S. and M.N.Q.; resources, M.N.Q.; data curation, R.J.N., B.S. and M.N.Q.; writing—original draft preparation, B.S. and R.J.N.; writing—review and editing, R.J.N., B.S. and M.N.Q.; supervision, R.J.N.; project administration, R.J.N.; funding acquisition, R.J.N. All authors have read and agreed to the published version of the manuscript.
Funding
This research is funded by the Fundamental Research Grant Scheme (FRGS), Ministry of Higher Education, Malaysia FRGS/1/2020/SS0/MMU/02/7 (MMUE/190256) Project ID: 18086; and supported by the Research Management Centre (RMC) of Multimedia University, Malaysia. The data presented, statements made and views expressed are solely the responsibility of the authors.
Data Availability Statement
The data presented in this study are available on request from the corresponding author.
Acknowledgments
The authors thank the reviewers for providing suggestions to improve and present the results better in this article. Secondly we express our sincere gratitude to the participants of this study in Vietnam, for their willingness to speak to the researchers during the difficult times of the covid-19 pandemic lockdown, while physical distancing measures were still in place.
Conflicts of Interest
The authors declare no conflict of interest.
References
- Ajzen, Icek. 1993. Attitude Theory and the Attitude-Behavior Relation. In New Direction in Attitute Measurement. Edited by Dagmar Krebs and Peter Schmidt. Berlin: Walter de Gruyter, pp. 41–57. [Google Scholar]
- Anand, Swati, Kushendra Mishra, Verma Verma, and Taruna Taruna. 2020. Financial Literacy as a Mediator of Personal Financial Health during COVID-19: A Structural Equation Modelling Approach. Emerald Open Research 2: 59. [Google Scholar] [CrossRef]
- Arner, Douglas, Janos Barberis, and Ross Buckley. 2015. The Evolution of Fintech: A New Post-Crisis Paradigm? University of Hong Kong Faculty of Law Research Paper No. 2015/047. Hong Kong: University of Hong Kong Faculty. [Google Scholar]
- Avornyo, Philip, Jiaming Fang, Ransford Okoe Odai, and Joshua Ben Vondee. 2019. Factors Affecting Continuous Intention of Mobile Banking in Tema and Kumasi. International Journal of Business and Science 10: 3. [Google Scholar] [CrossRef]
- Barefoot, Jo Ann. 2020. Digitizing Finance: Fintech as a Solution for Consumer Financial Health and Inclusion. M-RCBG Associate Working Paper Series No. 149. Cambridge, UK: Harvard Kennedy School. [Google Scholar]
- Beck, Thorsten. 2020. Fintech and Financial Inclusion: Opportunities and Pitfalls. ADBI Working Paper Series No. 1165. Available online: https://www.adb.org/publications/fintech-financial-inclusion-opportunities-pitfalls (accessed on 10 January 2022).
- Bisht, Shailendra Singh, and Vishal Mishra. 2016. ICT-driven Financial Inclusion Initiatives for Urban Poor in a Developing Economy: Implication for Public Policies. Behavior & Information Technology 35: 817–32. [Google Scholar]
- Bongomin, George Okello Candiya, and Joseph Mpeera Ntayi. 2020. Mobile Money Adoption and Usage and Financial Inclusion: Mediating Effect of Digital Consumer Protection. In Digital Policy, Regulation and Governance. Bingley: Emerald Publishing. [Google Scholar]
- Bruhn, Miriam, and Inessa Love. 2014. The Real Impact of Improved Access to Finance: Evidence from Mexico. Journal of Finance 69: 1347–76. [Google Scholar] [CrossRef]
- Chen, Yu-Hui, and Stuart Barnes. 2007. Initial Trust and Online Buyer Behavior. Industrial Management & Data Systems 107: 21–36. [Google Scholar]
- Cheng, Edwin T. C., David Y. C. Lam, and Andy C. L. Yeung. 2006. Adoption of Internet Banking: An Empirical Study in Hong Kong. Decision Support Systems 42: 1558–72. [Google Scholar] [CrossRef] [Green Version]
- Chong, Alain Yee-Loong, Keng-Boon Ooi, Binshan Lin, and Boon-In Tan. 2010. Online Banking Adoption: An Empirical Analysis. In International Journal of Bank Marketing. Bingely: Emerald Publishing. [Google Scholar]
- Chuang, Li-Min, Chun-Chu Liu, and Hsiao-Kuang Kao. 2015. The Adoption of Fintech Service: TAM Perspective. International Journal of Management and Administrative Sciences 3: 1–15. [Google Scholar]
- David, Dharish, Sasidaran Gopalan, and Suma Ramachandran. 2020. The Startup Government and Funding Activity in India. ADBI Working Paper Series, No. 1145. Tokyo, Japan: Asian Development Bank Institute. [Google Scholar]
- Davis, Fred D. 1985. A Technology Acceptance Model for Empirically Testing New End-User Information Systems: Theory and Result. Ph.D. thesis, MIT Sloan School of Management, Cambridge, MA, USA. [Google Scholar]
- Davis, Fred D. 1989. Perceived Usefulness, Perceived Ease of Use, and User Acceptance of Information Technology. MIS Quarterly 13: 319–40. [Google Scholar] [CrossRef] [Green Version]
- EY. 2018. ASEAN Fintech Census 2018. Available online: https://www.ey.com/en_sg/financial-services/asean-fintech-census-2018 (accessed on 18 December 2021).
- EY. 2019. Global Fintech Adoption Index 2019. Available online: https://www.ey.com/en_hu/ey-global-fintech-adoption-index (accessed on 18 December 2021).
- Fintech Singapore. 2020. Vietnam Fintech Report 2020. Available online: https://fintechnews.sg/wp-content/uploads/2020/11/Vietnam-Fintech-Report-2020.pdf (accessed on 20 December 2021).
- Goo, Jayoung James, and Joo-Yeun Heo. 2020. The Impact of the Regulatory Sandbox on the Fintech Industry, with a Discussion on the Relation between Regulatory Sandboxes and Open Innovation. MDPI-Journal of Open Innovation: Technology, Market, and Complexity 6: 43. [Google Scholar] [CrossRef]
- Government of Ghana. 2020. Digital Financial Services Policies. Available online: https://mofep.gov.gh/sites/default/files/acts/Ghana_DFS_Policy.pdf (accessed on 12 December 2021).
- Grabner-Krauter, Sonja, and Rita Faullant. 2008. Consumer Acceptance of Internet Banking: The Influence of Internet Trust. International Journal of Bank Marketing 26: 483–504. [Google Scholar] [CrossRef]
- Ha, Hong-Youl, and Helen Perks. 2005. Effects of Consumer Perceptions of Brand Experience on the Web: Brand Familiarity, Satisfaction and Brand Trust. Journal of Consumer Behaviour 4: 438–52. [Google Scholar] [CrossRef]
- Hu, Zhongqing, Shuai Ding, Shizheng Li, Luting Chen, and Shanlin Yang. 2019. Adoption Intention of Fintech Services for Bank Users: An Empirical Examination with an Extended Technology Acceptance Model. MDPI-Symmetry 11: 340. [Google Scholar] [CrossRef] [Green Version]
- IFC. 2020. Financial Inclusion: Creating Opportunity through Financial Services in South Asia. Available online: https://www.ifc.org/wps/wcm/connect/1116ecf6-9fdb-415f-ae2f-304a8b9dc8d8/Financial+Inclusion.pdf?MOD=AJPERES&CVID=kkIBXtL (accessed on 15 November 2021).
- Jaruwachirathanakul, Bussakorn, and Dieter Fink. 2005. Internet Banking Adoption Strategies for a Developing Country: The Case of Thailand. Internet Research 15: 295–311. [Google Scholar] [CrossRef]
- Jenkins, David G, and Pedro F. Quintana-Ascencio. 2020. A solution to minimum sample size for regressions. PLoS ONE 15: e0229345. [Google Scholar] [CrossRef] [Green Version]
- Jeong, Jihye, Juhee Kim, Hanei Son, and Dae-il Nam. 2020. The Role of Venture Capital Investment in Startups’ Sustainability Growth and Performance: Focusing on Absorptive Capacity and Venture Capitalists’ Reputation. Sustainability 12: 3447. [Google Scholar] [CrossRef] [Green Version]
- Junger, Moritz, and Mark Mietzner. 2020. Banking Goes Digital: The Adoption of Fintech Services in German Households. Finance Research Letters 34: 101260. [Google Scholar] [CrossRef]
- Karlan, Dean, Aishwarya Lakshmi Ratan, and Jonathan Zinman. 2014. Savings by and for the Poor: A Research Review and Agenda. Review of Income and Wealth 60: 36–78. [Google Scholar] [CrossRef] [Green Version]
- Kim, Kyu, and Bipin Prabhakar. 2002. Initial Trust, Perceived Risk, and the Adoption of Internet Banking. Available online: https://dl.acm.org/doi/10.5555/359640.359809 (accessed on 29 October 2021).
- Klapper, Leora, Annamaria Lusardi, and Georgios A. Panos. 2013. Financial Literacy and Its Consequences: Evidence from Russia during the Financial Crisis. Journal of Banking & Finance 37: 3904–23. [Google Scholar]
- Klapper, Leora, Annamaria Lusardi, and Peter Van Oudheusden. 2015. Financial Literacy around the World: Insights from the Standard&Poor’s Ratings Services Global Financial Literacy Survey. Available online: https://gflec.org/wp-content/uploads/2015/11/3313-Finlit_Report_FINAL-5.11.16.pdf?x21285 (accessed on 8 November 2021).
- Korynski, Piotr. 2019. The Contribution of the Fintech Sector to Financial Inclusion and Health: A Review of Opportunities and Challenges. Microfinance Centre. Available online: https://mfc.org.pl/the-contribution-of-the-fintech-sector-to-financial-inclusion-and-health-a-review-of-opportunities-and-challenges/ (accessed on 18 January 2022).
- Lins, Samuel, and Sibele Aquino. 2020. Development and initial psychometric properties of a panic buying scale during COVID-19 pandemic. Heliyon 6: e04746. [Google Scholar] [CrossRef]
- Low, Darian, Robert Jeyakumar Nathan, Eva Gorgenyi-Hegyes, and Maria Fekete-Farkas. 2021. The Demand for Life Insurance in a Developing Country and the Mediating role of Persuasion. Journal of International Studies 14: 138–54. [Google Scholar] [CrossRef]
- Lu, June, James E. Yao, and Chun-Sheng Yua. 2005. Personal Innovativeness, Social Influences and Adoption of Wireless Internet Services via Mobile Technology. Journal of Strategic Information System 14: 245–68. [Google Scholar] [CrossRef]
- Lusardi, Annamaria. 2019. Financial Literacy and the Need for Financial Inclusion: Evidence and Implications. Swiss Journal of Economics and Statistics 155: 1. [Google Scholar] [CrossRef] [Green Version]
- Marakarkandy, Bijith, Nilay Yajnik, and Chandan Dasgupta. 2017. Enabling Internet Banking Adoption: An Empirical Examination with Augmented Technology Acceptance Model (TAM). Journal of Enterprise Information Management 30: 263–94. [Google Scholar] [CrossRef]
- Maurer, Bill. 2011. Mobile Money: Communication, Consumption and Change in the Payment Space. Journal of Development Studies 4: 589–604. [Google Scholar] [CrossRef] [Green Version]
- Morgan, Peter J., and Long Q. Trinh. 2019. Fintech and Financial Literacy in Loa PDR. ABDI Working Paper Series. Available online: https://www.adb.org/publications/fintech-and-financial-literacy-lao-pdr (accessed on 23 December 2021).
- Morgan, Peter J., and Long Q. Trinh. 2020. Fintech and Financial Literacy in Vietnam. ADBI Working Paper Series. Available online: https://www.adb.org/publications/fintech-and-financial-literacy-viet-nam (accessed on 23 December 2021).
- Morosan, Cristian, and Agnes DeFranco. 2014. When Tradition Meets the New Technology: An Examination of the Antecedents of Attitude and Intentions to Use Mobile Devices in Private Clubs. International Journal of Hospitality Management 42: 126–36. [Google Scholar] [CrossRef]
- Nathan, Robert Jeyakumar. 2009. Electronic Commerce Adoption in the Arab Countries—An Empirical Study. International Arab Journal of Information Technology 1: 29–37. [Google Scholar]
- Panos, Georgios A., Tatja Karkkainen, and Adele Atkinson. 2020. Financial Literacy and Attitudes to Cryptocurrencies. Working Paper. Available online: https://papers.ssrn.com/sol3/papers.cfm?abstract_id=3482083 (accessed on 12 February 2022).
- Patwardhan, Anju, Ken Singleton, and Kai Schmitz. 2018. Financial Inclusion in the Digital Age. Handbook of Blockchain, Digital Finance, and Inclusion Volume 1. Available online: https://www.ifc.org/wps/wcm/connect/0d9cffc8-a295-4e05-bf33-dca8ffa5abdf/Financial+Inclusion+in+the+Digital+Age.pdf?MOD=AJPERES&CVID=m9QAISc (accessed on 15 December 2021).
- Pazarbasioglu Ceyla, Alfonso Garcia Mora, Mahesh Uttamchandani, Harish Natarajan, Erik Feyen, and Mathew Saal. 2020. Digital Financial Services. World Bank Group. Available online: http://pubdocs.worldbank.org/en/230281588169110691/Digital-Financial-Services.pdf (accessed on 11 November 2021).
- Rahman, Mahfuzur, Teoh Hui Ming, Tarannum Azim Baigh, and Moniruzzaman Sarker. 2021. Adoption of artificial intelligence in banking services: An empirical analysis. International Journal of Emerging Markets, in press. [Google Scholar] [CrossRef]
- Riyadh, Al Nahian, Deborah Bunker, and Fethi Rabhi. 2010. Barriers to E-finance Adoption in Small Medium Sized Enterprises (SMES) in Bangladesh. Paper presented at 5th Conference on Qualitative Research in IT, Brisbane, Australia, November 29–30. [Google Scholar]
- Ruparelia, Nimisha, Lesley White, and Kate Hughes. 2010. Drivers of Brand Trust in Internet Retailing. Journal of Product & Brand Management 19: 250–60. [Google Scholar]
- Ryu, Hyun-Sun. 2018. Understanding Benefit and Risk Framework of Fintech Adoption: Comparison of Early Adopters and Late Adopters. Paper presented at 51st Hawai International Conference on System Sciences, Honolulu, HI, USA, January 18. [Google Scholar]
- Sahay, Ratna, Ulric Eriksson von Allmen, Amina Lahreche, Purva Khera, Sumiko Ogawa, Majid Bazarbash, and Kim Beaton. 2020. The Promise of Fintech: Financial Inclusion in the Post COVID-19 Era. Washington: International Monetary Fund. [Google Scholar]
- Salampasis, Dimitrios, and Anne-Laure Mention. 2018. Fintech: Harnessing Innovation for Financial Inclusion. In Handbook of Blockchain, Digital Finance, and Inclusion. Cambridge: Academic Press, vol. 2. [Google Scholar]
- Sanchez-Torres, Javier A., Francisco-Javier A. Canada, Alexander Varon Sandoval, and James-Ariel Sanchez Alzate. 2018. E-Banking in Columbia: Factors Favouring its Acceptance, Online Trust and Government Support. International Journal of Bank Marketing 36: 170–83. [Google Scholar] [CrossRef]
- Setiawan, Budi, Deni Pandu Nugraha, Atika Irawan, Robert Jeyakumar Nathan, and Zoltan Zeman. 2021. User Innovativeness and Fintech Adoption in Indonesia. Journal of Open Innovation: Technology, Marketing, and Complexity 7: 188. [Google Scholar] [CrossRef]
- Shapiro, Stephen L., Lamar Reams, and Kevin Kam Fung So. 2018. Is It Worth the Price? The Role of Perceived Financial Risk, Identification, and Perceived Value in Purchasing Pay-per-view Broadcastings of Combat Sports. Sport Management Review 22: 235–246. [Google Scholar] [CrossRef]
- Singh, Shubhangi, Marshal M. Sahni, and Raj K. Kovid. 2020. What Drives Fintech Adoption? A Multi-method Evaluating using an Adapted Technology Acceptance Model. In Management Decision. Bingley: Emerald Publishing. [Google Scholar]
- Troudi, Hadjer, and Djamila Bouyoucef. 2019. Predicting Purchasing Behavior of Green Food in Algerian Context. EuroMed Journal of Business 15: 1–21. [Google Scholar] [CrossRef]
- Twum, Kojo Kakra, Daniel Ofori, and Bright Korang-Yeboah. 2021. Using the UTAUT, personal innovativeness and perceived financial cost to examine student’s intention to use E-learning. Journal of Science and Technology Policy Management, in press. [Google Scholar] [CrossRef]
- UOB, PwC, and FA. 2020. Fintech in ASEAN: Get Up, Reset, Go! Available online: https://www.uobgroup.com/techecosystem/news-insights-fintech-in-asean-2020.html (accessed on 27 October 2021).
- Vasenska, Ivanka, Preslav Dimitrov, Blagovesta Koyundzhiyska-Davidkova, Vladislav Krastev, Pavol Durana, and Ioulia Poulaki. 2021. Financial transactions using fintech during the COVID-19 crisis in bulgaria. Risks 9: 48. [Google Scholar] [CrossRef]
- Wang, Yi-Shun, Yu-Min Wang, Hsin-Hui Lin, and Tzung-I Tang. 2003. Determinants of User Acceptance of Internet Banking: An Empirical Study. International Journal of Service Industry Management 14: 501–19. [Google Scholar] [CrossRef]
- Warner, Rebecca M. 2008. Applied Statistics: From Bivariate through Multivariate Techniques. Los Angeles: Sage. [Google Scholar]
- World Bank. 2017. The Global Findex Database. Available online: https://globalfindex.worldbank.org/ (accessed on 19 June 2021).
- World Economic Forum. 2020. COVID-19 Spurred a Rise in Fintech. Now Regulators are Catching Up. Available online: https://www.weforum.org/agenda/2020/10/COVID-19-financial-technology-fintech-regulation/ (accessed on 11 August 2021).
- Yoshino, Naoyuki, Peter J. Morgan, and Trinh Q. Long. 2020. Financial Literacy and Fintech Adoption in Japan. ABDI Working Paper Series. Available online: https://www.adb.org/publications/financial-literacy-fintech-adoption-japan (accessed on 17 September 2021).
- Yuen, Kum Fai, Xueqin Wang, Fei Ma, and Kevin X. Li. 2020. The psychological causes of panic buying following a health crisis. International Journal of Environmental Research and Public Health 17: 3513. [Google Scholar] [CrossRef] [PubMed]
- Zhang, Tingting, Can Lu, and Murat Kizildag. 2018. Banking on-the-go: Examining Consumers Adoption of Mobile Banking Services. In Journal of Quality and Service Sciences. Bingely: Emerald Publishing. [Google Scholar]
- Zhao, Anita Lifen, Nicole Koenig-Lewis, Stuart Hanmer-Lloyd, and Philippa Ward. 2009. Adoption of Internet Banking Services in China: Is It All about Trust? International Journal of Bank Marketing 28: 7–26. [Google Scholar] [CrossRef]
- Zolotov, Yuval, Alexander Reznik, Shmaya Bender, and Richard Isralowitz. 2020. COVID-19 Fear, Mental Health, and Substance Use Among Israeli University Students. International Journal of Mental Health and Addiction. [Google Scholar] [CrossRef]
Figure 1.
Unbanked population in Vietnam and Asia regions. Source: (World Bank 2017).
Figure 1.
Unbanked population in Vietnam and Asia regions. Source: (World Bank 2017).

Figure 2.
Adult financial literacy by country in ASEAN (%). Source: Klapper et al. (2015).
Figure 2.
Adult financial literacy by country in ASEAN (%). Source: Klapper et al. (2015).

Figure 3.
Research framework.

Figure 4.
Boxplot of gender and fintech intention.

Figure 5.
Fintech usage intention in Vietnam.

Figure 6.
Financial health during the COVID-19 pandemic in Vietnam.


Table 1.
Fintech update in six ASEAN countries.
| Countries | No. of Fintech Companies | Investment in 2020 (USD Million) | Regulatory Sandboxes | Fintech Associations |
|---|---|---|---|---|
| Indonesia | 557 | 180.7 | Yes | Indonesia Fintech Association and Indonesia Fintech Lender Association |
| Malaysia | 407 | 72.9 | Yes | Fintech Association of Malaysia |
| Philippines | 212 | 135.5 | Yes | Fintech Philippines Association |
| Singapore | 1200 | 379.5 | Yes | Singapore Fintech Association |
| Thailand | 227 | 135.5 | Yes | Thai Fintech Association |
| Vietnam | 141 | 30 | No | Vietnam Fintech Club |
Source: EY (2018), Fintech Singapore (2020) and UOB et al. (2020).
Table 2.
Measurement instrument.
| Variable | Indicators | Source |
|---|---|---|
| Financial literary | I have knowledge of compounding interest I have knowledge of inflation I have knowledge of risk diversification | Lusardi (2019), Low et al. (2021). |
| Perceived usefulness | Using fintech can meet my financial service needs Fintech services can save time Fintech services can improve efficiency Overall, fintech services are useful to me | Davis (1989) |
| Perceived ease of use | It is easy to use fintech services It is easy to have a device to use fintech services (cellphone, APP, WiFi, et al.) | Davis (1989) |
| Trust | I believe money is secure when using fintech services Overall I believe fintech services are trustworthy I believe personal privacy is protected when using fintech services | Kim and Prabhakar (2002) |
| Brand image | I prefer to accept the fintech services provided by familiar brands I can recognize fintech services in Vietnam Fintech overall has a good reputation | Ruparelia et al. (2010) |
| Government support | The government supports and improves the use of fintech services The government has introduced favorable legislation and regulations for fintech services The government is active in setting up all kinds of infrastructure such as telecom networks which have a positive role in promoting fintech services | Marakarkandy et al. (2017) |
| User innovativeness | When I hear about a new product, I look for ways to try it Among my peers, I am usually the first one to try a new product I like to experiment with new fintech services | Zhang et al. (2018) |
| Attitude | I believe using fintech services is a good idea Using fintech services gives me a pleasant experience I am interested in fintech services | Grabner-Krauter and Faullant (2008) |
| Fintech Adoption | I will continue using fintech services I have not used but would like to use fintech services soon I will recommend fintech services to my friends | Marakarkandy et al. (2017) |
| Financial health due to COVID-19 | My earnings are reduced and savings eroded due to the COVID-19 pandemic Impulsive use of credit card is happening Forced to do panic buying and hoarding products There is a rise in prices of essential goods Tend to withdraw cash more often now There is a rise in the habit of saving money and realizing not to waste resources | Anand et al. (2020) |
Table 3.
Respondents’ age category.
| Age | N | % |
|---|---|---|
| 18–25 | 6 | 20.0% |
| 26–35 | 7 | 23.3% |
| 36–45 | 15 | 50.0% |
| >55 | 2 | 6.7% |
| Total | 30 | 100.0% |
Table 4.
Respondents’ employment status.
| Employment Status | N | % |
|---|---|---|
| Student | 2 | 6.7% |
| Civil servant | 9 | 30.0% |
| Employee in private sector | 8 | 26.7% |
| Self-employed | 6 | 20.0% |
| Other | 5 | 16.7% |
| Total | 30 | 100.0% |
Table 5.
Respondents’ last education.
| Education | N | % |
|---|---|---|
| High school | 1 | 3.3% |
| Diploma | 1 | 3.3% |
| Bachelor’s degree | 18 | 60.0% |
| Master or PhD | 10 | 33.3% |
| Total | 30 | 100.0% |
Table 6.
Respondents’ income range (VND).
| Income per Month | N | % |
|---|---|---|
| Under VND 5 M | 5 | 16.7% |
| VND 5 M–10 M | 9 | 30.0% |
| VND 10 M–20 M | 7 | 23.3% |
| Over VND 20 M | 9 | 30.0% |
| Total | 30 | 100.0% |
Table 7.
Respondents’ Fintech usage frequency.
| Fintech Usage | N | % |
|---|---|---|
| Never | 4 | 13.3% |
| Once a week | 9 | 30.0% |
| 2–3 times a week | 7 | 23.3% |
| More than 4 times a week | 10 | 33.3% |
| Total | 30 | 100.0% |
Table 8.
Respondents’ gender and Fintech usage purpose.
| Gender | Frequency of Fintech Usage | |||
|---|---|---|---|---|
| Personal Finance Needs | Business Finance Needs | Others | Total | |
| Male | 14 | 2 | 0 | 16 |
| % of total | 87.5% | 12.5% | 0 | 100% |
| Female | 13 | 0 | 1 | 14 |
| % of total | 92.9% | 0 | 7.1% | 100% |
Table 9.
Respondents’ gender and Fintech usage frequency.
| Gender | Frequency of Fintech Usage | ||||
|---|---|---|---|---|---|
| Never | Once a Week | 2–3 Times a Week | More Than 4 Times a Week | Total | |
| Male | 3 | 5 | 3 | 5 | 16 |
| % of total | 18.8% | 31.3% | 18.8% | 31.3% | 100.0% |
| Female | 1 | 4 | 4 | 5 | 14 |
| % of total | 7.1% | 28.6% | 28.6% | 35.7% | 100.0% |
Table 10.
Chi-square test.
| Value | df | Asymp. Sig. | |
|---|---|---|---|
| (2-sided) | |||
| Pearson Chi-Square | 1.126 | 3 | 0.771 |
| Likelihood ratio | 1.168 | 3 | 0.761 |
| N of valid cases | 30 |
Table 11.
Mean and Standard Deviation of Research Variables.
| Mean | Std. Dev. | |
|---|---|---|
| Financial Literacy | 3.10 | 1.09387 |
| Perceived Usefulness | 4.00 | 0.94686 |
| Perceived Ease of Use | 3.70 | 0.91539 |
| Trust | 3.03 | 0.88992 |
| Brand Image | 3.63 | 0.71840 |
| Government Support | 3.50 | 0.93772 |
| User Innovativeness | 3.06 | 0.90719 |
| User Attitude | 3.90 | 0.80301 |
| Fintech Adoption | 3.86 | 1.04166 |
Table 12.
Factor scores (grouped by gender).
| Gender | N | Mean | Std. Dev. | |
|---|---|---|---|---|
| Financial Literacy | Male | 16 | 2.93 | 1.1236 |
| Female | 14 | 3.28 | 1.0690 | |
| Perceived Usefulness | Male | 16 | 3.68 | 1.0144 |
| Female | 14 | 4.35 | 0.7449 | |
| Perceived Ease of Use | Male | 16 | 3.31 | 1.0144 |
| Female | 14 | 4.14 | 0.5345 | |
| Trust | Male | 16 | 2.81 | 0.9105 |
| Female | 14 | 3.28 | 0.8254 | |
| Brand Image | Male | 16 | 3.43 | 0.8139 |
| Female | 14 | 3.85 | 0.5345 | |
| Government Support | Male | 16 | 3.43 | 0.9639 |
| Female | 14 | 3.57 | 0.9376 | |
| User Innovativeness | Male | 16 | 2.93 | 0.9287 |
| Female | 14 | 3.21 | 0.8925 | |
| User Attitude | Male | 16 | 3.56 | 0.8139 |
| Female | 14 | 4.28 | 0.6112 | |
| Fintech Adoption | Male | 16 | 3.56 | 1.1528 |
| Female | 14 | 4.21 | 0.8017 |
Table 13.
Pearson correlation.
| Fintech Adoption | ||
|---|---|---|
| Financial Literacy | Pearson Correlation | 0.133 |
| p-value | 0.483 | |
| Perceived Usefulness | Pearson Correlation | 0.699 ** |
| p-value | 0.000 | |
| Perceived Ease of Use | Pearson Correlation | 0.571 ** |
| p-value | 0.001 | |
| Fintech Trust | Pearson Correlation | 0.377 * |
| p-value | 0.040 | |
| Fintech Brand Image | Pearson Correlation | 0.531 ** |
| p-value | 0.003 | |
| Government Support | Pearson Correlation | 0.459 * |
| p-value | 0.011 | |
| User Innovative | Pearson Correlation | 0.448 * |
| p-value | 0.013 | |
| User Attitude | Pearson Correlation | 0.767 ** |
| p-value | 0.000 | |
* Sig at 1%, ** Sig at 5%.
Table 14.
Multiple Linear Regression result.
| Sum of Squares | df | Mean Square | F | Sig. | |
|---|---|---|---|---|---|
| Regression | 172.018 | 8 | 21.502 | 7.596 | 0.000 |
| Residual | 59.449 | 21 | 2.831 | ||
| Total | 231.467 | 29 |
Table 15.
Linear regression result.
| Unstandardized Coefficients | Standardized | t | Sig. | ||
|---|---|---|---|---|---|
| B | Std. Error | Coefficients Beta | |||
| (Constant) | 0.377 | 1.772 | 0.213 | 0.834 | |
| Financial literacy | −0.345 | 0.135 | −0.390 | −2.556 | 0.018 ** |
| Perceived usefulness | 0.067 | 0.242 | 0.082 | 0.279 | 0.783 |
| Perceived ease of use | 0.210 | 0.306 | 0.196 | 0.685 | 0.501 |
| Trust | −0.315 | 0.225 | −0.279 | −1.400 | 0.176 |
| Brand image | 0.266 | 0.311 | 0.207 | 0.857 | 0.401 |
| Government support | 0.007 | 0.170 | 0.007 | 0.042 | 0.967 |
| User innovativeness | 0.320 | 0.170 | 0.298 | 1.883 | 0.074 * |
| User Attitude | 0.666 | 0.308 | 0.555 | 2.164 | 0.042 ** |
* significant at 10% sig. level, ** significant at 5% sig. level.
Table 16.
Comparing Gender means for all Research Variables.
| Gender | N | Mean | Std. Deviation | |
|---|---|---|---|---|
| Financial literacy | Male | 16 | 2.93 | 1.12361 |
| Female | 14 | 3.28 | 1.06904 | |
| Perceived usefulness | Male | 16 | 3.68 | 1.01448 |
| Female | 14 | 4.35 * | 0.74495 | |
| Perceived ease of use | Male | 16 | 3.31 | 1.01448 |
| Female | 14 | 4.14 * | 0.53452 | |
| Trust | Male | 16 | 2.81 | 0.91059 |
| Female | 14 | 3.28 | 0.82542 | |
| Brand image | Male | 16 | 3.43 | 0.81394 |
| Female | 14 | 3.85 * | 0.53452 | |
| Government support | Male | 16 | 3.43 | 0.96393 |
| Female | 14 | 3.57 | 0.93761 | |
| User innovativeness | Male | 16 | 2.93 | 0.92871 |
| Female | 14 | 3.21 | 0.89258 | |
| Attitude | Male | 16 | 3.56 | 0.81394 |
| Female | 14 | 4.28 * | 0.61125 | |
| Fintech adoption | Male | 16 | 3.56 | 1.15289 |
| Female | 14 | 4.21 * | 0.80178 |
Note: * significantly higher mean.
Table 17.
Independent sample t-test result comparing Gender means.
| t | df | p-Value | Mean Difference | |
|---|---|---|---|---|
| Financial literacy | −0.866 | 28 | 0.394 | 0.34 |
| Perceived usefulness | −2.034 | 28 | 0.051 * | −0.66 |
| Perceived ease of use | −2.743 | 28 | 0.010 ** | −0.83 |
| Trust | −1.483 | 28 | 0.149 | 0.47 |
| Brand image | −1.642 | 28 | 0.112 | 0.41 |
| Government support | −0.384 | 28 | 0.704 | 0.13 |
| User innovativeness | −829 | 28 | 0.414 | 0.27 |
| Attitude | −2.719 | 28 | 0.011 ** | −0.72 |
| Fintech adoption | −1.772 | 28 | 0.087 * | −65 |
* significant at 10% sig. level, ** significant at 5% sig. level.
Table 18.
General mean and mean by group (male and female) and total.
| Gender | Mean | Std. Dev. | |
|---|---|---|---|
| FH1: My earnings are reduced and savings eroded due to the pandemic COVID-19 | Male | 2.62 | 1.310 |
| Female | 3.21 | 1.847 | |
| Total | 2.90 | 1.583 | |
| FH2: Impulsive use of credit card is happening | Male | 3.50 | 1.211 |
| Female | 4.14 | 0.949 | |
| Total | 3.80 | 1.126 | |
| FH3: Forced to do panic buying and hoarding products | Male | 1.87 | 1.087 |
| Female | 2.85 | 1.350 | |
| Total | 2.33 | 1.295 | |
| FH4: There is a rise in prices of essential goods | Male | 3.37 | 1.087 |
| Female | 3.42 | 1.283 | |
| Total | 3.40 | 1.162 | |
| FH5: Tend to withdraw cash more often now | Male | 2.50 | 0.966 |
| Female | 2.50 | 1.091 | |
| Total | 2.50 | 1.005 | |
| FH6: There is a rise in the habit of saving money and realizing not to waste resources | Male | 4.12 | 0.885 |
| Female | 4.21 | 0.974 | |
| Total | 4.16 | 0.912 |
Publisher’s Note: MDPI stays neutral with regard to jurisdictional claims in published maps and institutional affiliations. |
© 2022 by the authors. Licensee MDPI, Basel, Switzerland. This article is an open access article distributed under the terms and conditions of the Creative Commons Attribution (CC BY) license (https://creativecommons.org/licenses/by/4.0/).
Share and Cite
MDPI and ACS Style
Nathan, R.J.; Setiawan, B.; Quynh, M.N. Fintech and Financial Health in Vietnam during the COVID-19 Pandemic: In-Depth Descriptive Analysis. J. Risk Financial Manag. 2022, 15, 125. https://doi.org/10.3390/jrfm15030125
AMA Style
Nathan RJ, Setiawan B, Quynh MN. Fintech and Financial Health in Vietnam during the COVID-19 Pandemic: In-Depth Descriptive Analysis. Journal of Risk and Financial Management. 2022; 15(3):125. https://doi.org/10.3390/jrfm15030125
Chicago/Turabian StyleNathan, Robert Jeyakumar, Budi Setiawan, and Mac Nhu Quynh. 2022. "Fintech and Financial Health in Vietnam during the COVID-19 Pandemic: In-Depth Descriptive Analysis" Journal of Risk and Financial Management 15, no. 3: 125. https://doi.org/10.3390/jrfm15030125