
Effect of Environmental Pollutants PM2.5, CO, NO2, and O3 on the Incidence and Mortality of SARS-CoV-2 Infection in Five Regions of the USA

 , , and
Abstract
:1. Introduction
2. Subjects and Methods
2.1. Ethical Statement
2.2. Statistical Analysis
3. Results
4. Discussion
5. Study Strengths and Limitations
6. Conclusions
Author Contributions
Funding
Institutional Review Board Statement
Informed Consent Statement
Data Availability Statement
Acknowledgments
Conflicts of Interest
References
- Meo, S.A.; Abukhalaf, A.A.; Alomar, A.A.; Alessa, O.M. Wildfire and COVID-19 pandemic: Effect of environmental pollution PM2.5 and carbon monoxide on the dynamics of daily cases and deaths due to SARS-COV-2 infection in San-Francisco U.S.A. Eur. Rev. Med. Pharmacol. Sci. 2020, 24, 10286–10292. [Google Scholar] [PubMed]
- Power, A.L.; Tennant, R.K.; Jones, R.T.; Tang, Y.; Du, J.; Worsley, A.T.; Love, J. Monitoring Impacts of Urbanisation and Industrialisation on Air Quality in the Anthropocene Using Urban Pond Sediments. Front. Earth Sci. 2018, 6, 131. [Google Scholar] [CrossRef]
- Prabhat, K.R. Particulate Matter and Its Size Fractionation. Biomagn. Monit. Part. Matter 2016, 1, 1–13. [Google Scholar]
- Domingo, J.L.; Marquès, M.; Rovira, J. Influence of airborne transmission of SARS-CoV-2 on COVID-19 pandemic. A review. Environ. Res. 2020, 188, 109861. [Google Scholar] [CrossRef] [PubMed]
- World Health Organization (WHO). Coronavirus Disease (COVID-19) Dashboard. Available online: https://covid19.who.int/ (accessed on 5 April 2021).
- Manisalidis, I.; Stavropoulou, E.; Stavropoulos, A.; Bezirtzoglou, E. Environmental, and Health Impacts of Air Pollution: A Review. Front. Public Health 2020, 8, 14. [Google Scholar] [CrossRef] [PubMed] [Green Version]
- Meo, S.A.; Abukhalaf, A.A.; Alomar, A.A.; Alsalame, N.M.; Al-Khlaiwi, T.; Usmani, A.M. Effect of temperature and humidity on the dynamics of daily new cases and deaths due to COVID-19 outbreak in Gulf countries in Middle East Region. Eur. Rev. Med. Pharmacol. Sci. 2020, 24, 7524–7533. [Google Scholar]
- Meo, S.A.; Abukhalaf, A.A.; Alomar, A.A.; Sumaya, O.Y.; Sami, W.; Shafi, K.M.; Meo, A.S.; Usmani, A.M.; Akram, J. Effect of heat and humidity on the incidence and mortality due to COVID-19 pandemic in European countries. Eur. Rev. Med. Pharmacol. Sci. 2020, 24, 9216–9225. [Google Scholar]
- Meo, S.A.; Abukhalaf, A.A.; Alomar, A.A.; Aljudi, T.W.; Bajri, H.M.; Sami, W.; Akram, J.; Hajjar, W. Impact of weather conditions on incidence and mortality of COVID-19 pandemic in Africa. Eur. Rev. Med. Pharmacol. Sci. 2020, 24, 9753–9759. [Google Scholar]
- Wang, B.; Liu, J.; Li, Y.; Fu, S.; Xu, X.; Li, L.; Zhou, J.; Liu, X.; He, J.; Yan, J. Airborne particulate matter, population mobility, and COVID-19: A multi-city study in China. BMC Public Health 2020, 20, 1585. [Google Scholar] [CrossRef] [PubMed]
- Bashir, M.F.; Benghoul, M.; Numan, U.; Shakoor, A.; Komal, B.; Bashir, M.A.; Bashir, M.; Tan, D. Environmental pollution and COVID-19 outbreak: Insights from Germany. Air Qual. Atmos. Health 2020, 13, 1385–1394. [Google Scholar] [CrossRef] [PubMed]
- Worldometer. Available online: https://www.worldometers.info/demographics/demographics-of-africa/ (accessed on 17 September 2002).
- EPA-United States Environmental Protection Agency. 2020. Available online: https://www.epa.gov/outdoor-air-quality-data. (accessed on 31 January 2020).
- Real-Time Air Quality Index (AQI). Available online: https://aqicn.org/city/beijing/ (accessed on 31 December 2020).
- Haque, S.E.; Rahman, M. Association between temperature, humidity, and COVID-19 outbreaks in Bangladesh. Environ. Sci. Pol. 2020, 114, 253–255. [Google Scholar] [CrossRef]
- Meo, S.A.; Abukhalaf, A.A.; Alomar, A.A.; Alessa, O.M.; Sami, W.; Klonoff, D.C. Effect of environmental pollutants PM2.5, carbon monoxide, and ozone on the incidence and mortality of SARS-COV-2 infection in ten wildfire affected counties in California. Sci. Total Environ. 2021, 757, 143948. [Google Scholar] [CrossRef] [PubMed]
- Bashir, M.F.; Ma, B.J.; Bilal, K.B.; Bashir, M.A.; Farooq, T.H.; Iqbal, N.; Bashir, M. Correlation between environmental pollution indicators and COVID-19 pandemic: A brief study in Californian context. Environ. Res. 2020, 187, 109652. [Google Scholar] [CrossRef] [PubMed]
- Coccia, M. Factors determining the diffusion of COVID-19 and suggested strategy to prevent future accelerated viral infectivity similar to COVID. Sci. Total Environ. 2020, 729, 138474. [Google Scholar] [CrossRef]
- Coccia, M. An index to quantify the environmental risk of exposure to future epidemics of the COVID-19 and similar viral agents: Theory and practice. Environ. Res. 2020, 191, 110155. [Google Scholar] [CrossRef]
- Chen, B.; Jia, P.; Han, J. Role of indoor aerosols for COVID-19 viral transmission: A review. Environ. Chem. Lett. 2021, 19, 1953–1970. [Google Scholar] [CrossRef]
- Paital, B.; Agrawal, P.K. Air pollution by NO2 and PM2.5 explains COVID-19 infection severity by overexpression of angiotensin-converting enzyme 2 in respiratory cells: A review. Environ. Chem. Lett. 2021, 19, 25–42. [Google Scholar] [CrossRef]
- Bianconi, V.; Bronzo, P.; Banach, M.; Sahebkar, A.; Mannarino, M.R.; Pirro, M. Particulate matter pollution and the COVID-19 outbreak: Results from Italian regions and provinces. Arch. Med. Sci. 2020, 16, 985–992. [Google Scholar] [CrossRef] [PubMed]
- Zhu, Y.; Xie, J.; Huang, F.; Cao, L. Association between short-term exposure to air pollution and COVID-19 infection: Evidence from China. Sci. Total Environ. 2020, 727, 138704. [Google Scholar] [CrossRef]
- Frontera, A.; Cianfanelli, L.; Vlachos, K.; Landoni, G.; Cremona, G. Severe air pollution links to higher mortality in COVID-19 patients: The “double-hit” hypothesis. J. Infect. 2020, 81, 255–259. [Google Scholar] [CrossRef]
- Chakrabarty, R.K.; Beeler, P.; Liu, P.; Goswami, S.; Harvey, R.D.; Pervez, S.; Donkelaar, A.; Martin, R.V. Ambient PM2.5 exposure and rapid spread of COVID-19 in the United States. Sci. Total Environ. 2021, 760, 143391. [Google Scholar] [CrossRef] [PubMed]
- Meo, S.A.; Almutairi, F.J.; Abukhalaf, A.A.; Alessa, O.M.; Al-Khlaiwi, T.; Meo, A.S. Sandstorm and its effect on particulate matter PM 2.5, carbon monoxide, nitrogen dioxide, ozone pollutants and SARS-CoV-2 cases and deaths. Sci. Total Environ. 2021, 795, 148764. [Google Scholar] [CrossRef]
- Zhou, F.; Yu, T.; Du, R.; Fan, G.; Liu, Y.; Liu, Z.; Xiang, J.; Wang, Y.; Song, B.; Gu, X.; et al. Clinical course and risk factors for mortality of adult inpatients with COVID-19 in Wuhan, China: A retrospective cohort study. Lancet 2020, 395, 1054–1062. [Google Scholar] [CrossRef]
- Comunian, S.; Dongo, D.; Milani, C.; Palestini, P. Air Pollution, and Covid-19: The Role of Particulate Matter in the Spread and Increase of Covid-19’s Morbidity and Mortality. Int. J. Environ. Res. Public Health 2020, 22, 4487. [Google Scholar] [CrossRef] [PubMed]
- Zhang, J.; Cheng, H.; Wang, D.; Zhu, Y.; Yang, C.; Shen, Y.; Yu, J.; Li, Y.; Xu, S.; Song, X.; et al. Revealing consensus gene pathways associated with respiratory functions and disrupted by PM2.5 nitrate exposure at bulk tissue and single-cell resolution. Environ. Pollut. 2021, 280, 116951. [Google Scholar] [CrossRef] [PubMed]
- Mishra, R.; Krishnamoorthy, P.; Gangamma, S.; Raut, A.A.; Kumar, H. Particulate matter (PM10) enhances R.N.A. virus infection through modulation of innate immune responses. Environ. Pollut. 2020, 266, 115148. [Google Scholar] [CrossRef]
- Qiu, H.; Chuang, K.J.; Bai, C.H.; Fan, Y.C.; Chang, T.P.; Yim, S.H.; Wong, T.W.; Ho, K.F. Association of ambient ozone with pneumonia hospital admissions in Hong Kong and Taipei: A tale of two Southeast Asian cities. Environ. Int. 2021, 156, 106634. [Google Scholar] [CrossRef]
- Meo, S.A.; Abukhalaf, A.A.; Sami, W.; Hoang, T.D. Effect of environmental pollution PM2.5, carbon monoxide, and ozone on the incidence and mortality due to SARS-CoV-2 infection in London, United Kingdom. J. King Saud Univ. Sci. 2021, 33, 101373. [Google Scholar] [CrossRef]
- VanderValk, J.P.M.; In’tVeen, J.C.C.M. SARS-Cov-2: The Relevance and Prevention of Aerosol Transmission. J. Occup. Environ. Med. 2021, 63, e395–e401. [Google Scholar] [CrossRef]
- Zoran, M.A.; Savastru, R.S.; Savastru, D.M.; Tautan, M.N. Assessing the relationship between surface levels of PM2.5 and PM10 particulate matter impact on COVID-19 in Milan, Italy. Sci. Total Environ. 2020, 738, 139825. [Google Scholar] [CrossRef]
- Van Doremalen, N.; Bushmaker, T.; Morris, D.H.; Holbrook, M.G.; Gamble, A.; Williamson, B.N.; Tamin, A.; Harcourt, J.L.; Thornburg, N.J.; Gerber, S.I.; et al. Aerosol and Surface Stability of SARS-CoV-2 as Compared with SARS-CoV-1. N. Engl. J. Med. 2020, 16, 1564–1567. [Google Scholar] [CrossRef] [PubMed]
- Setti, L.; Passarini, F.; De Gennaro, G. SARSCov-2RNA found on a particulate matter of Bergamo in Northern Italy: First evidence. Environ. Res. 2020, 188, 109754. [Google Scholar] [CrossRef] [PubMed]


| Cases by Region | Environmental Pollutants | Spearman’s ρ | p-Value |
|---|---|---|---|
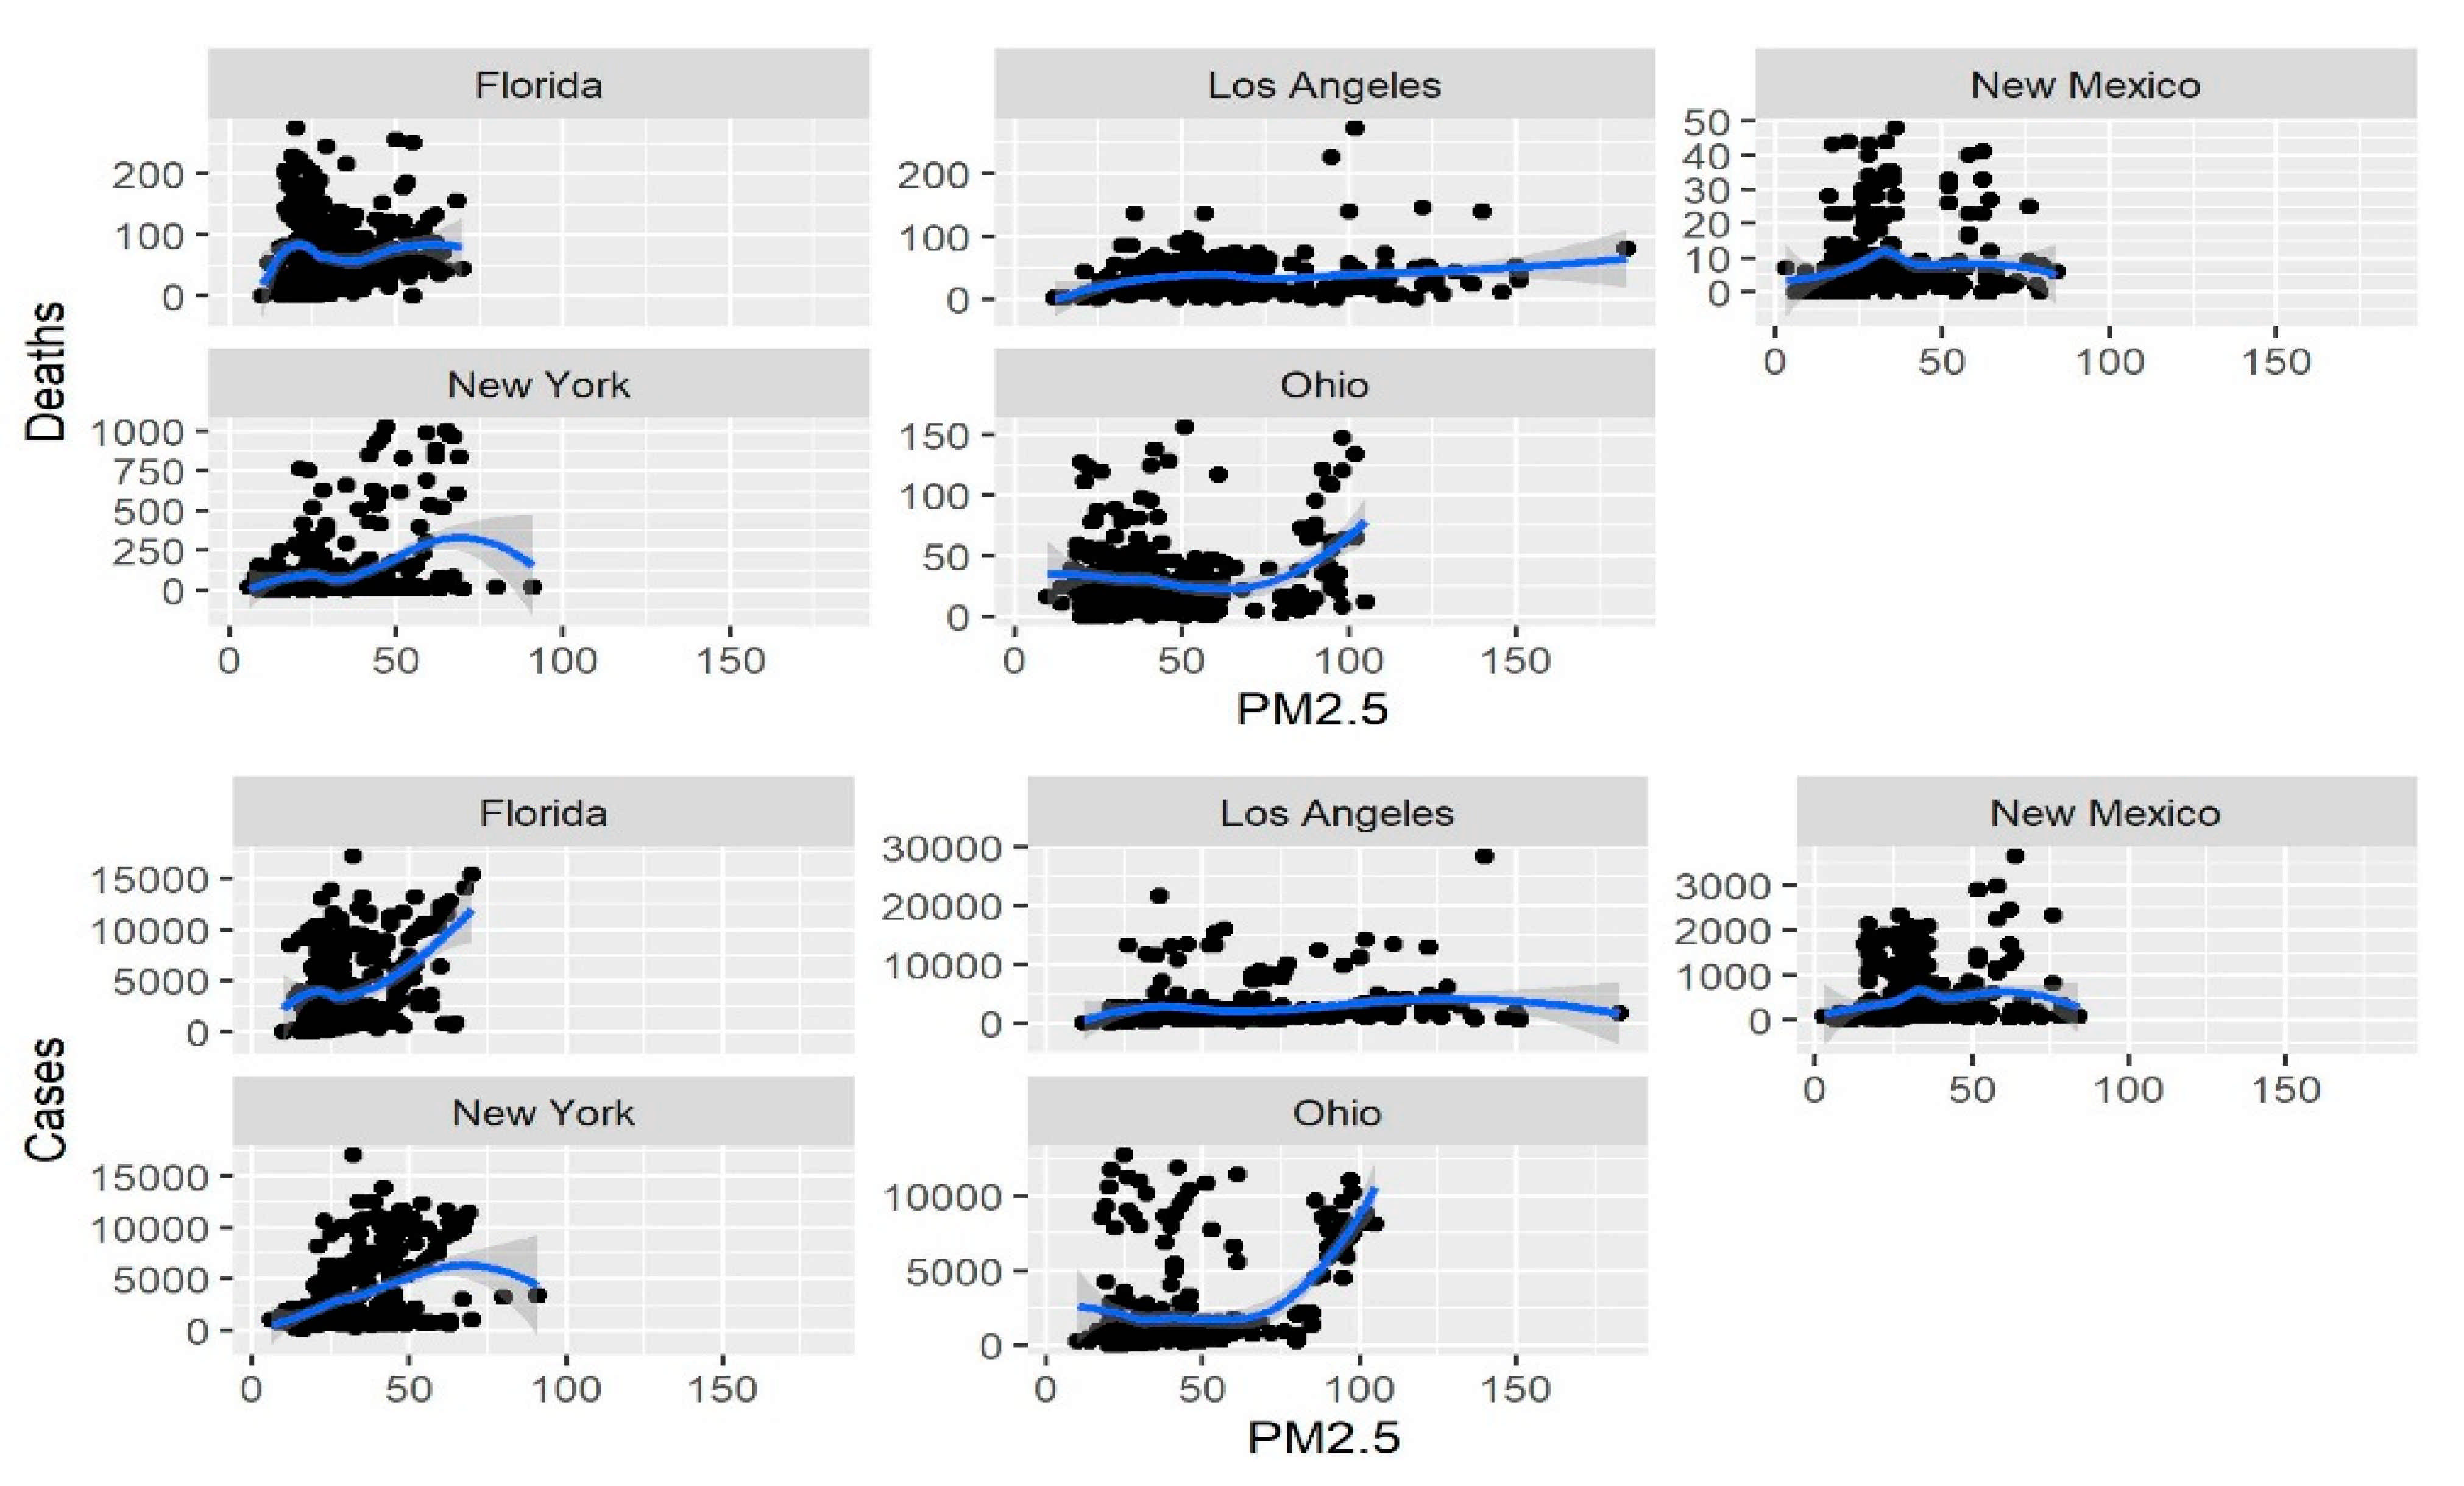
| Florida | Particulate matter (PM2.5) | 0.355 | <0.001 * |
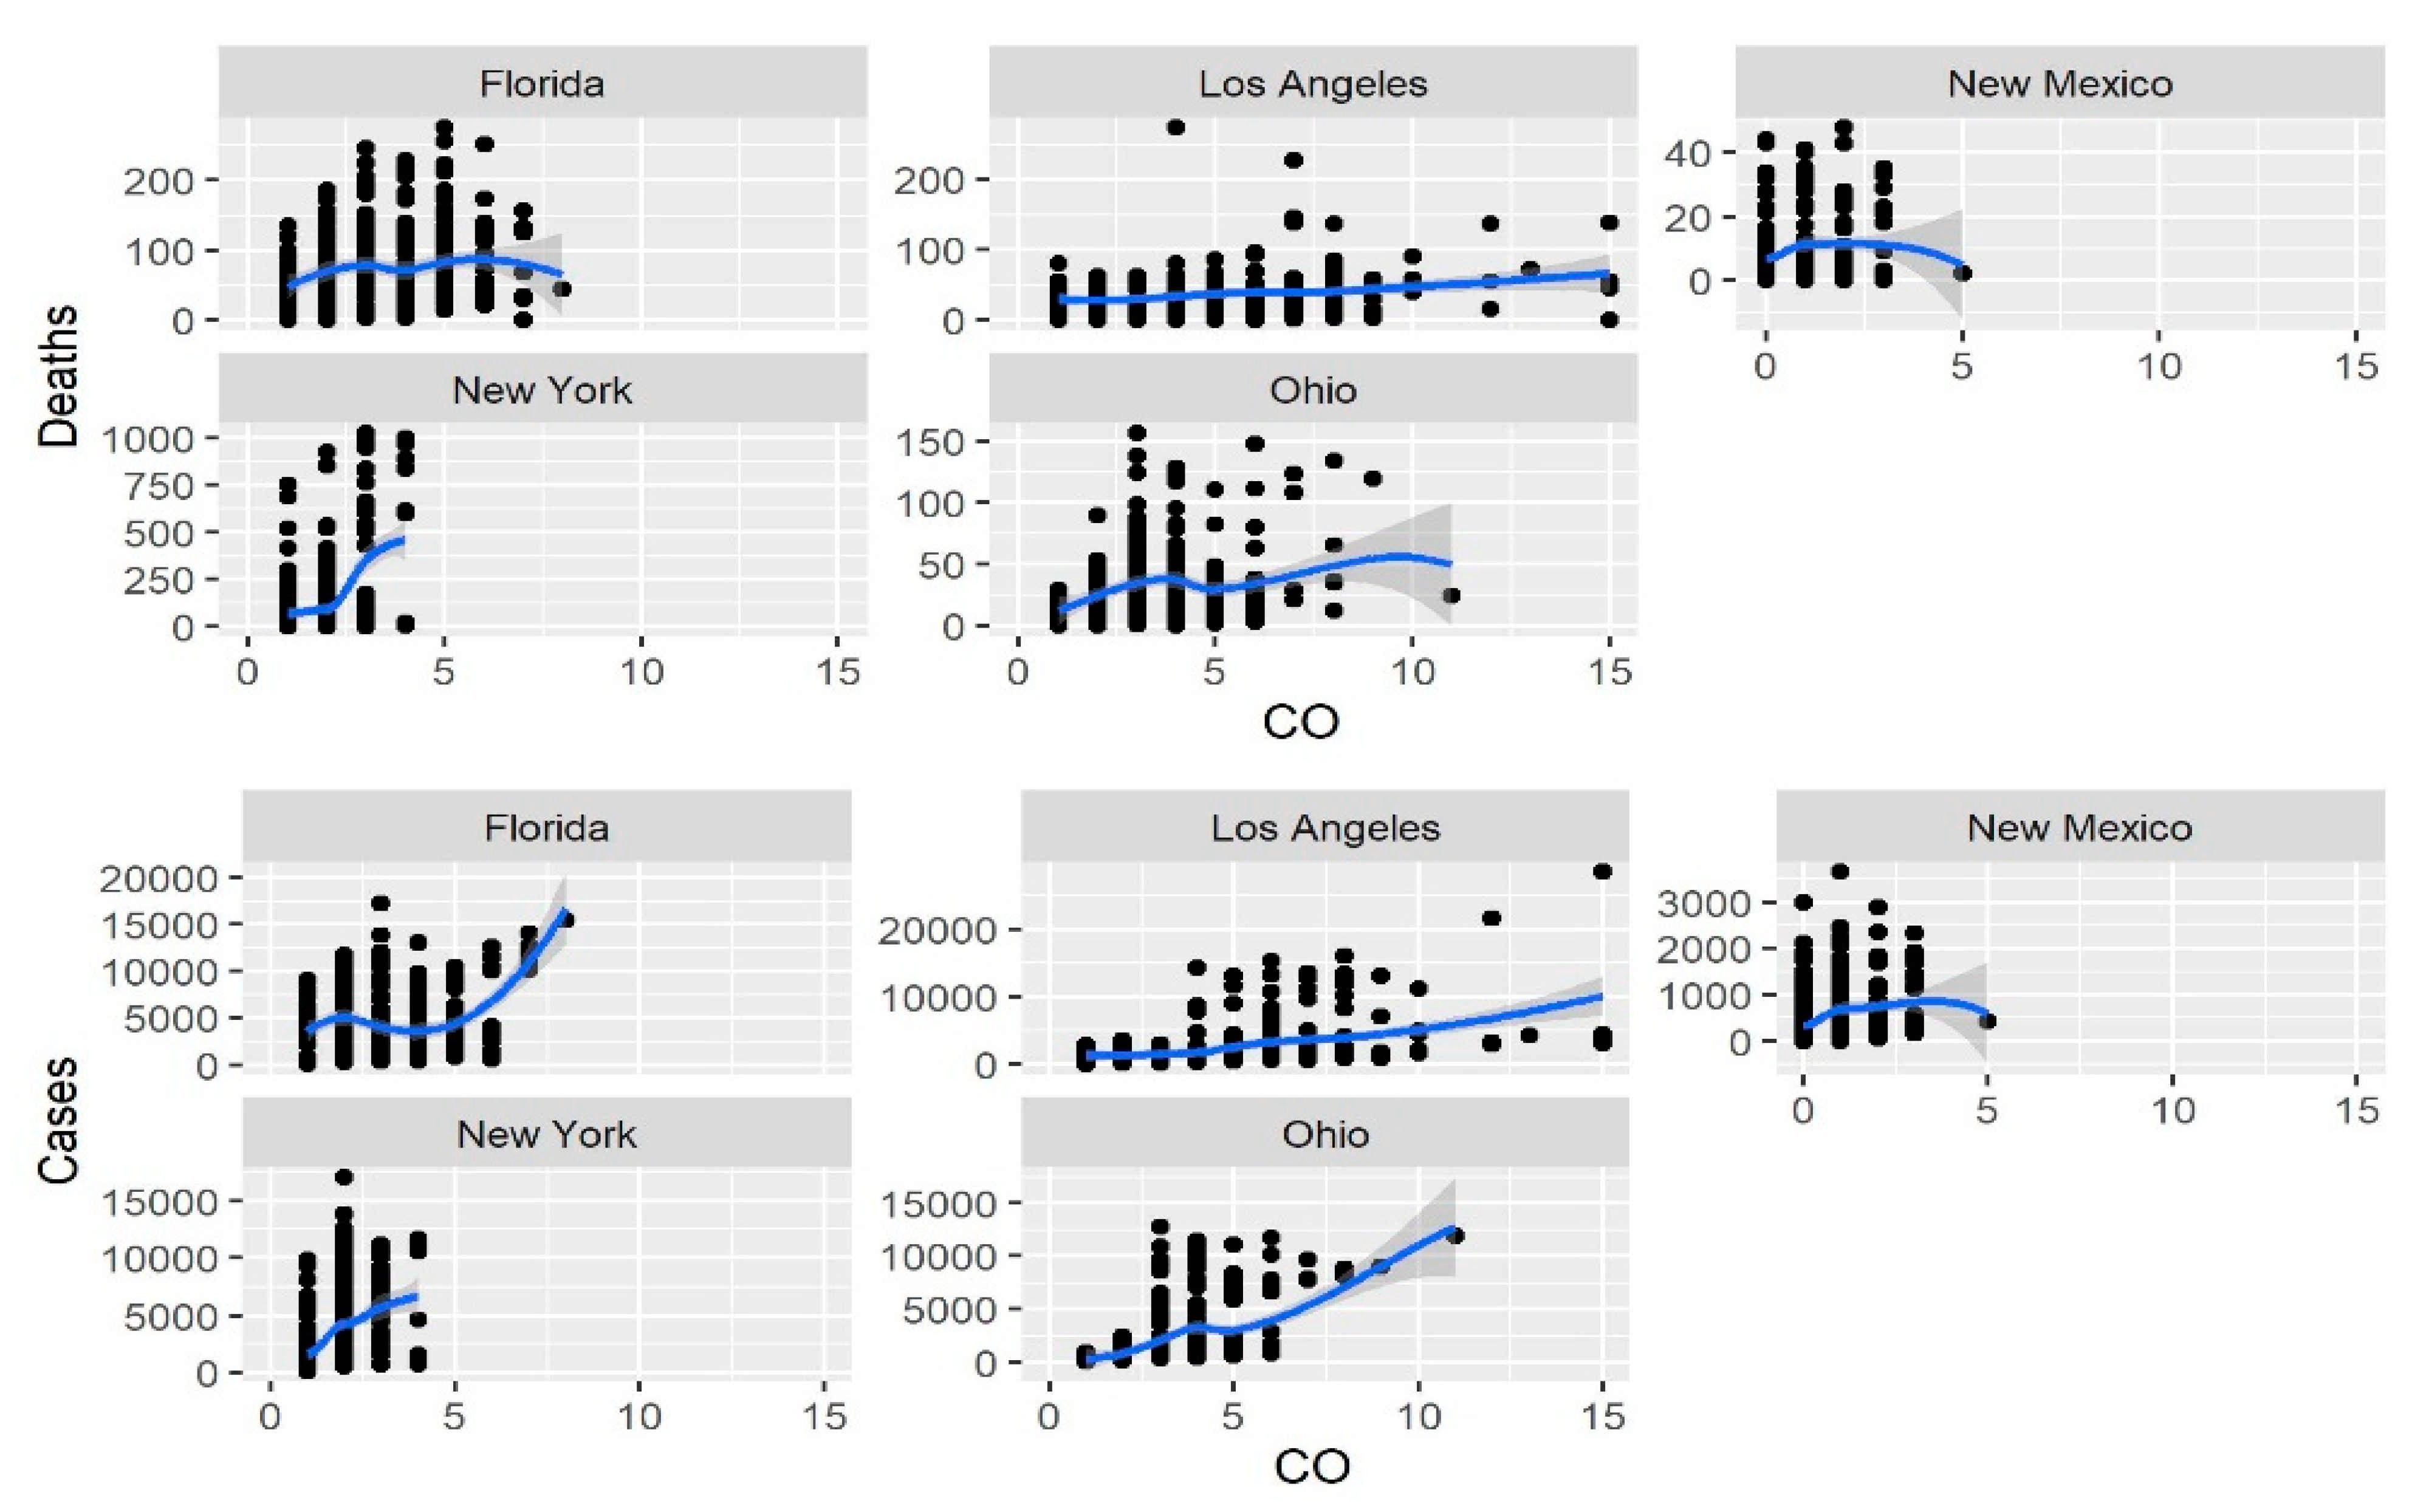
| Carbon monoxide (CO) | 0.182 | <0.001 * | |
| Nitrogen dioxide (NO2) | 0.597 | <0.001 * | |
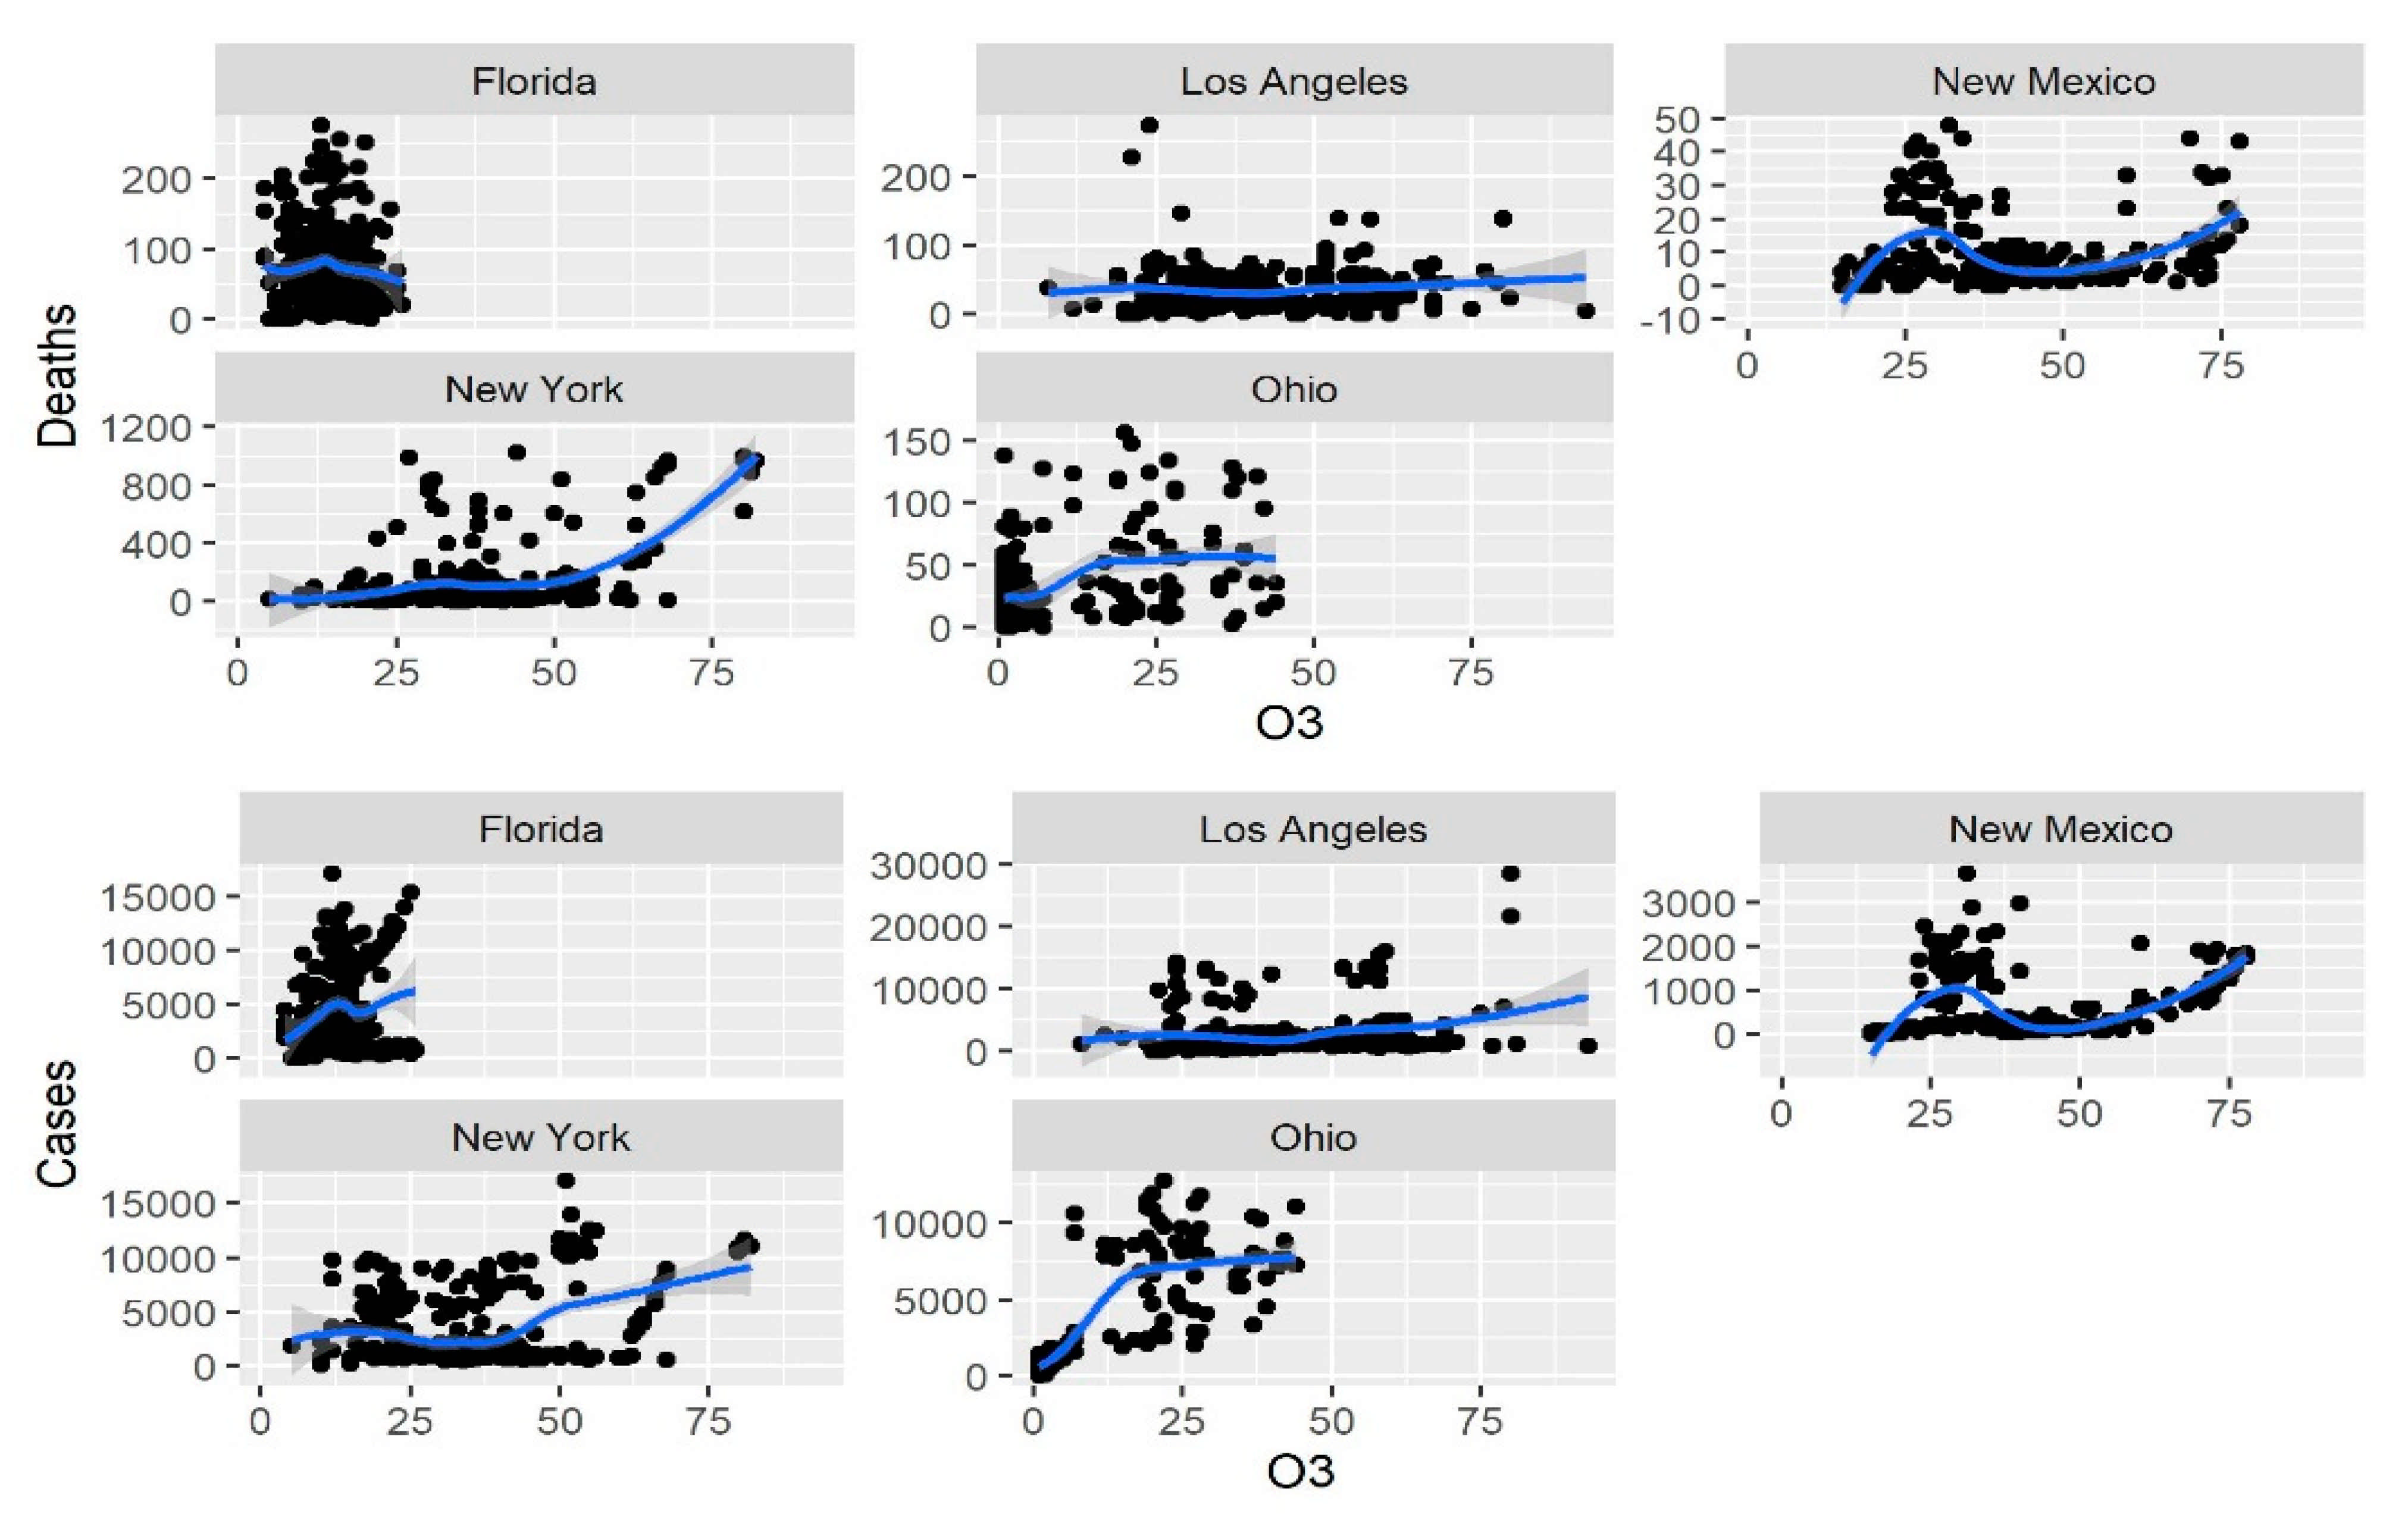
| Ozone (O3) | 0.198 | 0.001 * | |
| Los Angeles | Particulate matter (PM2.5) | 0.207 | <0.001 * |
| Carbon monoxide (CO) | 0.394 | <0.001 * | |
| Nitrogen dioxide (NO2) | 0.544 | <0.001 * | |
| Ozone (O3) | 0.202 | 0.001 * | |
| New Mexico | Particulate matter (PM2.5) | 0.132 | 0.024 * |
| Carbon monoxide (CO) | 0.326 | <0.001 * | |
| Nitrogen dioxide (NO2) | 0.384 | <0.001 * | |
| Ozone (O3) | 0.173 | 0.003 * | |
| New York | Particulate matter (PM2.5) | 0.432 | <0.001 * |
| Carbon monoxide (CO) | 0.448 | <0.001 * | |
| Nitrogen dioxide (NO2) | 0.468 | <0.001 * | |
| Ozone (O3) | 0.347 | <0.001 * | |
| Ohio | Particulate matter (PM2.5) | 0.394 | <0.001 * |
| Carbon monoxide (CO) | 0.468 | <0.001 * | |
| Nitrogen dioxide (NO2) | 0.035 | <0.001 * | |
| Ozone (O3) | 0.820 | <0.001 * |
| Deaths by Region | Environmental Pollutants | Spearman’s ρ | p-Value |
|---|---|---|---|
| Florida | Particulate matter (PM2.5) | 0.04 | 0.948 |
| Carbon monoxide (CO) | 0.170 | 0.003 * | |
| Nitrogen dioxide (NO2) | 0.207 | <0.001 * | |
| Ozone (O3) | 0.021 | 0.726 | |
| Los Angeles | Particulate matter (PM2.5) | 0.141 | 0.017 * |
| Carbon monoxide (CO) | 0.213 | 0.017 * | |
| Nitrogen dioxide (NO2) | 0.307 | <0.001 * | |
| Ozone (O3) | 0.076 | 0.196 | |
| New Mexico | Particulate matter (PM2.5) | 0.052 | 0.376 |
| Carbon monoxide (CO) | 0.190 | <0.001 * | |
| Nitrogen dioxide (NO2) | 0.288 | <0.001 * | |
| Ozone (O3) | 0.066 | 0.256 | |
| New York | Particulate matter (PM2.5) | 0.328 | <0.001 * |
| Carbon monoxide (CO) | 0.431 | <0.001 * | |
| Nitrogen dioxide (NO2) | 0.468 | <0.001 * | |
| Ozone (O3) | 0.476 | <0.001 * | |
| Ohio | Particulate matter (PM2.5) | 0.146 | 0.013 * |
| Carbon monoxide (CO) | 0.202 | 0.001 * | |
| Nitrogen dioxide (NO2) | 0.012 | 0.841 | |
| Ozone (O3) | 0.407 | <0.001 * |
| Environmental Pollutants | B | S.E | Exp (β) | p-Value |
|---|---|---|---|---|
| Particulate matter (PM2.5) | 0.001 | 0.000231 | 1.001 | <0.001 * |
| Carbon monoxide (CO) | 0.138 | 0.0002 | 1.148 | <0.001 * |
| Nitrogen dioxide (NO2) | 0.011 | 0.000653 | 1.011 | <0.001 * |
| Ozone (O3) | 0.001 | 0.000269 | 1.001 | <0.001 * |
| Environmental Pollutants | B | S.E | Exp (β) | p-Value |
|---|---|---|---|---|
| Particulate matter (PM2.5) | 0.008 | 0.0002 | 0.993 | 0.578 |
| Carbon monoxide (CO) | 0.041 | 0.0015 | 1.042 | <0.001 * |
| Nitrogen dioxide (NO2) | 0.034 | 0.0004 | 1.034 | <0.001 * |
| Ozone (O3) | 0.015 | 0.0002 | 1.015 | <0.001 * |
Publisher’s Note: MDPI stays neutral with regard to jurisdictional claims in published maps and institutional affiliations. |
© 2021 by the authors. Licensee MDPI, Basel, Switzerland. This article is an open access article distributed under the terms and conditions of the Creative Commons Attribution (CC BY) license (https://creativecommons.org/licenses/by/4.0/).
Share and Cite
Meo, S.A.; Abukhalaf, A.A.; Alessa, O.M.; Alarifi, A.S.; Sami, W.; Klonoff, D.C. Effect of Environmental Pollutants PM2.5, CO, NO2, and O3 on the Incidence and Mortality of SARS-CoV-2 Infection in Five Regions of the USA. Int. J. Environ. Res. Public Health 2021, 18, 7810. https://doi.org/10.3390/ijerph18157810
Meo SA, Abukhalaf AA, Alessa OM, Alarifi AS, Sami W, Klonoff DC. Effect of Environmental Pollutants PM2.5, CO, NO2, and O3 on the Incidence and Mortality of SARS-CoV-2 Infection in Five Regions of the USA. International Journal of Environmental Research and Public Health. 2021; 18(15):7810. https://doi.org/10.3390/ijerph18157810
Chicago/Turabian StyleMeo, Sultan Ayoub, Abdulelah Adnan Abukhalaf, Omar Mohammed Alessa, Abdulrahman Saad Alarifi, Waqas Sami, and David C. Klonoff. 2021. "Effect of Environmental Pollutants PM2.5, CO, NO2, and O3 on the Incidence and Mortality of SARS-CoV-2 Infection in Five Regions of the USA" International Journal of Environmental Research and Public Health 18, no. 15: 7810. https://doi.org/10.3390/ijerph18157810