1. Introduction
Online learning is the buzzword in contemporary discourse on education as it has become the only viable option to provide uninterrupted education in a world that values seclusion over socialization to curb the spread of COVID-19. However, the term has been used in general education since the 1990s. It is also known by alternative terms such as e-learning, blended learning, online education, web-based education, web-based instruction and online courses [
1,
2] though with some subtle terminological differences which are not very obvious to those who are outside the field of educational technology [
3]. For example, even though ‘e-learning’ and ‘online learning’ have commonly been used interchangeably, the two terms have also been distinguished based on how education is provided in a given context. The term ‘online learning’ is only used in those contexts where education is provided through Internet whereas e-learning refers to the type of education provided through Internet as well as other media such as television, radio, and digital versatile discs (DVDs) [
2,
4]. Nevertheless, the modern use of the term ‘online learning’ is mostly ambiguous as it can encompass both synchronous (e.g., videoconferencing, live chat, and instant messaging) and asynchronous (e.g., web-based course materials) modes of teaching and learning [
1,
3]. Thus, in a nutshell, online learning can currently mean anything from uploading materials on an online platform to teaching live using various software applications such as Zoom which facilitate “the bridging of the space between the teacher and the student through the use of web-based technologies” [
5,
6].
The terms e-learning and online learning have commonly been used in the recent burgeoning literature on higher education to introduce the type of education provided in different contexts around the world during the COVID-19 pandemic [
7,
8]. However, the type of e-learning adopted during an emergency is not necessarily synonymous with high-quality, carefully designed, web-based online learning that has been practiced in the field of higher education for decades [
3,
7]. Due to this, Hodges et al. [
3] propose Emergency Remote Teaching (ERT) as a more accurate term to refer to the mode of teaching many education institutions have adopted during the COVID-19 pandemic. ERT, unlike pre-planned online education, is “a temporary shift of instructional delivery” the goal of which “is not to re-create a robust educational ecosystem but rather to provide temporary access to instruction and instructional supports in a manner that is quick to set up and is reliably available during an emergency or crisis” [
3]. One context in which such ERT has successfully been implemented in Asia during the pandemic is universities and other higher education institutions in Sri Lanka [
9]. The successful implementation of ERT in the country’s higher education is especially noteworthy since online learning was not a term that had commonly been associated with Sri Lankan universities before the pandemic hit the country in March 2020. Until then, in the 15 public universities and other institutions involved in tertiary level education in the country, online learning had largely been limited to the exchange of materials and conducting selective assessment tasks via their Learning Management Systems (LMS) [
9]. This is also evident from the fact that before the pandemic, no public university in Sri Lanka had a single program of study— except some distance education programs offered by the Open University of Sri Lanka—that had at least been partially conducted online [
10]. However, in response to their sudden closure due to the pandemic, many universities and other higher education institutions in Sri Lanka managed to establish an effective system of ERT in their respective institutions [
9].
Like in other contexts in the world, the transition to online learning in Sri Lankan universities during the pandemic was sudden and abrupt: both lecturers and students had a very limited time to prepare for the new mode of teaching and learning [
9]. However, this transition was greatly facilitated by several initiatives taken by respective universities as well as the University Grants Commission (UGC) of Sri Lanka. The main initiative taken by the UGC was to connect the Learning Management Systems of state universities with the Lanka Education and Research Network (LEARN), an association that provides Internet access for education and research in the country. As a result of this initiative, most public universities (90% of state and non-state institutions) could provide their students with free access to online education during the pandemic [
9]. This was also made possible by the agreement that the government reached with the Internet providers in the country to provide free access to learning management systems of Sri Lankan universities: “This has been instrumental in promoting online learning for students in Sri Lanka” [
9], while reducing the magnitude of the equity gap which is reportedly a characteristic of online learning during the pandemic in many contexts around the world [
7]. The popularity of online learning in Sri Lankan universities during the pandemic is evident from the fact that LEARN had observed 13 million online activities on their system (e.g., accessing reading materials, following lecture slides, attending online quizzes) within a week in May 2020, two months after Sri Lankan universities completely shifted to online learning. Furthermore, 540,000 students had participated in synchronous teaching and learning within a week in July 2020 while 91% of faculty members also reported using learning management systems for their teaching [
9]. This transition to online learning was also facilitated by training programs conducted by respective universities to train their staff on online teaching and assessment, different software for online teaching, video/audio recording and editing digital resources. For example, the Center for Digital Education and Professional Development of the Faculty of Humanities and Social Sciences of the University of Sri Jayewardenepura had reported on their website that they had conducted ten staff training programs for the faculty between March 2020 and July 2020.
In their survey conducted in June 2020 at forty-six state and ten non-state higher education institutes in Sri Lanka involving students, lecturers, and administrators, Hayashi et al., 2020 [
9] report that 94% of the country’s state higher education institutions had shifted to online education in response to the pandemic. Furthermore, 79% of online learning was Internet-based. The survey also identified various challenges associated with online education in Sri Lanka, some of which included the poor Internet connection, stressful nature of e-learning, difficulty in online assessments and/or exams, inadequate faculty-student interaction, poor quality of video collaboration software, and inadequate access to devices, which are reported as common challenges associated with online learning around the world too [
7,
8]. The poor Internet was the most common among Sri Lankan students as 70% of the students had identified it as a challenge. However, Hayashi et al. [
9] also found that despite many reported challenges, 90% of the 16,521 respondents of the survey were satisfied with their online learning experience (moderately satisfied: 66%; satisfied: 24%). Still, what exactly determined students’ satisfaction with their online learning during the pandemic remains unexplored in their study, and this, we believe, warrants further investigation. Meanwhile, recent research on online education during the pandemic reports that the level of student satisfaction in online learning is determined by a variety of factors which can be broadly categorized under
challenges of e-learning,
learner motivation, and
interaction [
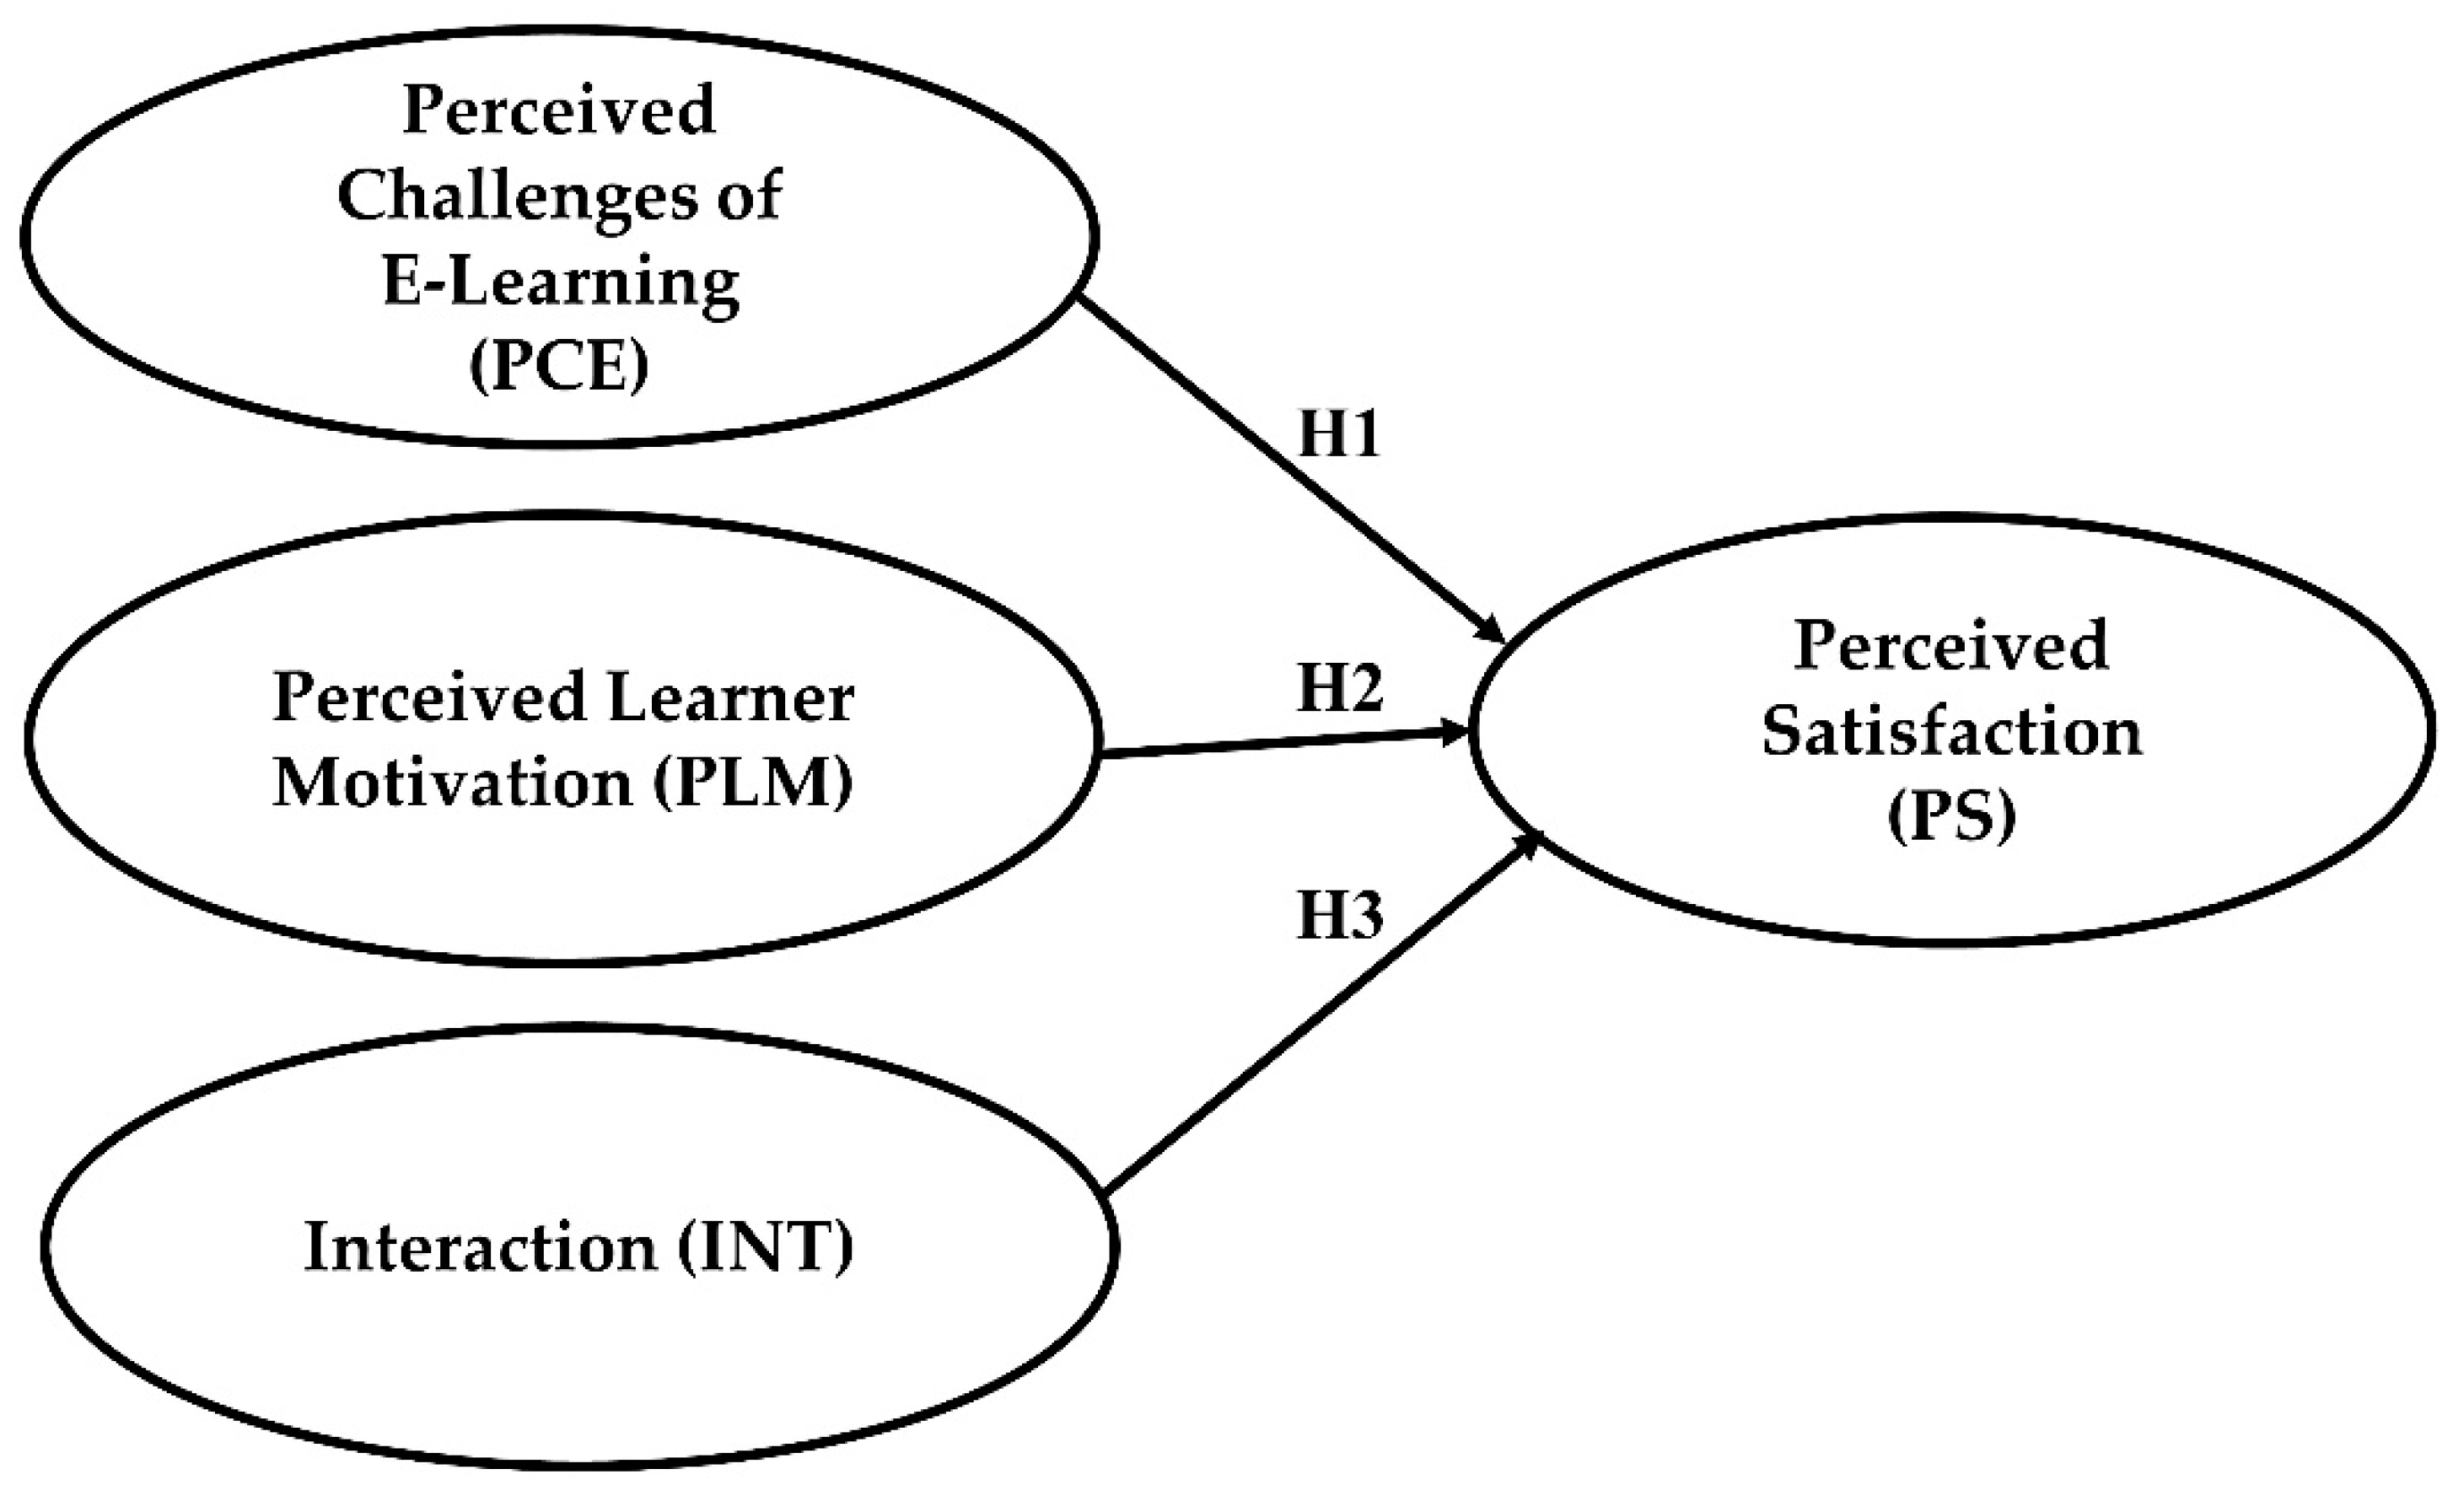
7,
11]. Thus, the goal of this study is to determine how these three phenomena are related to student satisfaction in online learning in Humanities and Social Sciences at state universities in Sri Lanka. Using Structural Equation Modeling, the study answers the following research questions:
Research Question 1: To what extent are the students satisfied with their online learning experience?
Research Question 2: To what extent do the challenges of e-learning, motivation, and interaction impact students’ satisfaction with their online learning experience?
The rest of this paper is structured as follows.
Section 2 provides a review of literature on the phenomena investigated in this study. Meanwhile,
Section 3 describes the materials and methods of the study. The results of the study are presented in
Section 4. Next,
Section 5 provides the discussion and conclusions. Finally,
Section 6 discusses the implications of the study.
4. Results
4.1. Participants
The demographic profile of the 1376 undergraduates who took part in the study is given in
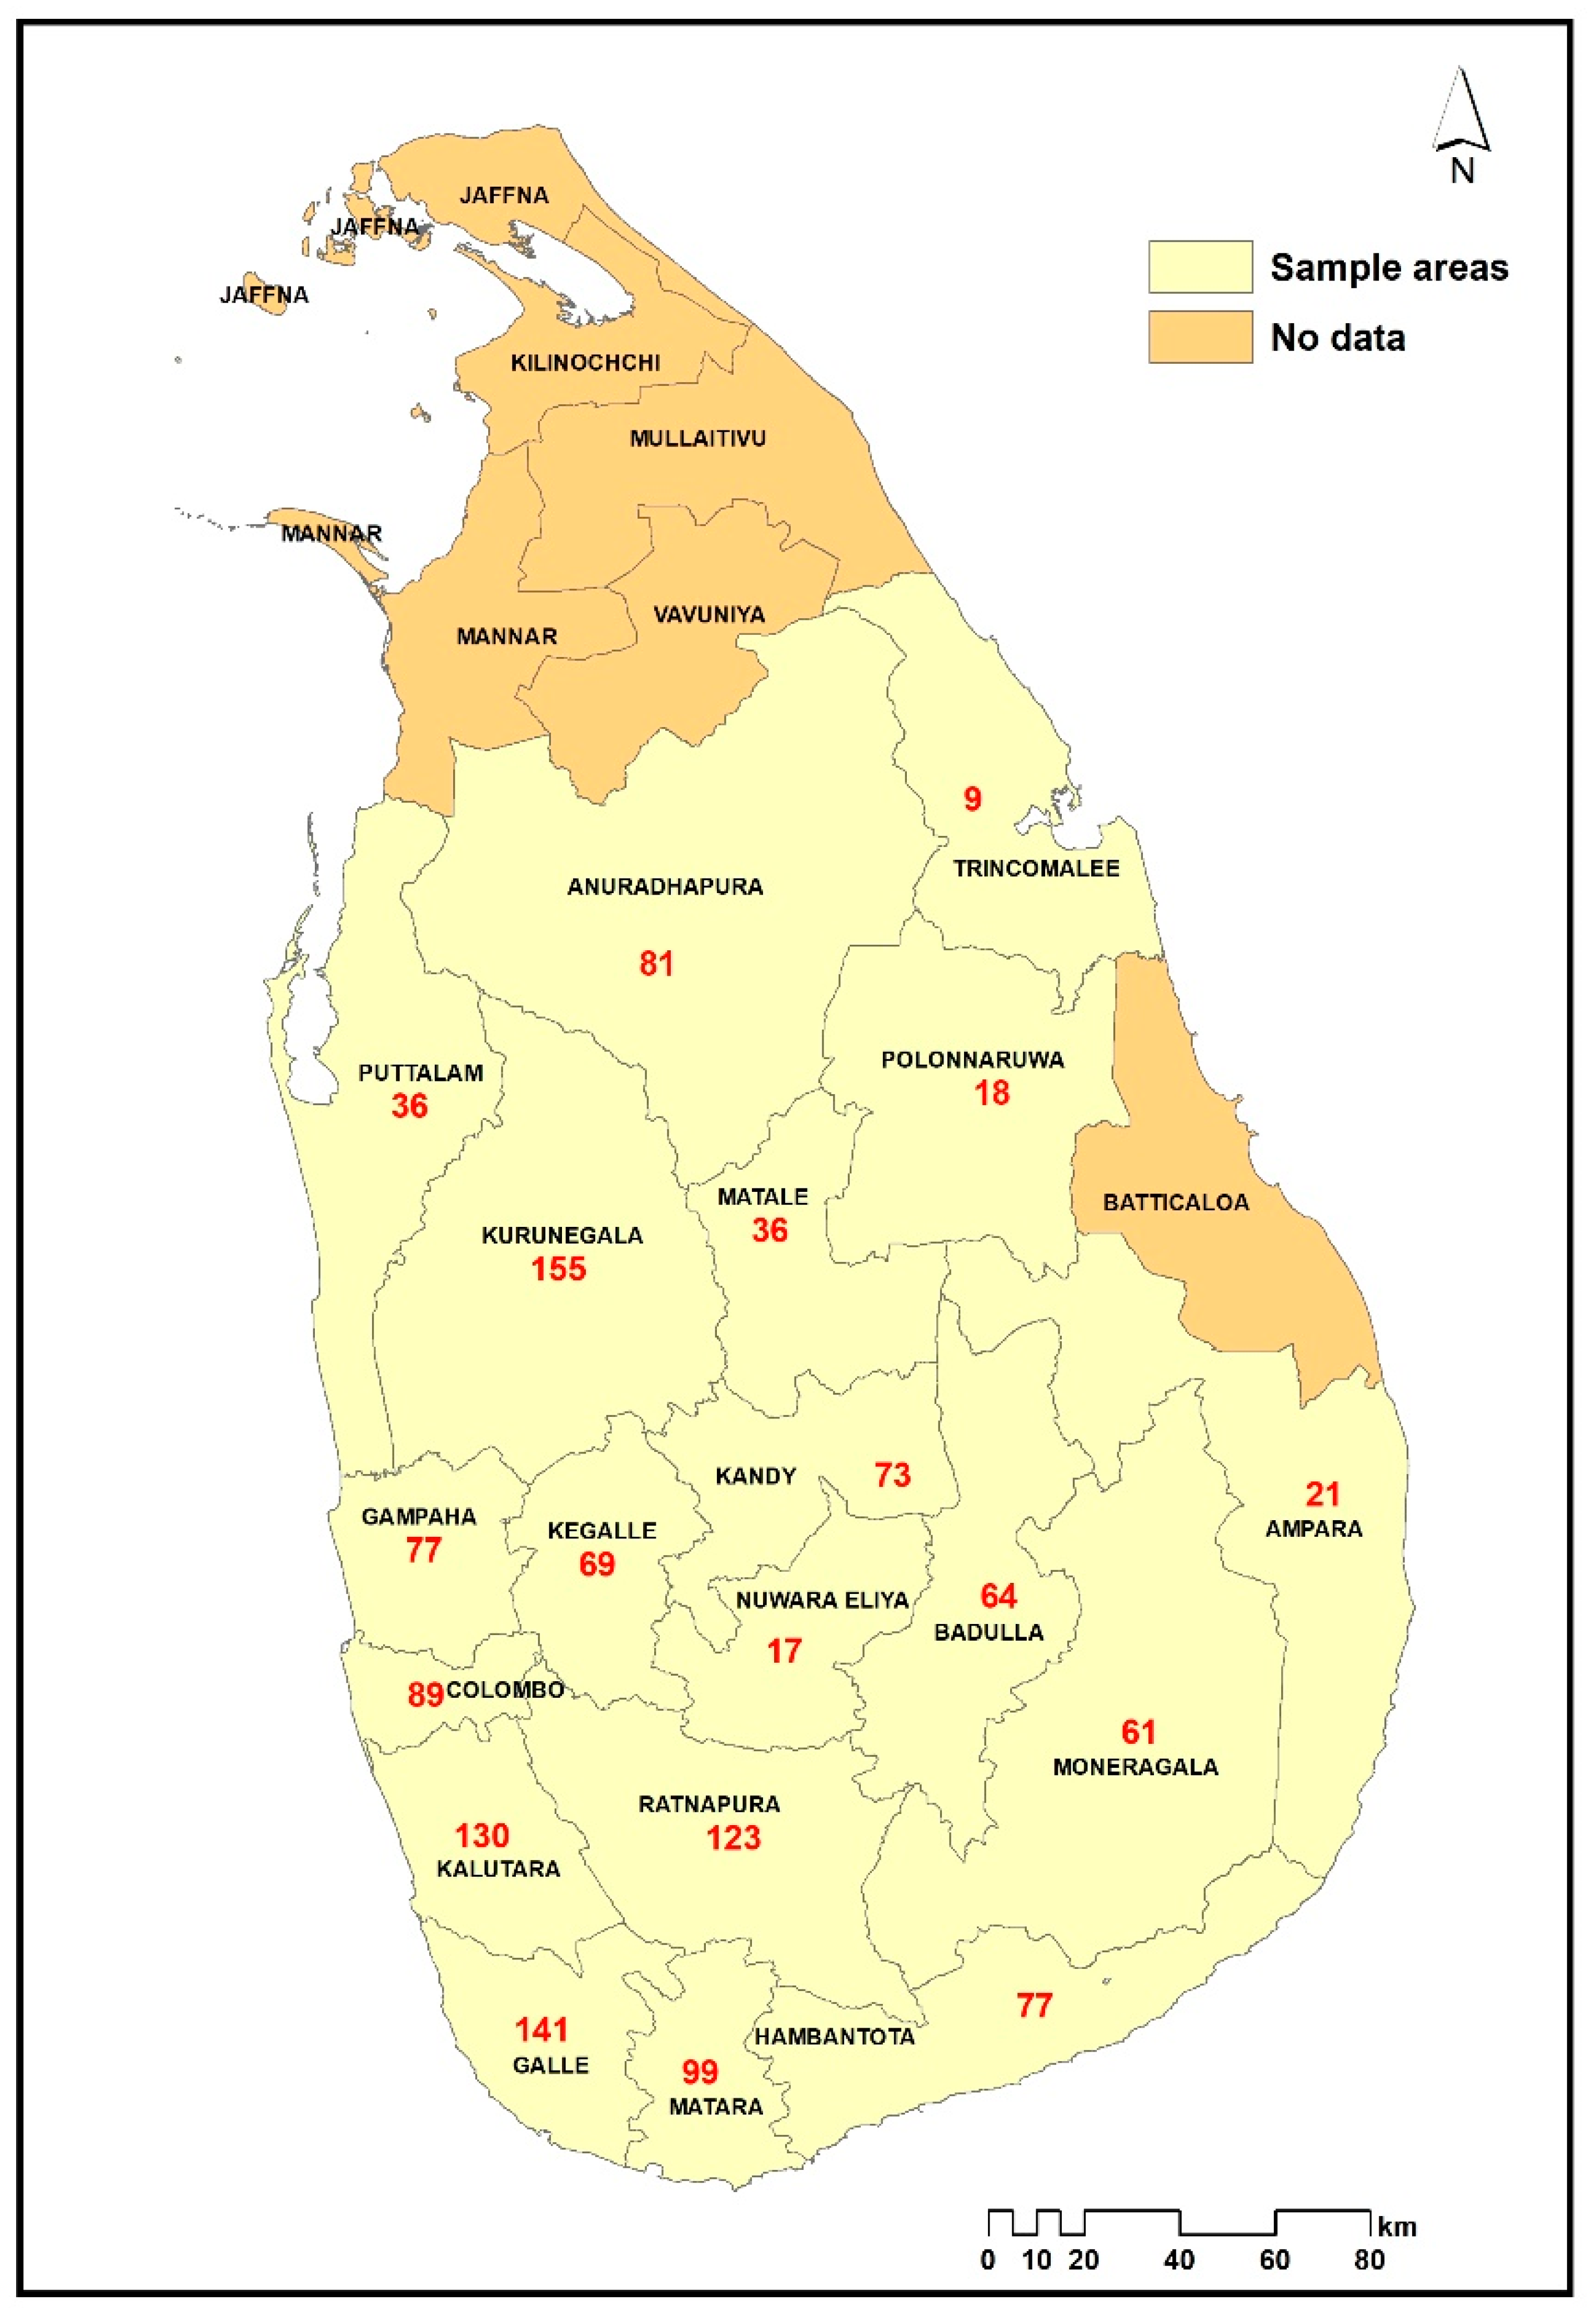
Table 1. As the table shows, the majority of the survey participants were females (88.3%); the percentage of the male participants was around 11.7%. This is reflective of the percentage of male and female students in Humanities and Social Sciences of Sri Lankan universities. In terms of age, the participants ranged from 20 to 30 years. However, the dominant group was aged between 21 and 22, and they comprised 55.6% of the sample. The second dominant group aged between 23–24 made 29.3% of the sample. In terms of the year of study, first-year students made the highest percentage (58.4%) while the rest was represented by second (15.6%), third (17.6%), and fourth (8.4%) year students. A majority of the participants self-rated their IT literacy as moderate (86.1%) while the rest had either very high (5.4%) or low (8.4%) IT literacy. The geographic distribution of the survey participants is depicted in
Figure 2. As the map shows, the participants are located in different regions of the country.
4.2. Latent Variables: Descriptive Statistics
As stated elsewhere, all latent variables, viz. satisfaction, motivation, and interaction of this study were measured through a five-point Likert scale ranging from strongly disagree (1) to strongly agree (5). However, in the analysis, the points strongly agree and agree were combined to create the single response
Agree, and strongly disagree and disagree were amalgamated to create the single response
Disagree: the response
Neutral was left as it is. In the case of Challenges of Online Learning, extremely challenging and challenging were clubbed to form the response
Challenging while not challenging and not challenging at all were combined to form the single response
not challenging.
Table 2 shows the percentages of responses for each indicator variable measured under the four latent constructs: Only responses for
Agree or
Challenging are recorded.
As far as the dependent variable satisfaction is concerned, the table shows that the highest percentage of student responses (73%) is recorded for the lecturer’s preparation for online teaching, indicating that most students are satisfied with the dimension of the lecturer’s preparation in online teaching. Meanwhile, the responses received for lecturers’ use of technology during online lessons is the lowest among all (28%), implying that a large number of students are not satisfied with how lecturers manage technology (i.e., using breakout rooms for group discussions, sharing videos, etc.) during an online lesson. Relatively higher percentages are also reported for dimensions such as the opportunities for lecturer-student interaction during sessions (43%), lecturer’s provision of student feedback (42%) and how continuous assessments are conducted (42%). However, student satisfaction is generally low with the aspects such as the way summative assessment is conducted (39%), promotes peer interaction (39%) and the method of sharing learning materials (38%).
In terms of motivation, the highest response rate (53%) is reported for students’ interest in attending online lectures, implying that the majority of the respondents were generally motivated to attend their online sessions. However, responses received for the lecturer’s method of teaching (25%) and the students’ home environment (24%) imply that these factors have demotivated a majority of students to attend their online sessions. In contrast, poor internet connectivity (12%) and the physical absence of peers (11%) had demotivated only a very small percentage of participants, which could be due to the asynchronous mode of teaching in which both these dimensions can be less relevant. In Perceived Challenges of Online Learning, most responses are recorded for technical difficulties (81%), implying that software issues and the unavailability of appropriate devices for online learning and assessment activities pose a challenge for most learners. The absence of opportunities for practical training (62%) is also a challenge for a majority of students. The third highest response (46%) is recorded for feeling isolated in online learning, a reported challenge for students in many online learning contexts. However, staying focused during a lesson has received the least responses among all, indicating that it may not be as challenging as other dimensions for the participants of this study. As far as the interaction is concerned, a majority of the participants reported having limited opportunities for lecturer-student interaction (56%) in their sessions. A high percentage of students (45%) also reported that they had inadequate opportunities to interact with their peers during online sessions. However, only 35% of the students stated that they had limited e-resources for learning, indicating that opportunities for student-content interaction must have been comparatively higher in their online learning.
4.3. Assessment of the Measurement Model
4.3.1. Reliability of Latent Constructs
The reliability of all structural measurements is estimated using Cronbach’s alpha reliability, which explores the internal consistency and the properties of the measuring scale.
Table 3 provides a summary of Cronbach’s alpha for each of the constructs measured. According to George and Millery (2003) [
65], alpha frequencies indicate a more reliable level at 0.7 while a value greater than 0.8 indicates a higher level of reliability. As the table shows, the alpha coefficients for PS and INT are above 0.7, thus indicating adequate internal consistency for those variables. Meanwhile, PLM and PCE are 0.61 and 0.68, respectively, which can be considered acceptable. In general, it can be concluded that all the latent constructs were characterized by good internal consistency allowing further analyses.
4.3.2. Model Requirements
Univariate and multivariate normality requirements of the data for SEM in the current study were estimated using the distributional indicative measures, Skewers, and Kurtosis. Skewness values for all the indicator variables ranged from −0.71 to 1.94, of which only three indicators reported the values greater than 1. Meanwhile, Kurtosis values are less than 7 for all the indicator variables showing univariate normality. Multivariate normality was measured by using Mardia’s coefficient. Mardia value recorded for this study is at 22.66, which is well below the recommended cut-off of 483 with the 21 observed variables meeting multivariate normality. Accordingly, the assumptions of the univariate and the multivariate normality are satisfied in this study (refer to
Table 4).
Meanwhile, the linearity among variables was tested by using the regression method. The dependent variable,
Perceived Satisfaction was regressed concerning each independent variable, and curve fittings were tested as reported in
Table 5. PLM and PS were related linearly with an F-value of 161.399 at one percent level of significance. PCE was linearly connected to PS, recording a significant F-value of 82.548, while the curve fitting between PS and INT provides an F-value of 16.765 for the linear relationship. All the other forms such as quadratic and cubic forms recorded lower F values than those for all the variables. Hence, all independent latent constructs and the dependent variable reported a satisfactory level of linearity between each pair, and this satisfies this study’s linearity assumption.
The present study used Pearson correlation, the variance inflation factor, and the tolerance for collinearity diagnosis [
64]. The highest Pearson correlation value reported was 0.497 between INT and PLM, indicating the existence of serious multicollinearity among independent variables. As reported in
Table 6, the variance inflation factor (VIF), which assesses the extent to which the variance of an estimated regression weight increases when predictors are correlated, range from 1 to 3. This confirmed that there were no serious collinearity issues among the predictors of the model. Tolerance values for all the observed variables which are shown in the second column of the same table report values greater than 0.10, indicating the non-existence of multicollinearity.
One of the basic requirements for structural equation modelling is the existence of a satisfactory level of correlation among variables, an essential condition for further analysis.
Table 7 reports the correlation among all the variables of the present study. As expected, they are correlated with each other with expected size and statistical significance at conventional levels. The Pearson correlation coefficient for the variables ranged from 0.11 (the lowest, between PS and INT) to 0.463 (the highest, between PS and PLM) indicating a satisfactory level of expected relationships among all the variables. Thus, the results of the bivariate analysis provided a sound base for further analysis.
4.3.3. Model Fit Indices
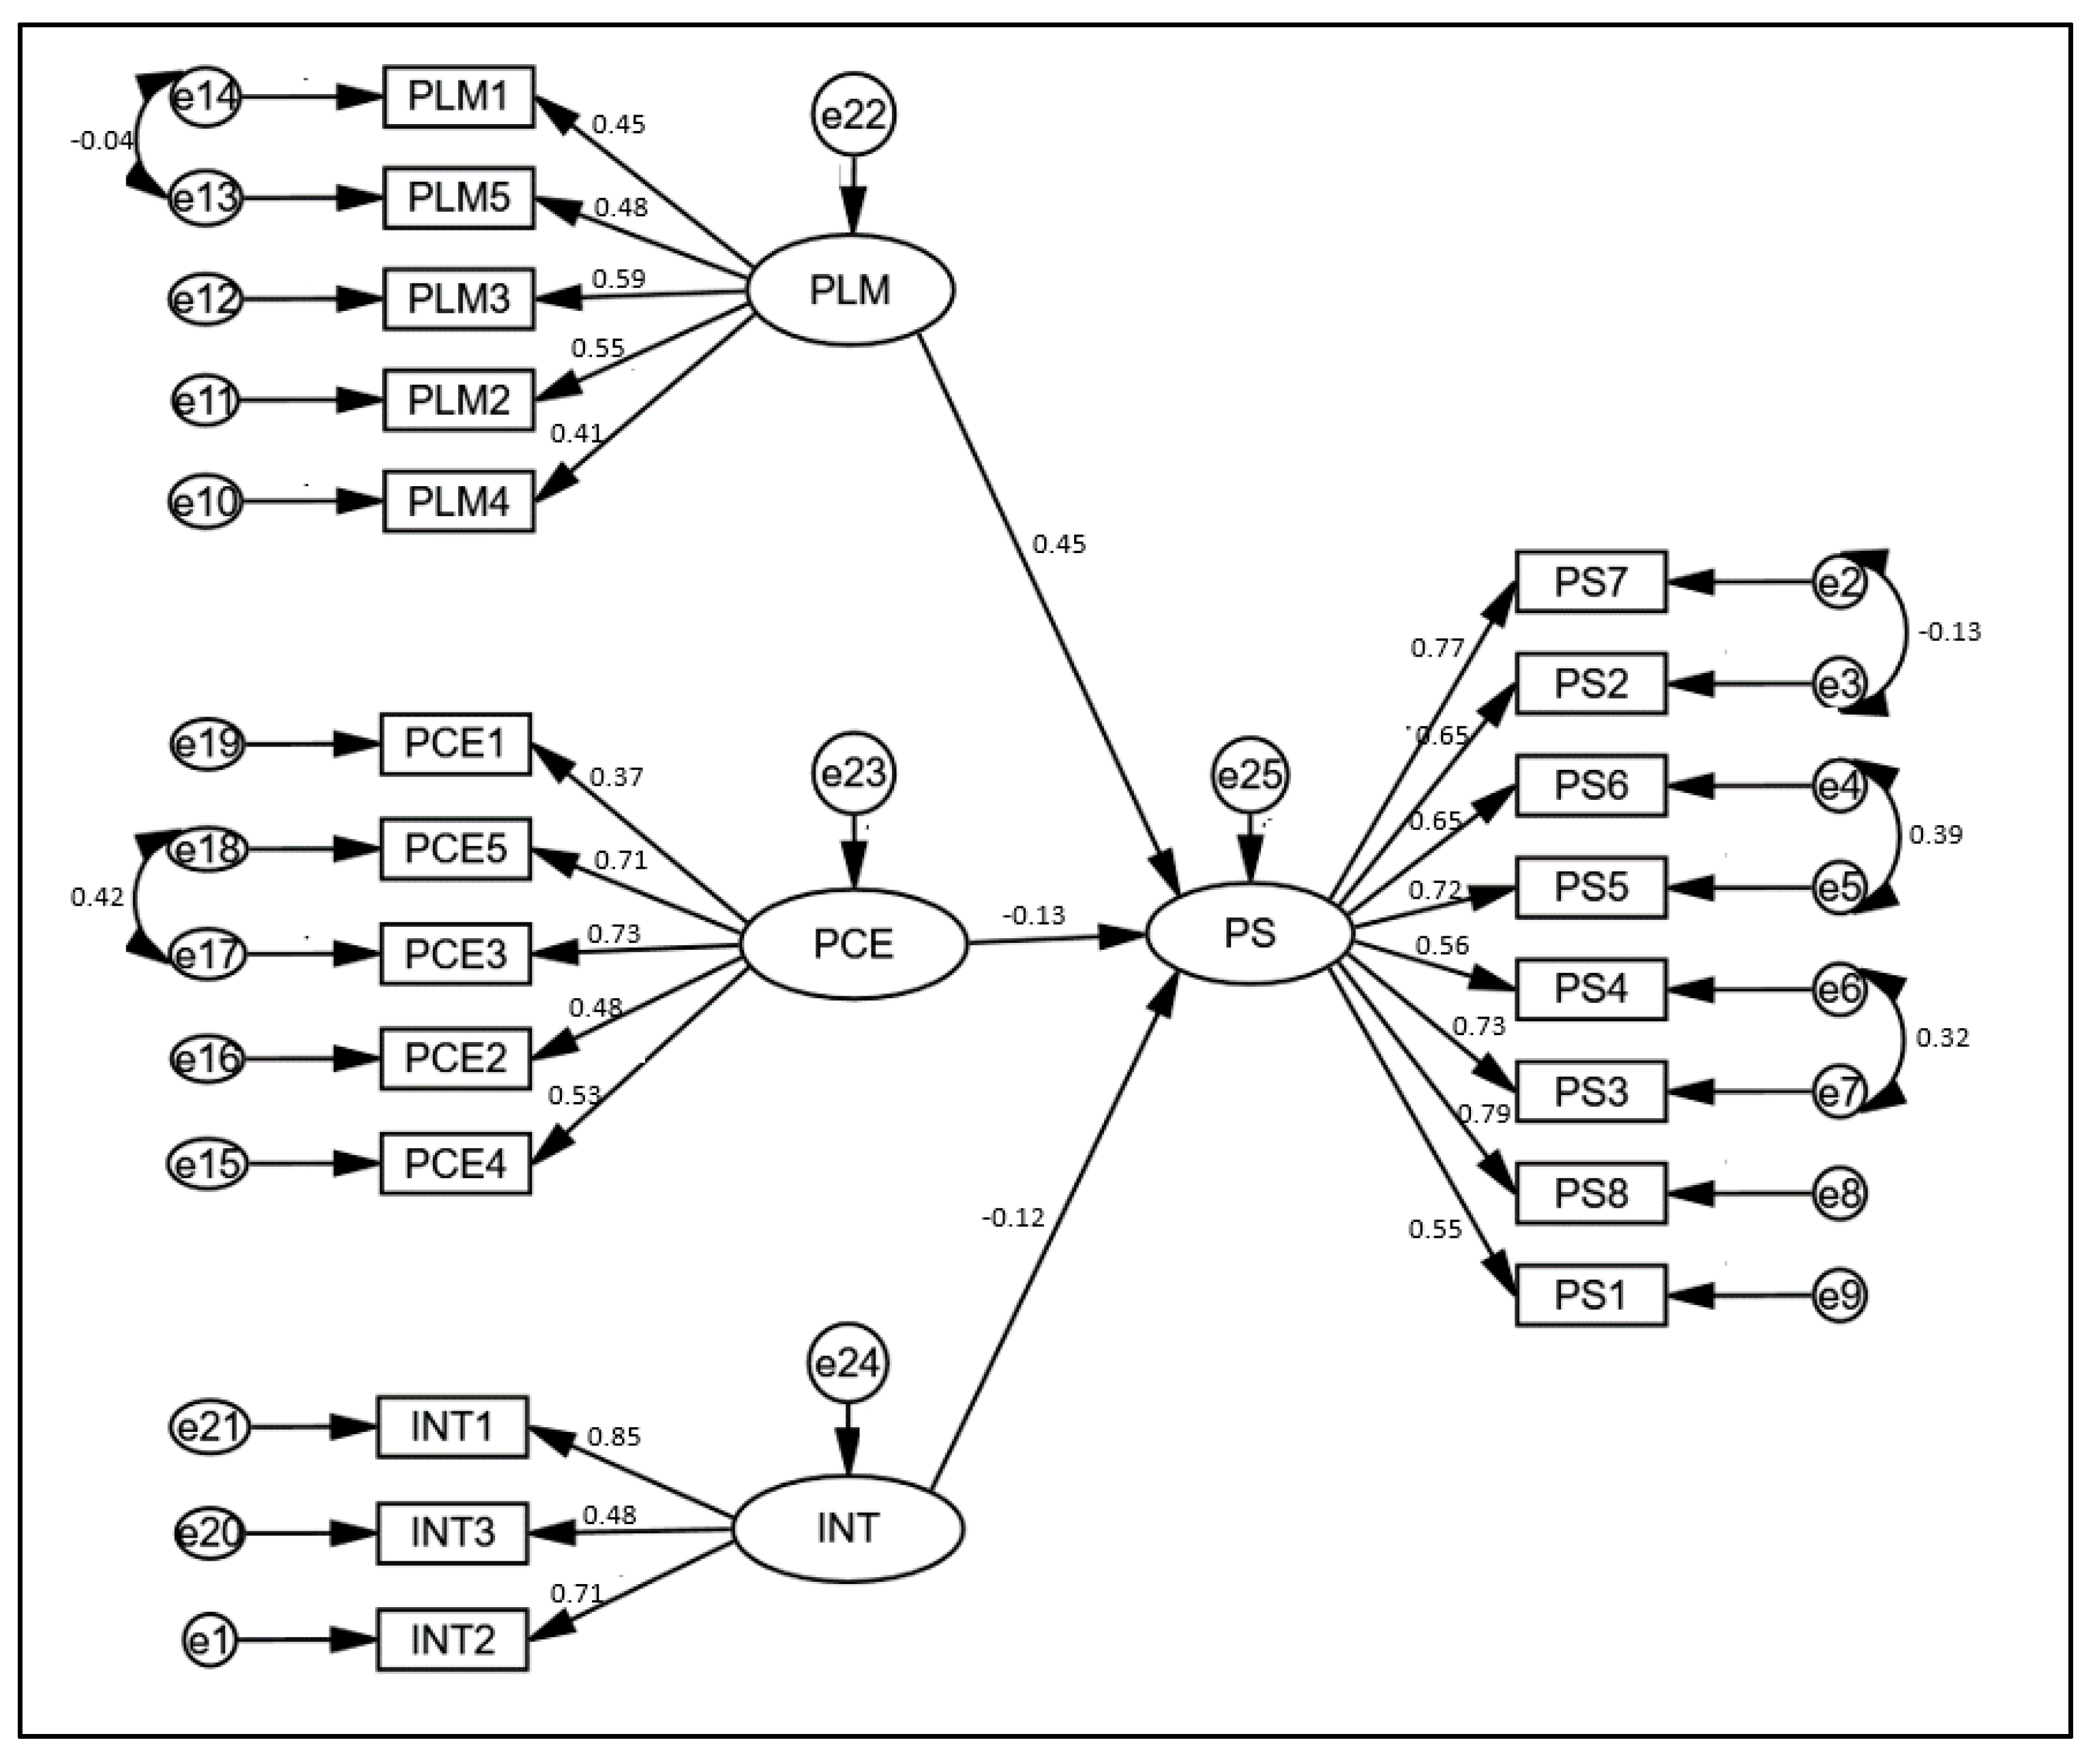
The estimated measurement model is illustrated in
Figure 3. Once the overall model fit is considered, Model χ
2 = 754.263, df = 180 and CMIN/DF recorded 4.19, making the measurement model acceptable. As shown in
Table 8, the Root Mean Square Error of Approximation (RMSEA), which assesses the hypothesized model fit with a population covariance matrix, is 0.048 for the estimated model, and 0.140 > PCLOSE reject the null “RAMSEA is greater than 0.05”. The root mean square residual (RMR) value for the current study (RMR = 0.020) is less than the critical value of 0.05 while GFI (Goodness of fit index) and adjusted GFI (AGFI) that represent the overall amount of the covariation among the observed variables that can be accounted for by the model is 0.949 and 0.934, respectively. They are greater than 0.9 providing evidence of well-fitting of the measurement model. The Comparative fit index (CFI) and the value for the model are greater than 0.9 (CFI = 0.931), indicating a good overall fit of the measurement model. The Normed Fit Index (NFI) value of this study was 0.912 which is greater than 0.9, and it indicates a good incremental fit. Moreover, TLI = 0.920, IFI = 0.931 are greater than the cut-off of 0.9. Accordingly, all the model fit indices meet the requirements for a good-fitting measurement model.
4.3.4. Validity of the Measurement Model
The convergent validity is verified mainly by computing the Average Variance Extracted (AVE), standardized loadings, and the construct reliability (CR) for all variables. AVE reported for the PS and INT are above 0.5 while the other two constructs PLM and PEC record AVE values at 0.318 and 0.387, respectively. CR values for PS, PCE, and INT are above the cut-off of 0.7 while it is almost 0.7 (0.698) for PLM. Thus, all the factor loadings are significant. The results of all the three indicators that are presented in
Table 9 provide evidence for a satisfactory level of convergent validity for the measurement model.
In
Table 10, the diagonal values indicate the square root values of AVE for relevant variables while the values below the diagonal figures show correlations. As the table shows, all the inter-variable correlations are less than the relevant AVE square root values, supporting the discriminant validity of the measurement model of the current study. Further, heterotrait-monotrait criteria (HTMT) for discriminant validity was investigated following Henseler, et al. (2015) [
66] to avoid caveats of the Fornell-Larcker criterion [
67]. The HTMT value was 0.167, which is well below the threshold of 0.85, and this confirmed the discriminant validity of the model.
As
Table 10 shows, all correlations between the structure of the measurement model are in expected directions, and they are statistically significant. Therefore, this study guarantees the nomological validity of the setting.
4.4. Assessment of the Structural Model
Standard model fit indices were used to assess the Goodness-of-fit (GFI) of the structural model, viz. the discrepancy ratio (χ
2/df; df = degrees of freedom), the adjusted goodness-of-fit (AGFI), the comparative fit index (CFI), the normative fit index (NFI) and the root mean square error of approximation (RMSEA). As given on
Table 11, χ
2 = 568.519, df = 176, CMIN/df = 3.230, TLI = 0.944, CFI = 0.953, IFI = 0.953, RMR = 0.021, RMSEA = 0.040. For a good model fit, the discrepancy ratio should be smaller than 5; the AGFI should be higher than 0.8 while CFI and NFI should be greater than 0.9. Meanwhile, the RMSEA should be below or equal 0.08 for a good fit and below 0.05 for an excellent fit. The results show that the model is good fit for testing the direct-effect hypotheses established in this study.
All the model fit indices of the structural model have improved compared to the measurement model. The Chi-square (χ2) has improved by 185.744 for the SEM model. The Chi-square difference test shows that χ2 of the measurement model is significantly different from that of the direct structural model which was at 0.005 significance. In the SEM, df and CMIN/df have been reduced by 4 and 0.96, respectively, compared to the measurement model. CFI has improved by 0.022 while RMSEA has slightly reduced from 0.048 to 0.040. The results of this comparison indicate that the structural model has achieved a better overall model fit than the measurement model. It provides evidence for the good fit of the SEM.
The graphical output, along with the results of the structural equation model, is represented in
Figure 4 while
Table 12 reports the standardized structural path estimates of the main model and the factor loadings for each item on the latent factor, SEs, CRs and
p-values of the SEM model. All the path estimates are significant (1 percent level of significance) and are in the expected direction. Accordingly, the three hypotheses of the study can be tested through path coefficients (β), critical ratios and related
p-values. The results show that Perceived Learner Motivation (PLM) has the strongest effect on students’ perceived satisfaction. Furthermore, PLM has a direct and positive relationship with students’ perceived satisfaction (β = 0.484; CR = 10.13;
p < 0.001), which supports hypothesis one. Meanwhile, Perceived Challenges of E-Learning (PCE) has a direct and negative relationship with students’ perceived satisfaction (β = −0.149; CR = −4.456;
p < 0.001), and this supports hypothesis two. Finally, Interaction (INT) has a direct and negative relationship with students’ perceived satisfaction (β = −0.112; CR = −3.612;
p < 0.001), which supports hypothesis three.
5. Discussion and Conclusions
This study started with the goal of investigating the determinants of student satisfaction with online learning in Sri Lankan universities during the COVID-19 pandemic. Based on the extensive literature on online learning and student satisfaction, we hypothesized that students’ satisfaction with online learning can be determined by three key variables: Perceived Challenges of E-learning (PCE), Perceived Learner Motivation (PLM), and Interaction (INT). The hypothesized model was tested using Factor Analysis and Structural Equation Modelling (SEM). The results revealed that all three independent variables have a significant impact on student satisfaction, a finding that is consistent with the literature reviewed on online learning and student satisfaction in this study [
7,
13,
24,
37].
Among the three independent variables, PLM has the strongest significant impact on students’ satisfaction. The positive relationship between these two constructs implies that students’ higher motivation in online learning leads to their increased satisfaction with the task, a finding consistent with empirical studies across different contexts [
7,
37]. This finding is not surprising given that in online learning, unlike in face-to-face learning, learners are left with the additional responsibility of their learning. As a result, self-regulated learning plays an important role in its success [
33,
36,
68]. While motivation holds the key in self-regulated learning [
34], self-regulated learners, in contrast to others, tend to develop an independent learning style, display self-directed behavior and have an internal locus of control of their learning [
35,
69,
70,
71,
72]. Thus, online learners are generally assumed to be self-motivated [
73], and this makes them naturally become more satisfied with their learning [
27,
37]. It is for this reason that learner motivation has been identified as the most important determinant of student satisfaction and success in online learning [
33]. Our results may also account for the finding in Hayashi et al. (2021) [
9] that 90% of the students that they surveyed in Sri Lankan universities were satisfied with their online learning experience despite various challenges that they had encountered. This satisfaction of the learners may stem from their motivation to continue their online education even during the pandemic, a plausible assumption consistent with the prior literature [
33]. Furthermore, as reviewed in Rovai et al. (2007) [
63], it is a common finding in the literature that various factors related to online learning, viz. the novelty effect of the use of the technology, less or little travel to the instruction site, the curiosity, and the demand for knowledge can increase learner motivation.
As reported in many studies on online learning, student demotivation is tied to the poor Internet connectivity and household environments that are not as learner-friendly as a classroom [
7,
68,
74]. This study also found that only 24% of the survey respondents were satisfied with their home environment which may imply that it was not conducive to their online learning. This number is not surprising as additional questions on the survey revealed that even 24.4% of the participants attended online sessions from various places other than their own homes due to poor Internet connectivity issues. However, surprisingly only 12% of the participants identified the poor Internet connectivity as a demotivator for attending their online sessions. This may be because all three universities, where this study was conducted, had provided access to recorded lectures and other materials via the Learning Management System so that even those students who do not have access to a reliable Internet connection to attend synchronous sessions can be engaged in online learning. Even though the poor Internet connectivity can be a challenge that they encounter, the mere existence of challenges may not always hamper student motivation in online education as distance learners are naturally more self-resilient and motivated [
75]. Even in a recent study, Dhinigra, Pasricha, Sthapak and Bhatnagar (2021) [
68] report that most of the medical students that they surveyed in India had the motivation to receive online education despite various challenges they had encountered. Thus, despite challenges, online learners can be motivated to continue their education, but those challenges can negatively affect their satisfaction with the learning experience, a common finding in the literature [
7,
9,
24]. This finding is echoed in this study too. The relationship observed between students’ challenges of online learning and satisfaction was negative and significant, implying that the challenges that students face in their online learning decrease their satisfaction.
Another finding of this study that is worth further discussion is the observed relationship between student satisfaction and interaction. The study found that poor interaction (teacher-student; student-student; student-content) leads to decreased student satisfaction. This supports a common finding in the literature that overall interaction is a major determinant of student satisfaction in online learning [
7,
13,
24,
61]. As elsewhere stated, interaction can be a complex phenomenon that integrates student-lecturer, student-student and student-content dimensions. Even though this study found the interaction to have a significant impact on student satisfaction, how each dimension of interaction contributes to student satisfaction in online learning, in particular in Emergency Remote Teaching, is less known in the literature. This is something that future research could investigate.
In conclusion, this study found that student satisfaction in online learning, better represented as Emergency Remote Teaching in some recent literature, is closely related to student motivation, challenges of e-learning, and interaction [
3]. The motivation was found to be the strongest predictor of student satisfaction in online learning, and students may derive motivation in online learning from various aspects associated with it. However, future research is needed to further explore different predictors of student motivation that can ultimately lead to their satisfaction with the learning experience. Meanwhile, even though the study found that perceived challenges of e-learning negatively affect student satisfaction, those challenges that the learners encounter in online learning can be diverse: inherent challenges of learning such as isolation, challenges of the new learning environment, and challenges imposed by technology are some examples. Therefore, the relationship between these different types of challenges and student satisfaction with online learning deserves attention in future research. Finally, this study replicated the common finding in the literature that poor interaction in online learning environments leads to decreased student satisfaction [
7,
13,
24]. Even though interaction is a determinant of student success and satisfaction in any mode of learning, it seems to have extra significance in online learning. This may be because rich student-student and lecturer-student interactions can alleviate the feeling of isolation that many students are supposed to experience [
6] in an online learning space.
Finally, this study has several limitations. First, the data was collected from only three state universities in the country, which may limit the generalizability of its findings. Hence, an extensive study involving a representative sample from the other universities in the country is recommended in future research. A study of that nature may have important implications for online learning in higher education in post COVID-19 Sri Lanka. Second, among many factors that can affect student satisfaction in online learning (Eom and Wen, 2006), this study was limited to only three variables: perceived challenges, perceived learner motivation and interaction. We leave it for future research to investigate how other variables such as course structure, technology, learner efficacy, learner autonomy, students’ learning style and self-regulated learning are related to student satisfaction. Finally, this study found no significant impact of some demographic variables such as gender, age, year of study and the level of IT literacy on student satisfaction. However, this might have been affected by the size of the sample used in the study. Given this, a similar study with a larger sample is recommended for future research.
6. Implications
Online education, more appropriately referred to as Emergency Remote Teaching, has become the only viable option to provide higher education in many countries in the wake of the COVID-19 pandemic. In contrast to face-to-face learning, such education has the stigma of being of lower quality [
3]. Hence, it is important that online learning practiced in higher education during the pandemic is subject to constant evaluation to ensure its quality and standards. Our findings in this study have several implications in this regard.
First and foremost, the positive relationship between student motivation and satisfaction has several practical implications for online teaching in higher education. Even though learners involved in online learning are generally assumed to be self-reliant and motivated [
73], all learners may not necessarily have these characteristics, in particular, when online education is imposed on learners as the only option to receive uninterrupted education during the pandemic. Those characteristics may generally be associated with learners who choose the online option over face-to-face learning under normal circumstances. Hence, a simple transition from face-to-face learning to online learning during the pandemic may not necessarily guarantee that learners can be self-reliant and take care of their learning. To do this, learners may require constant guidance, encouragement and training [
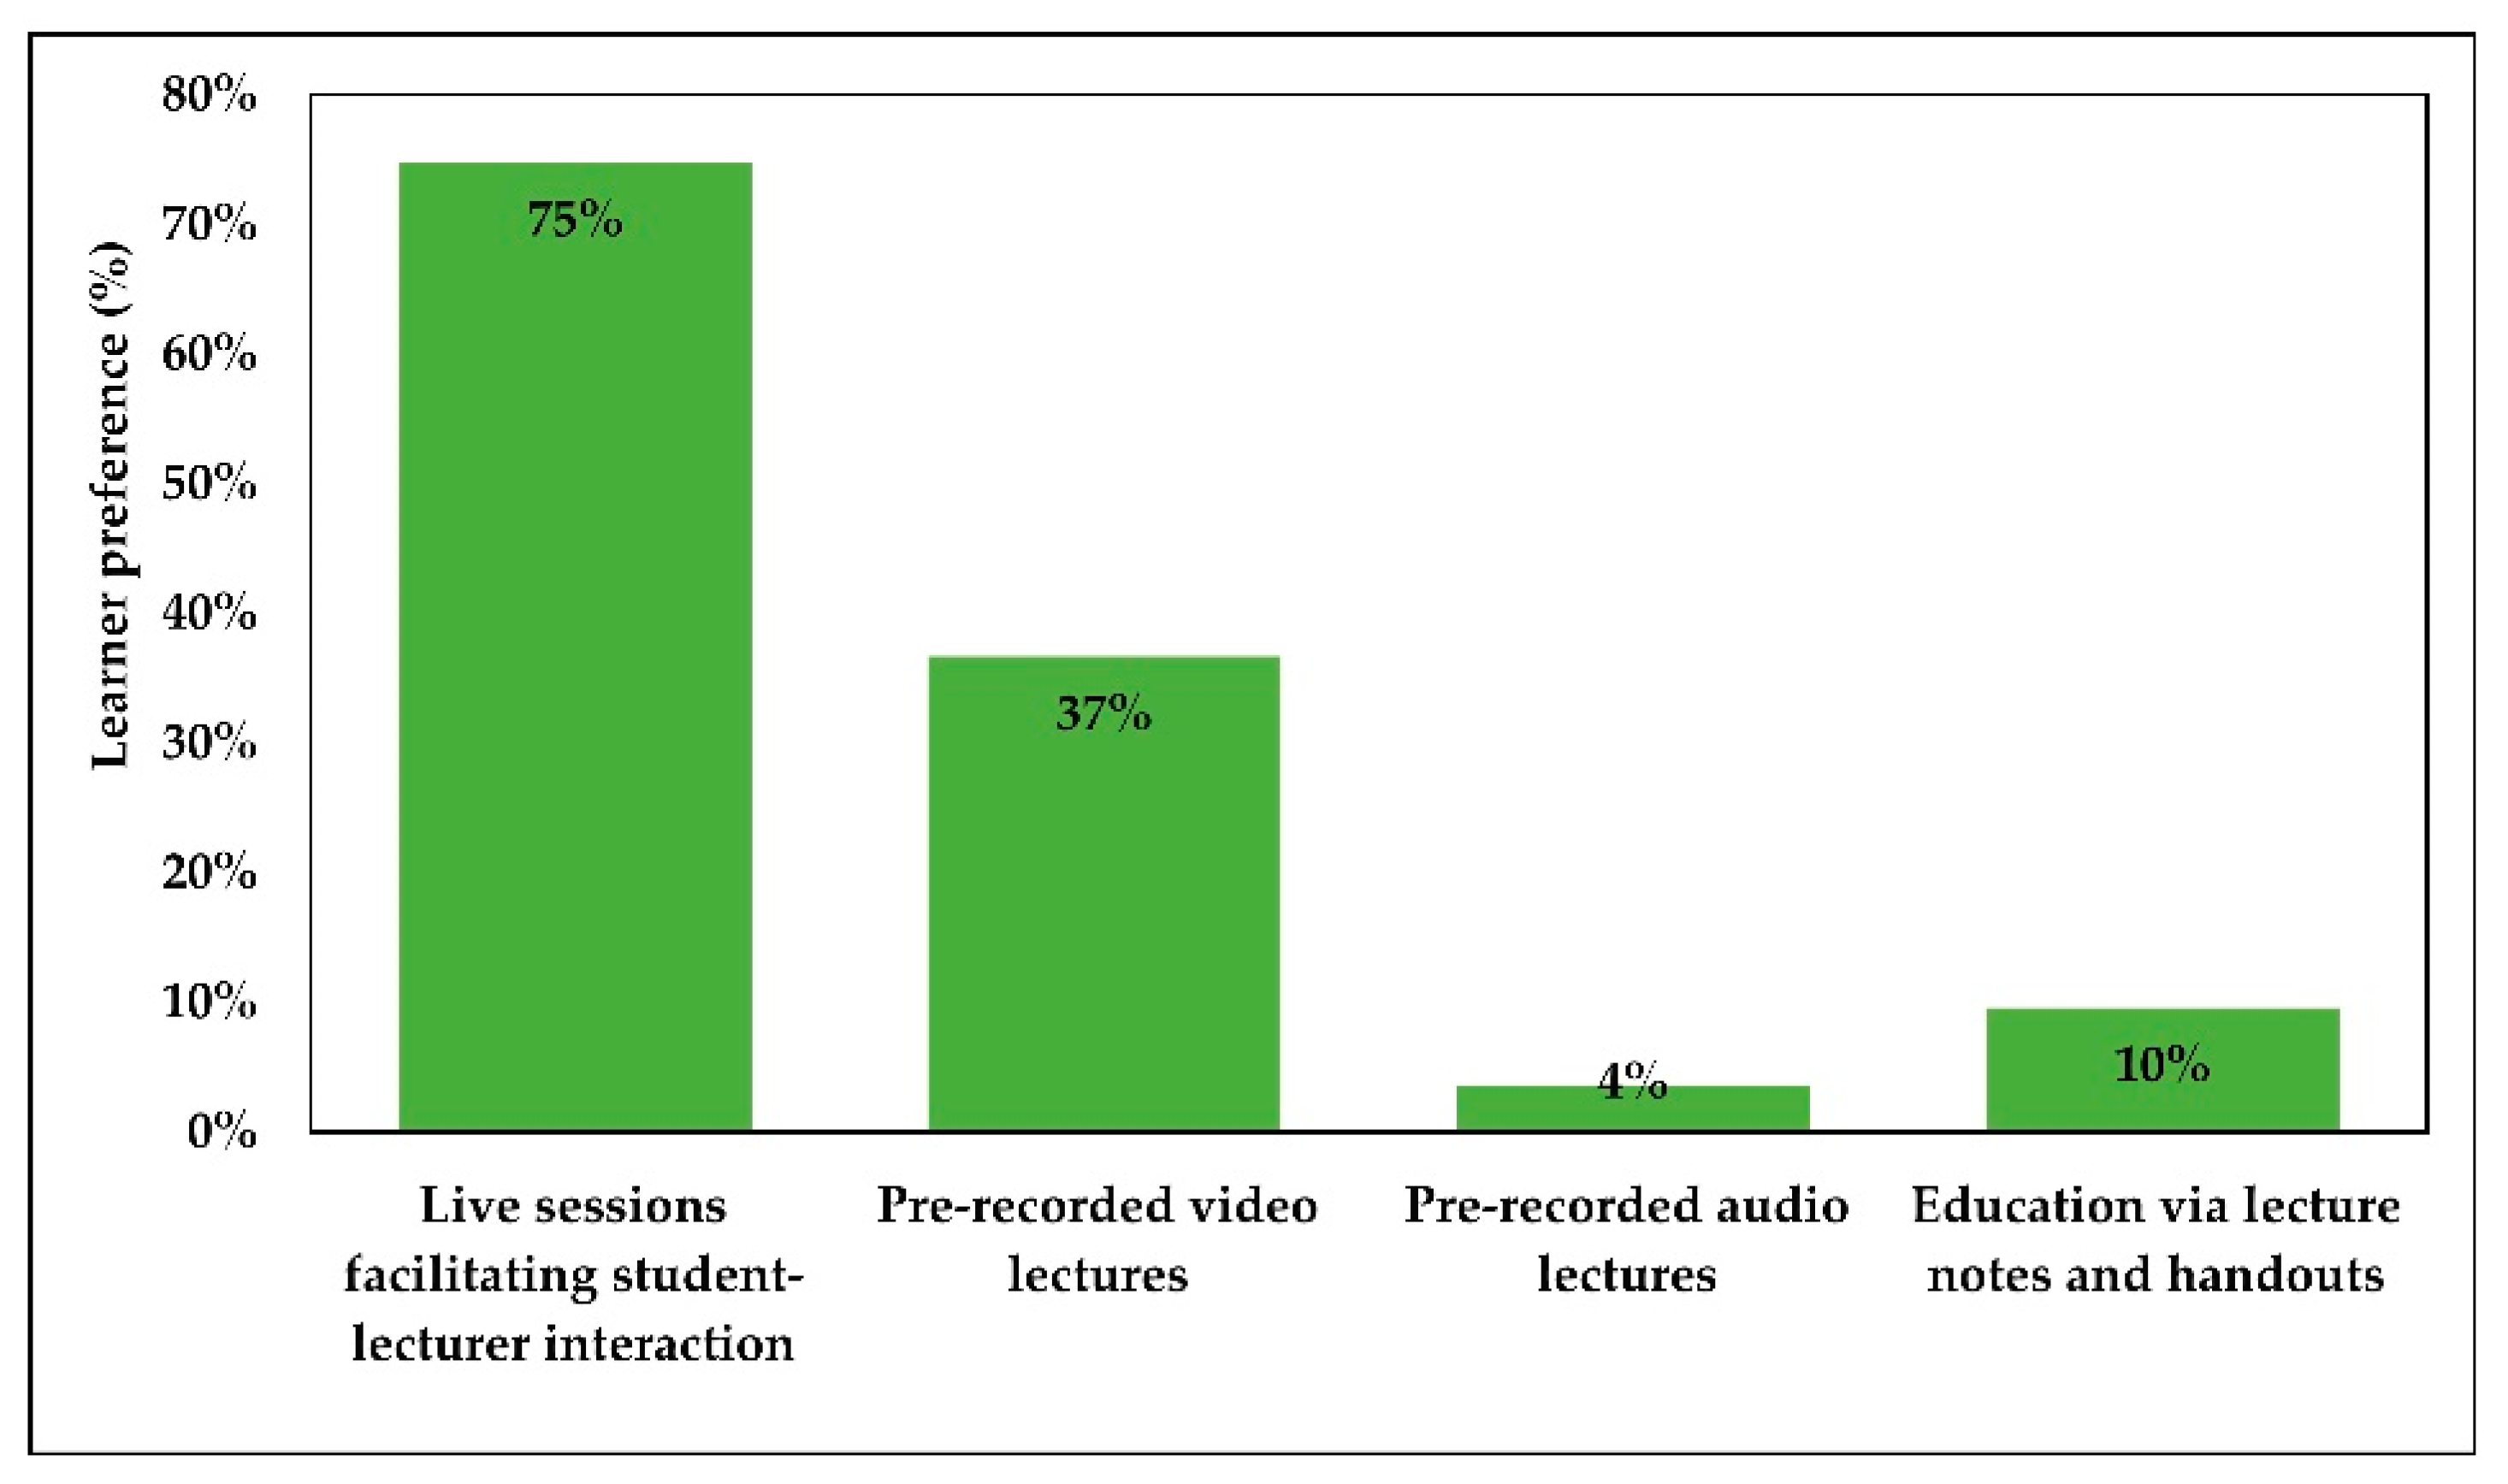
76]. Thus, one additional role of the lecturers in online teaching is to empower their learners by providing them with necessary encouragement and guidance so that they can be self-reliant and self-motivated and take care of their own learning. To motivate learners in an online learning environment, lecturers may need to consider learner needs and preferences in designing their online teaching activities. For example, in this survey, the participants (n = 1376) had indicated their preferences for online learning as follows:
As
Figure 5 shows, out of the four modes of receiving learning input, 75% of the students prefer live sessions facilitating student-lecturer interaction over pre-recorded video lectures, pre-recorded audio lectures and education via lecture notes and handouts. This emphasizes that the interaction between the lecturer and the student is a decisive factor in online learning too. Therefore, it is not surprising that it is a major determinant of student satisfaction in online learning [
45,
46]. This could also imply the learner’s long habituated dependency on the lecturer, a cognitive engagement that he/she cannot overcome in adapting to a new learning environment. Hence, more effort is needed to enhance student-student and lecturer-student interaction in online teaching. The active use of social media applications, chat rooms, breakout rooms during online sessions can facilitate this interaction, which would ultimately result in more student satisfaction with online learning. Taking learner needs into consideration in designing teaching activities may also alleviate any anxiety that they may have with the new learning experience: “For those who have never taken an online course or who have little computer experience, an online course may be frightening [
77]”. This can also be supported by any training that can be provided to students by the institution concerned to enhance their online learning skills. This can help them not only to explore the possibilities available to them in the online mode but also overcome at least some of the challenges they encounter in their online learning, in particular some technical challenges that may hinder their progress.


 ,
, 


