Heba M. Afify | Ashraf Darwish | Kamel K. Mohammed* | Aboul Ella Hassanien
© 2020 IIETA. This article is published by IIETA and is licensed under the CC BY 4.0 license (http://creativecommons.org/licenses/by/4.0/).
OPEN ACCESS
The detection of COVID-19 from computed tomography (CT) scans suffered from inaccuracies due to its difficulty in data acquisition and radiologist errors. Therefore, a fully automated computer-aided detection (CAD) system is proposed to detect coronavirus versus non-coronavirus images. In this paper, a total of 200 images for coronavirus and non-coronavirus are employed based on 90% for training images and 10% testing images. The proposed system comprised five stages for organizing the virus prevalence. In the first stage, the images are preprocessed by thresholding-based lung segmentation. Afterward, the feature extraction technique was performed on segmented images, while the genetic algorithm performed on sixty-four extracted features to adopt the superior features. In the final stage, the K-nearest neighbor (KNN) and decision tree are applied for COVID-19 classification. The findings of this paper confirmed that the KNN classifier with K=3 is accomplished for COVID-19 detection with high accuracy of 100% on CT images. However, the decision tree for COVID-19 classification is achieved 95% accuracy. This system is used to facilitate the radiologist’s role in the prediction of COVID-19 images. This system will prove to be valuable to the research community working on automation of COVID-19 images prediction.
COVID-19, CT scans, computer-aided detection (CAD), Genetic algorithm, K-Nearest Neighbor (KNN), decision tree
Coronavirus infection has rapidly spread worldwide since early 2020 and is considered a respiratory pandemic disease. According to the Coronavirus Resource Center, the United States is the most infected country, with 259,750 cases and 6,603 deaths [1]. There are some elements for controlling COVID-19 instances, such as data acquisition, medical history, age, personal hygiene, and individual gatherings [2]. Chronic disease owners and geriatric patients have a higher risk of being exposed to the COVID-19 pandemic.
The detection of COVID-19 suffered from a lack of tests that lead to difficulty monitoring this disease's spread [3]. The available test for this virus is the reverse transcription-polymerase chain reaction (RT-PCR), which takes a long time, and there is a lack of laboratory confirmation for this virus [4]. In radiology vision, the investigation of the patient's respiratory system using computed tomography (CT) is a rapid test for COVID-19 that shows ground-glass opacities (GGOs) in the lungs [5]. Additionally, CT follow-up during therapy can aid in determining the clinical treatment plan for COVID-19 [6]. Chest CT for SARS-CoV-2 is similar to chest CT for COVID-19 infection [7].
Although the number of death cases for SARS-CoV is higher than that of COVID-19, the disturbance caused by this new pandemic is increasing [8]. Xu et al. [9] proposed a deep learning model to classify CT images for COVID-19, influenza-A viral pneumonia, and healthy samples with an accuracy of 87.6%. Shan et al. [10] proposed a deep learning model to segment CT images for COVID-19 to determine the infected parts.
On the other hand, many machine learning algorithms have been developed for the classification of chest CT images based on statistical features [11]. The computer-aided detection (CAD) system was previously used for recognizing lung cancer images [12]. Therefore, radiologists need the CAD strategy to differentiate COVID-19 disease from other pneumonia diseases early. Another research work [13] presented a model based on CT images for COVID-19 diagnosis with sensitivity and specificity higher than 90%.
Generally, CAD algorithms play a central role in radiology to support radiologists in an accurate diagnosis [14]. The latest COVID-19 epidemic has spread rapidly worldwide. There are no or mild to moderate signs in most patients with COVID-19 [15]. For COVID-19 disease control, CAD algorithms are employed as an effective weapon to avoid the limitations of laboratory tests. Moreover, some small infected areas in COVID-19 images are not comprehended by radiologists. Thus, there are few recent studies on COVID-19 detection that used the CAD system on CT images as a classification tool because this epidemic is recently reported and it can be considered a very challenging task for radiologists [16]. Therefore, this research created a competitive area through the comprehensive analysis of different algorithms related to the classification of COVID-19 from non-COVID-19 patients to provide an accurate diagnosis [17].
Additionally, the details Relation Extraction neural network (DRE-Net) model-based lung CT is proposed for image classification between coronavirus and non-coronavirus with 94% accuracy [18]. The diagnosis system for COVID-19 and viral pneumonia case-based lung CT was developed by the Inception transfer-learning model [19] with 79.3% accuracy for the external testing database. The 3D deep convolutional neural network (CNN) is presented for COVID-19 detection without the need for determining the lesions for training [20].
The grey-level size zone matrix (GLSZM) feature extraction is implemented by a support vector machine (SVM) classifier on CT images for COVID-19 with 99.68% accuracy [21]. The U-Net architecture is developed by a residual network and attention model to provide segmentation of COVID-19 CT images [22] with 89% accuracy for data augmentation and 79% accuracy for non-augmentation.
In the literature, there are limited studies on the classification of COVID-19 CT images. Additionally, the accuracy level of classification is needed to improve by the CAD system, which supported COVID-19 images. To date, there are some limitations to COVID-19 images because of their irregularities and small numbers of training images.
In this paper, the proposed CAD system demonstrated its ability to classify between 100 cases of coronavirus and 100 cases for non-coronavirus with high accuracy for both training and testing databases. This system aimed to test the segmentation algorithm and machine learning algorithms applied to CT scans for COVID-19 diagnosis. The strength of this system is based on handling COVID-19 CT images by integrating segmentation algorithms, feature extraction, feature selection, and machine learning algorithms. The results of this system are reported for the first time and the comprehensive analysis of different algorithms is displayed. This system will be used as a promising start for a second opinion to improve the COVID-19 reading of radiologists at less effort and cost.
3.1 The proposed system
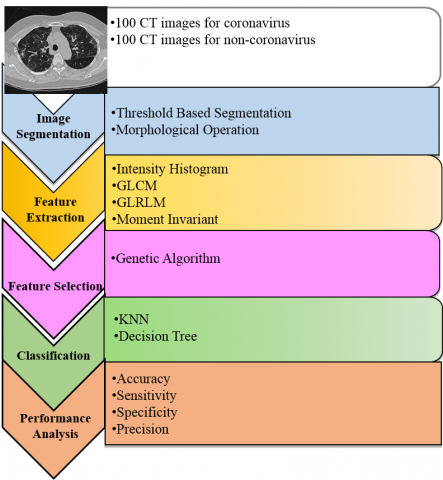
The block diagram of the CAD system for COVID-19 disease is depicted in Figure 1. Starting from the included CT images, a CAD system was combined with five phases, including segmentation, feature extraction, feature selection, classification, and performance analysis. In the composition step, segmentation is based on the image thresholding technique, while feature selection is based on a genetic algorithm to minimize the extracted features. Classification algorithms such as KNN and decision tree [23] are applied for detecting coronavirus versus non-coronavirus images. Finally, the performance analysis is obtained by levels of accuracy, precision, sensitivity, and specificity for two classifiers. The details of each block in Figure 1 are explained in the following sections 3.2-3.6.
Figure 1. A CAD system for screening coronavirus versus non-coronavirus on CT images
3.2 Data description phase
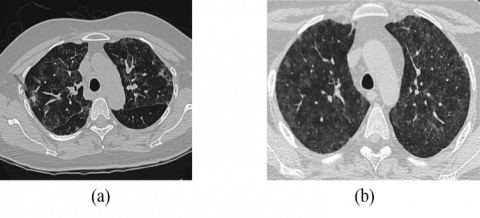
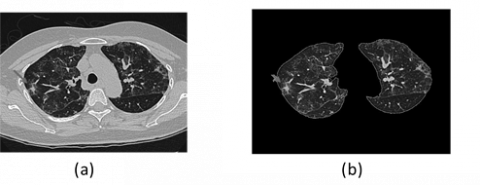
The database used chest CT for screening coronavirus versus non-coronavirus images, as shown in Figure 2. These data consist of 200 images, including 100 for coronavirus and 100 for non-coronavirus images collected from different patients [24]. The effect of training and testing data on medical images is based on the success rate of the CAD system [25]. Based on experts, when the training data is less than 50%, the test results will be failed to achieve a good classifier. The increased training data provided a guarantee for an accurate diagnosis. The training-testing ratio in the supervised learning algorithm is changed related to many trials based on parameters of performance evaluation. According to the data structure and uncorrelated features, this database was divided into 90% training data and 10% testing data for COVID-19 classification.
Figure 2. CT scans (a) for coronavirus and (b) for non-coronavirus images
3.3 Segmentation phase
The CT images of coronavirus and non-coronavirus were fed into the segmentation phase. After many attempts, the threshold level in the thresholding method [26] is changed to obtain good results. In this paper, the threshold value ranged from 50-230 is selected to reduce the search space for identifying the lung location. This segmentation is the major phase for the CAD system to focus on lung structures and remove surrounding tissues such as nodules and pulmonary vessels [27]. This lung segmentation is a commonly simple method based on density values and boundary analysis for separation of the lung region. The segmentation phase consists of three stages. The first stage is performed to remove the noise present in the CT image. The Wiener filter is adapted to remove Gaussian noise. Since the Wiener filter gives an estimate of the original uncorrupted image with minimum mean square error, the Wiener filter is used to remove the noise present in the lung CT image. The second stage is to find the threshold value for the histogram image by applying a multi-thresh function in MATLAB. Otsu segmentation [27] is a threshold-based segmentation method with an automatic adaptation of thresholds to the image histogram. In the simplest case of a two-class (e.g., foreground-background) segmentation, a single threshold is chosen such that the ratio $\sigma_{\text {inter}}^{2} / \sigma_{\text {within}}^{2}$ of the variance $\sigma_{\text {inter}}^{2}$ between classes and the variance $\sigma_{\text {within}}^{2}$ classes become maximal. The third stage is to isolate regions that are likely to contain lungs, and a morphological gradient (difference of dilation and erosion) is applied to the segmented lungs. A morphological gradient operation yields an image that contains segmentation of all areas around the borders of the lungs. The morphological gradient, which is defined as the difference between the dilated and eroded results of image A with structuring element B, is given by Eq. (1):
$\rho=(A \oplus B)-(A \ominus B)$ (1)
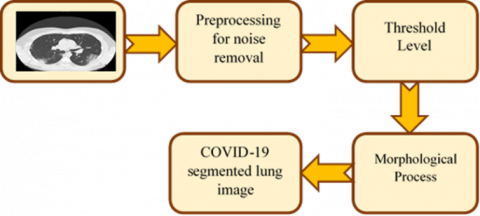
Figure 3. Flowchart of the thresholding technique for COVID-19 image segmentation
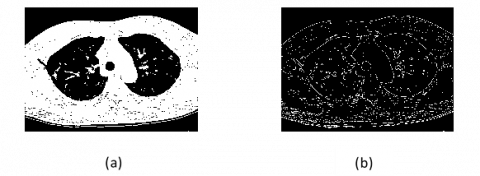
Figure 4. Thresholding technique on CT COVID-19 image (a) Threshold-based segmentation, (b) Morphological operation
For grayscale images, the basic morphological gradient results in an approximation of the absolute value of the gradient [28]. When the structuring element is relatively small, the homogeneous areas will not be affected much by dilation and erosion. In this case, the subtraction operation tends to eliminate these areas, and the result of the grayscale basic morphological gradient is an image with a “derivative like (gradient)” effect [29]. Figure 3 illustrates the steps of lung segmentation for preparing COVID-19 segmented images. Figure 4 illustrates the application of lung segmentation on CT images of COVID-19.
3.4 Feature extraction phase
The statistical texture features extracted from 200 segmented images are composed of four types: Intensity histogram, gray-level co-occurrence matrix (GLCM), gray-level run-length matrix (GLRLM), and moment invariant. All combined features created 200 x46 vectors.
3.4.1 Intensity histogram features
These features are based on the intensity level and number of pixels in the whole image. These features are divided into mean, energy, variance, entropy, skewness, and kurtosis [30]. The intensity histogram created a 1x6 feature vector for each image in the feature extraction phase.
3.4.2 GLCM features
GLCM is often used to acquire statistical features based on the relations of various angles among pixels of an image. The co-occurrence matrix is produced from an I image be represented as P=[p(i, j | d, Ɵ)]. The co-occurrence matrix is applied to estimate the i th pixel frequency features with the j th neighbor pixel frequency features by the Ɵ direction and d length. GLCM features [31] derived from the mean, standard deviations, angular secondary moment, contrast, correlation, the sum of squares, variance, inverse difference moment, sum average, sum variance, sum entropy, entropy, difference entropy, difference variance, information measures of correlation 1, information measures of correlation 2, dissimilarity, cluster shade, cluster prominence, homogeneity, maximum probability, and the inverse difference. The GLCM method created a 1x22 feature vector for each image in the feature extraction phase.
3.4.3 GLRLM features
GLRLM features [32] is represented 2D matrix by element (i, j) which a total number of consecutive runs of length j at grey level i. The number of grey levels is called M. In contrast, the maximum run length is called N. These features formed of short-run emphasis, long-run emphasis, grey-level nonuniformity, run-length nonuniformity, run percentage, Low grey-level run, high grey-level run emphasis, short-run low grey-level emphasis, short-run high gray-level emphasis, long-run low grey-level emphasis, and long-run high grey-level emphasis [33]. The GLCM features created a 1x11 vector for each image in the feature extraction phase.
3.4.4 Moment invariant features
The moment invariants are based on a description of an image in different locations, such as translation, changes in scale, and rotation, by Hu’s seven-moment invariants [34]. The moment invariant features created a 1x7 vector for each image in the feature extraction phase.
3.5 Feature selection phase
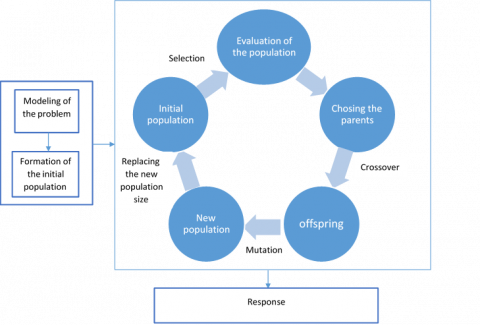
All feature extraction collected a total of 46 features. Due to undesired features, the genetic algorithm [35] is generated for selecting the optimal features to classify COVID-19 images. This algorithm is a simple tool based on some iterations and fitness functions to produce robust features [36], as shown in Figure 5. The selected features reach sixteen features, including two from intensity histogram features, eight from GLCM features, five from GLRLM features, and one from moment invariant features. The two intensity histogram features are the mean and kurtosis. In contrast, the eight GLCM features are information measures of correlation 1, information measures of correlation 2, cluster prominence, entropy, the sum of squares, sum variance, difference entropy, and inverse difference moment. The five GLRLM features are grey-level nonuniformity, run-length nonuniformity, run percentage, short-run low grey-level emphasis, and short-run high grey-level emphasis. In contrast, the one-moment invariant feature is six moments.
Figure 5. The genetic algorithm
3.6 Classification
In this paper, the selected features are applied to classification algorithms such as KNN [37] and decision tree [38]. The two classifiers are trained on the selected features based on binary classifiers by labeling zero as non-coronavirus and one as coronavirus images. The KNN classifier is decided by K values that represent the number of classes. The KNN classifier is based on relations with the closest surroundings. In this paper, we utilized K=3, 5, and 7 to choose the best classifier. On the other hand, the decision tree is divided into nodes and leaves, where each node refers to the feature and each leaf refers to the class. To evaluate two classifiers, we computed the percentage of accuracy, sensitivity, specificity, and precision for training and testing data set. The final optimal results were estimated on the test set.
Until now, the recorded database for COVID-19 images extracted from chest CT is comparatively few, which justifies restricted diagnostic research. The automatic classification of COVID-19 in CT images is presented as a severe detecting tool for a CAD system using MATLAB® software. The thresholding method is designed for providing the segmented images that are formed from 200 coronavirus and non-coronavirus images. Using the thresholding method, Figure 6 shows the segmented coronavirus images, while Figure 7 shows the segmented non-coronavirus images. In the feature extraction phase, the extracted features are done by four groups of statistical features to gain 46 collective features. These extracted features are reduced to sixteen features by the genetic algorithm to attain a final feature vector of 200x16. Then, classification is obtained through KNN and decision tree classifiers to distinguish COVID-19 from non-COVID-19 in the chest CT dataset.
Later, the evaluation of two classifiers is constructed by a confusion matrix through four metrics: accuracy, precision, sensitivity, and specificity [39]. The attained results confirmed that the KNN classifier is better than the decision tree classifier for training and testing databases, as shown in Table 1. The performance of the KNN classifier with K =3 showed 100% accuracy, precision, sensitivity, and specificity.
For the training database, the decision tree classifier showed 97.78% accuracy, 98.86% sensitivity, 96.74% specificity, and 96.67% precision. For the testing database, the decision tree classifier showed 95% accuracy, 90% sensitivity, 100% specificity, and 100% precision. Consequently, this CAD system effectively supported radiological image analysis for discovering two classes of coronavirus versus non-coronavirus images.
For comparative analysis, Ai et al. [4] reported the results of the COVID-19 classification with 97% sensitivity and 25% specificity. Recently, the deep learning architectures for COVID-19 classification reported 87.6% accuracy on CT images [9]. Additionally, a CNN [40] reported 96.78% accuracy on X-ray images for COVID-19 classification.
Furthermore, it means that the proposed system constituted a higher performance than in previous works for COVID-19 detection [4, 9, 21].
Figure 6. The segmentation phase for coronavirus images by thresholding method: (a) coronavirus images, (b) segmented coronavirus images
Figure 7. The segmentation phase for non-coronavirus images by thresholding method: (a) non-coronavirus images, (b) segmented non-coronavirus images
Table 1. The experimental results for the classification of COVID-19 versus non-COVID-19 on CT images
|
Classifiers |
Accuracy % |
Sensitivity% |
Specificity% |
Precision% |
|
KNN for training database |
100 |
100 |
100 |
100 |
|
KNN for testing database |
100 |
100 |
100 |
100 |
|
Decision Tree for training database |
97.78 |
98.86 |
96.74 |
96.67 |
|
Decision Tree for testing database |
95 |
90 |
100 |
100 |
The novelty and the contribution of this research are clarified to obtain the early detection of COVID-19 from CT images with the assistance of an automated CAD system. The arrangement of epidemic status needs the right reader of CT scans regarding COVID-19 via machine learning algorithms to minimize the virus prevalence, especially in low-income countries. Moreover, the usefulness of a CAD system is supported by the vision of CT images of COVID-19 and the image thresholding method. The satisfactory results were declared by the KNN classifier with high accuracy of 100% rather than a decision tree classifier for COVID-19 images. Lastly, this CAD system will be motivated by exploiting different classifiers and developing extracted features from CT images for multi-classification of COVID-19 and more viral pneumonia problems.
[1] Johns Hopkins Coronavirus Resource Center. (2020). https://coronavirus.jhu.edu/map.html.
[2] Yoon, S.H., Lee, K.H., Kim, J.Y., Lee, Y.K., Ko, H., Kim, K.H., Park, C.M., Kim, Y.H. (2020). Chest radiographic and CT findings of the 2019 novel coronavirus disease (COVID-19): Analysis of Nine Patients Treated in Korea. Korean Journal of Radiology, 21(4): 494-500. https://doi.org/10.3348/kjr.2020.0132
[3] Wang, W., Xu, Y., Gao, R., Lu, R., Han, K., Wu, G., Tan, W.J. (2020). Detection of SARS-CoV-2 in deferent types of clinical specimens. JAMA, 323(18): 1843-1844. https://doi.org/10.1001/jama.2020.3786
[4] Ai, T., Yang, Z.L., Hou, H.Y., Zhan, C.N., Chen, C., Lv W.Z., Tao, Q., Sun, Z.Y., Xia, L.M. (2020). Correlation of chest CT and RT-PCR testing in coronavirus disease 2019 (COVID-19) in China: A report of 1014 cases. Radiology, 296(2): E32-E40. https://doi.org/10.1148/radiol.2020200642
[5] Pan, F., Ye, T., Sun, P., Gui, S., Liang, B., Li, L.L., Zheng, D.D., Wang, J.Z., Hesketh, R.L., Yang, L., Zheng, C.S. (2020). Time course of lung changes on chest CT during recovery from 2019 novel coronavirus (COVID-19). Radiology, 295(3): 715-721. https://doi.org/10.1148/radiol.2020200370
[6] Zhao, W., Zhong, Z., Xie, X.Z., Yu, Q.Z., Liu, J. (2020). CT scans of patients with 2019 novel coronavirus (COVID-19) pneumonia. Theranostics, 10(10): 4606-4613. https://doi.org/10.7150/thno.45016
[7] Wang, C., Horby, P.W., Hayden, F.G., Gao, G. (2020). A novel coronavirus outbreak of global health concern. Lancet, 395(10223): 470-473. https://doi.org/10.1016/S0140-6736(20)30185-9
[8] Ooi, G.C., Khong, P.L., Muller, N.L., Yiu, W.C., Zhou, L.J., Ho, J.C.M., Lam, B., Nicolaou, S., Tsang, K.W.T. (2004). Severe acute respiratory syndrome: Temporal lung changes at thin-section CT in 30 patients. Radiology, 230(3): 836-844. https://doi.org/10.1148/radiol.2303030853
[9] Xu, X.W., Jiang, X.G., Ma, C.L., Du, P., Li, X.K., Lv, S.Z., Yu, L., Chen, Y.F., Su, J.W., Lang, G.J., Li, Y.T., Zhao, H., Xu, K.J., Ruan, L.X., Wu, W. (2020). Deep learning system to screen coronavirus disease 2019 pneumonia. arXiv preprint arXiv:200209334.
[10] Shan, F., Gao, Y.Z., Wang, J., Shi, W.Y., Shi, N.N., Han, M.F., Xue, Z., Shen, D.G., Shi, Y.X. (2020). Lung infection quantification of COVID-19 in CT images with deep learning. arXiv preprint arXiv:200304655. https://arxiv.org/abs/2003.04655v3.
[11] Dandil, E., Cakiroglu, M., Eksi, Z., Ozkan, M., Kurt, O.K., Canan, A. (2014). Artificial neural network-based classification system for lung nodules on computed tomography scans. In: 2014 6th International Conference of Soft Computing and Pattern Recognition (SoCPaR), Tunis, Tunisia, pp. 382-386. https://doi.org/10.1109/SOCPAR.2014.7008037
[12] Sun, W.Q., Zheng, B., Qian, W. (2016). Computer aided lung cancer diagnosis with deep learning algorithms. SPIE Medical Imaging, San Diego, California, United States. https://doi.org/10.1117/12.2216307
[13] Li, L., Qin, L.X., Xu, Z.G., Yin, Y.B., Wang, X., Kong, B., Bai, J.J., Lu, Y., Fang, Z.H., Song, Q., Cao, K.L., Liu, D.L., Wang, G.S., Xu, Q.Z., Fang, X.S., Zhang, S.Q., Xia, J., Xia, J. (2020). Artificial intelligence distinguishes COVID-19 from community acquired pneumonia on chest CT. Radiology, 296(2): E65-E71. https://doi.org/10.1148/radiol.2020200905
[14] Rasheed Ziyad, S., Radha, V., Vayyapuri, T. (2020). Overview of computer aided detection and computer aided diagnosis systems for lung nodule detection in computed tomography. Current Medical Imaging Reviews, 16(1): 16-26. https://doi.org/10.2174/1573405615666190206153321
[15] Toyoshima, Y., Nemoto, K., Matsumoto, S., Nakamura, Y., Kiyotani, K. (2020). SARS-CoV-2 genomic variations associated with mortality rate of COVID-19. Journal of Human Genetics, 65: 1075-1082. https://doi.org/10.1038/s10038-020-0808-9
[16] Ardakani, A.A., Rajendra Acharya, U., Habibollahi, S., Mohammadi, A. (2020). COVIDiag: A clinical CAD system to diagnose COVID-19 pneumonia based on CT findings. European Radiology. https://doi.org/10.1007/s00330-020-07087-y
[17] Harmon, S.A., Sanford, T.H., Xu, S., Turkbey, E.B., Roth, H., Xu, Z.Y., Dong, Y. (2020). Artificial intelligence for the detection of COVID-19 pneumonia on chest CT using multinational datasets. Nature Communications, 11(1): 4080. https://doi.org/10.1038/s41467-020-17971-2
[18] Song, Y., Zheng, S., Li, L., Zhang, X., Zhang, X., Huang, Z., Chong, Y. (2020). Deep learning enables accurate diagnosis of novel coronavirus (COVID-19) with CT images. medRxiv. https://doi.org/10.1101/2020.02.23.20026930
[19] Wang, S., Kang, B., Ma, J., Zeng, X., Xiao, M., Guo, J., Xu, B. (2020). A deep learning algorithm using CT images to screen for Corona Virus Disease (COVID-19). medRxiv. https://doi.org/10.1101/2020.02.14.20023028
[20] Zheng, C., Deng, X., Fu, Q., Zhou, Q., Feng, J., Ma, H., Wang, X.G. (2020). Deep learning-based detection for COVID-19 from chest CT using weak label. medRxiv. https://doi.org/10.1101/2020.03.12.20027185
[21] Barstugan, M., Ozkaya, U., Ozturk, S. (2020). Coronavirus (COVID-19) Classification using CT images by machine learning methods. arXiv preprint arXiv:2003.09424.
[22] Chen, X., Yao, L., Zhang, Y. (2020). Residual attention U-Net for automated multi-class segmentation of COVID-19 chest CT images. arXiv preprint arXiv:2004.05645.
[23] Tuceryan, M., Jain. A.K. (1998). Texture Analysis. In: The Handbook of Pattern Recognition and Computer Vision, 2nd ed., pp. 207-248. World Scientific Publishing Co., Singapore.
[24] Zhao, J., Zhang, Y., He, X., Xie, P. (2020). COVID-CT-dataset: A CT scan dataset about COVID-19. arXiv preprint arXiv:2003.13865.
[25] K¨ursad Uçar, M., Nour, M., Sindi, H., Polat, K. (2020). The effect of training and testing process on machine learning in biomedical datasets. Mathematical Problems in Engineering, 2020: 1-17. https://doi.org/10.1155/2020/2836236
[26] Hu, S., Hoffman, E.A., Reinhardt, J.M. (2001). Automatic lung segmentation for accurate quantitation of volumetric X-ray CT images. IEEE Transactions on Medical Imaging, 20(6): 490-498. https://doi.org/10.1109/42.929615
[27] Otsu, N. (1979). A threshold selection method from gray-level histograms. IEEE Transactions on Systems, Man, and Cybernetics, 9(1): 62-66. https://doi.org/10.1109/TSMC.1979.4310076
[28] Beyerer, J., Le' on, F.P., Frese, C. (2016). Machine Vision: Automated Visual Inspection: Theory, Practice and Applications. 1st ed. 2016 Edition, Springer.
[29] Gonzalez, R.C., Woods, R.E., Eddins, S.L. (2010). Digital Image Processing Using MATLAB. Second edition.
[30] Suematsu, N., Ishida, Y., Hayashi, A., Kanbara, T. (2002). Regionbased image retrieval using wavelet transform. In Proceedings of the 15th International Conference on Vision Interface, Calgary, Canada, pp. 9-16.
[31] Clausi, D.A. (2002). An analysis of co-occurrence texture statistics as a function of grey level quantization. Canadian Journal of Remote Sensing, 28(1): 45-62. https://doi.org/10.5589/m02-004
[32] Poonguzhali, S., Ravindran, G. (2008). Automatic classification of focal lesions in ultrasound liver images using combined texture features. Information Technology Journal, 7(1): 205-209. https://doi.org/10.3923/itj.2008.205.209
[33] Sohail, A.S.M., Bhattacharya, P., Mudur, S.P., Krishnamurthy, S. (2011). Local relative GLRLM-based texture feature extraction for classifying ultrasound medical images. 2011 24th Canadian Conference on Electrical and Computer Engineering (CCECE); IEEE, Niagara Falls, ON, Canada. https://doi.org/10.1109/CCECE.2011.6030630
[34] Hu, M. (1962). Visual pattern recognition by moment invariants. IRE Transactions on Information Theory, 8(2): 179-187. https://doi.org/10.1109/TIT.1962.1057692
[35] Yang, J., Honavar, V. (1998). Feature subset selection using a genetic algorithm. IEEE Intelligent Systems and Their Applications, 13(2): 44-49. https://doi.org/10.1109/5254.671091
[36] Goldberg, D.E. (1989). Genetic Algorithms in Search, Optimization and Machine Learning. 1st ed. Boston, MA, USA: Addison-Wesley Longman Publishing Co., Inc.
[37] Hassan, M.R., Hossain, M.M., Bailey, J., Ramamohanarao, K. (2008). Improving K-Nearest Neighbour Classification with Distance Functions Based on Receiver Operating Characteristics Machine Learning and Knowledge Discovery in Databases LNAI. Springer, Berlin Heidelberg, pp. 489-504.
[38] Patel, H., Prajapati, P. (2018). Study and analysis of decision tree based classification algorithms. International Journal of Computer Sciences and Engineering, 6(10): 74-78. https://doi.org/10.26438/ijcse/v6i10.7478
[39] Papadopoulos, N.A., Plissiti, E.M., Fotiadis, I.D. (2005). Medical-image processing and analysis for CAD systems. In: Costaridou L., editor. (2005). Medical Image Analysis Methods. Boca Raton, Fla, USA: Taylor & Francis, CRC Press, pp. 51-86.
[40] Apostolopoulos, I.D., Messianic, T.A. (2020). COVID‑19: Automatic detection from X‑ray images utilizing transfer learning with convolutional neural networks. Physical and Engineering Sciences in Medicine, 43: 635-640. https://doi.org/10.1007/s13246-020-00865-4