
Determinants of Learning Management Systems during COVID-19 Pandemic for Sustainable Education


1
Computer Information Systems Research and Technology Centre, Near East University, Nicosia 99138, Cyprus
2
Department of Computer Information Systems, Near East University, Mersin 10, Turkey
3
Department of Computer Science, Abubakar Tatari Ali Polytechnic, Bauchi 0094, Nigeria
4
Department of Information Systems, American University of Nigeria, 98 Lamido Zubairu Way, Yola 640231, Nigeria
*
Author to whom correspondence should be addressed.
Sustainability 2021, 13(9), 5189; https://doi.org/10.3390/su13095189
Submission received: 2 April 2021
/
Revised: 24 April 2021
/
Accepted: 27 April 2021
/
Published: 6 May 2021
(This article belongs to the Section Sustainable Education and Approaches)
Abstract
:Research has shown that effective and efficient learning management systems (LMS) were the main reasons for sustainable education in developed nations during COVID-19 pandemic. However, due to slow take-up of LMS many schools in developing countries, especially Africa were completely shut down due to COVID-19 pandemic. To fill this gap, 4 AI-based models; Support Vector Machine (SVM), Gaussian Process Regression (GPR), Artificial Neural Network (ANN), and Boosted Regression Tree (BRT) were developed for prediction of LMS determinants. Nonlinear sensitivity analysis was employed to select the key parameters of the LMS determinants data obtained from 1244 schools’ students. Five statistical indices were used to validate the models. The performance results of the four developed AI models discovered facilitating conditions, attitude towards LMS, perceived enjoyment, users’ satisfaction, perceived usefulness, and ease of use to be the most significant factors that affect educational sustainability in Nigeria during COVID-19. Further, single model’s performance results comparison proved that SVM has the highest prediction ability compared to GPR, ANN, and BRT due to its robustness in handling data uncertainties. The study results identified the factors responsible for total schools’ closure during COVID-19. Future studies should examine the application of other linear and other nonlinear AI techniques.
1. Introduction
Nowadays, emerging technologies have continued to change the face at which activities are being carried out in all aspect of human endeavours. For instance, the ways and manners in which colleges and universities now access and used various information and communication technologies (ICTs) resources in advanced and few developing nations have impacted positively on both teaching delivery and learning strategies [1,2,3]. In recent past, some colleges and other higher institutions of learning have succeeded in extending their modes of knowledge conveyance to include full online interactions between teacher and students to support the usual traditional methods of teaching and learning, i.e., face-to-face method as evidently showed in prior studies [4]. In recent years, the world has witnessed a tremendous increase on acceptance and usage of different Learning Management Systems (LMS) in tertiary institutions as colleges and universities in advanced and few developing nations have successfully deployed various online education platforms [5] that allow students to take their lectures online, collaborate with one another, and have access to learning materials using any device, anywhere, and anytime via the Internet [6,7]. These systems are usually integrated with other multimedia tools such as video, text, and audio [8], and communication tools, e.g., email, chat and discussions forums, and assessment tools [9]. Despite these benefits of LMS, hundreds of thousands of colleges and universities in most developing countries, especially in Africa were completely shut down due to COVID-19 pandemic. As of 25 May 2020, UNESCO stated that out of the total enrolled learners in 130 countries, there has been 990,324,537 affected learners across all level of learning which is (56.6%) of the world total enrolled learners due to school closures caused by COVID-19 pandemic [10]. However, tertiary institutions in countries such as US [11], UK [12], Germany [13], France [14], Cyprus [15], and Malaysia [16] have successfully migrated all their teaching and learning activities to an online environment using various LMS as the normal traditional method of face-to-face was disrupted due to schools’ closures caused by COVID-19.
The interruption of usual teaching and learning approaches (i.e., face-to-face methods) caused by COVID-19 pandemic have impacted negatively on sustainable development of the educational sector across the globe, especially in developing countries where schools were completely closed during the pandemic period. Thus, the needs for all educational institutions to adopt different eLearning technologies such as LMS as the only option for ensuring educational sustainability during pandemic periods [5]. Furthermore, the abrupt appearance of COVID-19 and other control measures imposed by governments all over the world, also posed serious challenges concerning LMS usage [5,7,15]. In addition to the usual LMS challenges, some of these unusual challenges has to do with the need to assess users’ attitude towards LMS, perceived enjoyment, satisfaction, and informed decision on users prepared LMS to be deployed for continued education.
Though, there is rapid increased on the adoption and usage of LMS across the Globe, the story is different in Nigeria [17], and other West African countries [18] as adoption and usage of various technology-based education systems in the region continued to fail. For instance, in Nigerian colleges and universities were completely closed for over six months due to COVID-19 pandemic. Just like several developing nations, the take up of LMS in Nigeria has been very slow as only few colleges and universities have incorporated LMS for academic purposes [19]. These and other problems led to system void and anomalies which in turn affect the sustainable development of educational activities in the country [20]. Furthermore, the limitation of prior studies that examined LMS success factors, failure and/or challenges in Nigerian and other developing nations, e.g., see [17,19,21,22], is the studies inability to used artificial intelligence-based (AI) techniques to investigate the determinants of LMS success for sustainable educational activities during COVID-19 pandemic.
The aim of this study is to investigate the factors that affects LMS success for sustainable education during COVID-19 pandemic in developing countries with special attention to Nigerian higher education, using four AI models, i.e., Support Vector Machine (SVM), Artificial Neural Network (ANN), Gaussian Process Regression (GPR), and Boosted Regression Tree (BRT) to obtained more accurate results. Literature have shown that different approaches may provide dissimilar results for a particular problem [23]. Thus, outputs from the study AI models (SVM, GRP, ANN, and BRT) may likely produce results with little error variance compared to other classical models used in eLearning domain [24]. Moreover, the study results will assist schools’ administrators, education authority, and other stakeholders in Nigeria particularly, and other developing nations in understanding the factors responsible for slow growth of LMS and deploy effective LMS for sustainable education during pandemic periods. Furthermore, the study ensemble model will serve as a motivation for researchers to embrace AI techniques for investigation purposes due to its reliability, flexibility, and accuracy in making prediction above other regression models [25,26].
2. Materials and Methods
2.1. Learning Management Systems (LMS) and Challenges
LMS comprises the use of web-based technologies for knowledge acquisitions and sharing [27]. It is also defined as a tool that provides e-learning podium that uses extranet, intranet, and internet networks to spread learning resources and support other administrative activities related to teaching and learning [28,29]. Additionally, LMS enable learners to establish their teaching rhythm and to acclimatize the learning process in order suit their personal needs. Furthermore, LMS aid instructors to send learning materials and follow students’ evaluation and allow learners to gain access to learning tools for their web-based education [30].
According to Dias [2] and Ghazal [31], expediency and suppleness are the two most valuable features of LMS. Though, LMS provides several opportunities and benefits to education stakeholders across the globe, there is need also to examine the issues and challenges associated with its deployment, acceptance, use, and management [32], in developing nations especially, in African nations where colleges and universities were completely shut down due to schools’ closures caused by COVID-19 pandemic [20]. Moreover, García [33] examined the factors affecting LMS implementation and use in Caribbean developing nations. The authors found individuals’ social norm, limited access to computers, and systems availability to be the major challenging factors that affect LMS implementation and use in Caribbean English-speaking nations. The authors argued that these factors significantly influenced perceived usefulness and perceived ease of use which in turn affects LMS acceptance and development. Similarly, El-Masri [34] found societal influence and effort anticipation to be the main factors affecting LMS progress in most developing nations but not in advanced nations. Furthermore, they authors argued that availability of resources that facilitate LMS usage such as internet speed and penetration, constant power supply, access to computers and systems availability were the main reasons for rapid growth of LMS in advanced nations.
Abugre [18] argued that infrastructural deficit, feebleness LMS policies, excess teaching loads, students’ congestion in academic facilities, and lack of access to computers and systems availability were the major factors responsible for slow adoption and continual usage of LMS in most African higher institutions. Thus, advocates the needs for clear LMS policies that can improve e-learning acceptance and usage in tertiary institutions. Similarly, Mtebe [35] claimed that course content and systems qualities have significance influence on students’ attitude towards LMS as well as on their intention to continual usage. Thus, the needs for tutors to develop a high-quality course contents that are in line with students’ knowledge, abilities, and skills to increase students’ satisfaction with the systems which in turn enhance LMS usage. Furthermore, Yakubu [17] stressed the importance of tutor quality and learning value on students’ acceptance and use of LMS. The authors found learning value and tutor quality to have positive and significant effects on behavioral intent to use LMS in Nigeria.
2.2. Artificial Intelligence (AI) Techniques
Factors that affect eLearning technologies (LMS) development in both developed and developing states are usually measured using empirical models such as covariance, least square, and partial least square structural equation modelling, to mention but few. However, predictions based on these approaches are time consuming, bias-based, and sometimes produce inaccurate and unreliable results [36,37]. Thus, the need to employs AI techniques such as SVM, GPR, ANN, and BRT in order to overcome the limitations of the conventional models [23]. These techniques provide opportunities for scholars in engineering, science, and social sciences to validate research models [38]. Moreover, Mohamadnejad [39] argued that AI techniques had proven to have greater performance in research. Similarly, Yang [40] emphasized the importance of AI techniques for complex nature research like peoples’ attitudes, behaviors, and emotions due to their robustness, flexibilities, and generalization abilities in terms of predictions. For this reason, in this study, four AI-based techniques, namely, SVM, GPR, ANN, and BRT were employed so that reliable and accurate prediction of LMS determinants in Nigeria can be obtained.
2.3. Technology Acceptance and Adoption Models in eLearning
In recent past, a large number of studies have been carried out, using different hypothetical models in order to have clear foresight on issues that affect users’ acceptance, use and continual usage of technology. These models include Davis [41] “Technology Acceptance Model” (TAM); Delone [42] revised model of “Information Systems Success” (D&M Model); Venkatesh [43] updated “Unified Theory of Acceptance and Use of Technology” (UTAUT2); Zhang [44] reviewed “Innovation Diffusion Theory (IDT) for IT adoption, Smith [45] revised “Theory of Planned Behaviour” (TPB); and Fishbein [46] updated “Theory of Reasoned Action (TRA). This research employs three of these models’ (i.e., D&M, UTAUT2, and TAM) constructs and recommendations from prior LMS studies to investigate factors that affect learning management systems (LMS) adoption and use in developing countries, especially in Nigerian where colleges and universities were completely shut down due to COVID-19 pandemic [20].
In the context of web-based learning, Davis [41] technology acceptance model (TAM) is among the popular models used by researchers to offer judgement on users’ perception, acceptance, and attitudes towards technologies. Several studies have used TAM to investigate user acceptance and use of LMS, e.g., see [17,47,48,49]. Venkatesh [43] revised UTAUT2 is another model commonly used to offer opinion on users’ acceptance and intention to use new technology. In relation to LMS, UTAUT2 has also been used extensively to examine the factors that affects LMS acceptance due to TAM limitations with regards to explaining people acceptance of technology. Three additional variables of habit, hedonic motivation, and price value were integrated into the UTAUT2 which makes it more user centered than TAM. However, the price value construct was later replaced with Learning value by Ain [50] to further explain individuals’ adoption of technology from LMS perspectives as monetary value could not be attributed to LMS usage [34]. Another model frequently used in eLearning domain is Delone [42] revised model of information systems success. Just like TAM and UTAUT2 models, D&M model has also been used by scholars to explain the importance and influence of systems reliability, usability, efficiency, functionality and maintainability on administrators’, students’, and tutors’ acceptance and use of various LMS [51].
2.4. Methodology
Research Model
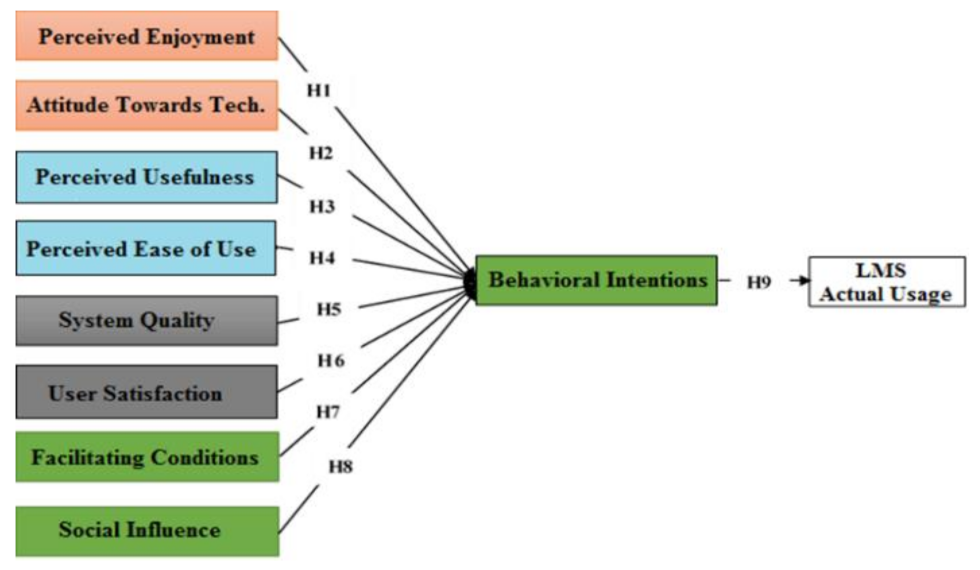
In contrast to other studies in LMS literature, D&M, TAM, and UTAUT2 models’ constructs were used in this study to improve the robustness and applicability of the study proposed model. The study conceptual model consists of eight independent variables (Perceived Enjoyment (PE), Attitude Towards Technology (ATT), Perceived Usefulness (PU), Perceived Ease of Use (PEOU), Systems Quality (SQ), User Satisfaction (US), Facilitating Conditions (FC), and Social Influence (SI), and one mediating variable of (Behavioral Intentions, BI), while LMS actual usage represent the dependent variable as shown in Figure 1.
2.5. Hypotheses Formulation
2.5.1. Perceived Enjoyment
Perceived enjoyment (PE) as for this study, is to examine the effects of enjoyable aspects of eLearning technologies actual usage. In the context of LMS, Moorthy [52] defined perceived enjoyment as the degree to which users perceived different LMS to be enjoyable. It is considered as one of the strongest factors that influence behavioral intent to accept and use new technology [27,47]. Furthermore, Wasko [53] argued that perceived enjoyment has a positive relationship with knowledge acquisition in digital setting. Incorporation of perceived enjoyment construct into the research AI model, makes the present study more important, and to the best of our knowledge none of the prior LMS studies in Nigerian and other developing countries investigate this factor using AI techniques, as well as D&M, TAM, and UTAUT2 models did not cite it. Thus, hypothesize that
Hypothesis 1 (H1).
Perceived enjoyment will have a positive and significant influence on behavioral intent to use LMS in Nigerian context during COVID-19 pandemic.
2.5.2. Attitude towards Technology
Magen-Nagar [54] in their study examined the impact of online learning technologies in Israel. The authors found fear of using technological gadgets, lack of technological self-possession, and negative attitudes towards eLearning and other collaborative learning tools to be the main reasons for Israeli colleges students’ and tutors’ phobia for online courses. This factor, attitude towards technology (ATT), was added to the study model as per Yakubu [17] and Jacob [20]. The authors argued that deployment and use of LMS in Nigeria, just like other developing nations have continued to fail, thus the need for future LMS studies to investigate students’ attitude towards LMS acceptance and use. Thus, hypothesized:
Hypothesis 2 (H2).
Attitude towards technology will have a positive and significant influence on behavioral intent to use LMS in Nigerian context during COVID-19 pandemic.
2.5.3. Perceived Usefulness
This construct, perceived usefulness (PU), is sourced from TAM, and is similar to UTAUT construct of performance expectancy (PE). Davis [41] defined perceived usefulness as the degree to which persons believe that deploying a specific technology would increase their job performance. Similarly, Baki [55] stressed that the higher the degree of students’ belief in LMS, the better the learning performance and grades. Furthermore, prior LMS studies argued that PU may likely have positive and significant influence on users’ behavioral intent to accept and use LMS [50]. Learners will be willing to adopt and use a particular eLearning technology if they believe that the technology will assist them in achieving their educational goals. Based on prior literatures, we assume that PU will have a significant influence on learners’ behavioral intent to accept and use different LMS in Nigeria. Thus, we pose the following hypothesis:
Hypothesis 3 (H3).
Perceived usefulness will have a positive and significant influence on behavioral intention to use LMS in Nigerian context during COVID-19 pandemic.
2.5.4. Perceived Ease of Use
Just like PU, perceived ease of use (PEOU) is also sourced from TAM. In the context of web-based learning technologies, a lot of effort has been devoted towards the creation of an interface that is user-friendly, in acknowledging the importance of perceived ease of use construct [56]. PEOU is defined as the extent to which an individual believes that utilization of a particular web-based technology such as LMS would be free of mental and/or physical effort. Joo [57] argued that PEOU has significant influence on students’ behavioral intention to use LMS. Thus, LMS should be designed in an intuitive manner, and the systems should not require technical expertise before usage. Thus, hypothesized that
Hypothesis 4 (H4).
Perceived ease of use will have a positive and significant influence on behavioral intent to use LMS in Nigerian context during COVID-19 pandemic.
2.5.5. System Quality
System quality (SQ), as for this study, is to inspect the effect of system quality on LMS acceptance and use and was derived from D&M model of IS success. Ramírez-Correa [58] described the concept as the performance of a particular software (in this case, LMS) in terms of convenience, functionality, reliability, ease of use, and other software metrics. Similarly, it has been argued that enhancements in system quality would increase system usage as well as satisfaction with the system [42,59]. According to study by Syed [60] conducted in Saudi Arabia, system quality has positive relationship with behavioral intent to use LMS. Thus, the study proposes the following proposition:
Hypothesis 5 (H5).
Systems quality will have a positive and significant influence on behavioral intent to use LMS in Nigerian context during COVID-19 pandemic.
2.5.6. User Satisfaction
Yuen [61] in their study defined user satisfaction (US) as the extent to which students believe that the available information systems (IS) meet their educational and other information requirements. A lot of scholars believe that the higher the satisfaction level derived from a particular IS, the higher the usage of such system [62]. Conversely, not meeting users’ information requirements by the system will lead to dissatisfaction amongst users [63]. In the context of LMS, prior studies [33,35,50] have shown that many students, especially higher education students from developing nations are not satisfied with the online classroom due to lack of technical skills, unfamiliarity with the environment, and personality type. Thus, affecting students’ behavioral intent to use LMS. Therefore, the study hypothesized the following:
Hypothesis 6 (H6).
User satisfaction will have a positive and significant influence on behavioral intent to use LMS in Nigerian context during COVID-19 pandemic.
2.5.7. Facilitating Conditions
In the context of technology adoption and use, Venkatesh [64] defined facilitating conditions (FC) as the degree to which people perceive the availability of technological and other organizational resources needed to use a specific technology. In the context of eLearning, Tarhini [65] argued that resources such as internet, access to computers and other devices, and electricity supply significantly influenced students’ intention to use LMS. The authors discovered that lack of access to computers and other movable devices, low internet diffusion and speeds, and lack of technical support negatively effects students’ intention to use LMS in Africa. Similarly, Al Amoush [66] and Yakubu [17] stressed that students will be less interested to use LMS if these resources are not available. Thus, propose:
Hypothesis 7 (H7).
Resource facilitating conditions will have a positive and significant influence on behavioral intent to use LMS in Nigerian context during COVID-19 pandemic.
2.5.8. Social Influence
El-Masri [34] and Tarhini [67] in their studies defined social influence (SI) as the effects of social pressure on individuals’ behavior and perception towards engaging in a particular action. According to Venkatesh [64], SI refers to the degree to which a person perceives the opinion of others who believe that he/she should make use of the new system. The factor is derived from UTAUT and is similar to “social norm” factor in Theory of Planned Behavior (TPB), Theory of Reasoned Action (TRA), and updated Technology Acceptance Model (TAM2). SI as for this study, is to examine the effect of pressures coming from other people such as students from other institutions, senior lecturers, and schools’ administrators on learners’ intent to accept and use different LMS. Thus, we hypothesized:
Hypothesis 8 (H8).
Social influence will have a positive and significant influence on behavioral intent to use LMS in Nigerian context during COVID-19 pandemic.
2.5.9. Behavioral Intentions and Actual Usage
Behavioral intention (BI) is defined as the gradation of persons intent to use a particular technology for various undertakings. In the context of eLearning, Sánchez-Prieto [68] defined BI as the measure of students’ intention strength to use different LMS in achieving their educational goals. The authors argued that once students’ intention to use a system is shaped, then it would be converted into the real usage of the system. Therefore, the researchers propose that:
Hypothesis 9 (H9).
Behavioral intention will have a positive and significant influence on LMS actual usage in Nigeria during COVID-19 pandemic.
2.6. Participants
The study participants were drawn from four private and two public universities. Three universities each from Northern and Southern parts of Nigeria using convenience sampling techniques as per Chambo [69]. According to study by Yakubu [17], the six universities were the only schools that attempted to incorporate LMS into their teaching and learning activities without being successful. Thus, the needs to obtained first-hand information from these schools with regards to factors that affects LMS progress in Nigeria. The study participants comprise of 808 male (65.0%) and 436 females (35.0%). The different between the two gender groups may not be unconnected with the high ratio of male students in Nigerian tertiary institutions. As shown in Table 1, participants above the age of 25 account for 59.3% of the study sample, while those within the age of 18–25 account for 40.7% of the total participants. With regards to participants education level, 54.6% of the respondents were undergraduate students, while the postgraduate students account for 45.4% of the participants. Similarly, 74.8% of the participants stated that, they have used LMS for a period of less than one year, while only 25.2% of the participants used it for over a year, signifying the low level of LMS usage in Nigerian higher institutions.
2.7. Data Collection Tools
The study questionnaire consists of three parts. The first part 1, contained the study consent form, which introduces the study to the participants, highlights the purpose of the research, and what is required from the participants concerning the survey. It also states the benefits and risks associated with partaking in the research, and that participation is voluntary. While the second part of the questionnaire contained respondents’ demographic information such as age, gender, length of LMS usage, and education level (i.e., postgraduate or undergraduate) as seen in Table 1. The third part of the questionnaire consists of ten (10) constructs from three different models such as D&M, TAM, and UTAUT2. To bridge gap from LMS perspectives, this present study integrated “Perceived Enjoyment” and “Attitude towards technology” constructs into the study model.
The first two constructs were integrated into the study model as recommended by Yakubu [17] and Moorthy [52] that future LMS studies should investigate people’s attitude towards new technology and perceived enjoyment in order to determine their effects on LMS growth for sustainable education. Perceived usefulness and ease of use were gotten from Davis [41] technology acceptance model (TAM). While System Quality and User Satisfaction constructs were sourced from Delone [42] revised model of information system success, and the last three constructs of Social Influence, Facilitating Conditions, and Behavioral Intentions were sourced from UTAUT2 model by Venkatesh [43]. Five-point Likert scale ranging from strongly agree (1) to strongly disagree (5) in order to evaluate the respondents’ perceptions of the constructs used in the study hypothetical model see (Appendix A). Uniformity amongst the study constructs’ dimensions was calculated using Cronbach Alpha (CA) to ascertain the consistencies level of all the theories to be used in the study proposed AI based models. As showed in Table 2, the internal consistencies levels for all the constructs were above 0.70, this showed that accepted level of uniformity were achieved.
2.8. Procedure and Data Collection
Two methods of data collection (i.e., electronic and paper-based) were used in administering the study questionnaire. For private universities participants, an online survey tool (Google Form) was designed, and the link send to the participants via their university students mailing list and other social networking platforms (e.g., WhatsApp, and Facebook) utilize by the institutions. While the paper-based approach was used for public universities participants due to absence of students mailing systems and functional students’ portal. The study paper-based questionnaire was distributed by some selected administrative personnel of these universities who are conversant with administering surveys questionnaires and were informed about the study purpose to ensure that the participants read and keep a duplicate of the study consent form. The completed questionnaires were collected via a pool styled box to ensure respondents anonymity. However, the respondents have the right not to participate in the survey as participation is voluntary.
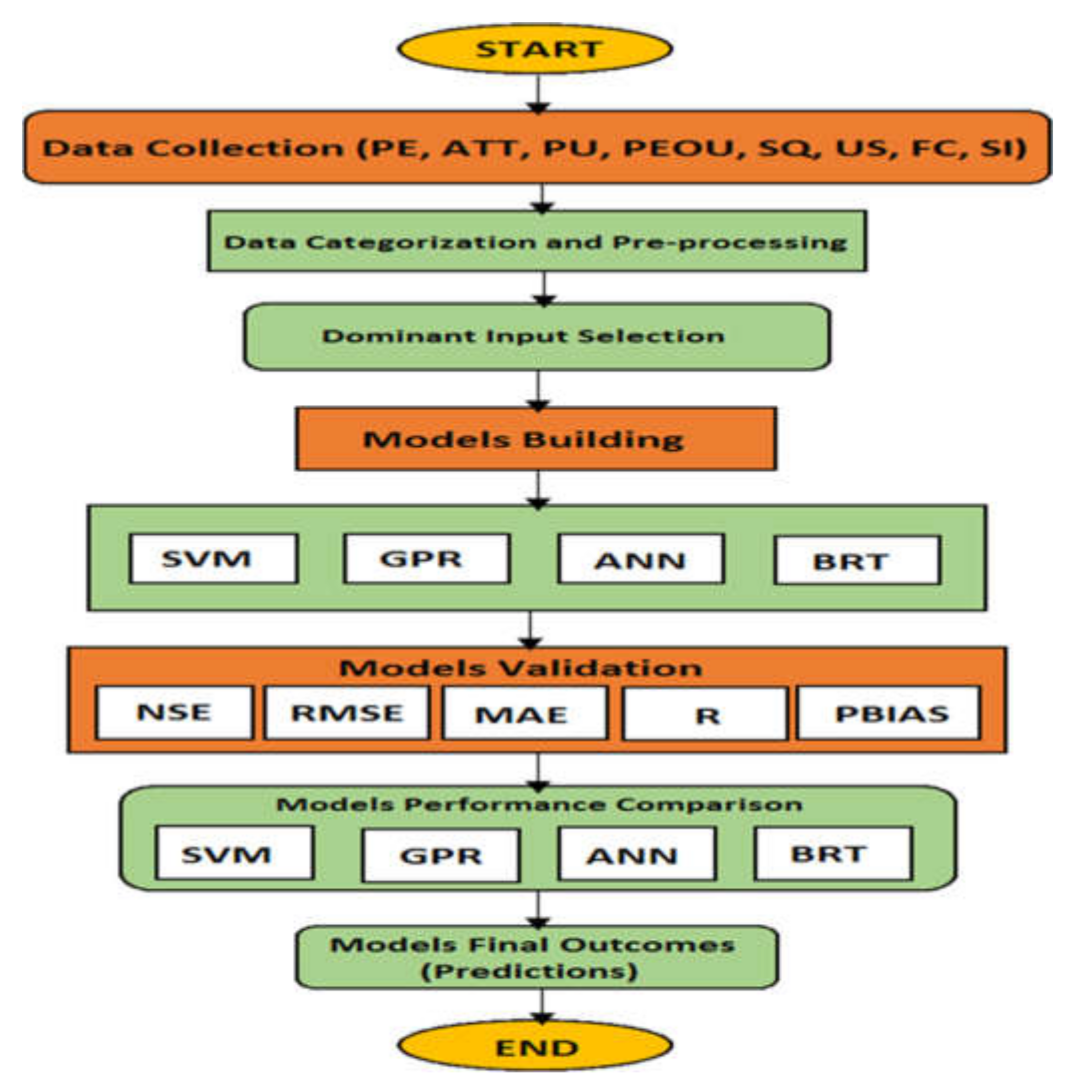
A total of 560 paper-based questionnaires were distributed in the two public universities, and 512 (91.4%) valid responses were obtained, which is an excellent returned rate [50]. Just like the paper-based, the study online survey tool produces 769 (96.1%) usable responses out of the total 800 survey links with feedback form sent to four private universities’ participants. Moreover, the online method (i.e., Google Form) was configured in such a way that participants’ details such as IP address, emails, and ID were not part of the responses captured. In total, the two methods produced a total of 1244 valid responses, the study was carried out during the pandemic period of COVID-19 (i.e., from February–December 2020). The methodological structure of the study is presented in Figure 2.
As seen in Figure 2, the structure consists of three key stages. In the first stage, data for the study were collected, categorized, pre-processed, and dominant inputs were selected. While the four nonlinear AI-based (SVM, GPR, ANN, and BRT) models were developed in the second stage. Validation activities took place in the third stage using five indices of Nash–Sutcliffe efficiency (NSE), Root mean square error (RMSE) Mean absolute error (MAE), correlation coefficient I, and Percentage bias (PBIAS). Moreover, performance of each of the developed models were compared, and the final outcomes (predictions) obtained in same stage.
2.9. Data Analysis Methods
Data collected for the study were processed and analyzed using MATLAB 2019b and SPSS version 20 software. Cronbach’s alpha (CA) was used for assessing the uniformities of the study constructs. Respondents’ demographics information such as gender, age, education level, and period of LMS usage were analyzed using descriptive analysis method. Furthermore, an AI-based technique (sensitivity analysis) was used to select the most dominants factors amongst the study variables. Finally, four AI-based models namely SVM, GPR, ANN, and BRT were employed to obtain a reliable and accurate prediction of LMS determinants in the proposed research model.
2.9.1. Ensemble Techniques
Collaborative approach, or in other words ensemble techniques is a machine learning method used by researchers to combine two or more predictions results obtained from different models to improve the performance of the separate models so that accurate and reliable results can be obtained [70]. According to Nourani [23], there are two major types of ensemble techniques: (1) nonlinear ensemble technique, e.g., ANFIS, ANN, SVM, GPR, and regression trees; and (2) linear ensemble technique. Nowadays, use of ensemble techniques in engineering and science-based disciplines has proven to be effective and provide better outcomes than the use of single modelling [71]. In this study, four nonlinear (SVM, GPR, ANN, and BRT) ensemble methods were used to enhance the performance of the four AI-based developed models for predictions of LMS determinants. The structural algorithms of the ensemble methods used were presented below.
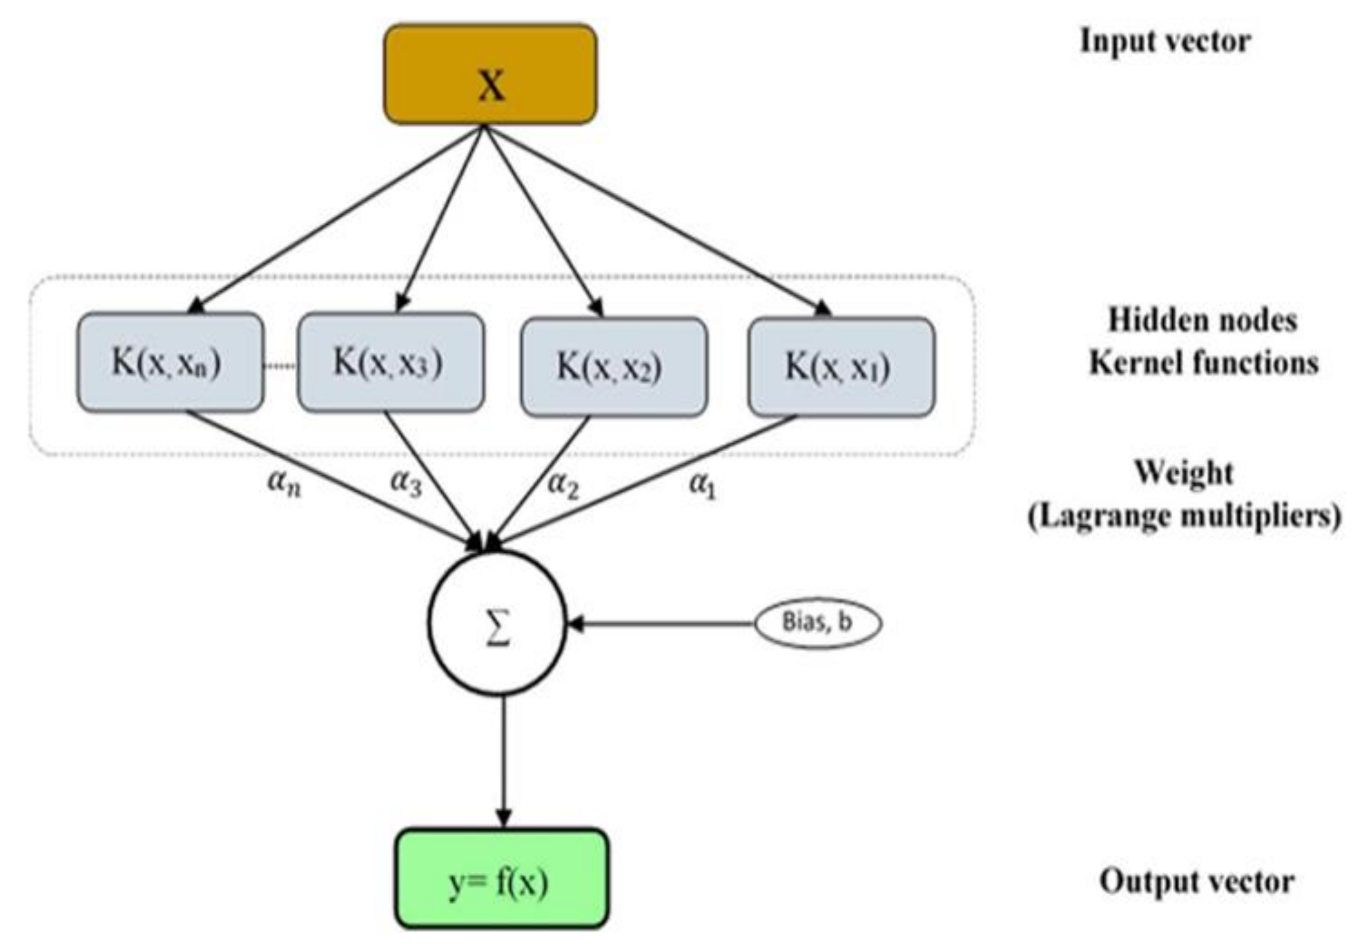
The SVM flow diagram (Figure 3) consists of four (4) stages. The input vector contained the study input parameters, represented as X, the hidden nodes kernel functions, the weight Lagrange multipliers that adjust the network synopsis weight and determine the percentage of Bias, and the output vector (y) that determine the correlation coefficient between the variables under investigation. Flow diagram of the study GPR structure is presented in Figure 4, below.
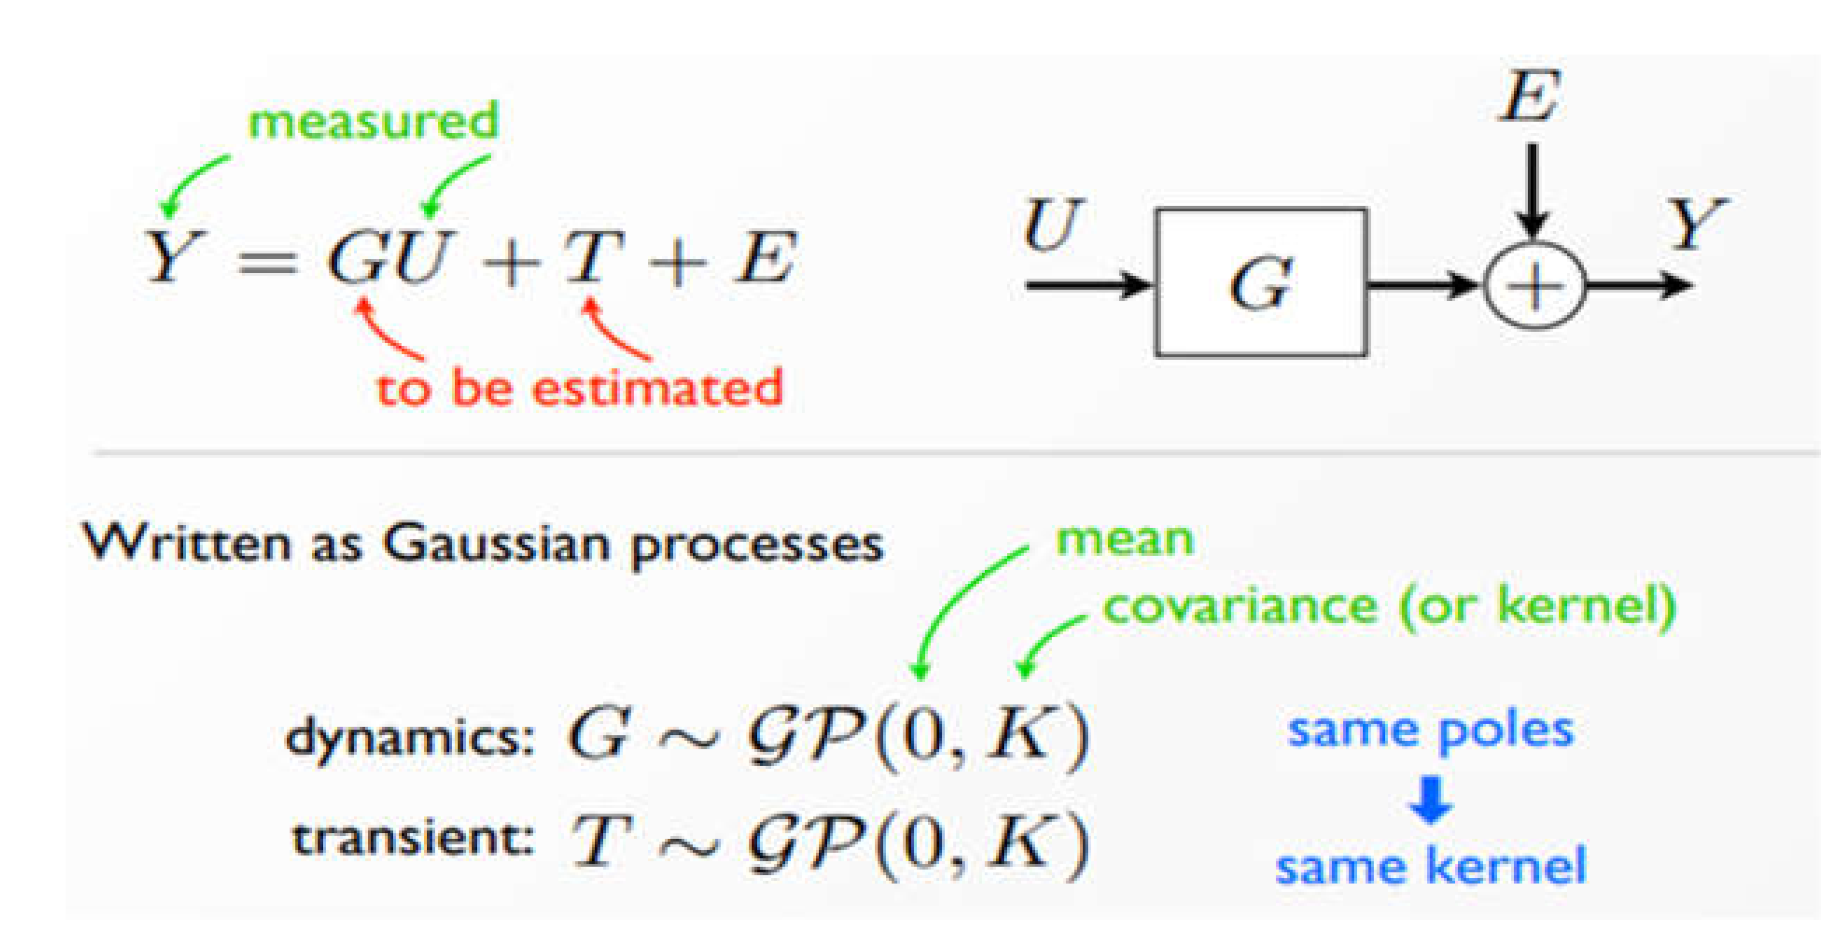
As shown in Figure 4, Y represent the measured values of the targeted output, U represent U represent the gaussian units (GU), while 0 and K represent the mean and covariance, respectively. The study ANN algorithm is presented in Figure 5.
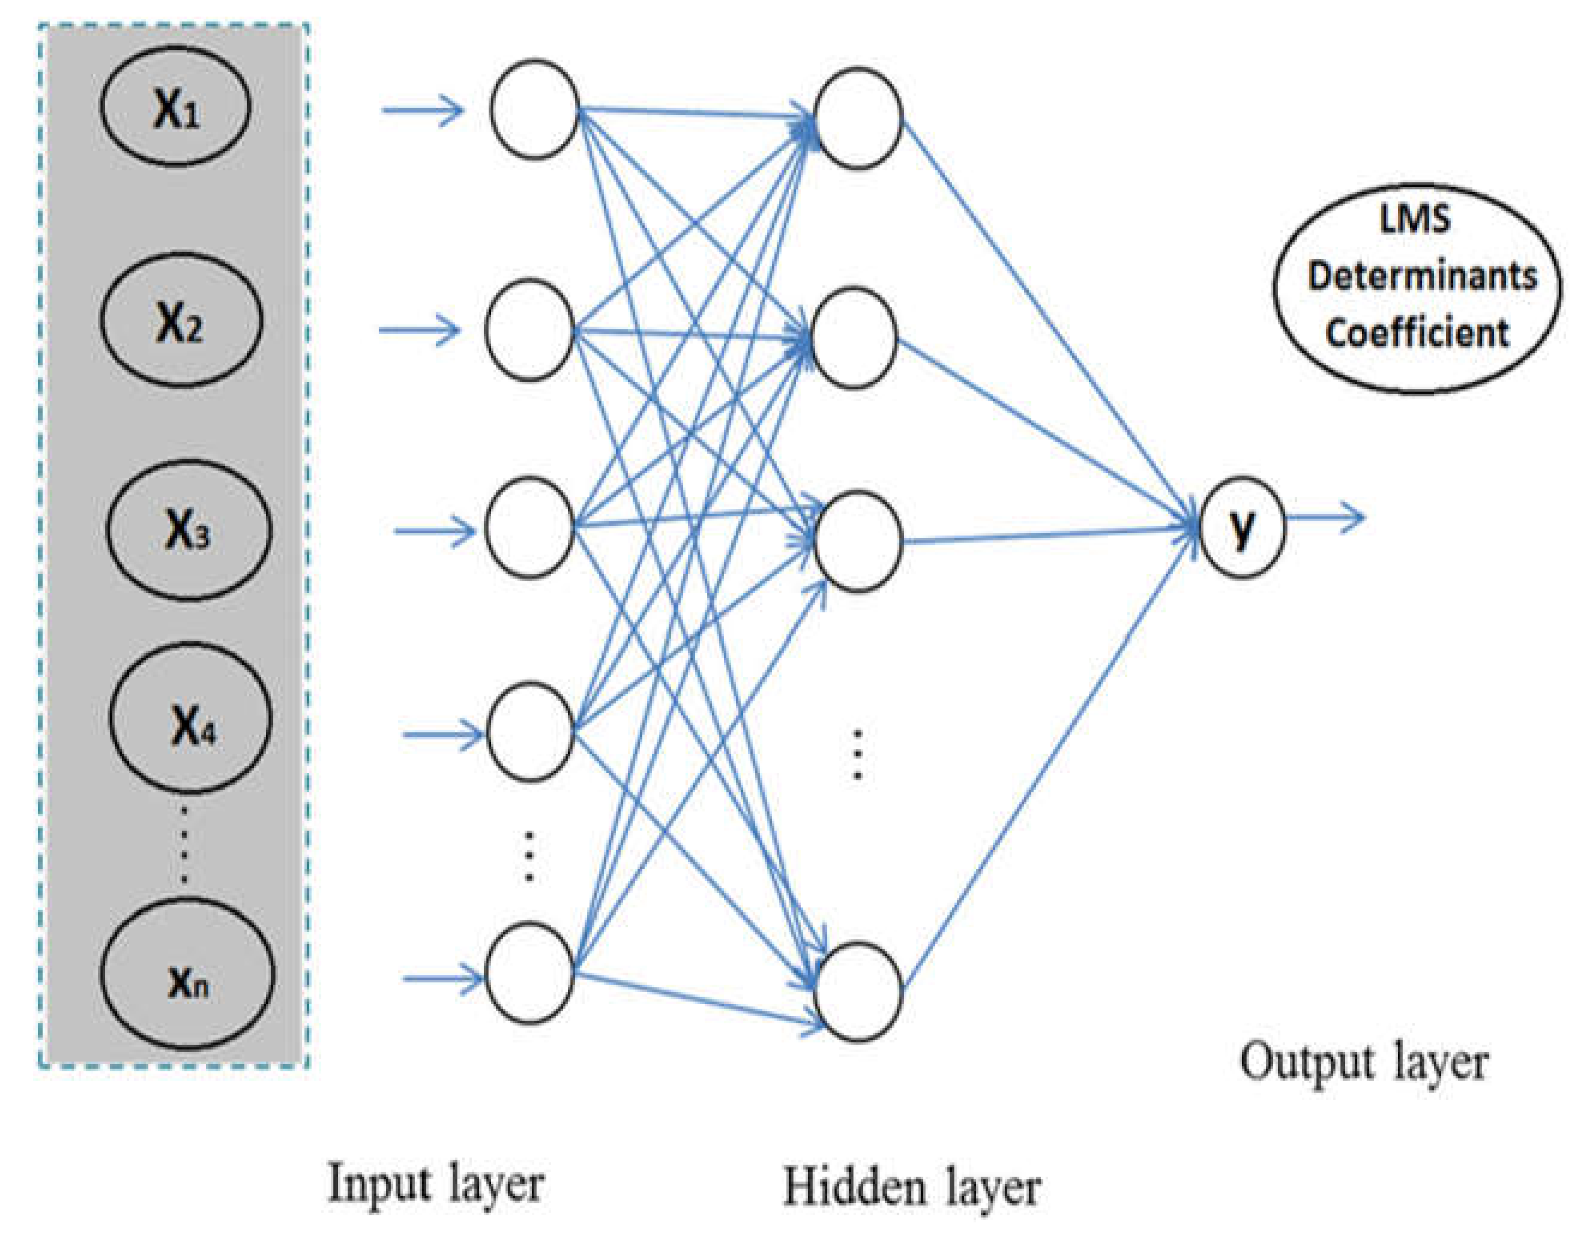
As shown in Figure 5, the study ANN algorithm consists of three (3) layers. The inputs layer representing the study independent parameters, the hidden layers that nasalize the association between the target and input variables, and the output class represent the study target, i.e., (forecast variable). The structure of the study BRT model is presented in Figure 6, below.
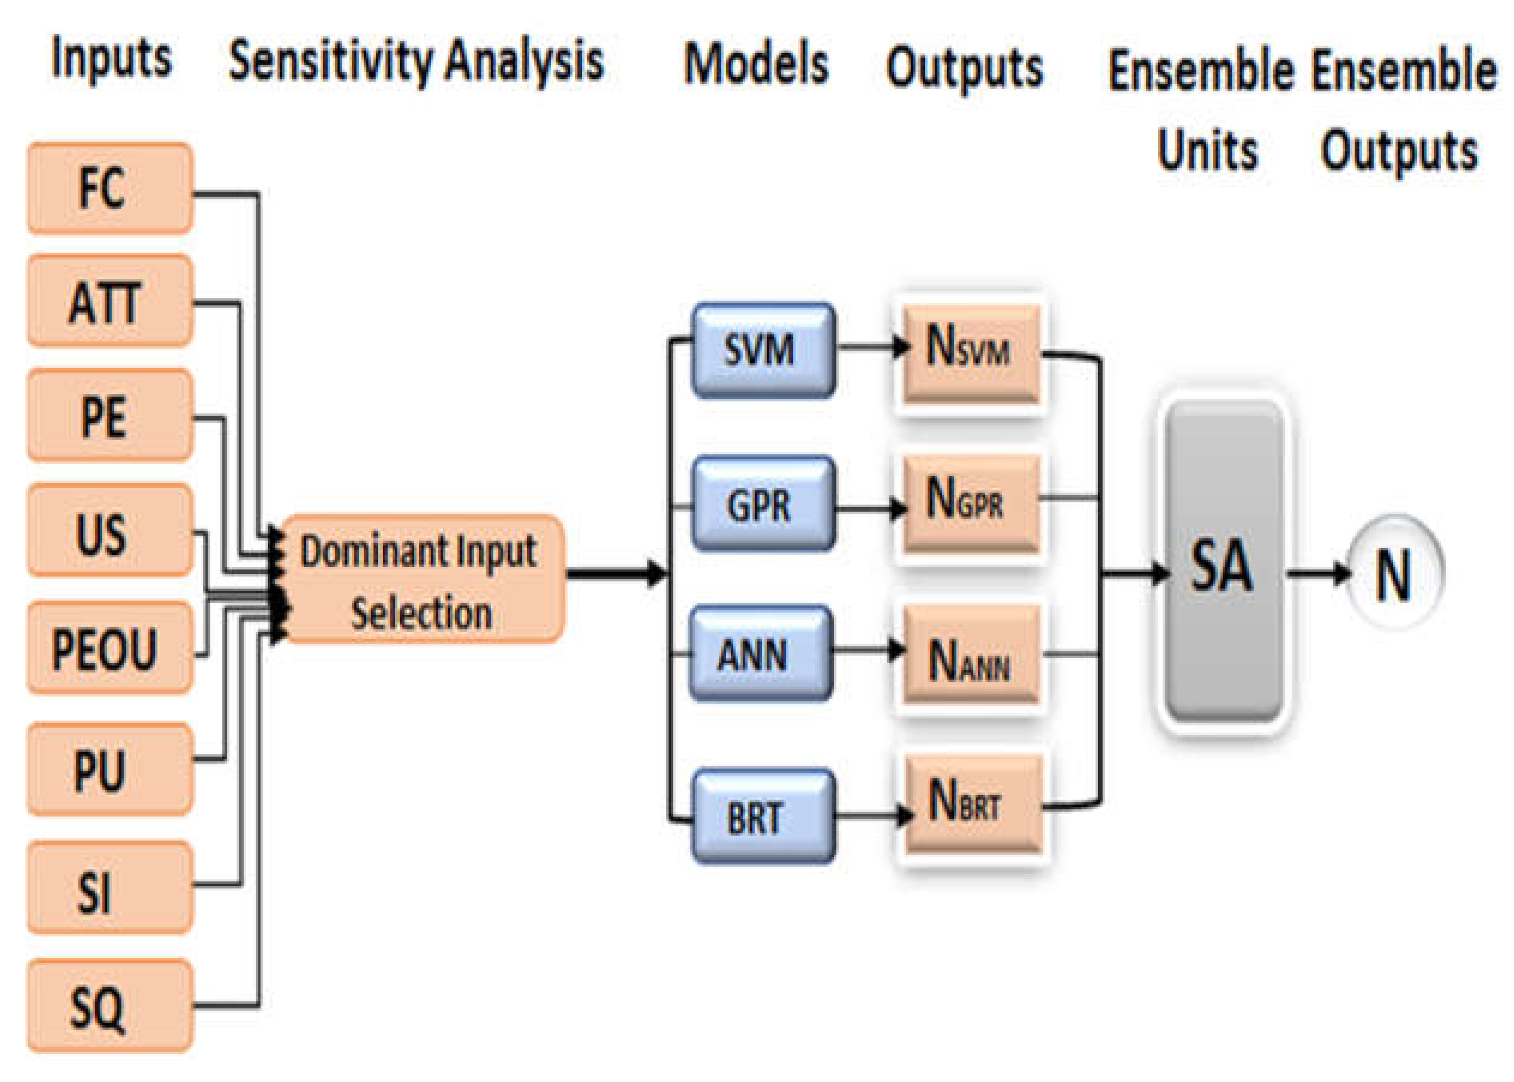
As seen in Figure 6, the structure of the study BRT model consists of three ladders. Normalized input data were fed into model so that the targeted output can be estimated from the input variables. The process continues by adjusting the network input weights until the best result (prediction) is obtained. The general structural procedure of the developed ensemble methods is presented in Figure 7.
As seen in Figure 7, the structure of the study ensemble methods comprised of six phases, namely, inputs, sensitivity examination, models outputs, ensemble units, and ensemble outputs phases.
2.9.2. Sensitivity Analysis
According to Pham [72], the efficacy of all AI-based models relies on the number of input parameters imposed on the model. Use of too much input parameters will increase the complexity of the models and can lead to model overfitting. while insufficient parameters on the other hand can lead to inaccurate model processing. Thus, neither too much nor insufficient parameters were required for each of the study AI-based nonlinear models. As seen in Figure 7 and Figure 8 input parameters were used to obtain a reliable and accurate predictions of LMS determinants in developing countries for sustainable education especially Nigeria during COVID-19 pandemic. To obtain the most relevant and dominant factors that affects LMS acceptance and continual usage in Nigeria during COVID-19 pandemic, a nonlinear Feed-forward neural network (FFNN) sensitivity analysis was used in this study instead of using the usual classical linear techniques, e.g., Pearson correlation, a linear correlation coefficient measure used in selecting key factors of LMS usage in higher education, e.g., see [73]. Use of linear measure techniques like that of Pearson correlation has been criticized by some studies, e.g., see [74]. The eight LMS determinant predictors were ranked and evaluated based on average coefficient of determination (DC) of the separate modelling using training and testing ladders of the FFNN modelling process. The closer DC value to 1, the higher the effect of such factor, and the higher the performance of the AI model vice versa [23].
2.9.3. Data Normalization for the Study Models
Study data in AI modelling and simulation are usually normalized before inputted to the AI models. Normalization is used to avoid data with higher numeric values overshadowing those in lower numeric range by bringing the study dependent and independent variables into the same range [71]. Furthermore, data normalization simplified numerical computations in AI modelling process which in turn reduced results processing time and upsurges models accuracy. Thus, the study data were normalized as per Nourani [23], ranging between 0 and 1 using Equation (1).
where N is the number of constructs used in the study, and Nnorm represent the study constructs normalized values, while Nmax and Nmin in the formular represent the observed maximum and minimum values of the study constructs influence on LMS usage.
3. Results
The results of the study parameters effects on LMS acceptance and use, sensitivity analysis, testing and training, and models’ predictions of LMS determinants in Nigeria during COVID-19 were presented in the following subsections.
3.1. Data Pre-Processing and Performance Evaluation
Data for the study were first pre-processed and the performance of each of the dominant parameters was evaluated using sensitivity analysis, i.e., average coefficient of determination (DC).
Sensitivity Analysis Results
LMS predictors ranking results based on sensitivity examination is presented in Table 3, using Equation (2).
where n stands for the number of observations, Ns is the mean value of the observed LMS determinants, Nobs is the observed effects of LMS determinants, while Npre is the predicted effects of LMS determinants. Though, some of the dominant predictors have low DC values (e.g., SI and SQ) compared to other dominant factors. All the eight parameters were used as inclusion of these parameters with lower DC values does not affects the performance of the AI-based models. Table 3, depicts the study sensitivity analysis results.
Having selected the most dominant inputs parameters (i.e., facilitating conditions, attitude towards technology, perceived enjoyment, user satisfaction, perceived ease of use, and perceived usefulness), four nonlinear AI-based models (SVM, GPR, ANN, and BRT) were developed to obtain predictions with regards to factors responsible for slow take-up of LMS in developing nations, especially in Nigeria during COVID-19 pandemic. Though, Cronbach Alpha (CA) was calculated to ascertain the uniformity level of the study constructs. However, the sensitivity analysis results were used in selecting the most dominants factors as the approach offers more accurate and reliable results than the CA method.
3.2. Single Modelling Results
The performance results of the four developed AI-based models were measured using five statistical indices, namely, NSE, RMSE, MAE, R, and PBIAS as shown in Table 2.
As seen in Table 4, GPR model has the highest performance values in terms of training and testing. The model has an NSE values of 0.9999 and 1.0000, signifying the predictive power of the model. The RMSE values of 0.0000 and MAE 0.0000 clearly showed that the model has an accurate prediction value. Similarly, R values of 1.0000 also indicated a strong correlation between the independent variables and the dependent variable. Furthermore, optimal PBIAS values was achieved in the GPR model as the values stood at 0.0000 in both training and testing. Just like the GPR model, the ANN model also has a good training and testing performance results. The model has an NSE values of 0.9999, RMSE values of 0.0010 and 0.0017 in training and testing respectively, indicating how well the observed and simulated data fits in the plot line. The MAE values for the ANN model stood at 0.0000 which is the highest accuracy level in terms of model prediction, while the R values of 1.0000 and 0.9999 indicate a strong relationship between LMS usage and the study input parameters. Additionally, the PBIAS values of 0.0012 and 0.0010 obtained in ANN model signifies the model prediction ability. As seen in Table 4, the single modelling results showed that the SVM model also has accurate predictive skill as it has an NSE values of 0.9857 and 0.9941, RMSE values of 0.0058 and 0.0113, MAE values of 0.0004 and 0.0002, R values of 0.9925 and 0.9970 in training and testing, respectively, indicating that both simulated and observed data fits well in the line plot, accuracy in predictions, and significant association between the study variables. Furthermore, the SVM model has an accurate simulation process as its PBIAS values stood at 0.0188 and 0.0047. Though, the single modelling results showed that all the four developed AI-based (SVM, GPR, ANN, and BRT) models have accurate predictive skills, and indicated a strong correlation between the study variables. Moreover, the BRT model has the lowest performance results compared to other three models (SVM, GPR, and ANN) as it has an NSE values of 0.9700 and 0.9528, RMSE values of 0.0288 and 0.0256, MAE values of 0.0007 and 0.0009, R values of 0.9907 and 0.9960, PBIAS values of 0.0491 and 0.0457 in testing and training, respectively. Training and testing scatter plots for the developed AI-based models were presented in following subsection.
3.3. Training and Testing Scatter Plots for the Developed AI-Based Models
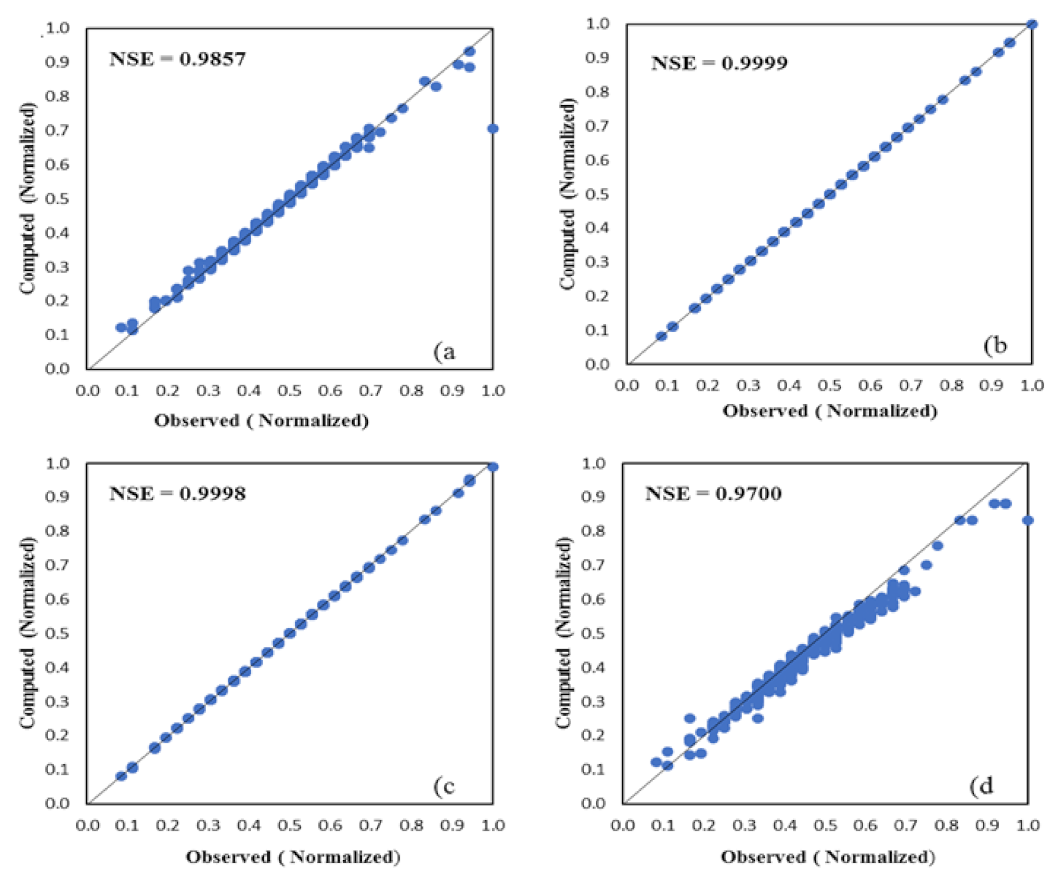
To further examine the performance levels of the developed AI-based models (SVM, GPR, ANN, and BRT) which are based on nonlinear relationship between LMS determinants and determinants predictors. Scatter plots were used to further examine the accuracy level of the developed AI based models in terms of predicting LMS determinants in Nigeria during COVID-19 pandemic. As shown in Figure 8, the NSE results from the training scatter plots for the developed models further strengthens the projection influence of the models in terms of accurate predictions between the simulated and observed data.
As shown in Figure 8, the training scatter plots results affirms the performance results obtained in the single modelling process. The testing scatter plots is presented in Figure.
As seen in Figure 9, the training scatter plots for the developed models indicate that the study input variables (FC, ATT, PE, US, PEOU, PU, and SI,) were the main factors responsible for slow take-up of LMS in Nigeria during COVID-19 pandemic.
4. Discussion
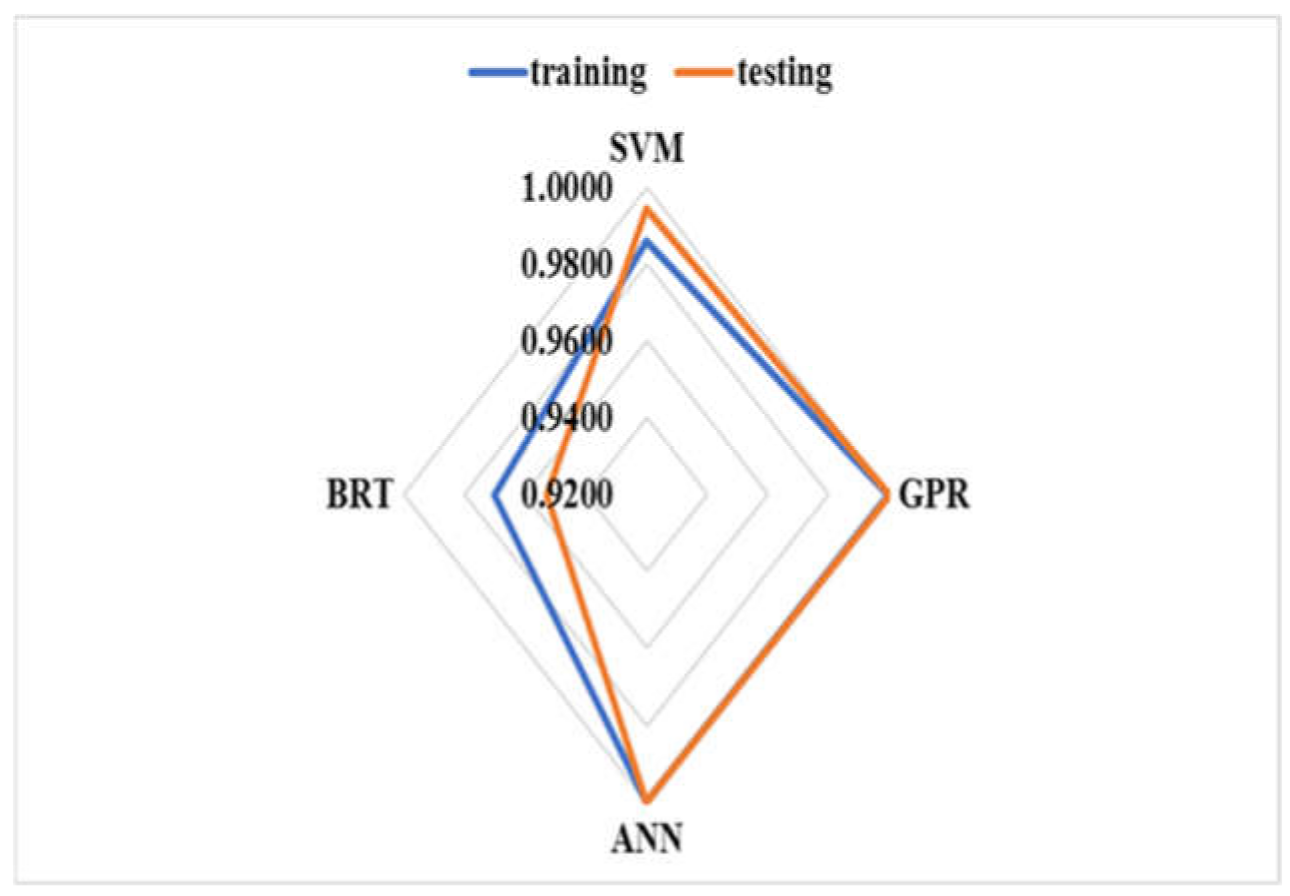
Corroboration of the four AI nonlinear models was done with the testing and training data. The outcomes of both the predicted and targeted output values for all the developed models were pretty good as shown in Figure 8 and Figure 9, indicating a strong correlation between LMS actual usage and the experimental values. Figure 10, depicts the prediction results of the developed models.
As seen in Figure 10, the predicted values of 0.9800, 0.9600, 0.9400, and 0.9200 are for SVM, GPR, ANN, and BRT models, respectively. While 1.0000 represent the targeted values. Although, the GPR model has better prediction ability in terms of training and testing as shown in Figure 8 and Figure 9. The prediction results obtained from the four studied AI models clearly indicate a strong correlation between the simulated and observed values as the predicted values of all the developed models were close to the targeted output value of 1.0. Furthermore, the single model’s performance results comparison proved that SVM has the highest prediction ability compared to GPR, ANN, and BRT due to its robustness in handling data uncertainties. This result is in line with the findings of Pham [72] who argued that SVM has the ability to handle input–output data uncertainties compared to other AI models, e.g., ANN, GPR, and BRT.
The prediction results obtained from the four studied nonlinear AI-based models showed that the study input parameters of facilitating conditions (FC), students’ attitude towards LMS (ATT), perceived enjoyment (PE), and user satisfaction (US) were the most dominant factors that influenced students’ behavioral intent to use LMS in Nigeria, which in turn led to the total shut down of schools during the peak period of COVID-19 pandemic. The results clearly show that lack of access to computers, internet, constant power supply, and students’ negative attitude towards technology (LMS) were main the reasons for long paused of educational activities in Nigeria during COVID-19 pandemic. Similarly, Table 3, indicates that the second most dominant factors that disrupt educational activities in the study are during COVID-19 pandemic are perceived ease of use (PEOU) and perceived usefulness (PU) of LMS. The results may not be unconnected with the non-availability of web-based learning technologies in Nigerian colleges. The result indicates that only few schools in Nigerian attempted to deploy LMS for their teaching and learning activities without being successful due to several challenges. Furthermore, the result is in alignment with the findings of Baki [55], who stressed that students can only perceive a particular eLearning system to be useful (PU) and easy to use (PEOU) only if the systems were made available to them, and they found it entertaining.
Though, social influence (SI) and system quality (SQ) has lower DC values as shown in Table 3, their inclusion does not affect the performance of the developed AI nonlinear models as the final outcomes of all the developed model stood above 0.9 indicating a strong correlation between the dependent variable, in this case LMS actual usage and the independent variables. However, this result is in contrast with the findings of Yakubu [17], who argued that learners in Nigerian colleges believe that individuals they respect or considered to be important influenced their decision with regards to LMS acceptance and usage. Methods employed may likely be the reason for the results differences as authors of the prior study employed structural equation modelling (SEM), while this study employed AI-based approach, which is more reliable, robust, and accurate in making predictions that are complex in nature, e.g., individuals’ attitudes, and emotion.
The study results deliver an experimentally resulting evidence that AI-based models produce more accurate and reliable results than the classical models as all the study AI developed models predicted a strong correlation between the study variables which in turn negatively affect educational activities during COVID-19, by identifying students’ negative attitude towards LMS, satisfaction, enjoyment, perceived usefulness, and ease of use as main reasons for slow progress of LMS in Nigeria. Moreover, the study findings are meaningful in the field of web-based learning technologies for sustainable education during pandemic periods, simply because prior studies focused more on LMS adoption, and to the best of our knowledge none of the previous studies used AI-based techniques to investigate other determinants of LMS such as satisfaction, enjoyment, and attitude.
5. Conclusions
In this study, determinants of LMS success for sustainable education in Nigeria was examined and modelled using four artificial intelligence (AI) based models (SVM, GPR, ANN, and BRT). The final performance results for all the four developed AI models indicate a significant correlation coefficient between LMS usage and the study parameters (FC, ATT, PE, US, PEOU, PU, SI, and SQ) in Nigeria context. Therefore, it can be deduced that the proposed model can be used in scientific studies. However, though SI and SQ were included in training and testing of the developed AI models, the study sensitivity analysis results indicate that SI and SQ have the lowest DC values compared to other input parameters, thus indicating an insignificant correlation between the two variables and LMS acceptance and usage in Nigerian context. Therefore, further investigations are required in order to have more insight with regards to the effects of these two variables. As a result, prior to the development of the study reported model (i.e., determinants models), an analysis of dominant LMS determinants predictors was performed using nonlinear sensitivity analysis to select the most dominant parameters. Consequently, facilitating conditions, attitude towards technology, perceived enjoyment and users’ satisfaction were discovered to be the most significant factors that affect LMS take-up in Nigeria. Other factors contributing to the slow progress of LMS in Nigeria are perceived ease of use and usefulness. Moreover, single models’ performance results comparison proved that SVM has the highest prediction ability compared to GPR, ANN, and BRT due to its robustness in handling data uncertainties. Though, an ensemble model is usually developed in studies that involve two or more AI-based models to improve the performance of the separate models. However, the ensemble model was ignored as the performance of all the developed models were pretty good. Education authorities, school administrators, and other stakeholders in developing nations like Nigeria can use the study findings to provide the necessary resources that facilitate LMS usage and deploy efficient and effective learning management system to augment the conventional teaching and learning method for sustainable education during pandemic periods like that of COVID-19 pandemic.
Just like all other studies, this study too has some limitations; the study examined the factors that affect LMS take-up in developing countries especially Nigeria tertiary institutions from students’ perspectives without taken tutors, administrators, and primary/secondary schools into consideration. Another limitation of this study is the use of nonlinear AI models for all the studied models. Future studies should examine the application of linear and other nonlinear AI techniques like ANFIS, ARIMA, TDNN, and SVR to investigate other factors that affects educational activities from cultural and policies point of views in educational colleges of all kind. Furthermore, future studies should examine the design aspects of LMS with a view to identify it enjoyable components for sustainable development of educational activities.
Author Contributions
Conceptualization: Y.B.M., N.C., and M.N.Y., methodology: Y.B.M., and N.C., investigation: Y.B.M., and M.N.Y., data curation: Y.B.M., N.C., and M.N.Y., writing—original draft preparation: Y.B.M., N.C., and M.N.Y., writing—review and editing: N.C., and Y.B.M. All authors have read and agreed to the published version of the manuscript.
Funding
There is no external funding for this research.
Institutional Review Board Statement
Ethical review and approval were waived for this study due to COVID-19 Pandemic, as the study was carried out during the peak period of COVID-19.
Informed Consent Statement
Informed consent was obtained from all subjects involved in this study.
Data Availability Statement
Not applicable.
Acknowledgments
Not applicable.
Conflicts of Interest
The authors declare no conflict of interest.
Appendix A

Table A1.
Study Constructs, Items and Source.
| Factors | Items (Strongly Disagree–Strongly-Agree, 1–5 Scale) | Source |
|---|---|---|
| Perceived Enjoyment (PE) | I find using LMS to be enjoyable. | [17,52] |
| The actual process of using LMS is pleasant to me. | ||
| I have fun using LMS. | ||
| Generally, I enjoyed using LMS for my studies. | ||
| Attitude Towards Tech. (ATT) | LMS makes studies more interesting. | [41] |
| I look forward to those aspects of my studies that require me to use the LMS. | ||
| LMS has brought more good things than bad. | ||
| I derived more fun than phobia while using LMS. | ||
| Perceived Usefulness (PU) | Using the LMS will allow me to accomplish learning tasks more quickly. | [41] |
| Using the LMS will improve my learning performance. | ||
| Using the LMS will increase my learning productivity. | ||
| Using the LMS will enhance my effectiveness in learning. | ||
| Using the LMS will be useful in my studies. | ||
| Perceived Ease of Use (PEOU) | My interaction with the LMS is clear and understandable. | [42] |
| It would be easy for me to become skillful at using the LMS. | ||
| I find the LMS easy to use. | ||
| Learning to operate the LMS is easy for me. | ||
| Systems Quality (SQ) | The functionality of the LMS allows me to complete my learning tasks. | [41,42] |
| Overall, the LMS is highly reliable with minimal downtime. | ||
| It is easy to learn how to use the LMS. | ||
| The LMS is efficient in allowing me to complete my tasks. | ||
| User Satisfaction (US) | I am satisfied that LMS meets my requirements. | [43,64] |
| I am satisfied with LMS effectiveness. | ||
| I am satisfied with LMS efficiency. | ||
| Generally, I am satisfied with the overall functionality of LMS. | ||
| Facilitating conditions | I have the resources necessary to use the LMS (e.g., technology and time). | [43,64] |
| I have the knowledge necessary to use the LMS. | ||
| The LMS is not compatible with other systems I use. | ||
| A specific person or group is available to assist me with issues I have with the LMS. | ||
| Social influence | My instructors encourage me to use the LMS. | [43,64] |
| My classmates encourage me to use the LMS. | ||
| The university management encourages me to use the LMS. | ||
| Generally speaking, I do what my lecturer thinks I should do. | ||
| Behavioral Intentions | I intend to use the LMS this semester. | [43,64] |
| I predict I will use the LMS next semester. | ||
| I plan to use the LMS frequently for my coursework. | ||
| When given a chance I will always try to use the LMS. | [17,52] | |
| Actual usage | I use the LMS frequently. | |
| I depend on the LMS for my studies. | ||
| I use many functions of the LMS. |
References
- Correa-Baena, J.-P.; Hippalgaonkar, K.; Van Duren, J.; Jaffer, S.; Chandrasekhar, V.R.; Stevanovic, V.; Wadia, C.; Guha, S.; Buonassisi, T. Accelerating materials development via automation, machine learning, and high-performance computing. Joule 2018, 2, 1410–1420. [Google Scholar] [CrossRef] [Green Version]
- Dias, S.B.; Hadjileontiadou, S.J.; Diniz, J.A.; Hadjileontiadis, L.J. Computer-based concept mapping combined with learning management system use: An explorative study under the self-and collaborative-mode. Comput. Educ. 2017, 107, 127–146. [Google Scholar] [CrossRef]
- Han, I.; Shin, W.S. The use of a mobile learning management system and academic achievement of online students. Comput. Educ. 2016, 102, 79–89. [Google Scholar] [CrossRef]
- Chang, C.-T.; Hajiyev, J.; Su, C.-R. Examining the students’ behavioral intention to use e-learning in Azerbaijan? The general extended technology acceptance model for e-learning approach. Comput. Educ. 2017, 111, 128–143. [Google Scholar] [CrossRef]
- Aljarrah, A.A.; Ababneh, M.A.-K.; Cavus, N. The role of massive open online courses during the COVID-19 era: Challenges and perspective. New Trends Issues Proc. Humanit. Soc. Sci. 2020, 7, 142–152. [Google Scholar] [CrossRef]
- Cavus, N.; Sani, A.S.; Haruna, Y.; Lawan, A.A. Efficacy of social networking sites for sustainable education in the era of COVID-19: A systematic review. Sustainability 2021, 13, 808. [Google Scholar] [CrossRef]
- Koh, J.H.L.; Kan, R.Y.P. Perceptions of learning management system quality, satisfaction, and usage: Differences among students of the arts. Australas. J. Educ. Technol. 2020, 26–40. [Google Scholar] [CrossRef] [Green Version]
- Garcia, R.; Falkner, K.; Vivian, R. Systematic literature review: Self-Regulated Learning strategies using e-learning tools for Computer Science. Comput. Educ. 2018, 123, 150–163. [Google Scholar] [CrossRef]
- Bahari, A. Computer-assisted language proficiency assessment tools and strategies. Open Learn. J. Open Distance e-Learn. 2020, 36, 1–27. [Google Scholar] [CrossRef]
- Toquero, C.M. Challenges and opportunities for higher education amid the COVID-19 pandemic: The philippine context. Pedagog. Res. 2020, 5, 0063. [Google Scholar] [CrossRef] [Green Version]
- Chick, R.C.; Clifton, G.T.; Peace, K.M.; Propper, B.W.; Hale, D.F.; Alseidi, A.A.; Vreeland, T.J. Using technology to maintain the education of residents during the COVID-19 pandemic. J. Surg. Educ. 2020, 77, 729–732. [Google Scholar] [CrossRef]
- Levine, D.T.; Morton, J.; O’Reilly, M. Child safety, protection, and safeguarding in the time of COVID-19 in Great Britain: Proposing a conceptual framework. Child Abuse Negl. 2020, 110, 104668. [Google Scholar] [CrossRef] [PubMed]
- Skulmowski, A.; Rey, G.D. COVID-19 as an accelerator for digitalization at a German university: Establishing hybrid campuses in times of crisis. Hum. Behav. Emerg. Technol. 2020, 2, 212–216. [Google Scholar] [CrossRef]
- Husky, M.M.; Kovess-Masfety, V.; Swendsen, J.D. Stress and anxiety among university students in France during Covid-19 mandatory confinement. Compr. Psychiatry 2020, 102, 152191. [Google Scholar] [CrossRef]
- Evagorou, M.; Nisiforou, E. Engaging pre-service teachers in an online STEM fair during COVID-19. J. Technol. Teach. Educ. 2020, 28, 179–186. [Google Scholar] [CrossRef]
- Nasri, N.M.; Husnin, H.; Mahmud, S.N.D.; Halim, L. Mitigating the COVID-19 pandemic: A snapshot from Malaysia into the coping strategies for pre-service teachers’ education. J. Educ. Teach. 2020, 1–8. [Google Scholar] [CrossRef]
- Yakubu, M.N.; Dasuki, S.I.; Abubakar, A.M.; Kah, M.M. Determinants of learning management systems adoption in Nigeria: A hybrid SEM and artificial neural network approach. Educ. Inf. Technol. 2020, 1–25. [Google Scholar] [CrossRef]
- Abugre, J.B. Institutional governance and management systems in Sub-Saharan Africa higher education: Developments and challenges in a Ghanaian Research University. High. Educ. 2018, 75, 323–339. [Google Scholar] [CrossRef]
- Nicholas-Omoregbe, O.S.; Azeta, A.A.; Chiazor, I.A.; Omoregbe, N. Predicting the adoption of e-learning management system: A case of selected private universities in Nigeria. Turk. Online J. Distance Educ. 2017, 18, 106–121. [Google Scholar] [CrossRef] [Green Version]
- Jacob, O.N.; Abigeal, I.; Lydia, A. Impact of COVID-19 on the higher institutions development in Nigeria. Electron. Res. J. Soc. Sci. Humanit. 2020, 2, 126–135. [Google Scholar] [CrossRef]
- Yakubu, M.N.; Muhammadou, K. Nigerian Instructors’ Acceptance of Learning Management Systems: A Structural Modeling Approach. In Proceedings of the IST-Africa Conference (IST-Africa), Nairobi, Kenya, 8–10 May 2019; pp. 1–10. Available online: https://ieeexplore.ieee.org/document/9144032/ (accessed on 18 July 2019).
- Fadare, O.G.; Babatunde, O.H.; Akomolafe, D.T.; Lawal, O.O. Behavioral intention for mobile learning on 3G mobile internet technology in south-west part of Nigeria. World J. Eng. Pure Appl. Sci. 2011, 1, 19. Available online: https://www.researchgate.net/publication/291798110_Behavioral_Intention_for_Mobile_Learning_on_3G_Mobile_Internet_Technology_in_South-West_Part_of_Nigeria (accessed on 4 June 2010).
- Nourani, V.; Gökçekuş, H.; Umar, I.K. Artificial intelligence based ensemble model for prediction of vehicular traffic noise. Environ. Res. 2020, 180, 108852. [Google Scholar] [CrossRef]
- Cruz-Benito, J.; Sánchez-Prieto, J.C.; Therón, R.; García-Peñalvo, F.J. Measuring Students’ Acceptance to AI-Driven Assessment in eLearning: Proposing a First TAM-Based Research Model. In Proceedings of the International Conference on Human-Computer Interaction, Orlando, FL, USA, 26–31 July 2019; pp. 15–25. [Google Scholar] [CrossRef]
- Mousavi-Avval, S.H.; Rafiee, S.; Mohammadi, A. Development and evaluation of combined adaptive neuro-fuzzy inference system and multi-objective genetic algorithm in energy, economic and environmental life cycle assessments of oilseed production. Sustainability 2021, 13, 290. [Google Scholar] [CrossRef]
- Njock, P.G.A.; Shen, S.-L.; Zhou, A.; Lyu, H.-M. Evaluation of soil liquefaction using AI technology incorporating a coupled ENN/t-SNE model. Soil Dyn. Earthq. Eng. 2020, 130, 105988. [Google Scholar] [CrossRef]
- Cidral, W.A.; Oliveira, T.; Felice, M.D.; Aparicio, M. E-learning success determinants: Brazilian empirical study. Comput. Educ. 2018, 122, 273–290. [Google Scholar] [CrossRef] [Green Version]
- Chang, C.-C.; Shu, K.-M.; Liang, C.; Tseng, J.-S.; Hsu, Y.-S. Is blended e-learning as measured by an achievement test and self-assessment better than traditional classroom learning for vocational high school students? Int. Rev. Res. Open Distrib. Learn. 2014, 15, 213–231. [Google Scholar] [CrossRef] [Green Version]
- Muchtar, F.B.; Al-Adhaileh, M.H.; Singh, P.K.; Japang, M.; Eri, Z.D.; Haron, H.; Muchtar, F. Evaluation of Students’ Performance Based on Teaching Method Using LMS. In Proceedings of the International Conference on Computing, Communications, and Cyber-Security (IC4S 2019), Chandigarh, India, 12–13 October 2019; pp. 647–667. [Google Scholar] [CrossRef]
- Al-Neklawy, A.F. Online embryology teaching using learning management systems appears to be a successful additional learning tool among Egyptian medical students. Ann. Anat. Anat. Anz. 2017, 214, 9–14. [Google Scholar] [CrossRef]
- Ghazal, S.; Al-Samarraie, H.; Aldowah, H. “I am still learning”: Modeling LMS critical success factors for promoting students’ experience and satisfaction in a blended learning environment. IEEE Access 2018, 6, 77179–77201. [Google Scholar] [CrossRef]
- Lewin, C.; Lai, K.-W.; Van Bergen, H.; Charania, A.; Ntebutse, J.G.; Quinn, B.; Sherman, R.; Smith, D. Integrating academic and everyday learning through technology: Issues and challenges for researchers, policy makers and practitioners. Technol. Knowl. Learn. 2018, 23, 391–407. [Google Scholar] [CrossRef]
- García-Martínez, J.-A.; Fuentes-Abeledo, E.-J.; Rodríguez-Machado, E.-R. Attitudes towards the use of ICT in Costa Rican university students: The influence of sex, academic performance, and training in technology. Sustainability 2021, 13, 282. [Google Scholar] [CrossRef]
- El-Masri, M.; Tarhini, A. Factors affecting the adoption of e-learning systems in Qatar and USA: Extending the unified theory of acceptance and use of technology 2 (UTAUT2). Educ. Technol. Res. Dev. 2017, 65, 743–763. [Google Scholar] [CrossRef]
- Mtebe, J.S.; Raisamo, R. A model for assessing learning management system success in higher education in Sub-Saharan countries. Electron. J. Inf. Systems Dev. Ctries. 2014, 61, 1–17. [Google Scholar] [CrossRef]
- Jeon, J. The strengths and limitations of the statistical modeling of complex social phenomenon: Focusing on SEM, path analysis, or multiple regression models. Int. J. Econ. Manag. Eng. 2015, 9, 1634–1642. [Google Scholar] [CrossRef]
- Lin, H.M.; Lee, M.H.; Liang, J.C.; Chang, H.Y.; Huang, P.; Tsai, C.C. A review of using partial least square structural equation modeling in e-learning research. Br. J. Educ. Technol. 2020, 51, 1354–1372. [Google Scholar] [CrossRef]
- Citakoglu, H. Comparison of artificial intelligence techniques via empirical equations for prediction of solar radiation. Comput. Electron. Agric. 2015, 118, 28–37. [Google Scholar] [CrossRef]
- Mohamadnejad, M.; Gholami, R.; Ataei, M. Comparison of intelligence science techniques and empirical methods for prediction of blasting vibrations. Tunn. Undergr. Space Technol. 2012, 28, 238–244. [Google Scholar] [CrossRef]
- Yang, H.; Alphones, A.; Xiong, Z.; Niyato, D.; Zhao, J.; Wu, K. Artificial-intelligence-enabled intelligent 6G networks. IEEE Netw. 2020, 34, 272–280. [Google Scholar] [CrossRef]
- Davis, F.D. Perceived usefulness, perceived ease of use, and user acceptance of information technology. MIS Q. 1989, 319–340. [Google Scholar] [CrossRef] [Green Version]
- Delone, W.H.; McLean, E.R. The DeLone and McLean model of information systems success: A ten-year update. J. Manag. Inf. Syst. 2003, 19, 9–30. [Google Scholar] [CrossRef]
- Venkatesh, V.; Thong, J.Y.; Xu, X. Consumer acceptance and use of information technology: Extending the unified theory of acceptance and use of technology. MIS Q. 2012, 157–178. [Google Scholar] [CrossRef] [Green Version]
- Zhang, N.; Guo, X.; Chen, G. IDT-TAM integrated model for IT adoption. Tsinghua Sci. Technol. 2008, 13, 306–311. [Google Scholar] [CrossRef]
- Smith, J.R.; McSweeney, A. Charitable giving: The effectiveness of a revised theory of planned behaviour model in predicting donating intentions and behaviour. J. Community Appl. Soc. Psychol. 2007, 17, 363–386. [Google Scholar] [CrossRef]
- Fishbein, M.; Ajzen, I.; Albarracin, D.; Hornik, R. A reasoned action approach: Some issues, questions, and clarifications. Predict. Change Health Behav. Appl. Reason. Action Approach 2007, 281–295. [Google Scholar] [CrossRef]
- Al-Emran, M.; Mezhuyev, V.; Kamaludin, A. Technology acceptance model in M-learning context: A systematic review. Comput. Educ. 2018, 125, 389–412. [Google Scholar] [CrossRef]
- Sharma, S.K.; Gaur, A.; Saddikuti, V.; Rastogi, A. Structural equation model (SEM)-neural network (NN) model for predicting quality determinants of e-learning management systems. Behav. Inf. Technol. 2017, 36, 1053–1066. [Google Scholar] [CrossRef]
- Binyamin, S.S.; Rutter, M.; Smith, S. Extending the technology acceptance model to understand students’ use of learning management systems in Saudi higher education. Int. J. Emerg. Technol. Learn. 2019, 14, 4–21. [Google Scholar] [CrossRef]
- Ain, N.; Kaur, K.; Waheed, M. The influence of learning value on learning management system use: An extension of UTAUT2. Inf. Dev. 2016, 32, 1306–1321. [Google Scholar] [CrossRef]
- Ayeni, F.; Adewunmi, M.; Ekanoye, F.; Pruitt, T.; Mbarika, V.; Fagbeyiro, G.; Landor, J.; Aquegho, F. A mixed methods inquiry into the quality of instructional designs and use of moodle learning management systems in historically black colleges and universities. Am. J. Educ. Inf. Technol. 2019, 3, 17. [Google Scholar] [CrossRef]
- Moorthy, K.; T’ing, L.C.; Wei, K.M.; Mei, P.T.Z.; Yee, C.Y.; Wern, K.L.J.; Xin, Y.M. Is facebook useful for learning? A study in private universities in Malaysia. Comput. Educ. 2019, 130, 94–104. [Google Scholar] [CrossRef]
- Wasko, M.M.; Faraj, S. Why should I share? Examining social capital and knowledge contribution in electronic networks of practice. MIS Q. 2005, 35–57. [Google Scholar] [CrossRef]
- Magen-Nagar, N.; Shonfeld, M. The impact of an online collaborative learning program on students’ attitude towards technology. Interact. Learn. Environ. 2018, 26, 621–637. [Google Scholar] [CrossRef]
- Baki, R.; Birgoren, B.; Aktepe, A. A meta analysis of factors affecting perceived usefulness and perceived ease of use in the adoption of e-learning systems. Turk. Online J. Distance Educ. 2018, 19, 4–42. Available online: https://dergipark.org.tr/en/download/article-file/555808 (accessed on 13 October 2018). [CrossRef]
- Brown, I.T. Individual and technological factors affecting perceived ease of use of web-based learning technologies in a developing country. Electron. J. Inf. Syst. Dev. Ctries. 2002, 9, 1–15. [Google Scholar] [CrossRef]
- Joo, Y.J.; Kim, N.; Kim, N.H. Factors predicting online university students’ use of a mobile learning management system (m-LMS). Educ. Technol. Res. Dev. 2016, 64, 611–630. [Google Scholar] [CrossRef]
- Ramírez-Correa, P.E.; Rondan-Cataluña, F.J.; Arenas-Gaitán, J.; Alfaro-Perez, J.L. Moderating effect of learning styles on a learning management system’s success. Telemat. Inform. 2017, 34, 272–286. [Google Scholar] [CrossRef]
- DeLone, W.H.; McLean, E.R. Information systems success: The quest for the dependent variable. Inf. Syst. Res. 1992, 3, 60–95. [Google Scholar] [CrossRef] [Green Version]
- Syed, A.M.; Ahmad, S.; Alaraifi, A.; Rafi, W. Identification of operational risks impeding the implementation of eLearning in higher education system. Educ. Inf. Technol. 2020, 1–17. [Google Scholar] [CrossRef]
- Yuen, A.H.; Cheng, M.; Chan, F.H. Student satisfaction with learning management systems: A growth model of belief and use. Br. J. Educ. Technol. 2019, 50, 2520–2535. [Google Scholar] [CrossRef]
- Almarashdeh, I. Sharing instructors experience of learning management system: A technology perspective of user satisfaction in distance learning course. Comput. Human Behav. 2016, 63, 249–255. [Google Scholar] [CrossRef]
- Bergersen, B.M. User satisfaction and influencing issues. Netw. Syst. Adm. Res. Surv. 2004, 1, 5–26. Available online: http://citeseerx.ist.psu.edu/viewdoc/download?doi=10.1.1.97.8495&rep=rep1&type=pdf (accessed on 6 June 2004).
- Venkatesh, V.; Morris, M.G.; Davis, G.B.; Davis, F.D. User acceptance of information technology: Toward a unified view. MIS Q. 2003, 425–478. [Google Scholar] [CrossRef] [Green Version]
- Tarhini, A.; Elyas, T.; Akour, M.A.; Al-Salti, Z. Technology, demographic characteristics and e-learning acceptance: A conceptual model based on extended technology acceptance model. High. Educ. Stud. 2016, 6, 72–89. [Google Scholar] [CrossRef] [Green Version]
- Amoush, A.B.A.; Sandhu, K. Digital Transformation of Learning Management Systems at Universities: Case Analysis for Student Perspectives. In Digital Transformation and Innovative Services for Business and Learning; IGI Global: Hershey, PA, USA, 2020; pp. 41–61. [Google Scholar] [CrossRef]
- Tarhini, A.; Hone, K.; Liu, X.; Tarhini, T. Examining the moderating effect of individual-level cultural values on users’ acceptance of E-learning in developing countries: A structural equation modeling of an extended technology acceptance model. Interact. Learn. Environ. 2017, 25, 306–328. [Google Scholar] [CrossRef] [Green Version]
- Sánchez-Prieto, J.C.; Olmos-Migueláñez, S.; García-Peñalvo, F.J. MLearning and pre-service teachers: An assessment of the behavioral intention using an expanded TAM model. Comput. Hum. Behav. 2017, 72, 644–654. [Google Scholar] [CrossRef]
- Chambo, F.F.; Laizer, L.S.; Nkansah-Gyekye, Y.; Ndume, V. Towards the development of mobile learning model for Tanzania secondary schools: Case study Kilimanjaro region. In Proceedings of the 2013 Pan African International Conference on Information Science, Computing and Telecommunications (PACT), Lusaka, Zambia, 13–17 July 2013; pp. 127–130. [Google Scholar] [CrossRef]
- Ardabili, S.; Mosavi, A.; Várkonyi-Kóczy, A.R. Advances in machine learning modeling reviewing hybrid and ensemble methods. In Proceedings of the International Conference on Global Research and Education, Balatonfüred, Hungary, 4–7 September 2019; pp. 215–227. [Google Scholar] [CrossRef]
- Nourani, V.; Uzelaltinbulat, S.; Sadikoglu, F.; Behfar, N. Artificial intelligence based ensemble modeling for multi-station prediction of precipitation. Atmosphere 2019, 10, 80. [Google Scholar] [CrossRef] [Green Version]
- Pham, B.T.; Nguyen, M.D.; Van Dao, D.; Prakash, I.; Ly, H.-B.; Le, T.-T.; Ho, L.S.; Nguyen, K.T.; Ngo, T.Q.; Hoang, V. Development of artificial intelligence models for the prediction of compression coefficient of soil: An application of Monte Carlo sensitivity analysis. Sci. Total Environ. 2019, 679, 172–184. [Google Scholar] [CrossRef]
- Cantabella, M.; Martínez-España, R.; Ayuso, B.; Yáñez, J.A.; Muñoz, A. Analysis of student behavior in learning management systems through a big data framework. Future Gener. Comput. Syst. 2019, 90, 262–272. [Google Scholar] [CrossRef]
- Bermudez-Edo, M.A.; Barnaghi, P.; Moessner, K. Analysing real world data streams with spatio-temporal correlations: Entropy vs. Pearson correlation. Autom. Constr. 2018, 88, 87–100. [Google Scholar] [CrossRef]
Figure 1.
Classic Research Model.

Figure 2.
Methodological Structure of the Study.

Figure 3.
Flow Diagram of the Study SVM Algorithm [23].
Figure 3.
Flow Diagram of the Study SVM Algorithm [23].

Figure 4.
Structure of GPR Algorithm.

Figure 5.
Structure of the Study ANN Algorithm.

Figure 6.
Structure of the Study BRT Algorithm.

Figure 7.
Flow Diagram of the Developed Ensemble Methods.

Figure 8.
Training scatter plots between computed and observed effects of LMS determinants on actual usage by (a) SVM, (b) GPR, (c) ANN, and (d) BRT models.
Figure 8.
Training scatter plots between computed and observed effects of LMS determinants on actual usage by (a) SVM, (b) GPR, (c) ANN, and (d) BRT models.

Figure 9.
Testing scatter plots between computed and observed effects of LMS determinants on actual usage by (a) SVM, (b) GPR, (c) ANN, and (d) BRT models.
Figure 9.
Testing scatter plots between computed and observed effects of LMS determinants on actual usage by (a) SVM, (b) GPR, (c) ANN, and (d) BRT models.

Figure 10.
Prediction results of the reported model by a) SVM, b) GPR, c) ANN, and d) BRT models.

Table 1.
Demographic distribution.
| Variables | Demographic Variable | Frequencies | Percentage |
|---|---|---|---|
| Gender | Male | 808 | 65.0 |
| Female | 436 | 35.0 | |
| Age | 18–25 | 506 | 40.7 |
| Above 25 | 738 | 59.3 | |
| Study Level | Undergraduate | 679 | 54.6 |
| Postgraduate | 565 | 45.4 | |
| Length of Usage | Less than one year | 930 | 74.8 |
| Over one year | 314 | 25.2 |
Table 2.
Reliability of the study constructs.
| Model | Reference (Adapted from) | Constructs | Number of Items | Cronbach Alpha |
|---|---|---|---|---|
| Recommended | [17,52] | Perceived Enjoyment (PE) | 4 | 0.864 |
| Recommended | [17,52] | Attitude (ATT) | 4 | 0.814 |
| TAM | [41] | Perceived Usefulness (PU) | 5 | 0.749 |
| TAM | [41] | Perceived Ease of Use (PEOU) | 4 | 0.769 |
| D&M | [42] | Systems Quality (SQ) | 4 | 0.842 |
| D&M | [42] | User Satisfaction (US) | 4 | 0.828 |
| UTAUT2 | [43] | Facilitating Conditions (FC) | 4 | 0.873 |
| UTAUT2 | [43] | Social Influence (SI) | 4 | 0.888 |
| UTAUT2 | [43] | Behavioral Intentions (BI) | 4 | 0.721 |
| UTAUT2 | [43] | Actual Usage | 4 | 0.713 |
Table 3.
Results of sensitivity analysis.
| Parameter | DC (Average) | Rank |
|---|---|---|
| Facilitating conditions (FC) | 0.8210 | 1 |
| Attitude towards Tech. (ATT) | 0.8101 | 2 |
| Perceived enjoyment (PE) | 0.7602 | 3 |
| User satisfaction (US) | 0.7563 | 4 |
| Perceived ease of use (PEOU) | 0.6142 | 5 |
| Perceived usefulness (PU) | 0.6112 | 6 |
| Social influence (SI) | 0.4816 | 7 |
| System quality (SQ) | 0.4635 | 8 |
| Facilitating conditions (FC) | 0.8210 | 1 |
Table 4.
Single modelling results.
| Training | Testing | |||||||||
|---|---|---|---|---|---|---|---|---|---|---|
| Models | NSE | RMSE | MAE | R | PBIAS | NSE | RMSE | MAE | R | PBIAS |
| SVM | 0.9857 | 0.0058 | 0.0004 | 0.9925 | 0.0188 | 0.9941 | 0.0113 | 0.0002 | 0.9970 | 0.0047 |
| GPR | 0.9999 | 0.0000 | 0.0000 | 1.0000 | 0.0000 | 1.0000 | 0.0000 | 0.0000 | 1.0000 | 0.0000 |
| ANN | 0.9999 | 0.0010 | 0.0000 | 1.0000 | 0.0012 | 0.9999 | 0.0017 | 0.0000 | 0.9999 | 0.0010 |
| BRT | 0.9700 | 0.0288 | 0.0007 | 0.9907 | 0.0491 | 0.9528 | 0.0256 | 0.0009 | 0.9960 | 0.0457 |
Publisher’s Note: MDPI stays neutral with regard to jurisdictional claims in published maps and institutional affiliations. |
© 2021 by the authors. Licensee MDPI, Basel, Switzerland. This article is an open access article distributed under the terms and conditions of the Creative Commons Attribution (CC BY) license (https://creativecommons.org/licenses/by/4.0/).
Share and Cite
MDPI and ACS Style
Cavus, N.; Mohammed, Y.B.; Yakubu, M.N. Determinants of Learning Management Systems during COVID-19 Pandemic for Sustainable Education. Sustainability 2021, 13, 5189. https://doi.org/10.3390/su13095189
AMA Style
Cavus N, Mohammed YB, Yakubu MN. Determinants of Learning Management Systems during COVID-19 Pandemic for Sustainable Education. Sustainability. 2021; 13(9):5189. https://doi.org/10.3390/su13095189
Chicago/Turabian StyleCavus, Nadire, Yakubu Bala Mohammed, and Mohammed Nasiru Yakubu. 2021. "Determinants of Learning Management Systems during COVID-19 Pandemic for Sustainable Education" Sustainability 13, no. 9: 5189. https://doi.org/10.3390/su13095189
Note that from the first issue of 2016, this journal uses article numbers instead of page numbers. See further details here.