
The Pandemic Waves’ Impact on the Crude Oil Price and the Rise of Consumer Price Index: Case Study for Six European Countries


1
Faculty of Mathematics-Informatics, University of Craiova, 200385 Craiova, Romania
2
Faculty of Economics and Business Administration, West University of Timisoara, 300223 Timisoara, Romania
3
Faculty of Management and Rural Tourism, University of Life Science” King Mihai I”, 300645 Timisoara, Romania
*
Author to whom correspondence should be addressed.
Sustainability 2023, 15(8), 6537; https://doi.org/10.3390/su15086537
Submission received: 15 February 2023
/
Revised: 5 April 2023
/
Accepted: 10 April 2023
/
Published: 12 April 2023
(This article belongs to the Special Issue Economic Recovery and Prospects in a Post-COVID-19 World)
Abstract
:This study examines the response of the Consumer Price Index (CPI) in local currency to the COVID-19 pandemic using monthly data (March 2020–February 2022), comparatively for six European countries. We have introduced a model of multivariate adaptive regression that considers the quasi-periodic effects of pandemic waves in combination with the global effect of the economic shock to model the variation in the price of crude oil at international levels and to compare the induced effect of the pandemic restriction as well and the oil price variation on each country’s CPI. The model was tested for the case of six emergent countries and developed European countries. The findings show that: (i) pandemic restrictions are driving a sharp rise in the CPI, and consequently inflation, in most European countries except Greece and Spain, and (ii) the emergent economies are more affected by the oil price and pandemic restriction than the developed ones.
1. Introduction
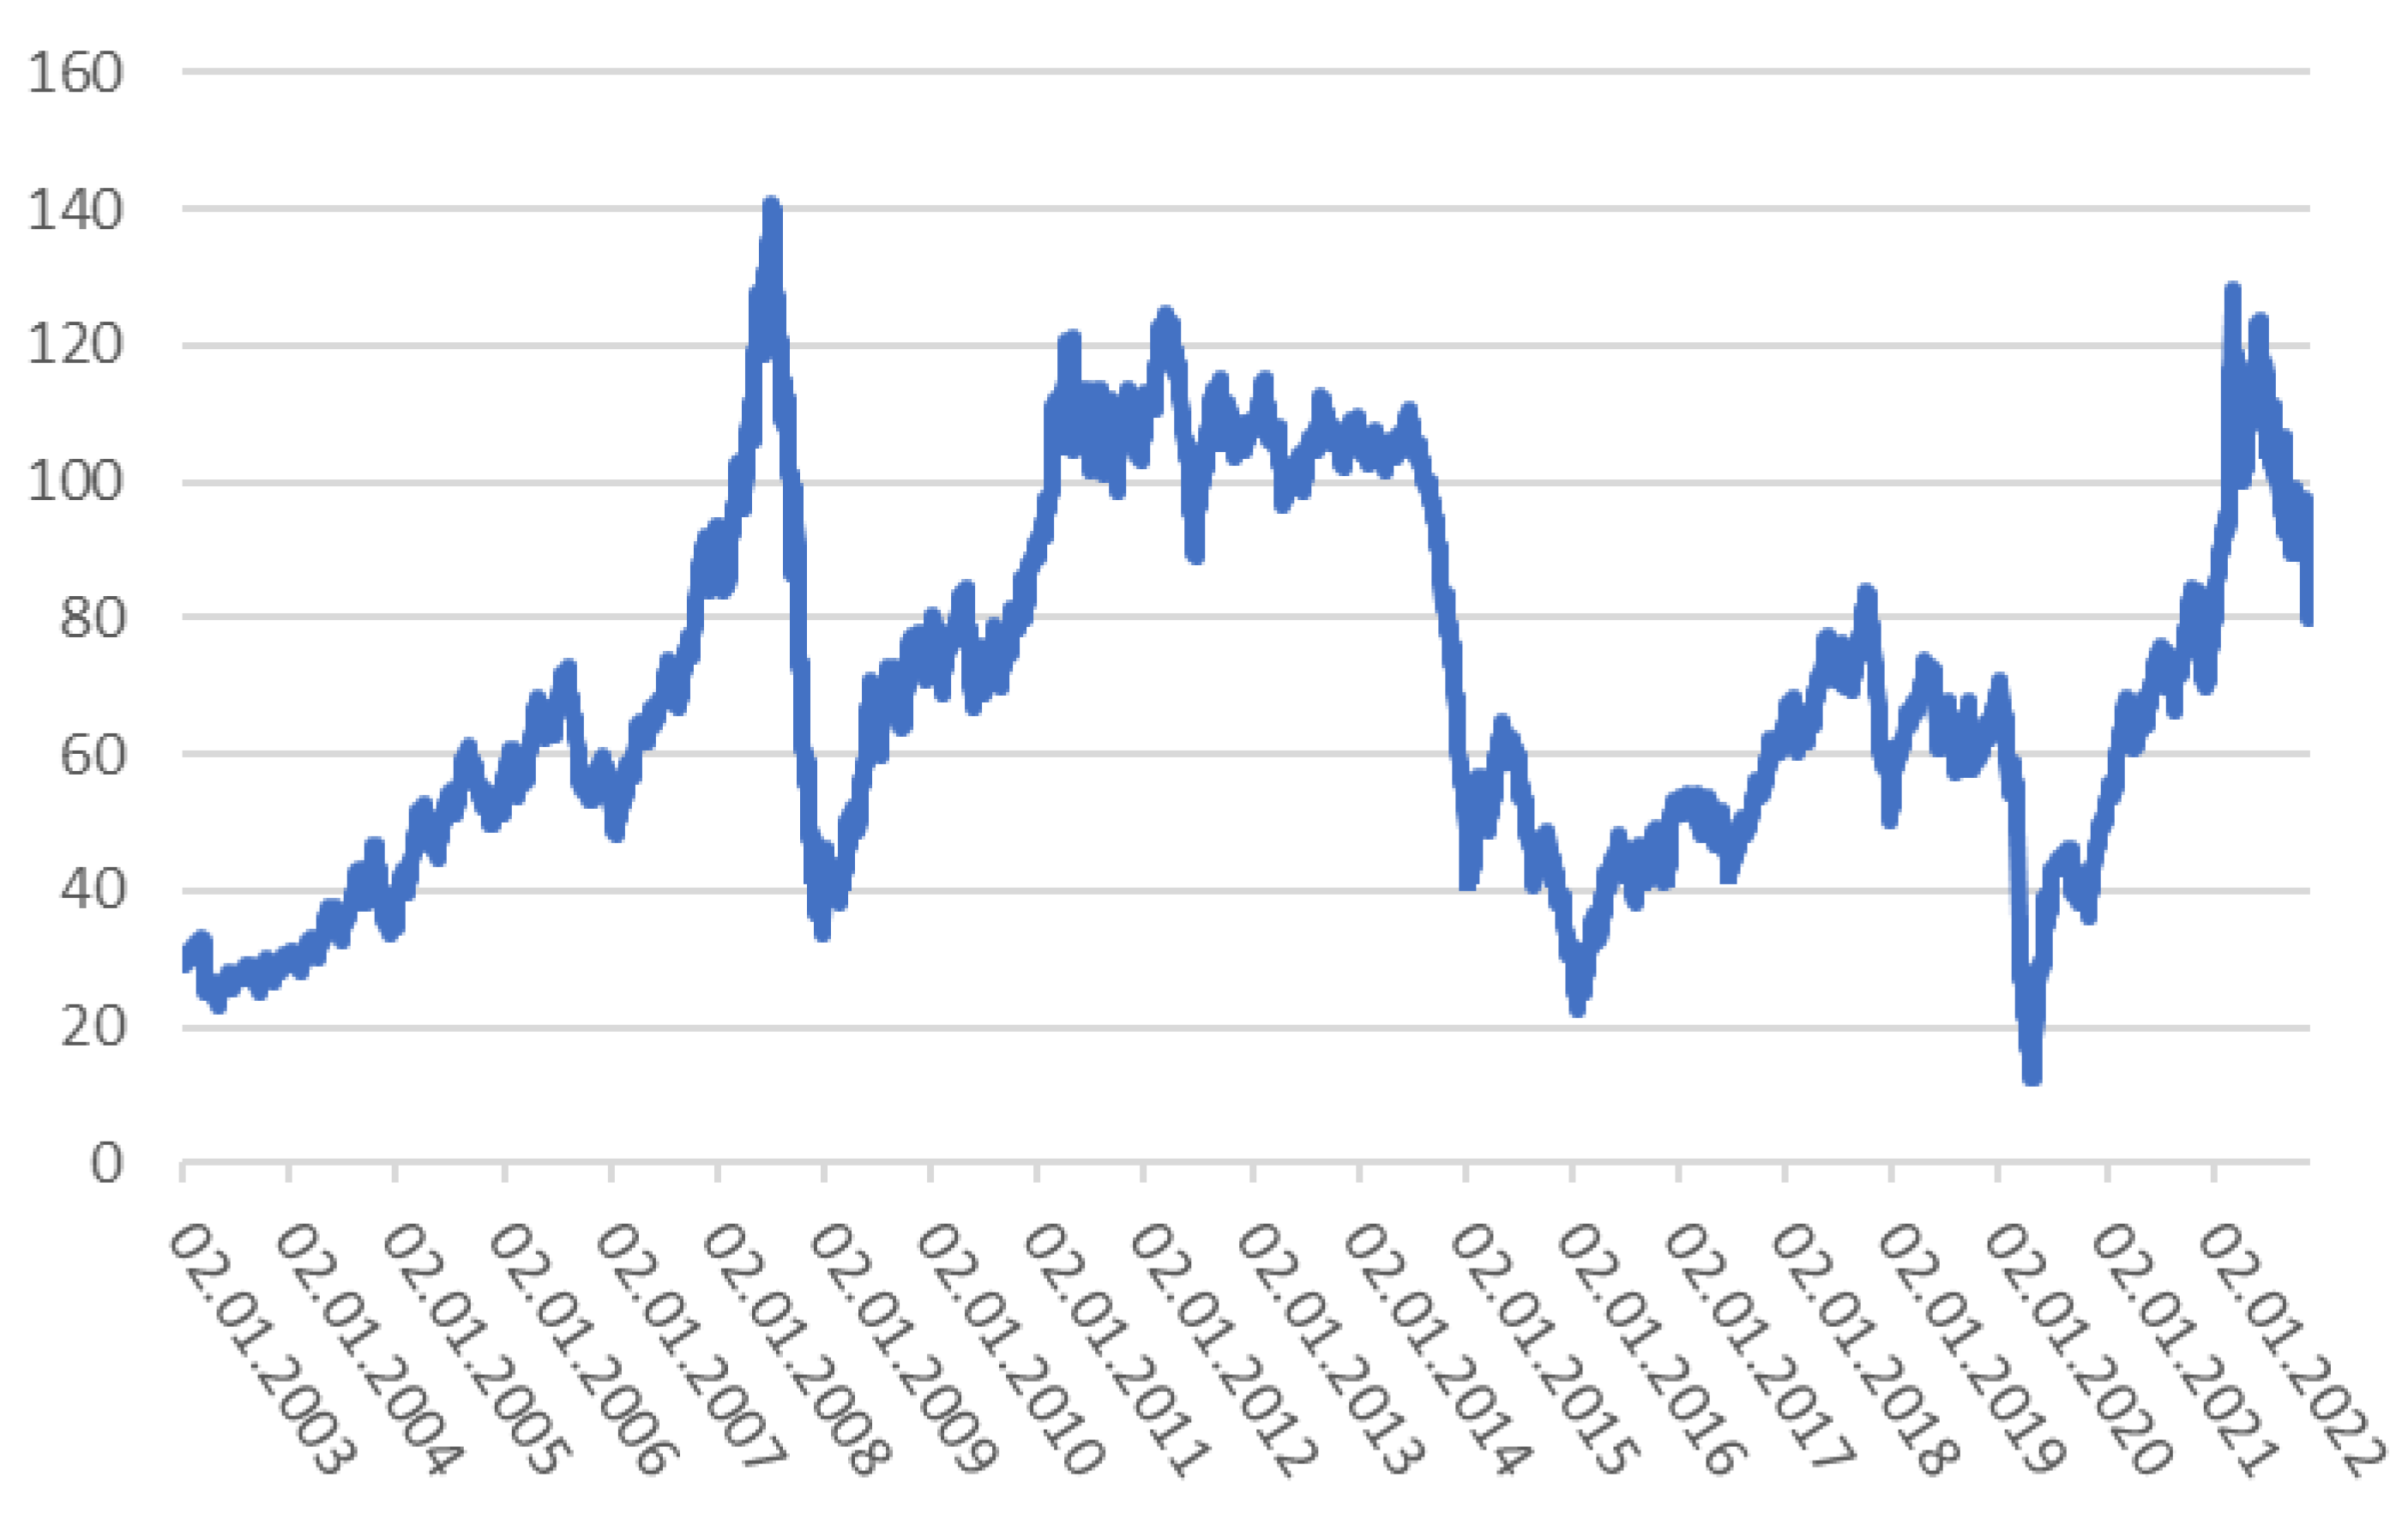
The last two years were marked by a reversal of the general trend of gradual decline in consumer price inflation in Europe over the last four decades (1980–2020), which had overlapped with the undesirable effects of the SARS-CoV19 epidemic on the economy and society [1,2]. The rise of the Core Consumer Price Index, one of the essential indicators used to assess inflation, was accelerated by the increase in the demand for fossil fuels in the same period, which in turn led to a peak increase of more than five times of the Oil Price on the International Market, even though this tendency was necessarily consistent throughout the years, as some sharp drops and recoveries were reported, as evidenced in Figure 1 [3].
The OPEC Reference Basket consists of a weighted average for the prices of oil and petroleum products produced by countries that are members of the OPEC (Organization of Petroleum Exporting Countries). It can be considered an important tool for examining the market prices of petroleum. By adjusting production, OPEC aims to keep the prices of raw oil between a lower and an upper bound. The OPEC Basket includes a mix of lighter and heavier petroleum products. The prices of Brent crude oil and West Texas Intermediate crude oil are additional benchmarking instruments in the petroleum business [4,5,6,7].
At the beginning of the pandemic crisis, the oil-exporting states were facing a devaluation of their main natural resources [8,9]. Although these nations should be capable of enduring the crisis in the long run and reaping the advantages, they suffer as a result of its acute emergencies; short-term bankruptcy is threatened by dwindling demand and lowering prices. [10].
Our study was motivated by the observation that, early in the COVID-19 epidemic, the sharp temporary drop in headline inflation can be mostly attributed to shocks in oil prices; however, the oil price shocks started creating slower inflationary pressures at the beginning of 2021 and, by the end of 2021, the cumulative impact of these price shocks had largely increased, conducting at an increase of the broad-based price of the Core Price Index, durable goods (vehicles, consumer electronics, furniture), shelter (rent and owners’ equivalent rent) and other services (such as insurance).
Two years ago, when COVID-19 started, economic activity and oil demand declined [11]. Oil producers modified production levels; however, this approach was insufficient to account for and alleviate market shocks. At the same time, it was in the interest of oil-producing countries and organizations not to endanger their own reservoirs or capital. Moreover, storage space was scarce. Further straining the economic system was the uncertainty about the severity and duration of the economic crisis [12].
As underlined by experts in oil and gas economics: “No one really has a crystal ball—tomorrow, things can go in exactly the opposite direction. Change and volatility seem to be the only constant in the oil market. However, it is probably safe to say that there are three key underlying reasons” [13].
The notion of supply and demand is rather simple and adheres to standard economic principles. Price should rise as demand (or supply) rises or falls. Prices should decrease when supply grows or as demand declines.
In 2022, Kosakowski argued that “the price of oil as we know it is set in the oil futures market. An oil futures contract is a binding agreement that gives one the right to purchase oil by the barrel at a predefined price on a predefined date in the future. Under a futures contract, both the buyer and the seller are obligated to fulfill their side of the transaction on the specified date” [14].
One of the consequences of the change in the crude oil price is reflected in the change in the price of gasoline at the pump, which means significant variation in the transportation costs of consumer goods and, implicitly, the change in the Consumer Price Index.
In time, different models of the influence of oil prices on inflation were proposed. The considered methods cover a wide spectrum of approaches, starting with relatively simple ones, which are based on estimated linear equations with common factors (estimated based on the static principal component method [15]), and continuing with MIDAS models [16], in which polynomial functions are used to limit the number of parameters to be estimated. The models with dynamic factors that use the Kalman filter (MF-DFM) for their evaluation and extension in line with the projection horizon are also included, as well as more complex methods that use Bayesian estimation techniques, applied in a context where they are present multiple unobservable variables—Bayesian VAR models that use mixed-frequency data sets [17].
If there was a significant reduction in the costs of passenger transport at the beginning of the pandemic (first half of 2020), due to severe traffic restrictions, during the next three waves of the epidemic, the gradual increase in online commerce led to the explosive development of retail distribution networks, which induced an accelerated increase in the price of fuels and also in the average price of consumer goods [15].
An early study of the pandemic influence on the Consumer Price Index was posted by the International Monetary Fund in November 2020 [16], followed by an analysis of inflation in the UK after the first year of the micro-economic pandemic [17].
The effect of the pandemic on the fuel price in Turkey was first studied by Kartal [18], who used a regression model based on spline functions to demonstrate the close correlation between oil price fluctuations and global volatility.
Later, it was shown that a structural VAR (Vector Auto-Regression) model is a more natural framework to estimate the effect of gasoline price shocks on inflation and inflation expectations than reduced-form correlations [19]. Another quasi-linear model using the New Keynesian Phillips curve was proposed in order to simulate the shock of COVID-19 on the Consumer Price Index [20].
In 2021 a nonlinear model of the e-Market rise under pandemic conditions was proposed, combining a logistic growth model with a seasonal attenuated quasi-cyclic effect of COVID-19 restrictions [21].
Starting from this model, we propose a non-linear regression model of the behavior of Crude Oil Price (OCP) during the pandemic restrictions between March 2020 and February 2022. The new regression equation for oil price variation contains two main components: a cyclic one that models the variation of OCP produced directly by the economic and social restrictions associated with each pandemic wave, and a logistic component that models the cumulative economic effect over the entire pandemic period.
In this paper, we also analyze the variation of Consumer Price Index (CPI), as the main component of the Inflation index, in various European countries, in order to propose a new non-linear regression model relying on the dependence of CPI on the pandemic restrictions in selected European countries, from one part, and the variation of Crude Oil Price (OCP) between March 2020 and February 2022, for the other part.
2. Origin of Data for CPI and Oil Price
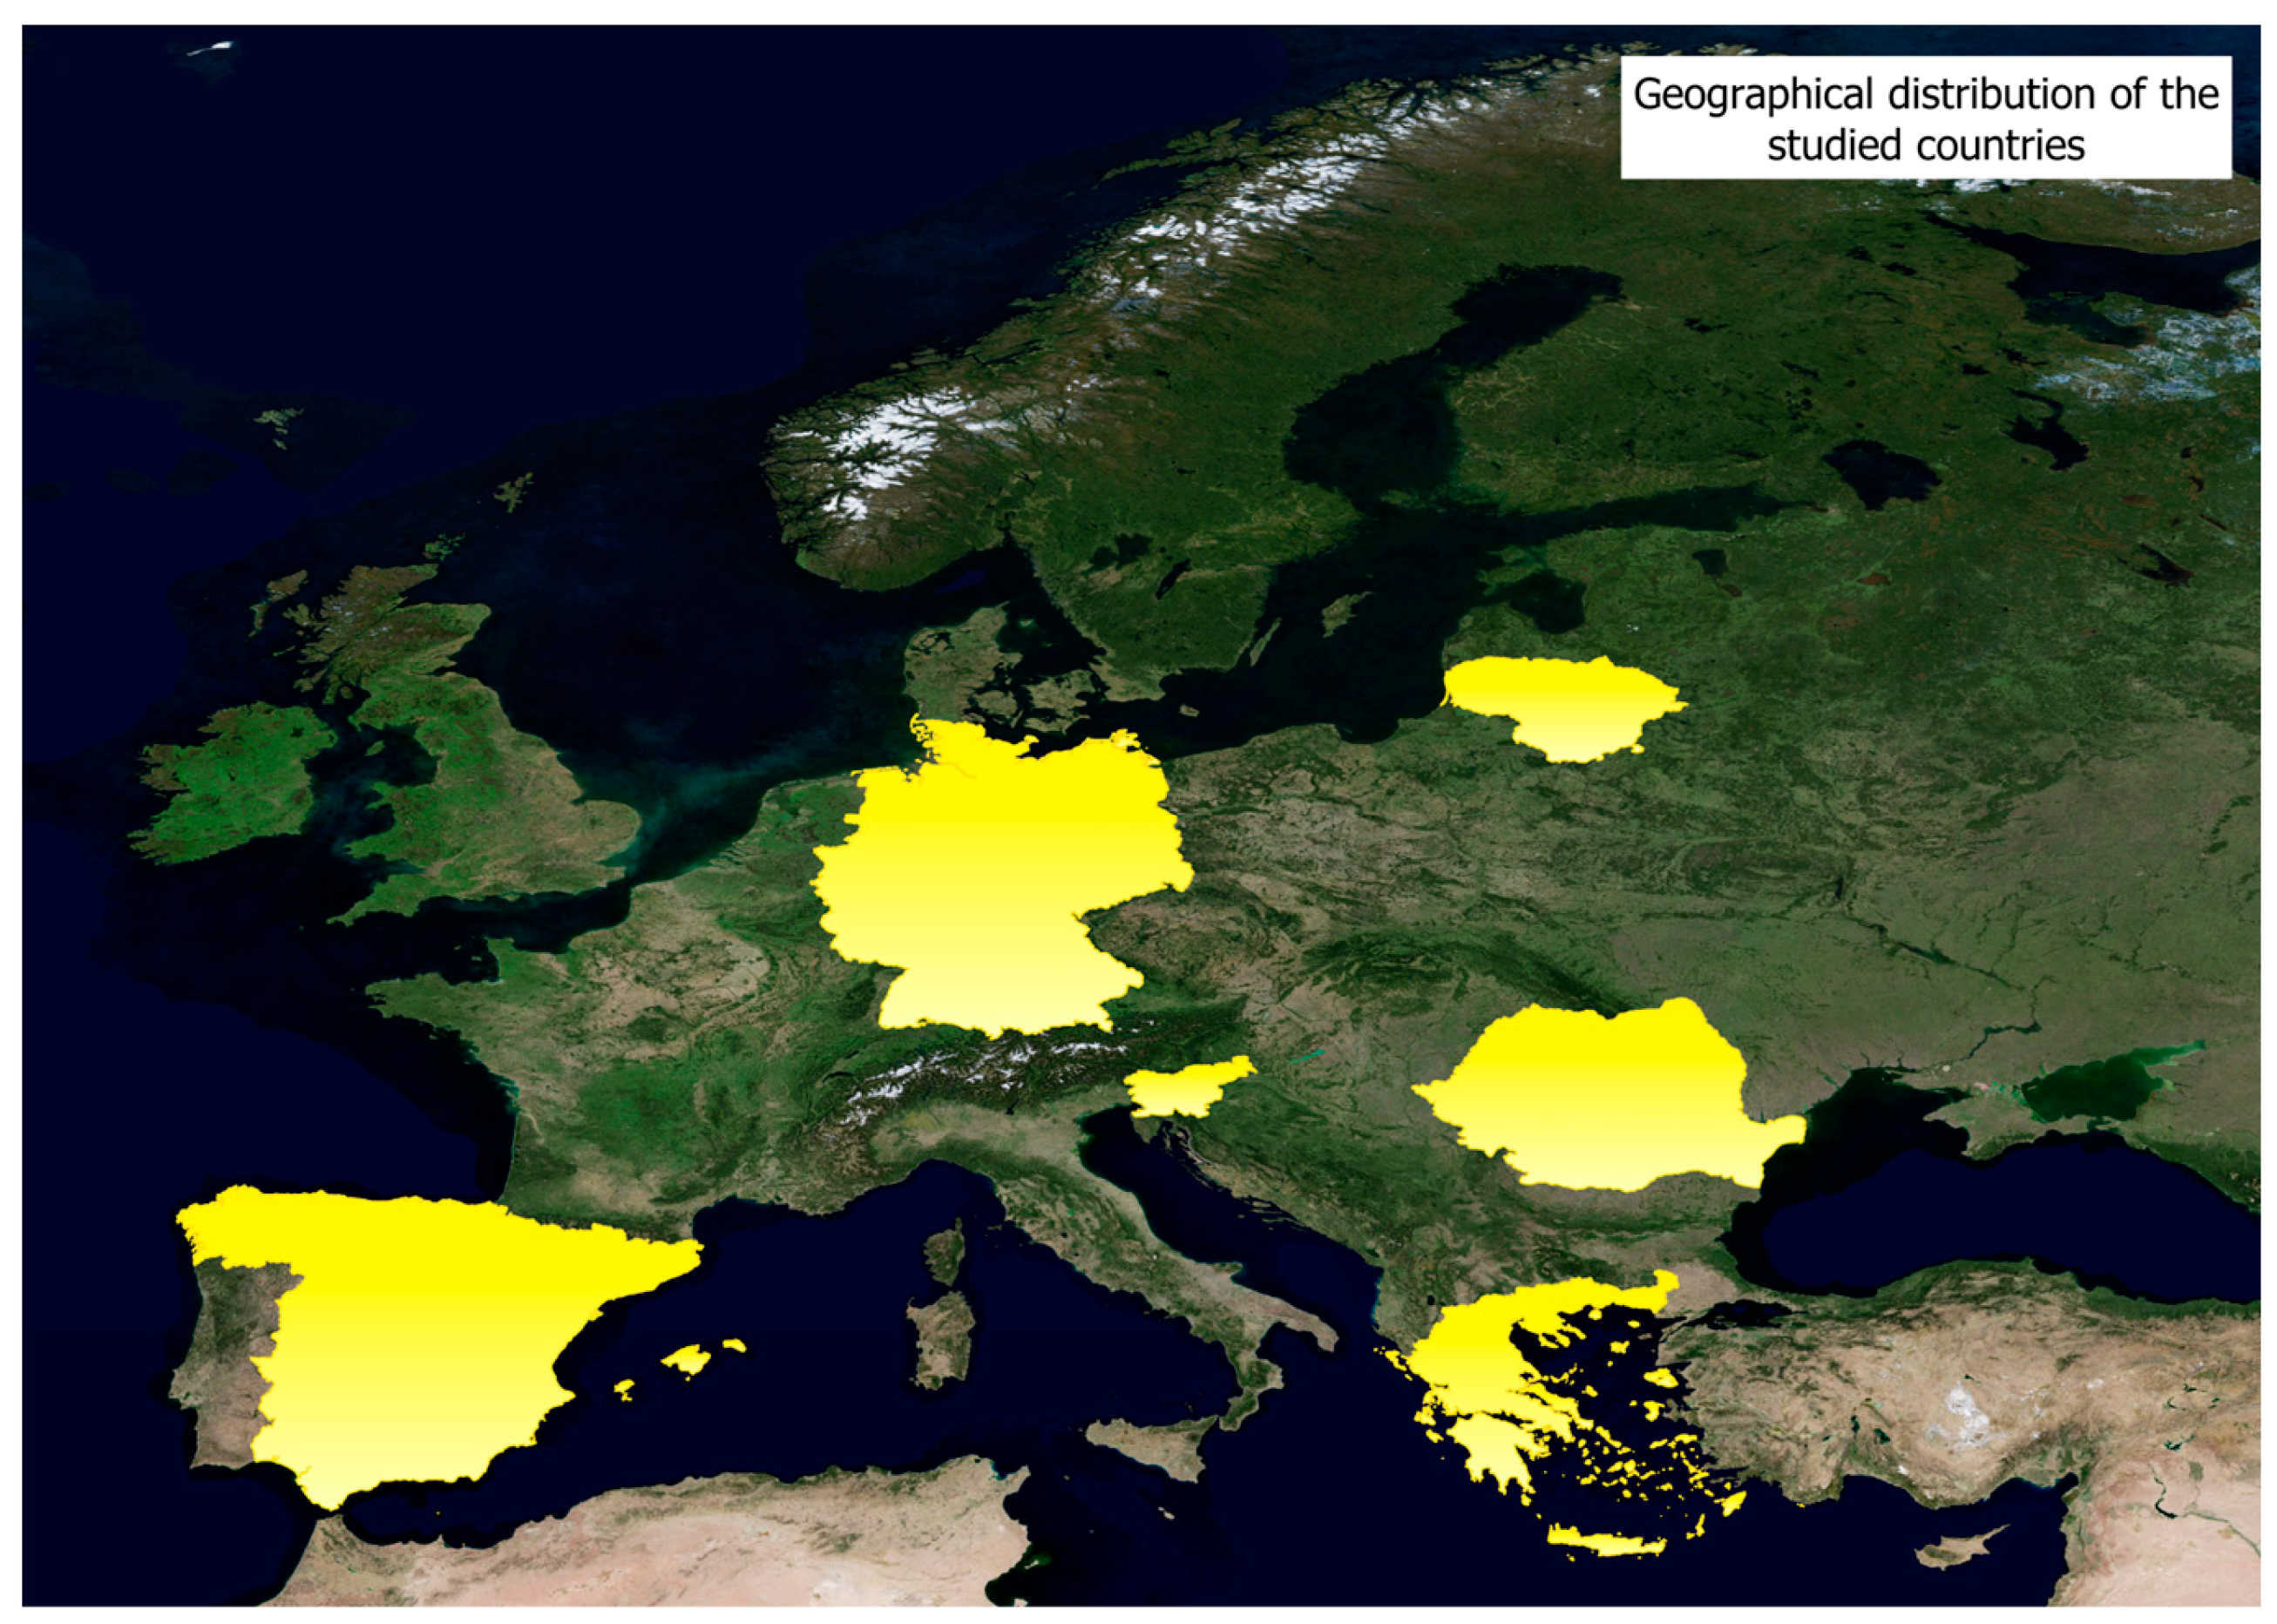
For the original data for the Consumer Price Index, we used the Core Consumer Price Index data from the Word Bank Database, an indicator that does not include the volatile Food and Energy price index (Word Bank: A Cross-Country Database of Inflation, https://openknowledge.worldbank.org/bitstream/handle/10986/30657/InflationChartsAll.zip, accessed on 7 December 2022). We chose six European countries: Germany and Slovenia from the Central Europe zone, Romania and Lithuania from East Europe and, separately, Greece and Spain as Mediterranean countries, to proceed to the comparative analysis of their Price Index variation. The geographical distribution of the studied countries is evidenced in Figure 2.
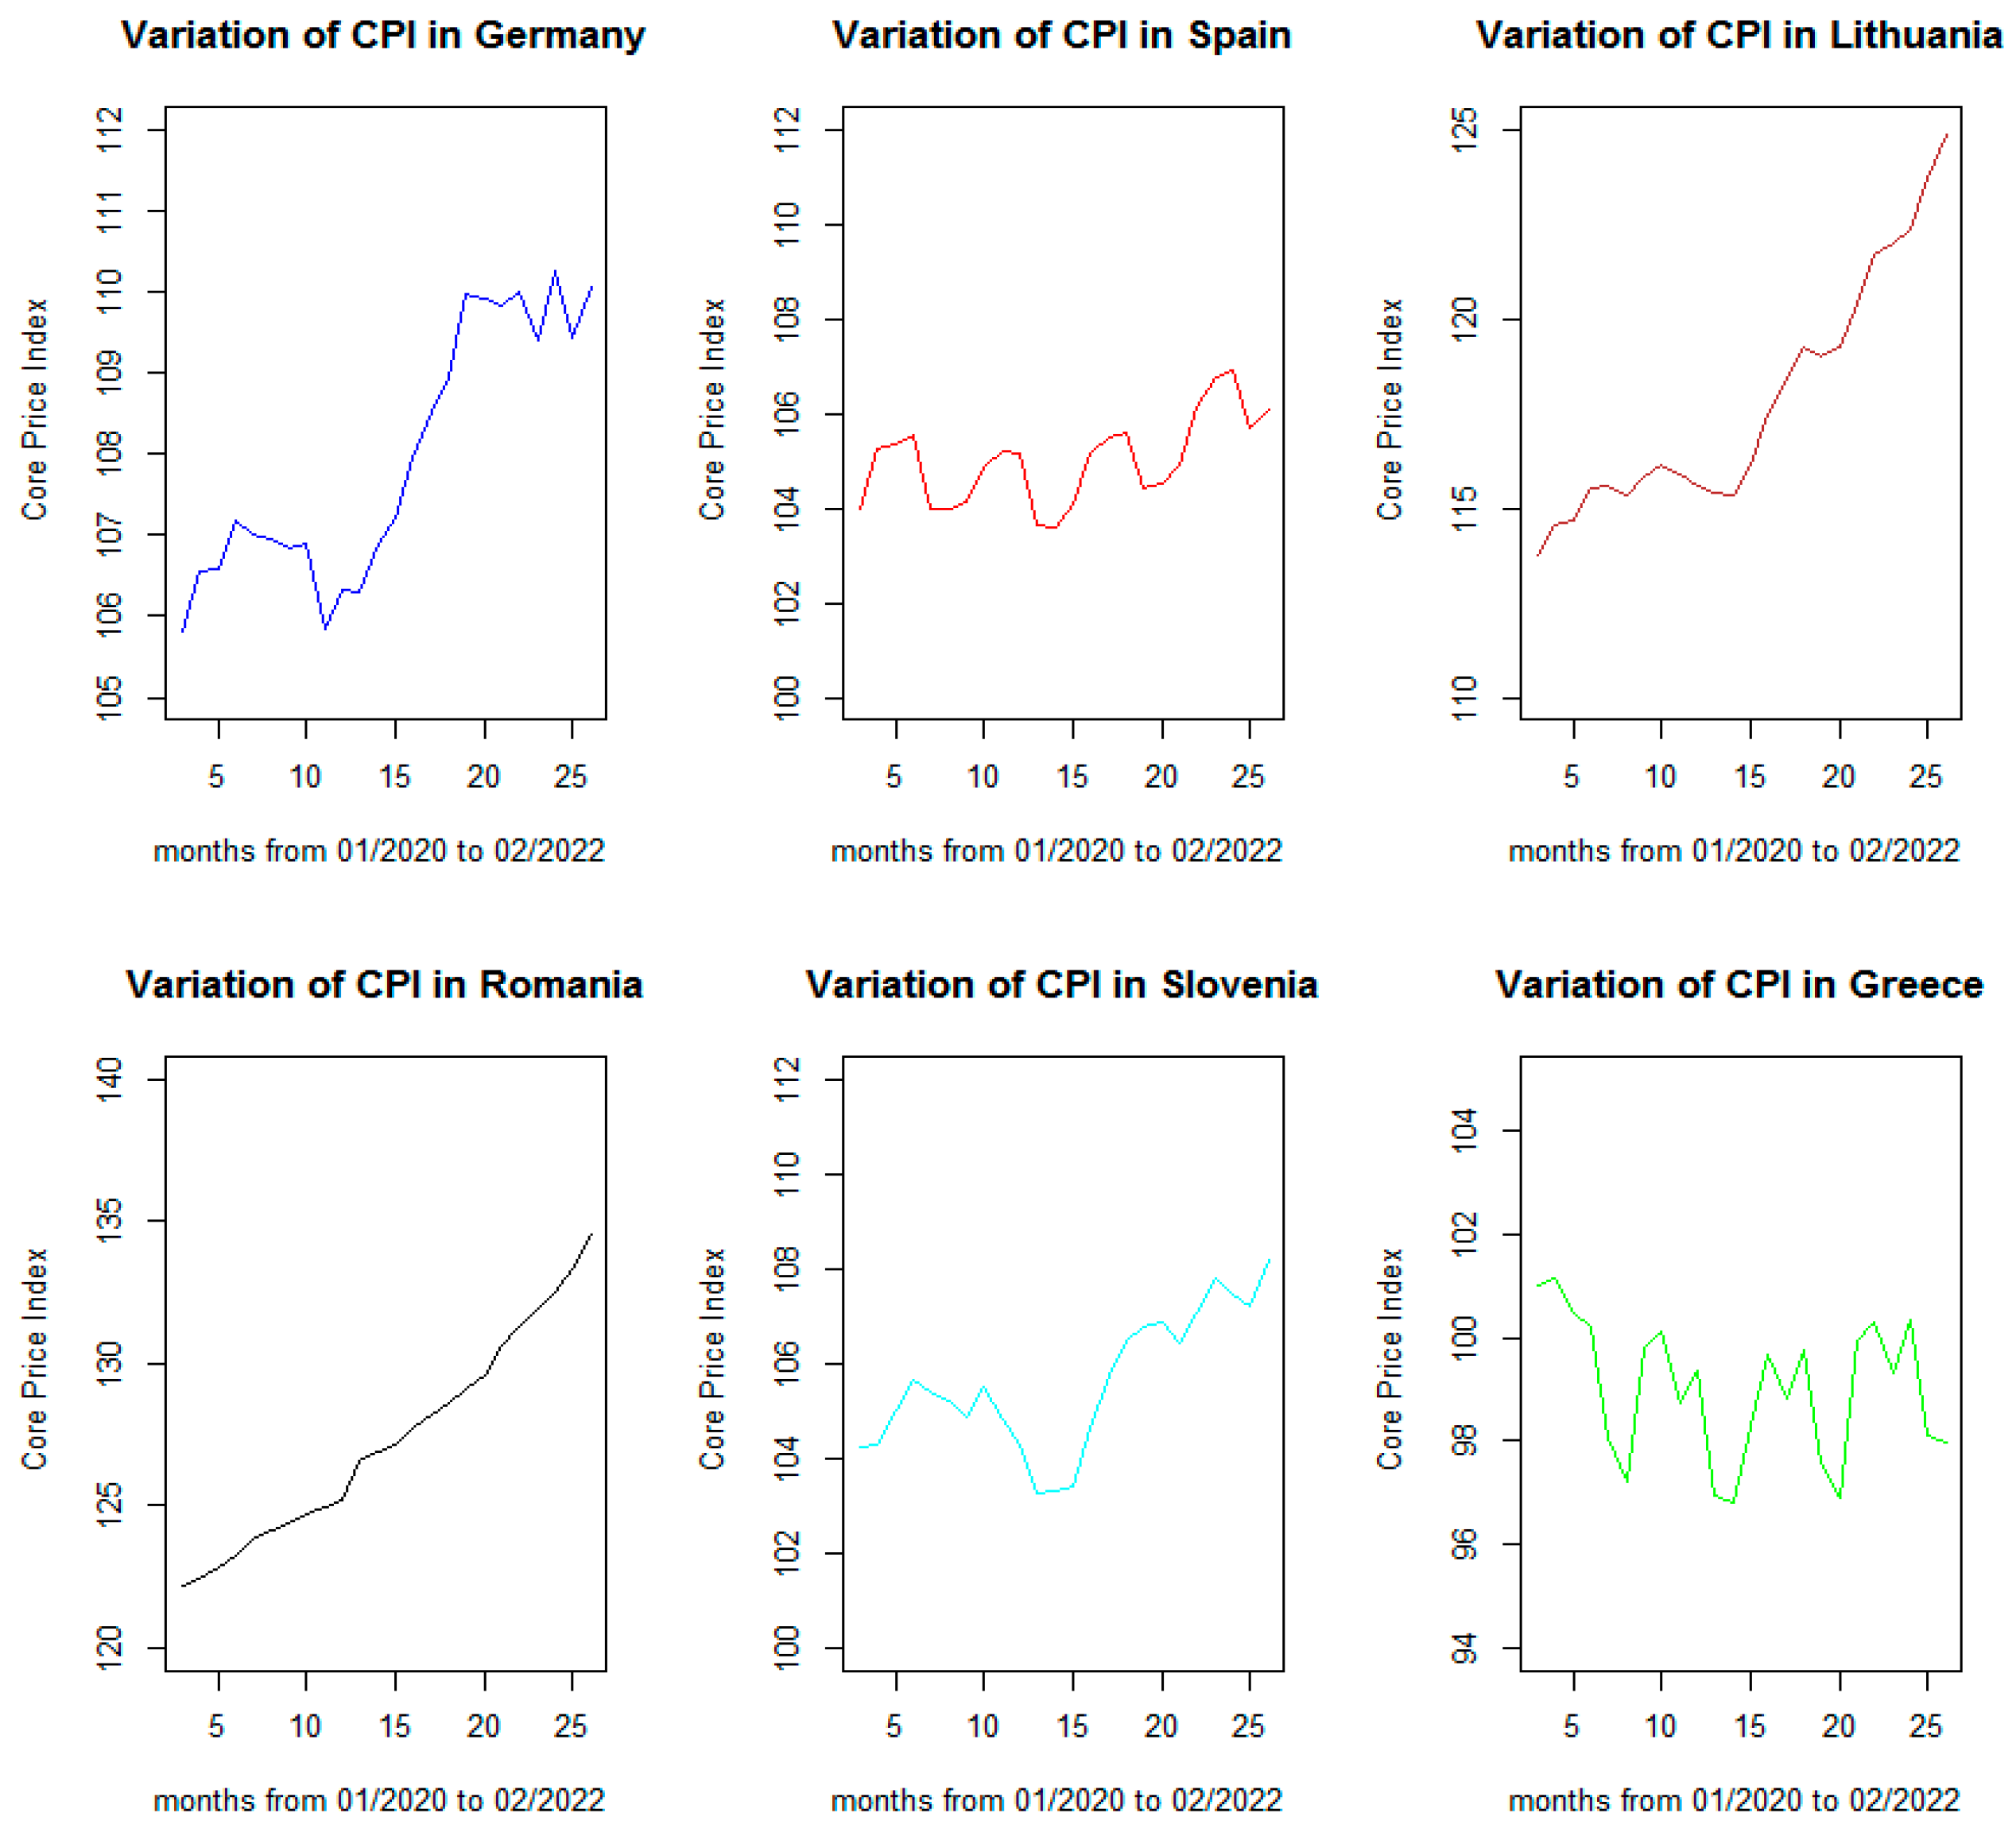
The evolution of the CPI for these countries in the last two years is represented in Figure 3, where the horizontal axis counts the number of months starting with 1 January 2020.
As evidenced by previous works, the epidemiological status of the pandemic was marked by periods of sharp increases in the total number of active infections, followed by gradual declines [22]. This behavior will be referred to as pandemic waves.
From the analysis of the graphs, it is easy to see, in the case of the Western European countries (Spain, Germany, Slovenia), a staggered overlap of the increase in consumer prices with the four pandemic waves, defined for the periods: March–June 2020 (corresponding to months 3–5 from the graphs), October–December 2020 (months 10–12), March–May 2021 (months 15–17), and September–November 2021 (months 21–22). In the case of Romania and Lithuania, the increase in prices is much more uniform, with a significant gap between May and October 2021. In the case of Greece, there is a small decrease in consumer prices superimposed over the four waves of COVID-19 restrictions. The economic impact of the COVID-19 pandemic was also shown in other articles, and our findings are consistent with previous results [23,24,25].
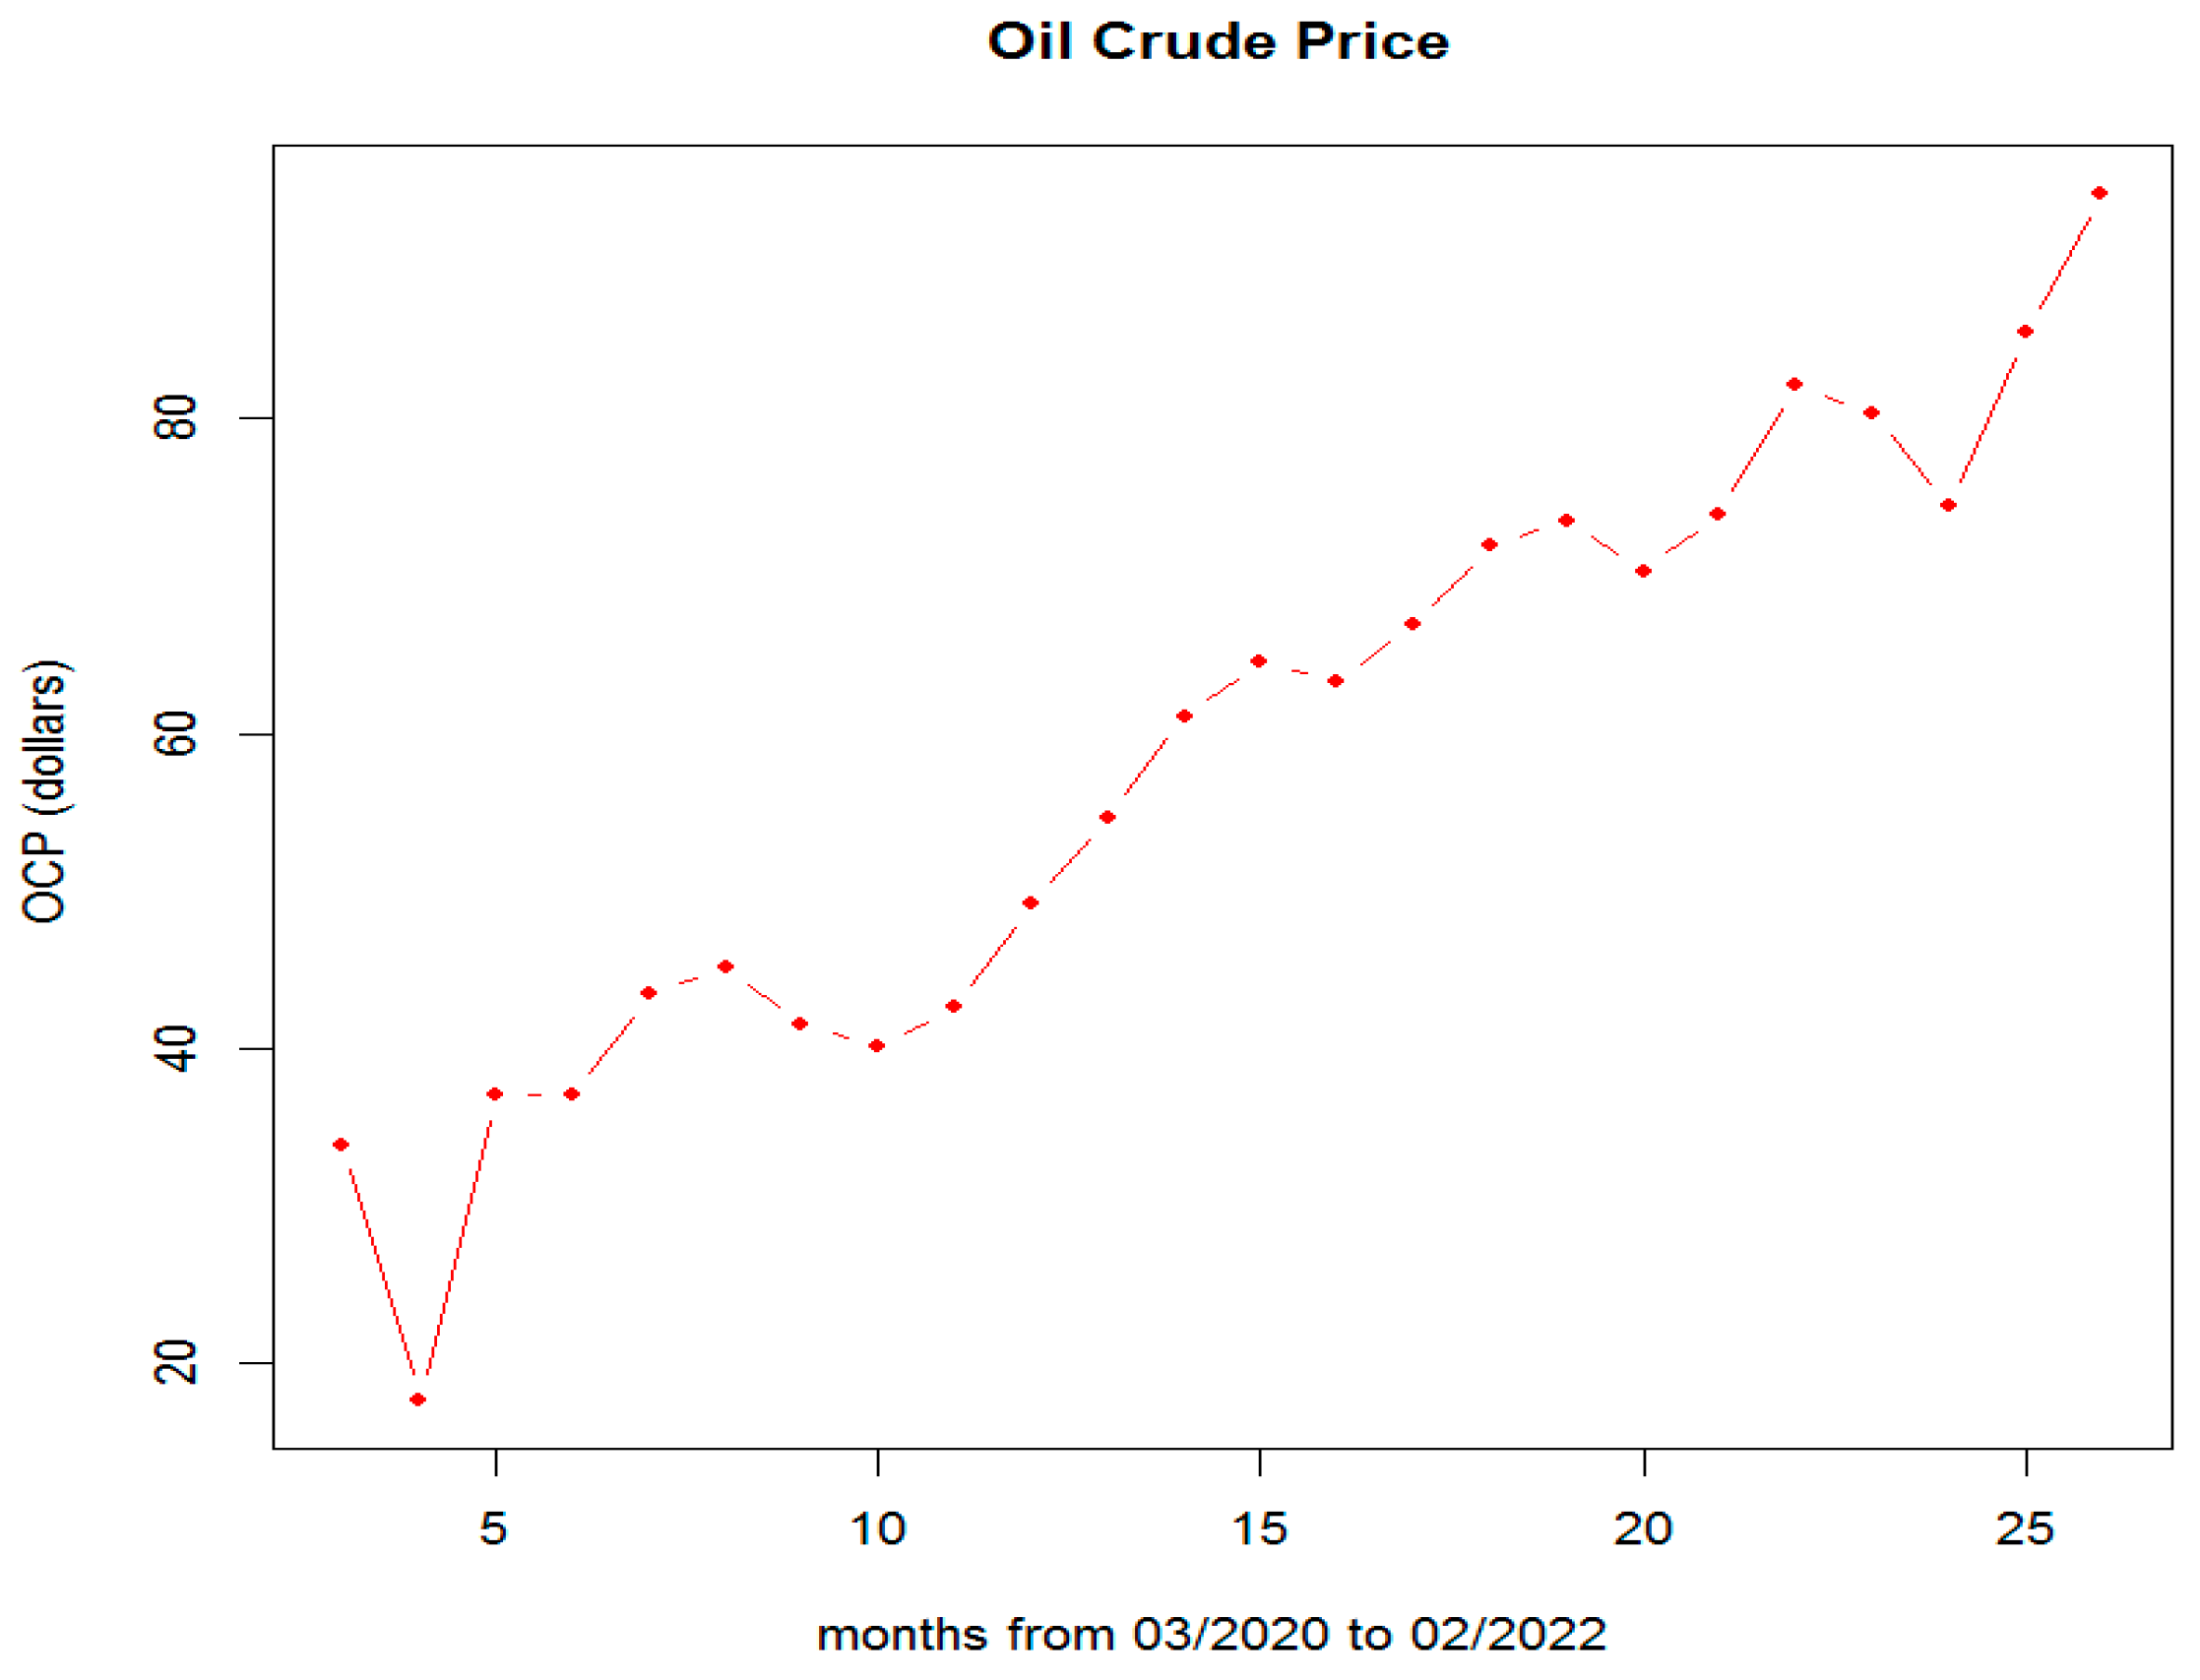
The original data for the OPEC crude Oil basket Price variation were retrieved from the Statista site [26], as shown in Figure 4. The first pandemic wave coincides with a strong reduction in oil demand, reflected by the significant decrease in the price of the oil barrel, followed by an accelerated increase in oil consumption and its price during the period of relaxation of traffic restrictions.
The other three waves of the epidemic induce a slight temporary drop in oil prices, followed by an accelerated rise in barrel prices. The fastest growth occurred between November 2020 and May 2021, and between December 2021 and February 2022.
3. Main Regression Models Proposed
3.1. A Regression Model for the Crude Oil Price Variation
The first step of our investigation was to identify a possible pattern of oil price fluctuations during the pandemic period. Following the above observations, we proposed and tested two statistical hypotheses:
Hypothesis 1.
The global effect of a pandemic crisis is positively related to a general growth of oil prices.
and
Hypothesis 2.
The effect of a pandemic waves restriction can be related to temporary decreasing oil prices.
For the first hypothesis, inspired by a previous work on financial crisis prediction [27], we proposed a regression equation that contains a logistic term of growth, the usual term used to simulate the forced growth of an indicator in conditions of shock or economic crisis:
where OCP is the Crude Oil Price, and T is the time expressed in months. The term Res means the standard residual error of the regression model.
The second hypothesis requires the introduction of a new periodical term justified by the seasonal effect of the COVID epidemic (accentuated in spring and fall). The model is derived from the quasi-periodical behavior of the e-Market during the COVID-19 pandemic, proposed in [24]:
The coefficients were estimated by the least square method, using Stat and NLS nonlinear package in R code:
- (1)
- c0~23.7439
- (2)
- c1~2.022
- (3)
- c2~45.222
- (4)
- c3~4.51
- (5)
- c4~15.02
- (6)
- c5~−2.8042
- (7)
- c6~3.25.
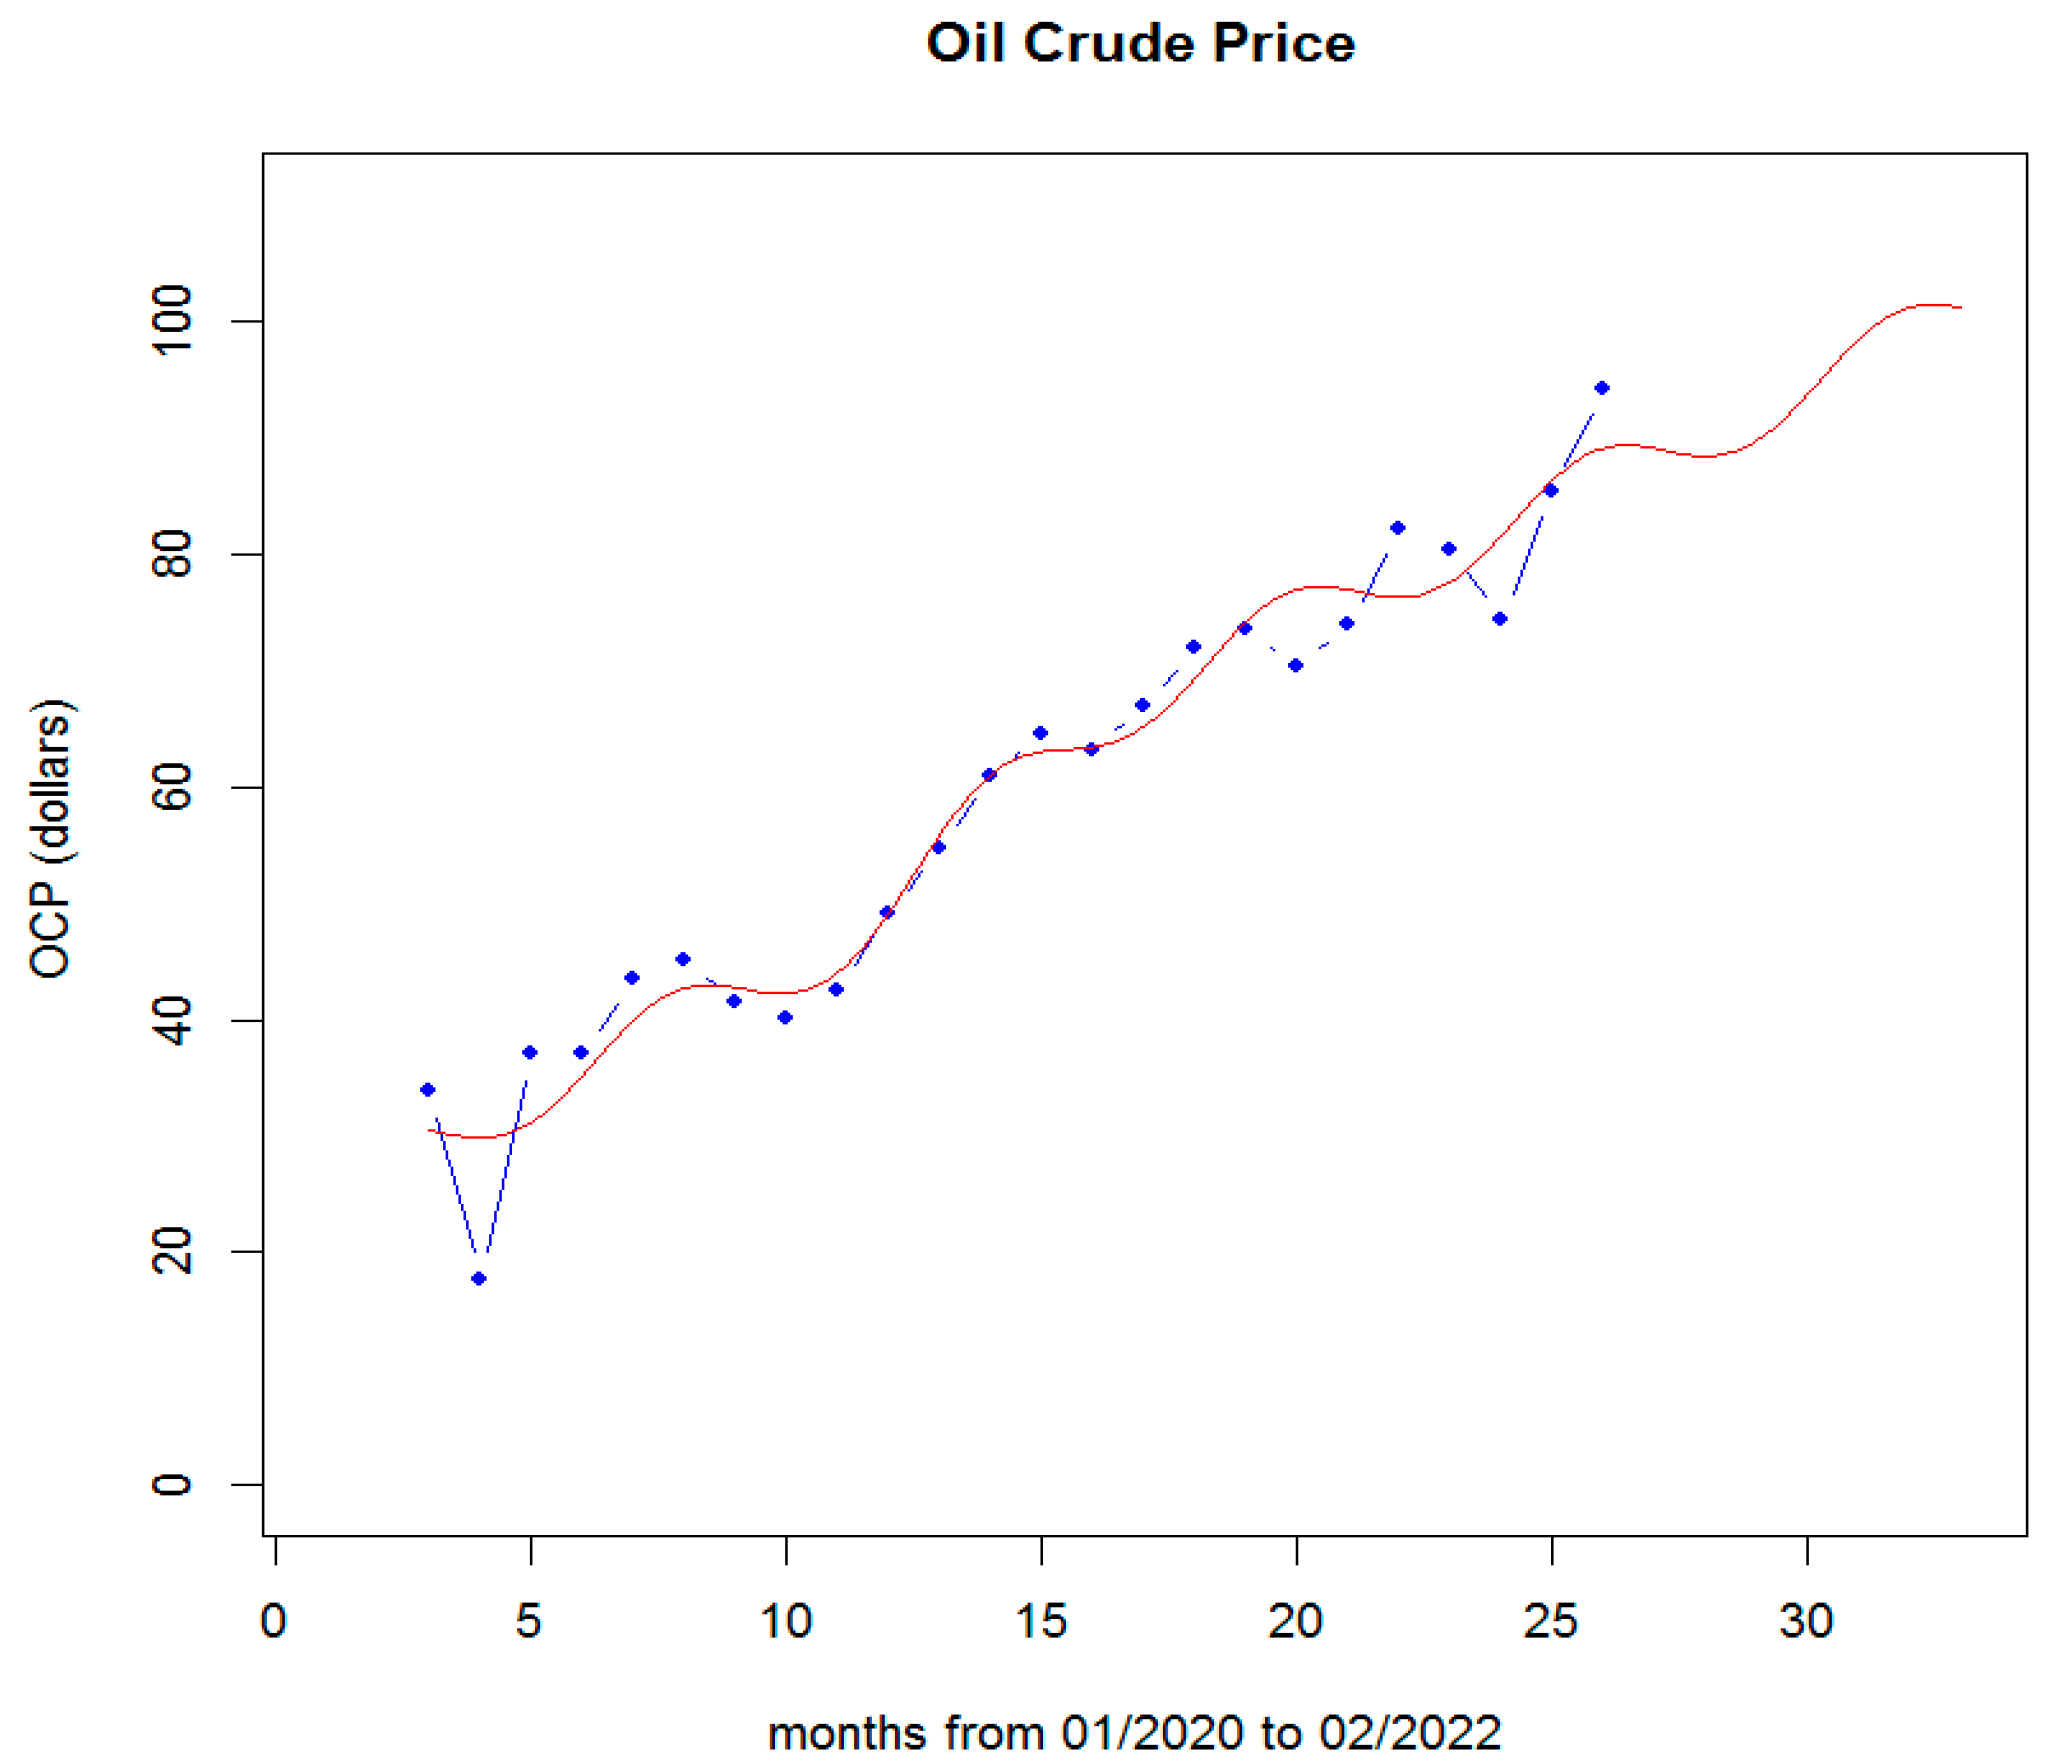
The Fisher test of the relevance of the model resulted in a Fstat = 172.2 > Fcritical = 2.6987 for 6, 17 degrees of freedom respectively. Therefore, the model passed the Fisher test of significance. The coefficients c3 and c6 pass the t-test (Student) of relevance with tvalue(c3) = 1.869 and tvalue(c6) = −2.106, respectively (both greater to tcritical = 1.739, for 17 degrees of freedom with significance level a = 0.05). In consequence, both the logistic terms grown and seasonal one can be considered relevant. In Figure 5, we represented the regression function for the period March 2020–October 2022; the model predicted a maximum Crude Oil Price of around 101.5 dollars in July–August 2022.
Notable is the fact that the model does not take into consideration the eventual political decision of OPEC to raise or reduce oil production [28,29], nor of Russia’s political influence on oil prices or, alternatively, the demand-side alteration of countries in the EU towards Russian petroleum [30,31], which can be seen in the last months of the data simple The negative value of the c5 coefficient corresponds to a reduction in the rate of increase of the oil price.
3.2. The Regression Models of the Consumer Price Index
The CPI evolution for the six considered countries (Germany, Spain, Slovenia, Romania, Lithuania, and Greece) differs greatly from one case to another. Since we are interested in the dependence of the Core Price Index (without the volatile components introduced by the change in food or energy prices) on the succession of pandemic waves, we chose to start the analysis with the case of Spain, where the CPI’s dependence on restriction periods is very pronounced.
Our statistical assumption is formulated as follows:
Hypothesis 3.
The Consumer Price Index, measuring the direct increase of goods price, is positively related to a general variation of oil prices, the temporary effect of pandemic wave restriction, and the cumulated economic effect of COVID pandemic psychological consequences.
To model the pandemic wave’s temporary effect, we use a periodical function, justified by the regulated periodical apparition of new variants of the COVID virus. The cumulative effect was modeled by a logistic function, characteristic of any economic crisis. We included the oil price as a new dependent variable. The proposed regression equation is:
where OCP is the oil international price, the time T is expressed in months starting with January 2020, and Res means the residuals. The 3rd term represents the periodic pandemic wave macro-economic influence, and the 4th the logistic economic crisis.
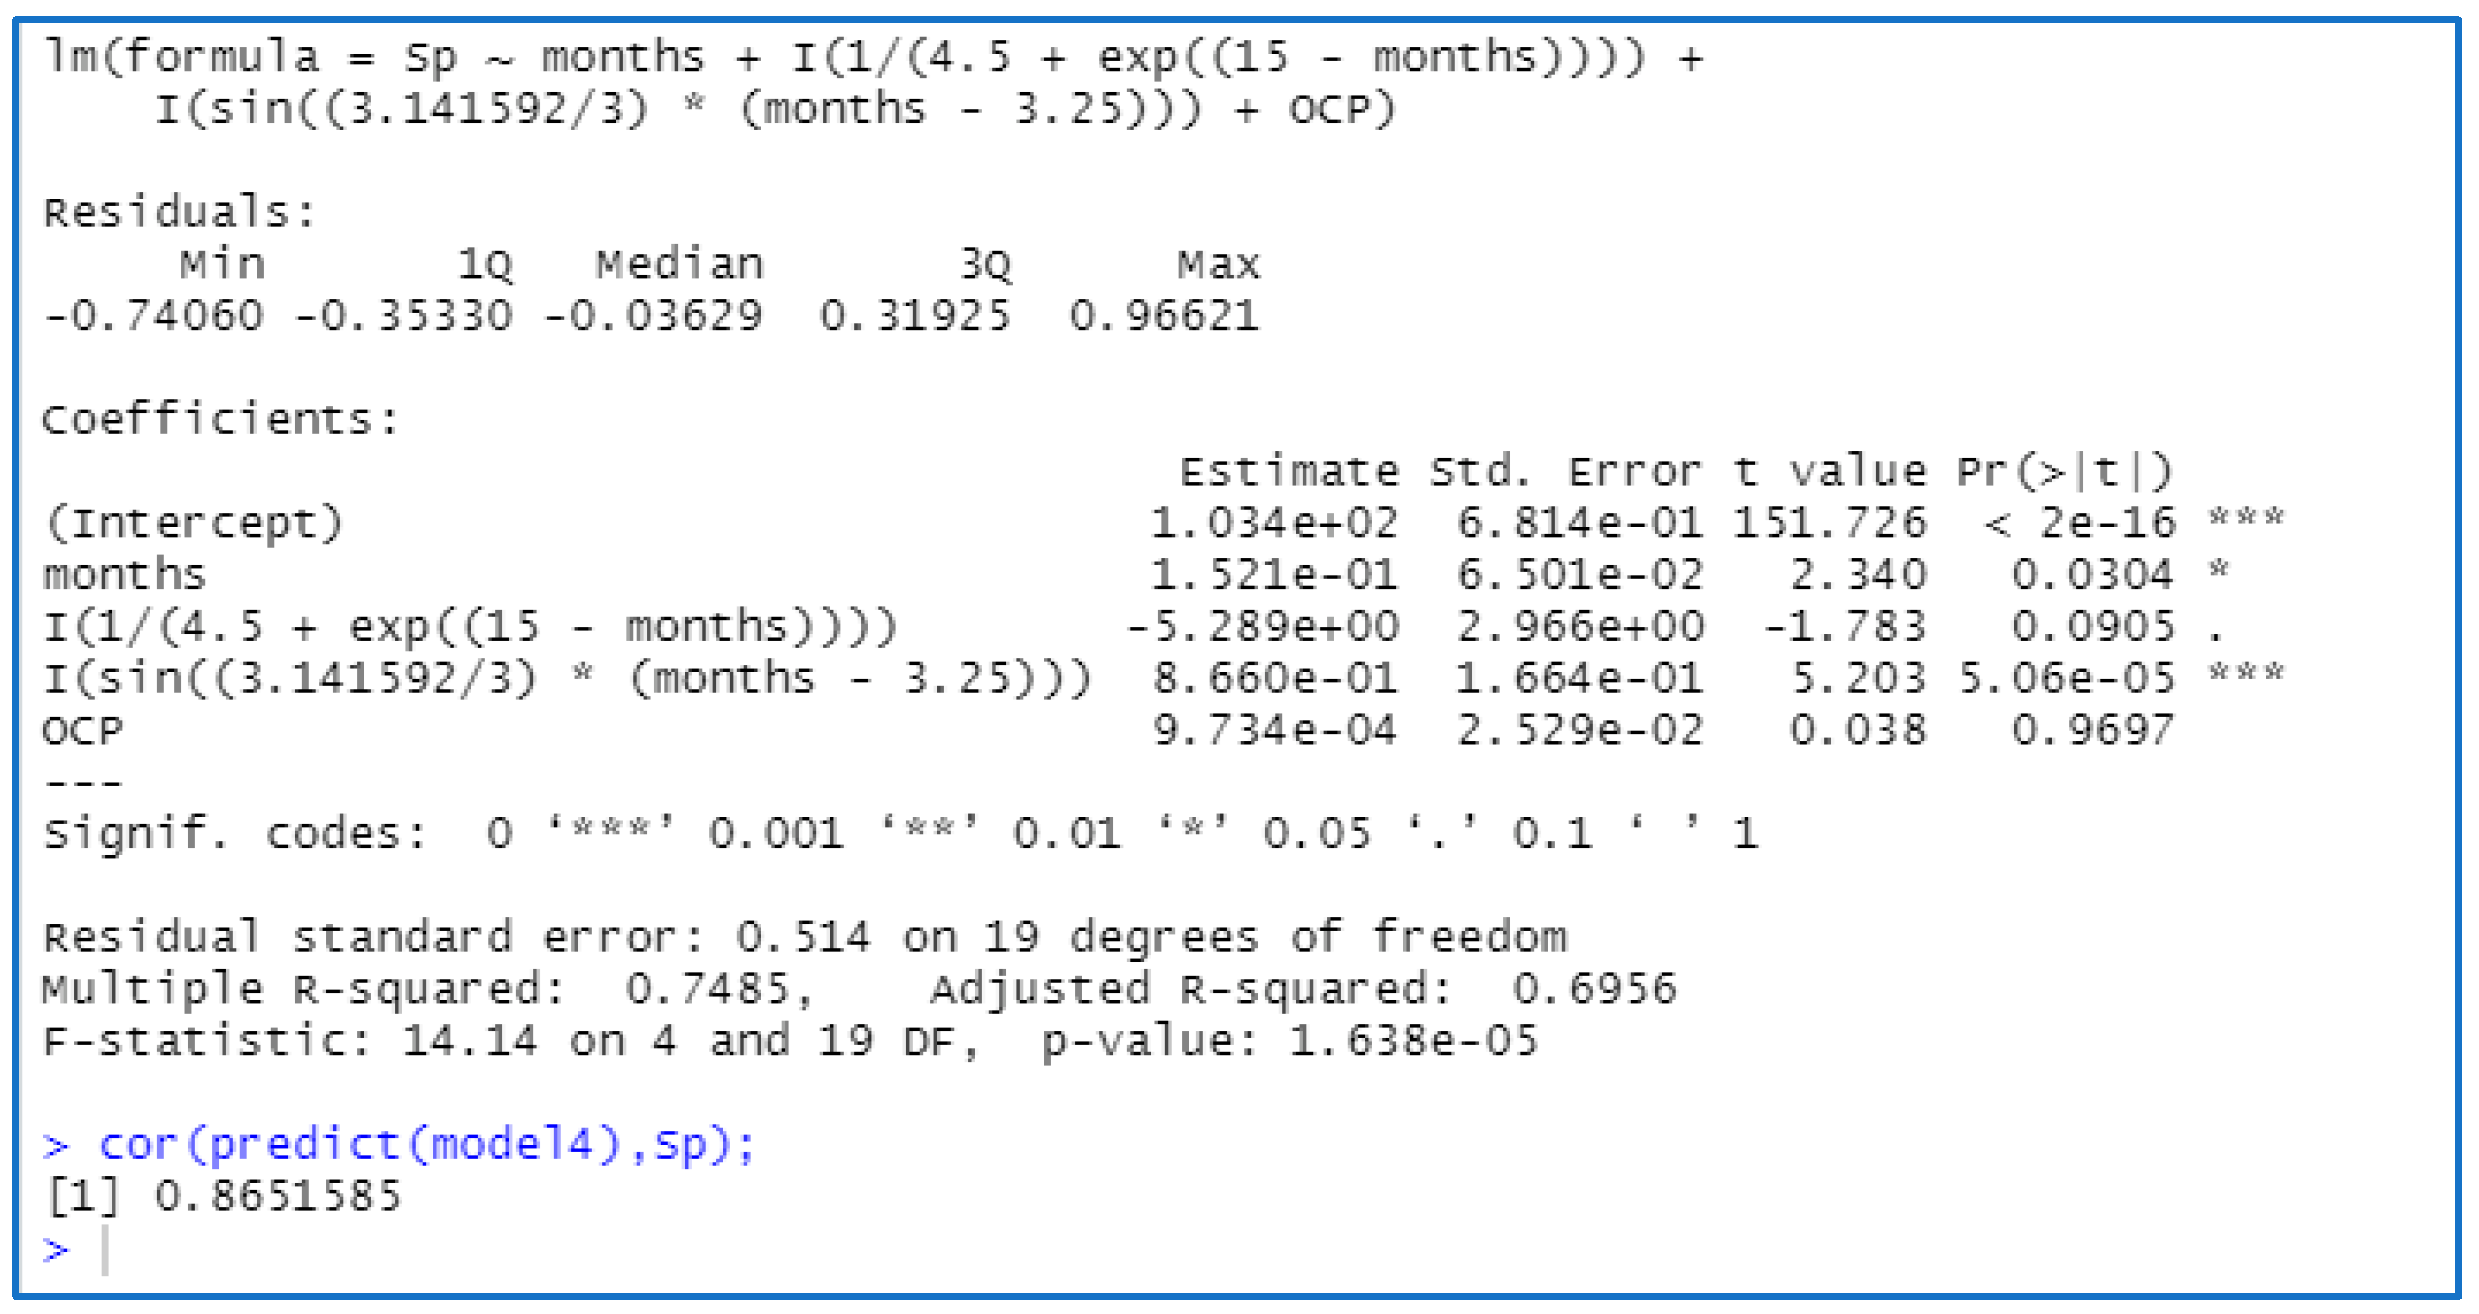
The estimation of the coefficients a0–a7 was performed in R code language (version R X64 4.0.3). First, the estimation of a3, a5, and a6 using the NLS package, after the estimation of the remaining coefficients using the Stat package. The method employed was the less square residual: the optimization of minimal average residuals. For example, we have presented in Figure 6 a screenshot of the results provided by the R tool. Each coefficient is first estimated by the least squares method, R also displaying the error of the estimate, the value of the t indicator for the student’s test to be revealed of each coefficient, the probability that this coefficient is ignored, the estimated values for R-square and Adjusted R-square indicator, as well as the results of the Fisher test on the significance of the model (given by the probability of the null hypothesis) at the end. The last line represents the correlation between the data predicted by the model for the CPI and the initial values.
After the computation, the coefficient a7 had tvalue(c8) = 0.038 << tcritical~1.74; therefore, the last term contribution to the regression equation is irrelevant (CPI dependence on oil price is negligible).
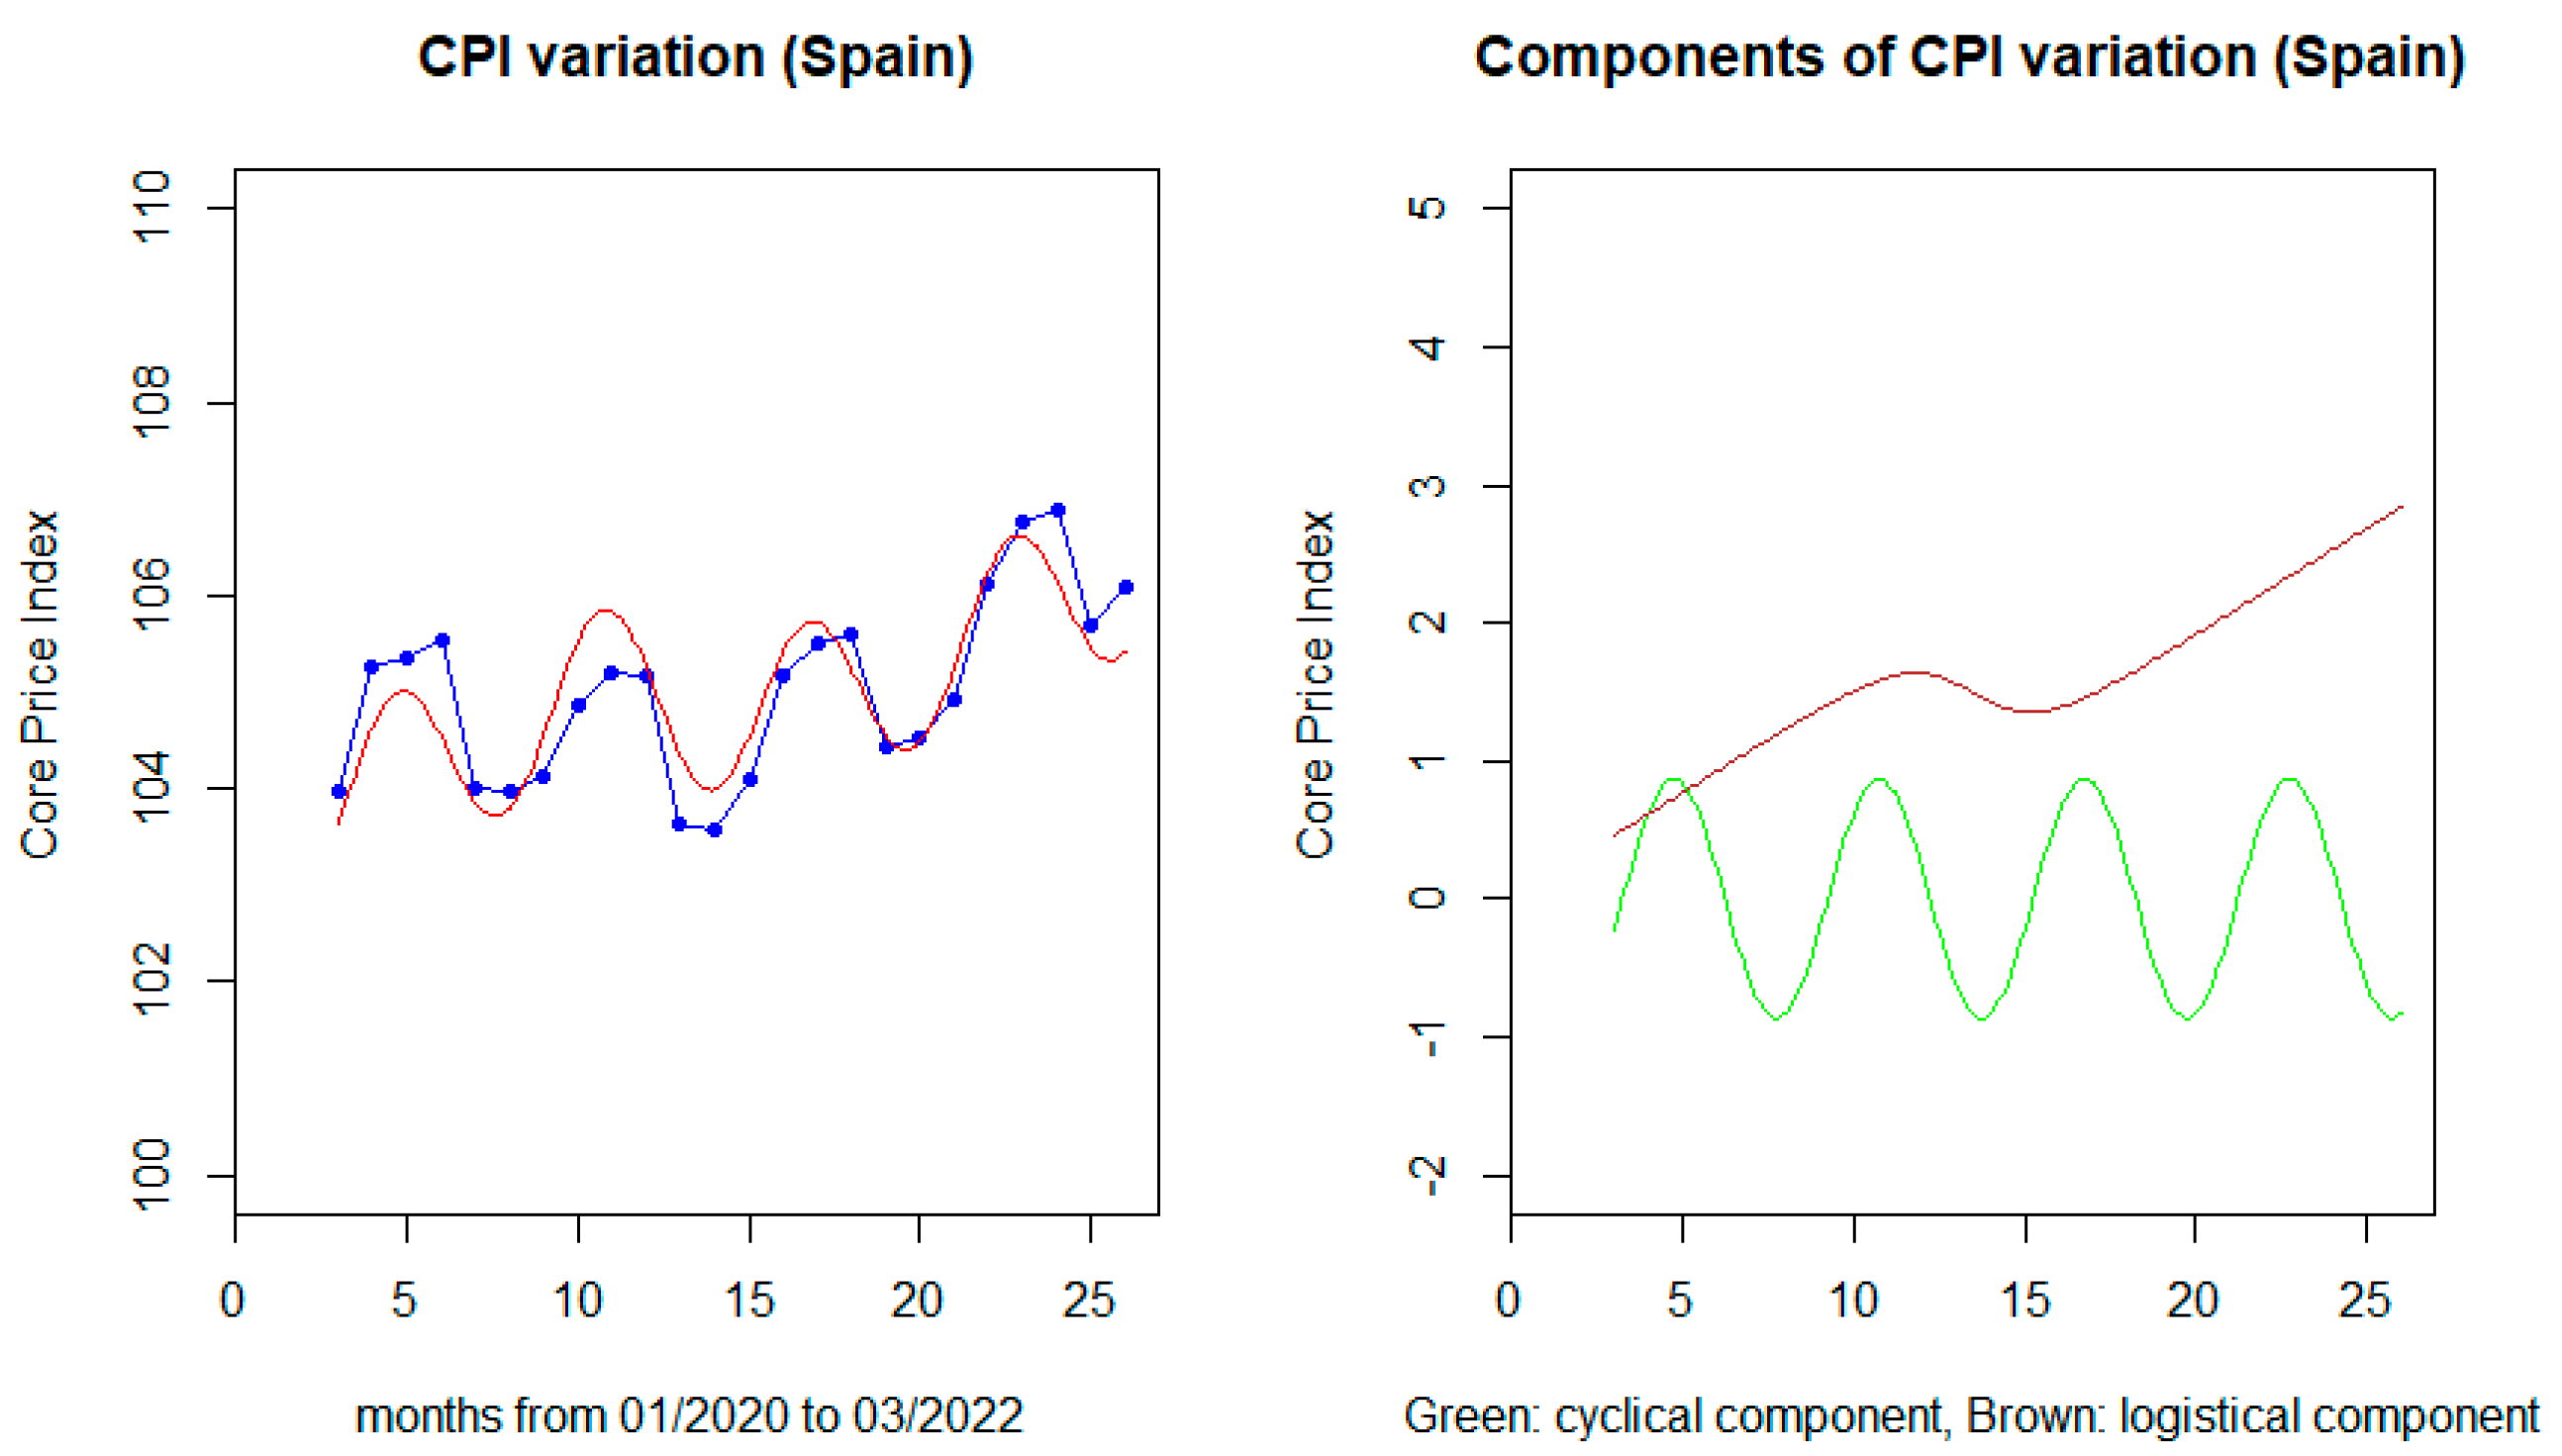
The final regression equation is the following, as shown in Figure 7:
We represented separately the direct dependence of Consumer Price Index on cyclical pandemic waves (in green, in the right graph) and the dependence of CPI on global economic crisis as a logistical component (in brown). The model passes the Fisher test of significance (Fstatistic = 19.84 > F6,18 = 2.698).
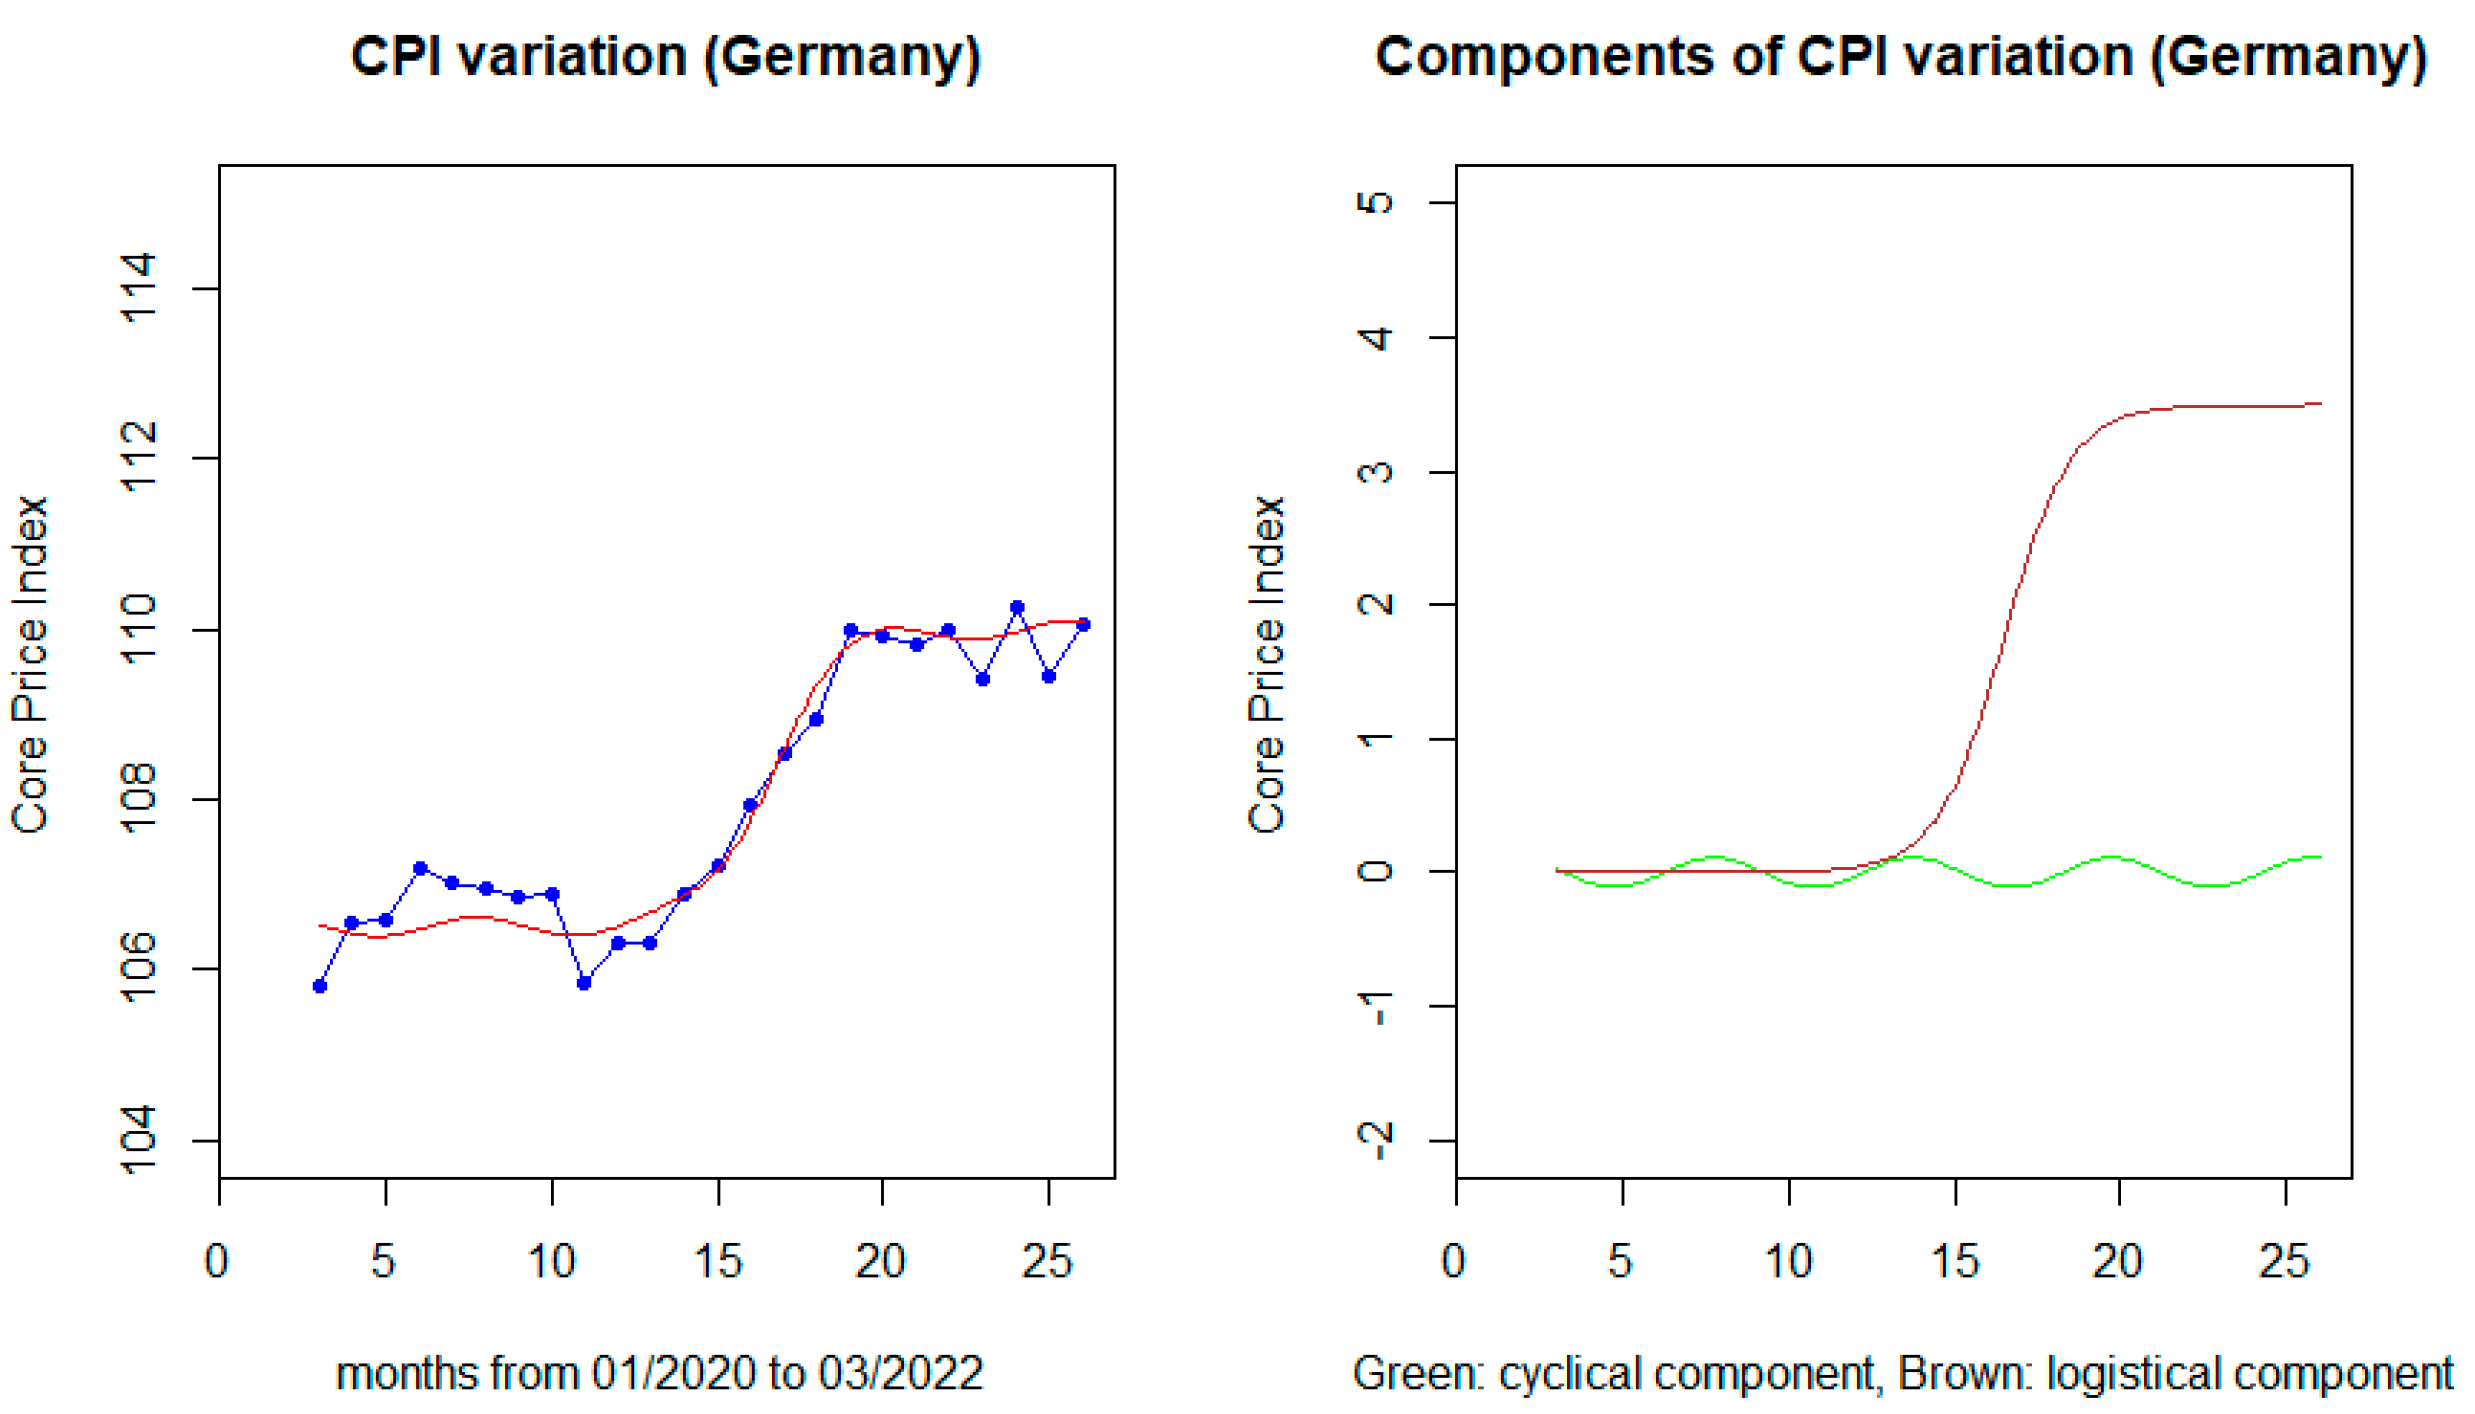
In the case of Germany, as seen in Figure 8, using the same regression Equation (3), one obtains:
(With Fstatistic = 121 > F6,18 = 2.698 for the Fisher test; then, the model is significant).
Contrary to the case of Spain, for Germany, the periodical component of the regression model has a tiny contribution.
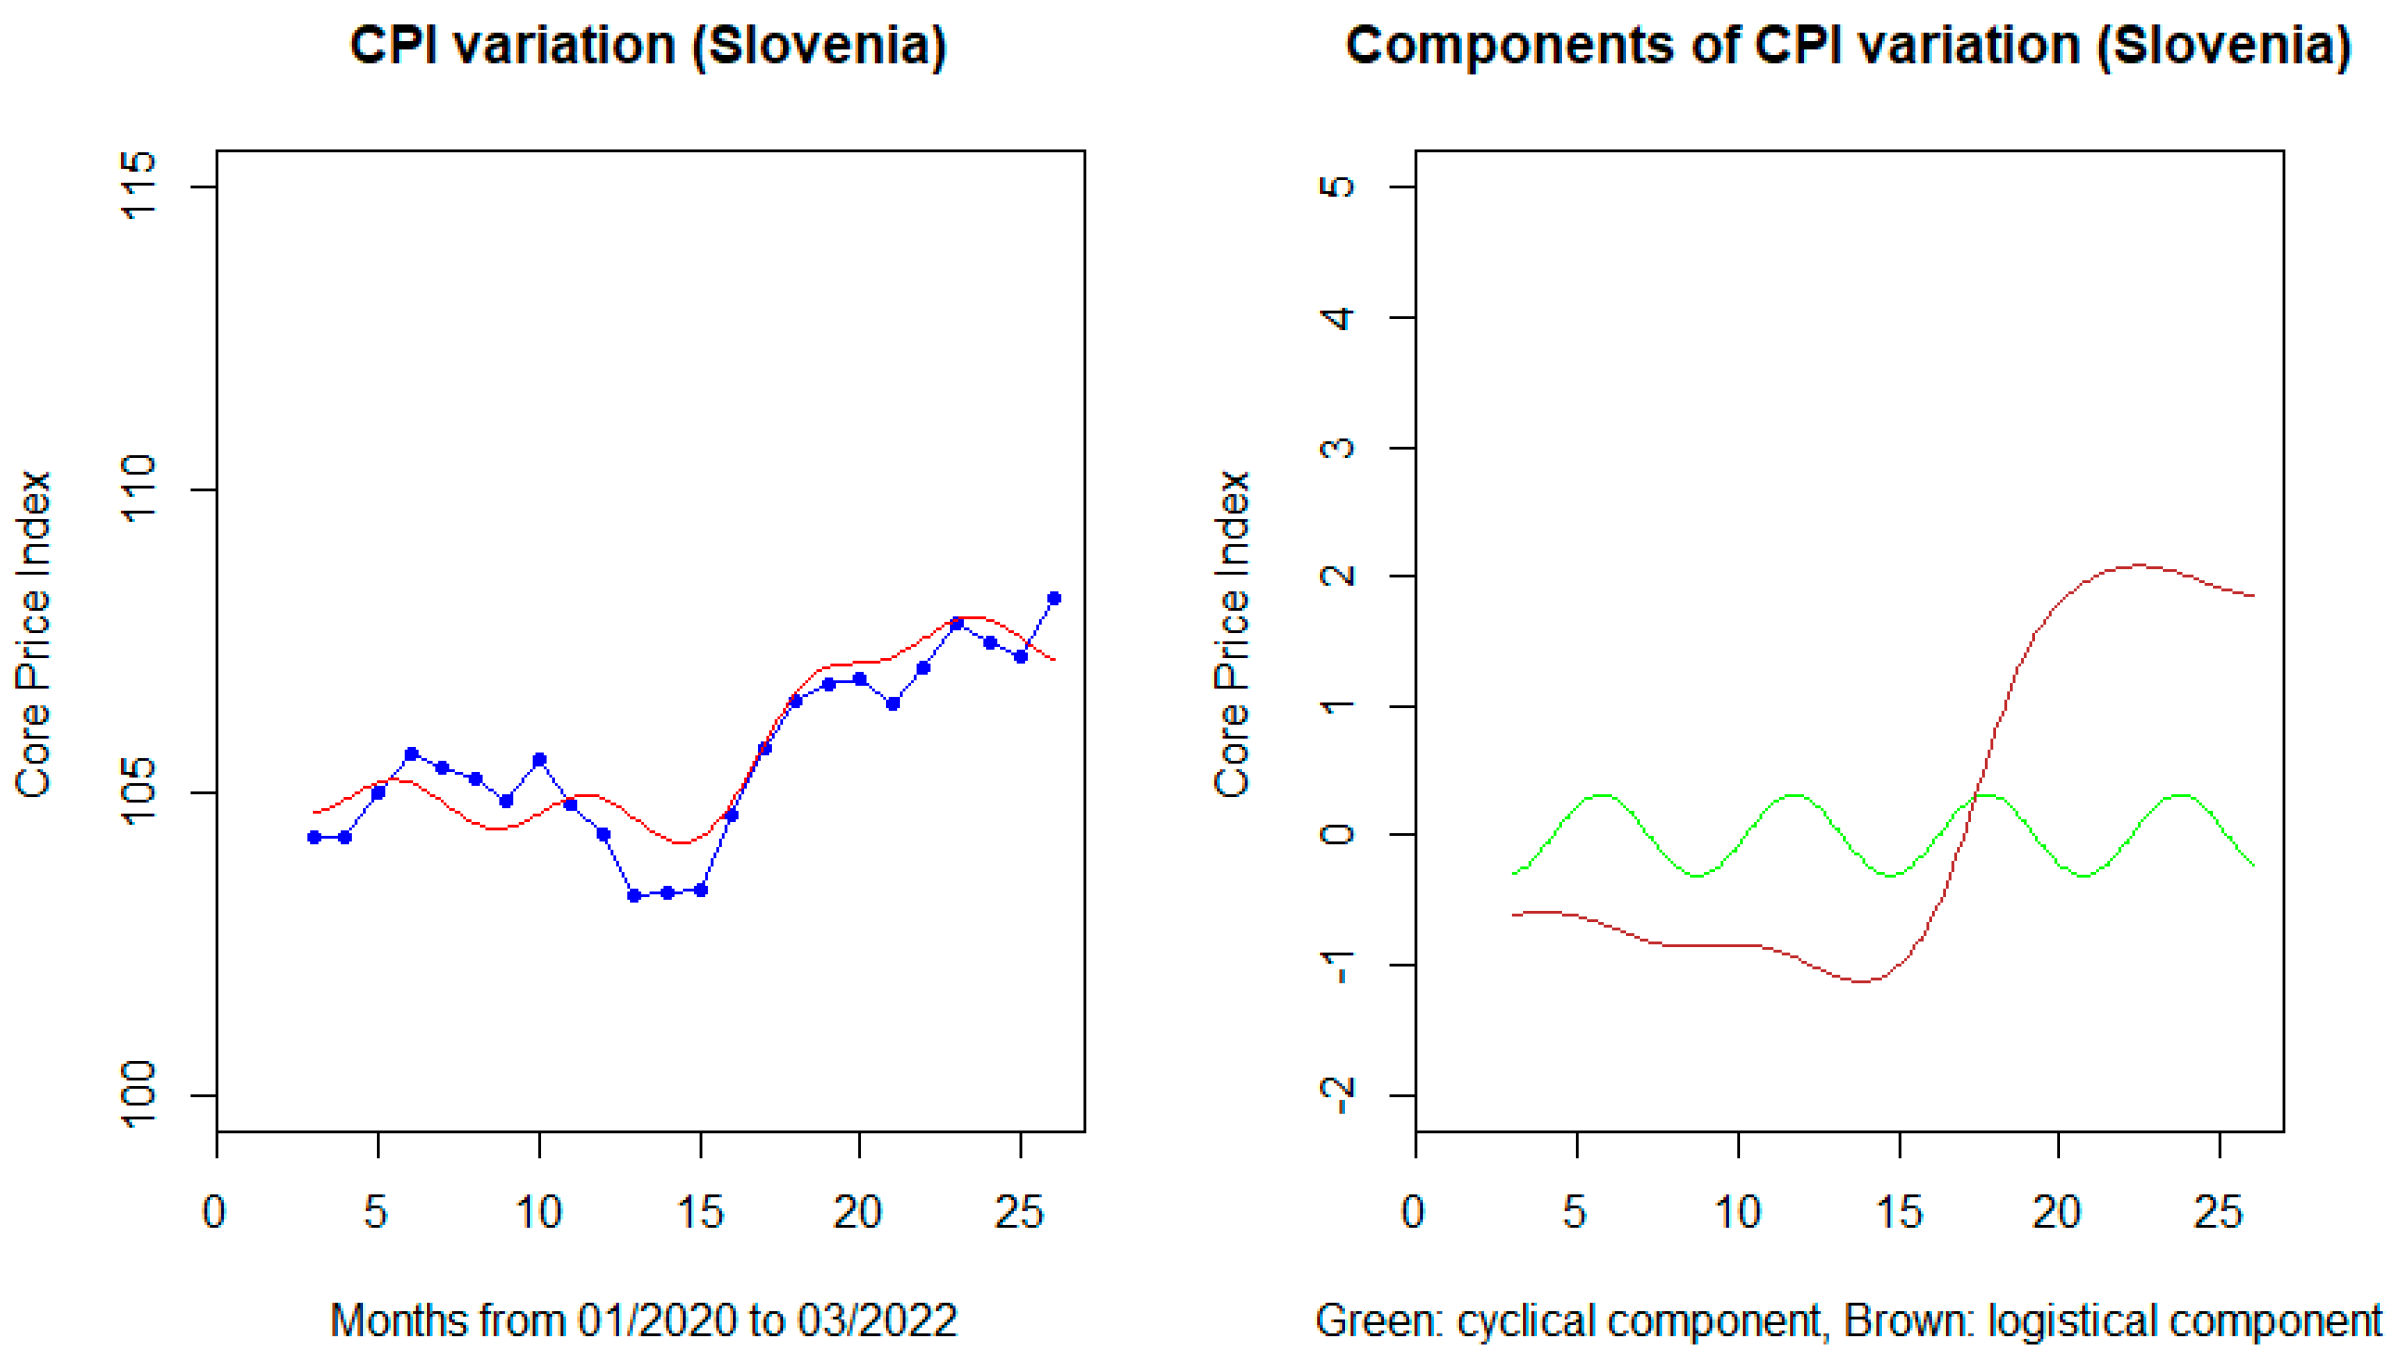
For Slovenia, the same model (3) gives the coefficients:
The model passes the Fisher test of significance, with Fstatistic = 29.46 > F7,17 = 2.657 (see Figure 9). In the case of this model, there is a direct dependence on oil price.
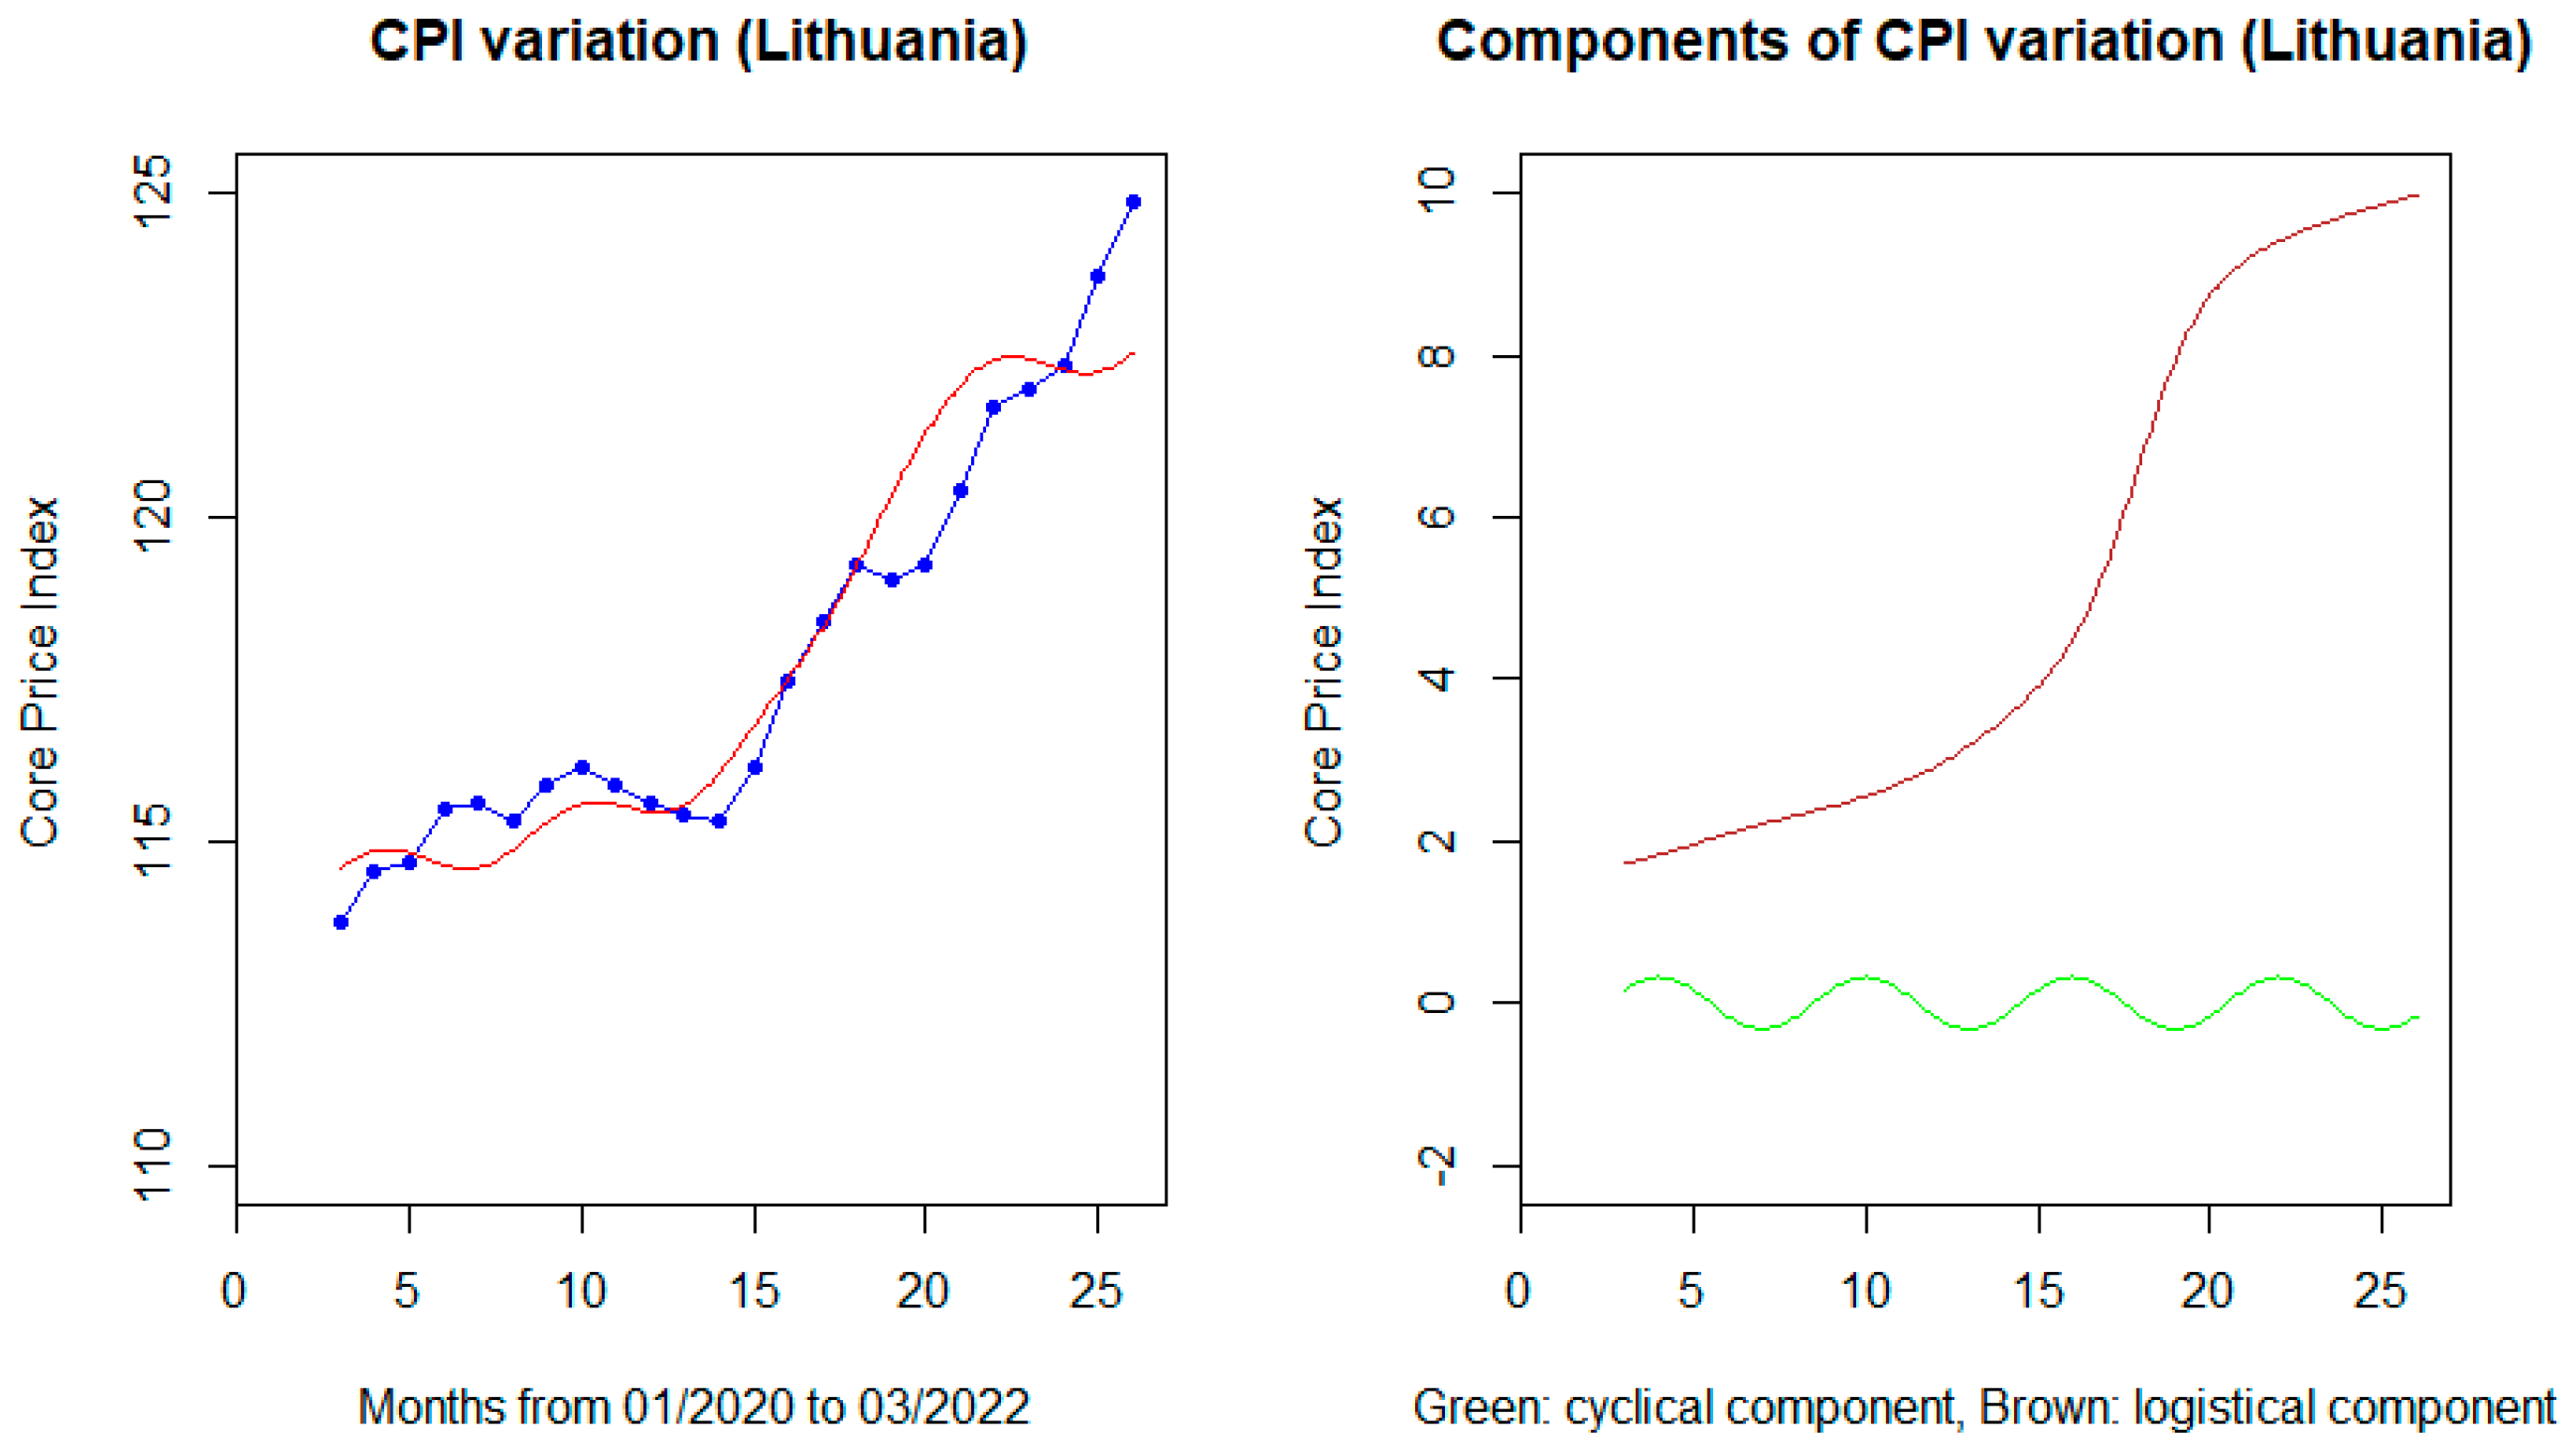
In the case of Lithuania (Figure 10), the least square method produces the coefficients:
(Fstatistic = 29.46 > F7,17 = 2.657).
We noticed that the CPI dependence on oil prices is more pronounced in the case of Lithuania than in Slovenia (the coefficient of OCP is -0.058 and -0.020, respectively). The regression model does not correctly predict the reduction of the Price index in summer 2021 (months 19–20) and the rise of the prices at the beginning of 2022.
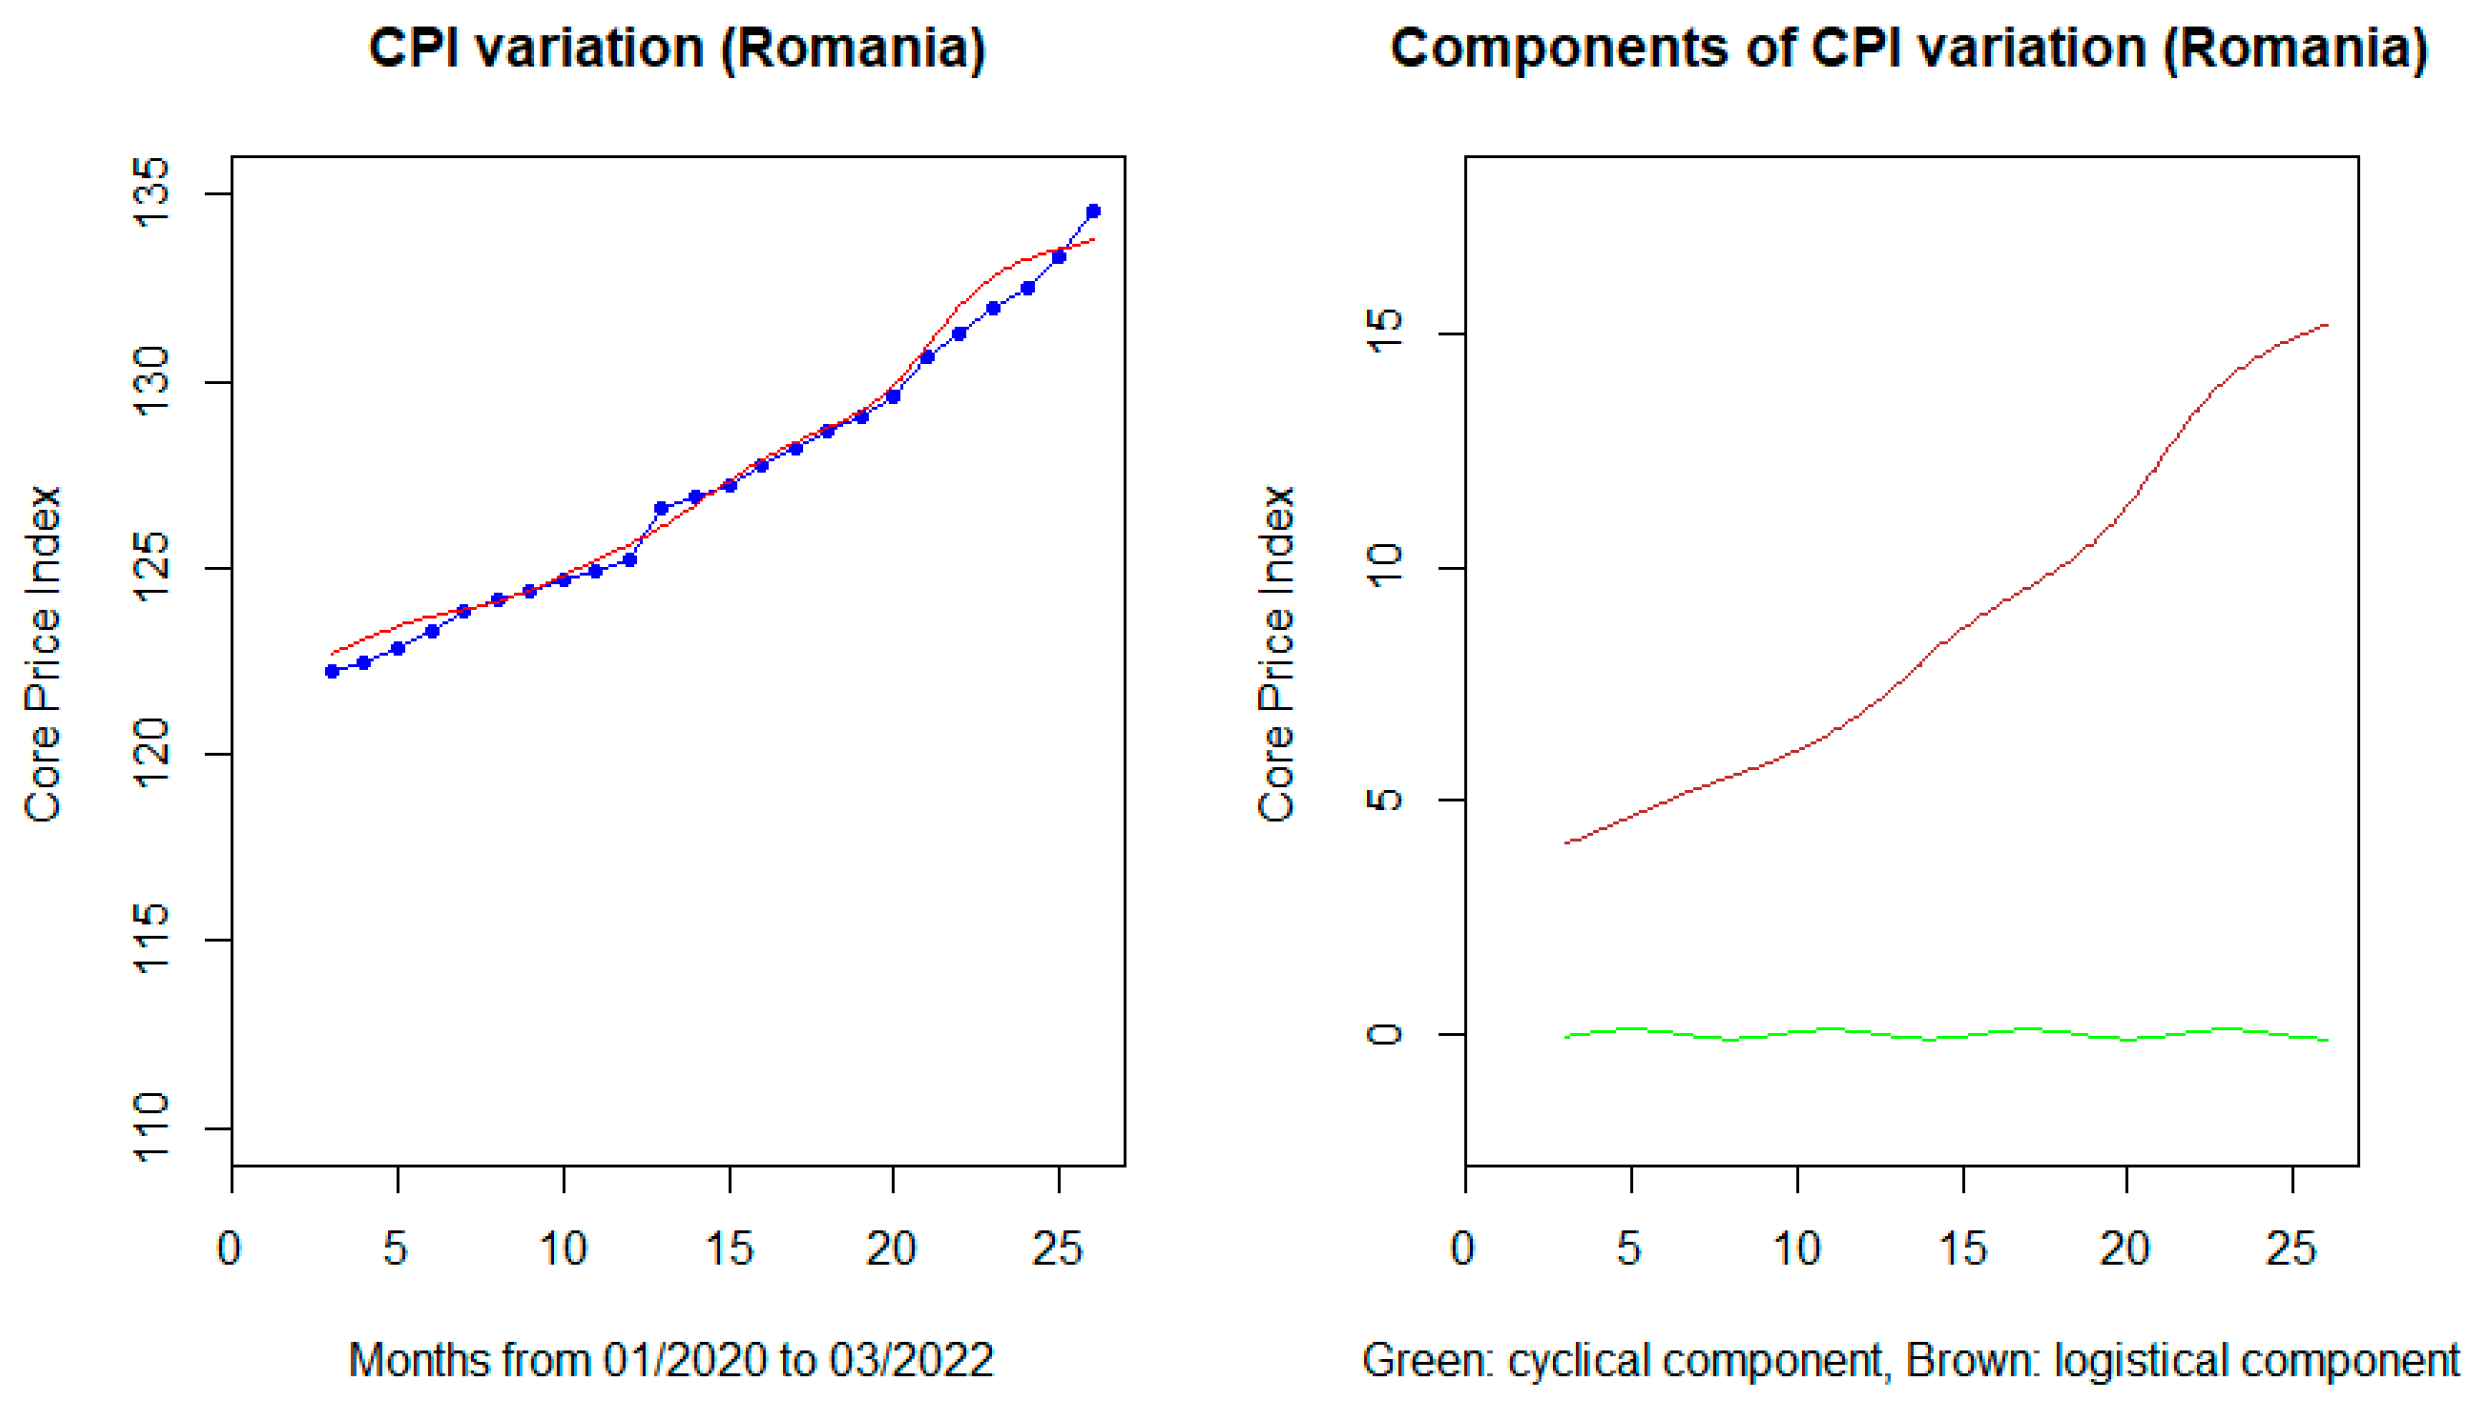
For Romania, computing the coefficient of the model (3) (Figure 11) give:
(Fstatistic = 255.2 > F5,19 = 2.741).
In this case, we do not have any significant dependence on the Consumer Price Index (and inflation, by consequence) on seasonal COVID-19 restrictions, but a strong dependence of the CPI on Oil Price and global economic crises.
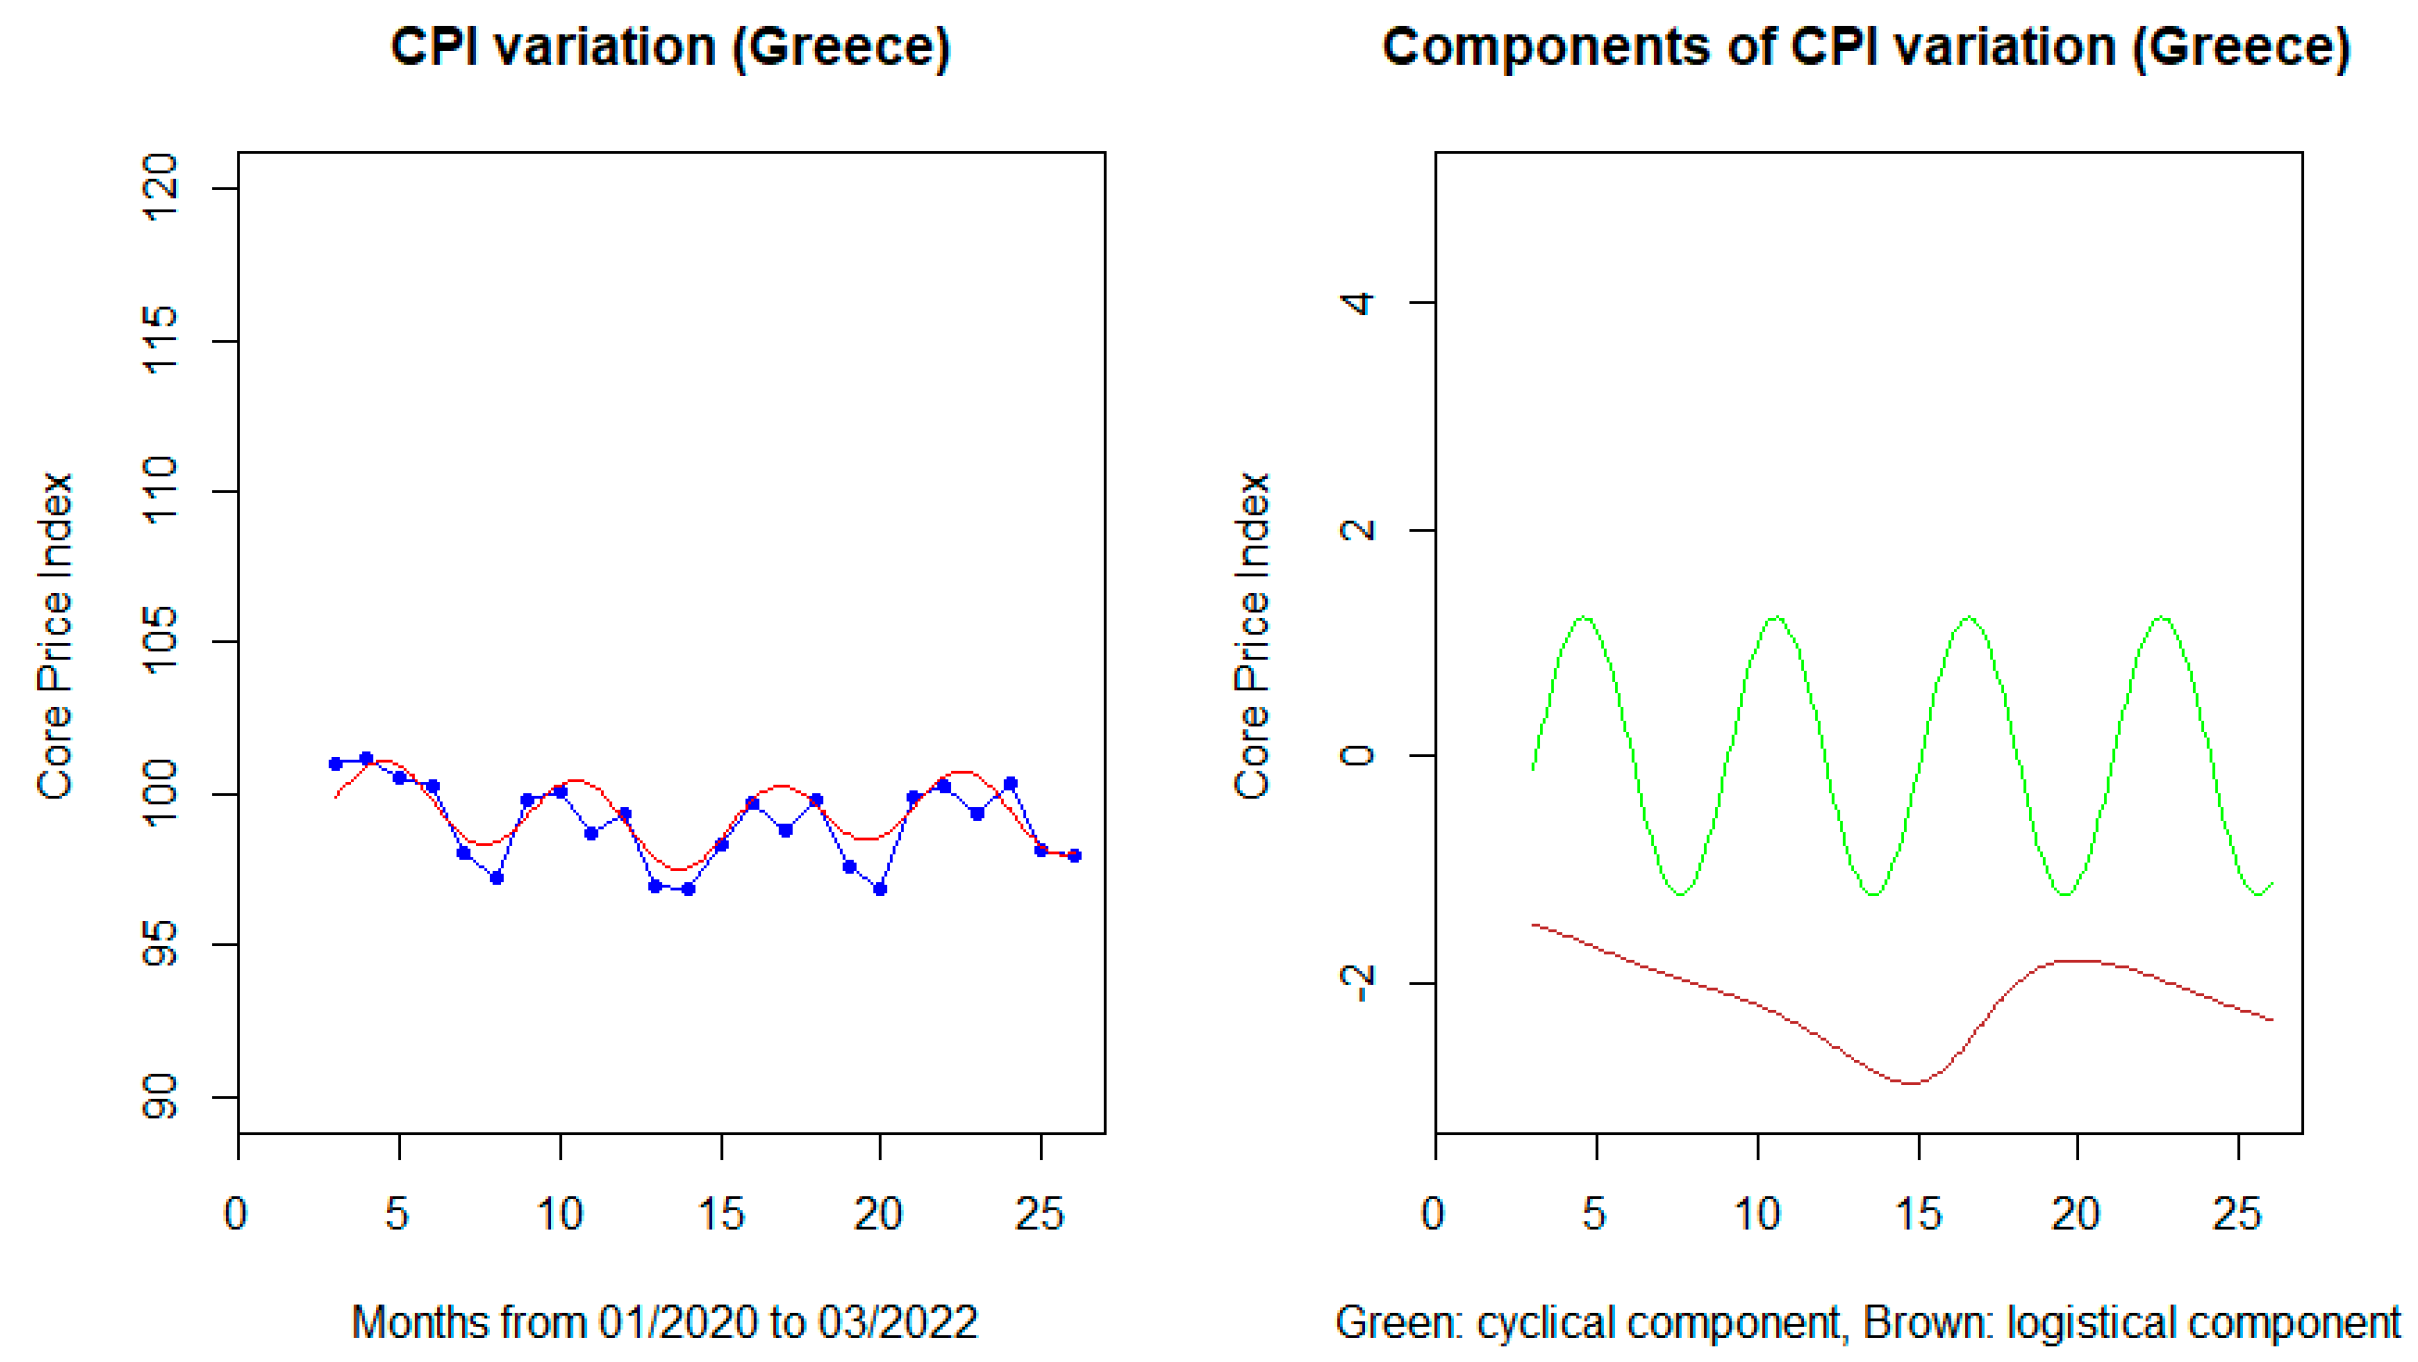
The last case, for Greece (Figure 12), produces the regression model:
(Fstatistic = 13.4 > F5,19 = 2.741). One observes an atypical inverse dependence of the Consumer Price Index on the Oil Price (the logistical component of variation, in brown in the right graph).
4. Discussion
In the previous section, we introduced a regressive model to simulate the variation of the Crude Oil Price during the COVID-19 pandemic period. Although the proposed model:
(with T being expressed in months from the beginning of 2020) does not fit very well at the beginning of 2020 and at the end of the considered period (November 2021–February 2022), the correlation coefficient between the predictive and the initial data sample is Correlation (PredictedOCP, SampleOCP) = 0.9761 (calculated in R using the Stat package) [32].
The sharp drop in the oil price since the beginning of the pandemic can be justified by the very severe restrictions on the movement of people and goods in the first epidemic wave, which has led to a strong worldwide decline in fossil fuel demand. The variations in Oil Price at the end of the pandemic coincide with Russia’s political turmoil of late 2021 and early 2022 against Ukraine and NATO, given that Oil Prices are volatile and highly dependent on the political, not the economic, global situation.
Next, we compared the variation of consumer prices over the same period for six European countries, using the Core Price Index as the main indicator. For each country, we proposed a nonlinear regression model with three major components: a component that cyclically models the influence of pandemic constraints on consumer prices during the successive seasonal Covid-19 waves, which affected the European economy mainly in the spring and autumn of 2020 and 2021; a logistical-asymptotic component that models the adaptation of each country’s economy to the situation of the global economic crisis resulting from the pandemic, as well as a component of the direct dependence of CPI on the variation of the oil price. The results differ from country to country.
In the case of Spain and Greece, we found a cyclical phenomenon of increasing and decreasing the CPI in direct correlation with the waves of pandemic restrictions, respectively inverse correlation in the case of Greece, as well as weak dependence on the shock of the economic crisis in Spain, and the price of oil in Greece. The difference lies in the much larger industrial capacity of Spain than in Greece, which depends mainly on tourism, as well as the robustness of a more stable economy of Spain, given that both countries are significant providers of tourist services.
Comparing the following two countries: Germany and Slovenia, both being also in the Euro zone, we found the presence of similar coefficients of the regression model, with effects in the clearly logistic increase of the CPI in July–September 2021, a relatively small seasonal influence (derivate from the restrictions of successive pandemic waves) of the consumer price index for Germany, but three times higher for Slovenia. Also, if for Germany the price of oil did not have an immediate impact on good’s prices, in Slovenia, there is a quantifiable influence of this phenomenon. The explanation stems from the fact that the German economy is much more robust to volatile price changes, and the pandemic waves have not greatly influenced the behavior of shoppers, who have long been accustomed to online commerce.
In the end, in the case of Romania and Lithuania, the rise of prices is much more pronounced, highlighting a direct dependence of the CPI on the price of oil and the global economic crisis induced by the Pandemic. If, in the case of Lithuania, this dependence is composed of a quasi-cyclical factor associated with the waves of restrictions, in the case of Romania, the increase in prices is constant, marking a controlled consumer market by a small number of companies organized in oligo-poles, rather than a market controlled by the law of supply and demand. The proximity of the politically unstable region of Russia /Ukraine, induce a psychological effect on the consumer’s attitude and affect the goods’ market, as well as the fact that both developing countries are more sensitive to the economic shocks caused by the possibility of a border conflict, make our regression model not fit correctly for 2022.
To highlight the usefulness of the regression model used, we presented in Table 1 the correlation between the predicted values and the original data from which we started, as well as the Standard Residual Error for each of the six CPI regression models.
The proposed regression model is validated by the small residual errors and high correlation between predicted data and original ones.
As a final point, in this study, we did not consider the violent outbreak of the Russia/Ukraine conflict and its impact on exports and prices of fossil fuels in the first place, as well as the impact on consumer prices in Europe. As evidenced in other studies, significant economic impacts are derived from the response of NATO-aligned countries to aforementioned conflicts [33]. The maximum price of crude oil was predicted for May 2022 at 101–102 dollars per barrel by our model, but the effect of the Ukrainian invasion modified this prevision in a significant way.
The model can be adapted instead to the appearance of a new wave of Covid-19, expected by the appearance of new infection outbreaks in the spring of 2023 in China.
5. Conclusions
The present study proposes a non-linear mathematical regression model with multiple cyclical and logistic-asymptotic components. This model was used to represent the evolution of the Crude Oil Price and the Consumer Price Index for six countries in Southern, Central, and Eastern Europe during the COVID-19 pandemic.
After analyzing the regression models for each studied country, we can conclude that:
- (i)
- pandemic restrictions are driving a sharp variation in the CPI, and consequently inflation, in Southern and Eastern European countries;
- (ii)
- in the long term, there is a logistical increase in prices as a global response to the economic and social changes induced by the pandemic, mainly affecting the ex-communist European countries;
- (iii)
- oil price fluctuations affect countries with a less robust economy than developed countries.
A way through which countries with vulnerable economies can possibly lessen the impact of oil prices on the Consumer Price Index is by transitioning to green energy sources and sustainable transportation solutions, which can lead to a decoupling of the costs associated with logistics, supply-chain management or more generally transportation from oil and fuel prices. Furthermore, some authors noted the fact that in the case of the relationship between oil prices and stock markets performances, countries that ranked higher in the Energy Sustainability Index were less affected by shocks and fluctuations in the pricing of oil [34].
This should provide valuable insight for policymakers and provide another incentive towards revamping the current economic status quo towards sustainable practices. At the same time, future prospects for research can be centered around the impact of that pricing of energy, raw materials (e.g., lithium, rare earth minerals), and finished products (e.g., electronics, high-capacity batteries) on the CPI [35,36].
As the world economies recover from the effects of the COVID-19 pandemic, it becomes more apparent that the basis of economic growth should not be the energy obtained from fossil fuels. This is a significant aspect for developing economies, which did not benefit from this cheap and convenient source of energy that fueled industrial expansion, as was the case for developed countries [37]. Instead, we assert that sustainable technologies should be implemented in developing countries as soon as they are feasible, both from an economic and operational perspective, to sustain the economic growth needed for the betterment of human conditions that are sorely needed in such areas.
Our paper underlines the fact that oil price fluctuations impact economies that are already vulnerable, which is a significant problem for the sustainable development of those economies. At the same time, this can be an opportunity for policymakers in those countries to push forwards sustainable practices and green technologies, as they present the economic benefit of becoming more robust to such shocks.
Our model, drawn up based on the available data and the regulations in force, highlights reveal a significant worsening of the short-term outlook for inflation under the substantial influence of supply-side shocks, mainly of energy prices, given that the forecast trajectory of the dynamics they annual know a new substantial upward revision in the short time horizon. This model is consistent with similar recent studies on the effect of crisis shocks on the inflation and economic sustainability of oil-dependent countries [27,28].
The expenses directly related to COVID-19 are considerable, but can be mitigated a little with guarantee programs—money that reaches the economy through the financial banking system and is guaranteed by the state.
However, our study does not focus on the monetary factor as a source of CPI variation; we are restricted to the analysis of the cyclical impact of pandemic waves and the effect of oil price riding on the Consumer price index.
At the same time, significant uncertainties remain associated with the way to evaluate and include in the CPI calculation the impact of these schemes, and notable risks continue to come from the evolution of raw material quotations, especially energy and agri-food ones, as well as from persistent bottlenecks in production and supply chains.
Author Contributions
Conceptualization, C.R.B. and B.I.B.; methodology, C.R.B. and B.I.B.; software, B.I.B.; validation, C.R.B.; formal analysis, B.I.B.; investigation, B.I.B.; resources, C.R.B.; data curation, B.I.B.; writing—original draft preparation, B.I.B.; writing—review and editing, C.R.B.; visualization, B.I.B. and T.I.; supervision, C.R.B. and T.I.; project administration, B.I.B.; funding acquisition, T.I. All authors have read and agreed to the published version of the manuscript.
Funding
The publication of this paper is made possible by the funds of the University of Life Science” King Mihai I” from Timisoara and the Research Institute for Biosecurity and Bioengineering Timisoara. This research paper was supported by the project “Increasing the impact of excellence research on the capacity for innovation and technology transfer within USAMVB Timisoara” code 6PFE, submitted in the competition Program 1-Development of the national system of research-development, Subprogram 1.2-Institutional performance, Institutional development projects—Development projects of excellence in RDI.
Institutional Review Board Statement
Not applicable.
Informed Consent Statement
Not applicable.
Data Availability Statement
Data are available publicly.
Conflicts of Interest
The authors declare no conflict of interest.
References
- Ha, J.; Kose, M.A.; Ohnsorge, F. Inflation in Emerging and Developing Economies: Evolution, Drivers, and Policies; World Bank Group: Washington, DC, USA, 2019. [Google Scholar]
- Pan, L.; Amin, A.; Zhu, N.; Chandio, A.A.; Naminse, E.Y.; Shah, A.H. Exploring the Asymmetrical Influence of Economic Growth, Oil Price, Consumer Price Index and Industrial Production on the Trade Deficit in China. Sustainability 2022, 14, 15534. [Google Scholar] [CrossRef]
- OPEC Basket Price. Available online: https://www.opec.org/opec_web/en/data_graphs/40.htm (accessed on 3 December 2022).
- Bala, U.; Chin, L. Asymmetric Impacts of Oil Price on Inflation: An Empirical Study of African OPEC Member Countries. Energies 2018, 11, 3017. [Google Scholar] [CrossRef] [Green Version]
- Duan, H.M.; Liu, Y.M.; Wang, G. A novel dynamic time-delay grey model of energy prices and its application in crude oil price forecasting. Energy 2022, 251, 123968. [Google Scholar] [CrossRef]
- Luong, P.V.; Mizrach, B.; Otsubo, Y. Location Basis Differentials in Crude Oil Prices. Energy J. 2019, 40, 41–58. [Google Scholar] [CrossRef]
- Floros, C.; Galyfianakis, G. Bubbles in Crude Oil and Commodity Energy Index: New Evidence. Energies 2020, 13, 6648. [Google Scholar] [CrossRef]
- Lunden, L.P.; Fjaertoft, D.; Overland, I.; Prachakova, A. Gazprom vs. other Russian gas producers: The evolution of the Russian gas sector. Energy Policy 2013, 61, 663–670. [Google Scholar] [CrossRef] [Green Version]
- Safronov, A.; Sokolov, A. Preliminary Calculation of the EROI for the Production of Crude Oil and Light Oil Products in Russia. Sustainability 2014, 6, 5801–5819. [Google Scholar] [CrossRef] [Green Version]
- Totir, F.; Dragota, I. Current Economic and Financial Crisis—New Issues or Returning to the Old Problems? Paradigms, Causes, Effects and Solutions Adopted. Theor. Appl. Econ. 2011, 18, 129–150. [Google Scholar]
- Atri, H.; Kouki, S.; Gallali, M.I. The impact of COVID-19 news, panic and media coverage on the oil and gold prices: An ARDL approach. Resour. Policy 2021, 72, 102061. [Google Scholar] [CrossRef]
- Armah, M.; Amewu, G. Time-frequency dynamics of financial market stress and global economic uncertainties: Evidence from the COVID-19 pandemic. Appl. Econ. Lett. 2022. [Google Scholar] [CrossRef]
- Kolaczkowski, M.; White, A. Why Do Oil Prices Matter to the Global Economy? An Expert Explains. Available online: https://www.weforum.org/agenda/2022/02/why-oil-prices-matter-to-global-economy-expert-explains/ (accessed on 4 May 2022).
- Kosakowski, P. What Determines Oil Prices? 2022. Available online: https://www.investopedia.com/articles/economics/08/determining-oil-prices.asp (accessed on 10 January 2023).
- Eurostat. E-Commerce Statistics for Individuals. Available online: https://ec.europa.eu/eurostat/statistics-explained/index.php?title=E-commerce_statistics_for_individuals (accessed on 4 May 2022).
- Reinsdorf, M. COVID-19 and the CPI: Is Inflation Underestimated? IMF Work. Pap. 2020, 2020, 30. [Google Scholar] [CrossRef]
- Davies, R. Prices and Inflation in a Pandemic: A Micro Data Approach; Centre for Economic Performance, London School of Economics and Political Science: London, UK, 2021. [Google Scholar]
- Kartal, M.T. The Effect of COVID-19 Pandemic on Oil Prices: Daily Evidence from Turkey. Energy Res. Lett. 2021, 1, 18723. [Google Scholar] [CrossRef]
- Kilian, L.; Zhou, X. The impact of rising oil prices on U.S. inflation and inflation expectations in 2020–2023. Energy Econ. 2022, 113, 106228. [Google Scholar] [CrossRef]
- Bobeica, E.; Hartwig, B. The COVID-19 Shock and Challenges for Time Series Models; SSRN: Rochester, NY, USA, 2021; ISBN 978-92-899-4558-5. [Google Scholar]
- Boldea, C.R.; Boldea, B.I. The pandemic waves’ impact on Romanian E-market: A non-linear regression model. Facta Univ. Ser. Econ. Organ. 2021, 18, 397–406. [Google Scholar] [CrossRef]
- Amin, R.; Sohrabi, M.-R.; Zali, A.-R.; Hannani, K. Five consecutive epidemiological waves of COVID-19: A population-based cross-sectional study on characteristics, policies, and health outcome. BMC Infect. Dis. 2022, 22, 906. [Google Scholar] [CrossRef]
- Kollmann, R. Effects of Covid-19 on Euro area GDP and inflation: Demand vs. supply disturbances. Int. Econ. Econ. Policy 2021, 18, 475–492. [Google Scholar] [CrossRef]
- Aharon, D.Y.; Qadan, M. Infection, invasion, and inflation: Recent lessons. Financ. Res. Lett. 2022, 50, 103307. [Google Scholar] [CrossRef]
- Bobeica, E.; Hartwig, B. The COVID-19 shock and challenges for inflation modelling. Int. J. Forecast. 2023, 39, 519–539. [Google Scholar] [CrossRef]
- Statista. Average Monthly OPEC Basket Crude Oil Price from October 2020 to October 2022 (in U.S. Dollars per Barrel). Available online: https://www.statista.com/statistics/277914/monthly-average-prices-of-the-opec-crude-oil-basket/ (accessed on 28 December 2022).
- Boldea, B.-I.; Boldea, C.R.; Diaconescu, R. The financial crisis prediction using an artificial intelligence method. In Annals of Eftimie Murgu University Resita, Fascicle II, Economic Studies; Eftimie Murgu University: Resita, Romania, 2012; pp. 197–201. [Google Scholar]
- Kaufmann, R.K.; Bradford, A.; Belanger, L.H.; McLaughlin, J.P.; Miki, Y. Determinants of OPEC production: Implications for OPEC behavior. Energy Econ. 2008, 30, 333–351. [Google Scholar] [CrossRef]
- Kisswani, K.M.; Lahiani, A.; Mefteh-Wali, S. An analysis of OPEC oil production reaction to non-OPEC oil supply. Resour. Policy 2022, 77, 102653. [Google Scholar] [CrossRef]
- Gotz, R. Between Anxiety and Megalomania Gas and Oil as a means of exerting political pressure. Osteuropa 2014, 64, 277–292. [Google Scholar]
- Steffen, B.; Patt, A. A historical turning point? Early evidence on how the Russia-Ukraine war changes public support for clean energy policies. Energy Res. Soc. Sci. 2022, 91, 102758. [Google Scholar] [CrossRef]
- R Core Team. R: A Language and Environment for Statistical Computing; R Foundation for Statistical Computing: Vienna, Austria, 2022. [Google Scholar]
- Mahlstein, K.; McDaniel, C.; Schropp, S.; Tsigas, M. Estimating the economic effects of sanctions on Russia: An Allied trade embargo. World Econ. 2022, 45, 3344–3383. [Google Scholar] [CrossRef]
- Kocoglu, S.; Karan, M.B.; Kapusuzoglu, A. The Effect of the Relationship Between Oil Price and Stock Markets in Energy Sustainable Countries. In Energy and Finance; Springer: Cham, Switzerland, 2016; pp. 123–144. [Google Scholar]
- Babbitt, C.W. Sustainability perspectives on lithium-ion batteries. Clean Technol. Environ. Policy 2020, 22, 1213–1214. [Google Scholar] [CrossRef]
- Graham, J.D.; Rupp, J.A.; Brungard, E. Lithium in the Green Energy Transition: The Quest for Both Sustainability and Security. Sustainability 2021, 13, 11274. [Google Scholar] [CrossRef]
- Lenferna, G.A. Can we equitably manage the end of the fossil fuel era? Energy Res. Soc. Sci. 2018, 35, 217–223. [Google Scholar] [CrossRef]
Figure 1.
OPEC Reference Basket prices since the introduction of indicator (USD/barrel).

Figure 2.
The geographical distribution of the studied countries (source: own elaboration in QGIS).

Figure 3.
The variation of Core Price Index in different European countries between March 2020 and February 2022. Data source: The Word Bank (2022).
Figure 3.
The variation of Core Price Index in different European countries between March 2020 and February 2022. Data source: The Word Bank (2022).

Figure 4.
The variation of OPEC Oil Crude Price between March 2020 and February 2022 (in USD /barrel). Data source: Statista (2022).
Figure 4.
The variation of OPEC Oil Crude Price between March 2020 and February 2022 (in USD /barrel). Data source: Statista (2022).

Figure 5.
The regression model prediction for the Oil Prices during the COVID-19 pandemic.

Figure 6.
The estimation of regression coefficients by R code application.

Figure 7.
The regression model for the Core Price Index variation in Spain. In blue is represented the initial data, in red the regression model, in brown the logistical component of CPI variation, and in green the cyclical component of CPI variation induced by pandemic waves.
Figure 7.
The regression model for the Core Price Index variation in Spain. In blue is represented the initial data, in red the regression model, in brown the logistical component of CPI variation, and in green the cyclical component of CPI variation induced by pandemic waves.

Figure 8.
The regression model for the Core Price Index variation in Germany. In blue is represented the initial data, in red the regression model, in brown the logistical component of CPI variation, and in green the cyclical component of CPI variation induced by pandemic waves.
Figure 8.
The regression model for the Core Price Index variation in Germany. In blue is represented the initial data, in red the regression model, in brown the logistical component of CPI variation, and in green the cyclical component of CPI variation induced by pandemic waves.

Figure 9.
The regression model (6) for the Core Price Index variation in Slovenia. In blue is represented the initial data, in red the regression model, in brown the logistical component of CPI variation (including the oil price dependence), and in green the cyclical component of CPI variation induced by pandemic waves.

Figure 10.
The regression model (7) for the Core Price Index variation in Lithuania. In blue is represented the initial data, in red the regression model, in brown the logistical component of CPI variation (including the oil price dependence), and in green the cyclical component of CPI variation induced by pandemic waves.

Figure 11.
The regression model (8) for the Core Price Index variation in Romania. In blue is represented the initial data, in red the regression model, in brown the logistical component of CPI variation (including the oil price dependence), and in green the cyclical component of CPI variation.
Figure 11.
The regression model (8) for the Core Price Index variation in Romania. In blue is represented the initial data, in red the regression model, in brown the logistical component of CPI variation (including the oil price dependence), and in green the cyclical component of CPI variation.

Figure 12.
The regression model (9) for the Core Price Index variation in Greece. In blue is represented the initial data, in red the regression model, in brown the logistical component of CPI variation (including the oil price dependence), and in green the cyclical component of CPI variation.
Figure 12.
The regression model (9) for the Core Price Index variation in Greece. In blue is represented the initial data, in red the regression model, in brown the logistical component of CPI variation (including the oil price dependence), and in green the cyclical component of CPI variation.


Table 1.
Correlation index between the Predicted values of CPI and the Original data and the Residual Standard Error in the case of the six regression models.
Table 1.
Correlation index between the Predicted values of CPI and the Original data and the Residual Standard Error in the case of the six regression models.
| Country | Correlation Coefficient between Predicted and Original Data | Residual Standard Error |
|---|---|---|
| Spain | 0.865 | 0.501 |
| Greece | 0.817 | 0.835 |
| Germany | 0.973 | 0.381 |
| Slovenia | 0.903 | 0.665 |
| Lithuania | 0.958 | 0.970 |
| Romania | 0.987 | 0.628 |
Disclaimer/Publisher’s Note: The statements, opinions and data contained in all publications are solely those of the individual author(s) and contributor(s) and not of MDPI and/or the editor(s). MDPI and/or the editor(s) disclaim responsibility for any injury to people or property resulting from any ideas, methods, instructions or products referred to in the content. |
© 2023 by the authors. Licensee MDPI, Basel, Switzerland. This article is an open access article distributed under the terms and conditions of the Creative Commons Attribution (CC BY) license (https://creativecommons.org/licenses/by/4.0/).
Share and Cite
MDPI and ACS Style
Boldea, C.R.; Boldea, B.I.; Iancu, T. The Pandemic Waves’ Impact on the Crude Oil Price and the Rise of Consumer Price Index: Case Study for Six European Countries. Sustainability 2023, 15, 6537. https://doi.org/10.3390/su15086537
AMA Style
Boldea CR, Boldea BI, Iancu T. The Pandemic Waves’ Impact on the Crude Oil Price and the Rise of Consumer Price Index: Case Study for Six European Countries. Sustainability. 2023; 15(8):6537. https://doi.org/10.3390/su15086537
Chicago/Turabian StyleBoldea, Costin Radu, Bogdan Ion Boldea, and Tiberiu Iancu. 2023. "The Pandemic Waves’ Impact on the Crude Oil Price and the Rise of Consumer Price Index: Case Study for Six European Countries" Sustainability 15, no. 8: 6537. https://doi.org/10.3390/su15086537
Note that from the first issue of 2016, this journal uses article numbers instead of page numbers. See further details here.