1. Introduction
The COVID-19 virus first appeared in Wuhan, China in December 2019. It started to spread to the nearest countries, and three months later it was announced internationally as a pandemic disease that is widely spreading across the world. As per the World Health Organization (WHO) [
1], globally there have been more than 178 million confirmed cases of COVID-19, including nearly 4 million deaths. In response to the virus’ spread, WHO recommended countries to take safety measures as trials to reduce the disease consequences which range from an increased number of patients to an increased number of deaths [
1].
Most countries took preventive measures to fight the virus including social distancing; quarantine; contact tracing; wearing a face mask; the closing of high population density places such as schools, universities, offices; etc. Italy was the most affected country at the beginning of virus spread; it registered the highest number of infections and the virus was spreading exponentially by that time. As a result, a full national lockdown to reduce human contact and movement in a trial to control the virus spreading process [
2] was enforced. While in the USA, the number of patients started to increase dramatically, but more importantly, the increasing rate of deaths was a major concern to deal with, and India has repeated the same scenario. Other countries like Brazil, Russia, Peru, Colombia, Mexico, Africa, Spain, and Argentina also suffered from a rapid increase in infections and deaths rate which resulted in taking severe preventive measures which stopped almost all daily life events [
3].
In Jordan, the number of confirmed cases started to increase and WHO classified the country as virus “cluster of cases” transmission. As a result, a set of regulations were announced that include nationwide lockdown and enacting the Defense Law by the Government. This means that first, people were forced to stay at home to prevent all forms of the local or international movement. Second, the Minister of Defense has full authority to formulate orders in response to the current situation. Country isolation was achieved through national curfew placement, prevent movement between administrative governates, and putting all arrivals from pandemic countries into quarantine periods of 14 days to ensure they are not infected [
4,
5].
During this period, people were locked in their homes with closed workplaces, bakeries, supermarkets, educational institutions, airports, and everything else. The government continued to issue series of regulations about every single aspect of national life. This was to control the overall situation starting from conducting tests, transferring infected people to hospitals for strict medication, and ensuring that people in homes are getting basic requirements. Afterward, the government started reopening several life aspects gradually along with having precautions on avoiding high population density places and keep on facial masks with distancing to try keeping the number of infected people as lower as possible. Consequently, people were allowed to walk to neighborhood supermarkets, bakeries, pharmacies to get their required items from 10 a.m. until 6 p.m. during weekdays only with having weekends as full lockdown [
4,
5].
Through the COVID-19 crisis [
6], both governments and citizens used different media channels. For example, governments tend to alert their citizens about the virus, the severity of the situation, and its exponential spread. Social media (e.g., Facebook, Twitter, and Instagram) was exploited heavily in this regard and a wide campaign started to educate citizens about the seriousness of the virus and the importance of staying at homes in which government, public figures, educators, and religious leaders participated [
7,
8]. On the other hand, people have no other way of expressing their feelings and responses about government administration except social media, especially Facebook as the most used social network site with 2.85 billion users around the world from which 6 million users are from Jordan [
9].
A massive number of posts were published by citizens by the time governmental announcements were reported every day on televisions and the government’s Facebook pages in Jordan [
5]. During this exceptional pandemic, the power of social media appeared and was noticed as available platforms for all locals, regardless of their cultural background, jobs, knowledge, or expertise to post anything about COVID-19. In fact, Word of Mouth (WOM) played a vital role in orienting the trend on Facebook about major announcements the government made since the beginning of COVID-19 until now [
10,
11].
The opinion posts Facebook had on a daily basis created a huge amount of data which can be exploited for sentiment analysis to measure locals’ satisfaction on governmental administration of the whole situation that is continued until now in Jordan. Studying people’s opinions, behaviors, or feelings expressed in response to an event or organization is referred to as Sentiment Analysis. Facebook posts create a rich reservoir of information in various forms, e.g., images, text, and videos, and this makes it a vital source of information required for research purposes. Both textual and unstructured datasets formed from Facebook were used to derive insights of people’s opinions, behavior, and feelings [
12].
Sentiment Analysis (SA) is conducted based on three methods: First, lexicon-based in which keywords are classified into positive and negative values of polarity scores. Second, machine learning-based as per the work in [
13]. Third, graph-based which uses statistical approaches to get keywords ranking [
14].
Generally, many sentiment analysis studies used Machine Learning (ML) techniques through literature and especially during the COVID-19 period for various aspects such as medical, economics, and education along with public news [
15].
Ji et al. [
16] defined ML techniques as methods applying different algorithms on data to extract certain patterns that support decision making and predictions in response to real-world events. While Deep Learning (DL) is an extension of ML that helps in-depth realization and expands its application scope [
13]. The authors of [
13] found that the integration of ML techniques has promising results compared to lexicon- and graph-based SA.
Raamkumar et al. [
17] conducted SA using Facebook posts to understand public health authorities’ communication during the pandemic of COVID-19 and their responses on it. Another study in [
18] conducted SA by applying Deep Learning (DL) techniques to Facebook and Twitter posts in the UK and USA in terms of responses to COVID-19 vaccines. Moreover, the work in [
12] used ML techniques to analyze data extracted from Facebook and Twitter about fear expressed by locals during the COVID-19 quarantine.
Decision Support Systems (DSS) are software to support decisions made by governments as a response to pandemic disease spread along with intelligent models used and applied to solve various problems in literature such as medical economical, educational, and much more. These can be deployed first to test the level of satisfaction to government performance and provide a support tool for decision-makers in government [
10,
11].
Guo et al. [
19] proposed an approach that supports decision-making required for future prices in The Financial Times Stock Exchange 100 Index (FTSE 100). This approach was based on SA which adopted Twitter sentiment score (TSS) along with baseline correlation to dissociate previous TSS data from the prediction model. Experiments proved that the proposed TSS registered a decent prediction accuracy, decreased computation time, and provided fast decisions without the need to know any historical data.
Furthermore, Prastyo et al. [
20] stated that conducted sentiment analysis on posts of Indonesian locals about governmental performance during the COVID-19 pandemic can be used as a DSS for the Indonesian government to improve its performance in handling COVID-19.
Evolutionary Algorithms (EAs) are defined as techniques applied in solutions to complex problems [
21,
22]. EA has the ability to obtain the most suitable solutions with less computational effort than other methods [
23]. Furthermore, it can be easily encoded the candidate solutions and applied to different problems, namely, mono-objective and multi-objective [
24]. Therefore, they have been applied to various domains of optimization problems due to their independence from problem type [
25,
26]. Different EAs were applied to SA, such as Decision Trees (DT), k-Nearest Neighbor (KNN), Naive Bayes (NB), and Support Vector Machines (SVM) as per the method in [
13]. One of the well-known EAs that was used recently in the literature is the Whale Optimization Algorithm (WOA). The algorithm employed in different works and proves its superiority, especially in SA. Few works have been introduced, for example, the authors of [
27] proposed an SA approach using WOA for feature selection mechanism, while the work in [
28] provided a sentiment classification method in the social media environment by utilizing WOA.
Therefore, in this work, we presented an evolutionary approach for improving government decisions through using a decision support system and sentiment analysis and, further, combined them with a metaheuristic algorithm and SVM. The approach utilized the combination of WOA and SVM for the sake of hyperparameter tuning and features weighting. Therefore, studying people attitudes, feelings, and concerns toward the government new decisions and regulations can enhance governments’ decisions in many different ways, it may help decision-makers to make any necessary adjustments needed to mitigate the number of cases and reduce its impact on different aspects of life to guarantee people support and commitment. In addition, if the Government senses from the population feedback any negative attitudes toward its regulations, it can take proactive action to avoid further deterioration in the economy; employment; or any risks of violations, crimes, violence, or even the well-being of individuals and societies.
Moreover, our proposed approach can enhance the decision-makers’ countermeasures and provide them with an easily adaptable methodology with a set of general guidelines that could facilitate complex decision-making processes based on people sentiment and via investigating and ranking the most important set of key features for COVID-19 posts. This clear and structured framework can be adapted to different scenarios and contexts in the future to deal with similar conditions (COVID-19) quickly and efficiently. The following points illustrated the main contributions of this study:
Combined the decision support system and sentiment analysis mechanism to enhance government decisions during the COVID-19 pandemic and other similar situations.
The WOA-SVM hybrid framework was proposed for hyperparameter optimization and features weighting.
Investigate the behavior changes of people’s opinions in two different periods, first and latter regulations.
Study and analyze these behaviors to provide better countermeasures, alert decision-makers in case of possible threats, and perform proactive actions to handle the current pandemic situation.
Five different versions were generated from each dataset, consisting of various feature extraction and stemming techniques.
Identify the most relevant features to improve the decision support system and sentiment prediction.
The remainder of the paper is divided as follows. In
Section 2, a literature review on the decision support system during the COVID-19 is presented. Background of used methods and concepts introduced in
Section 3. The proposed approach is described in
Section 4.
Section 5 discusses the experiments and the results achieved by the proposed approach and other models. Finally, the conclusion and future directions are provided in
Section 6.
2. Related Work
DSS is a tool used to solve decision-making problems that Decision-Makers (DMs) face through collecting, analyzing, or organizing required information. They are used by both single or group of DMs when complex or unstructured scenarios are faced to ensure robust results [
29]. While the authors of [
30] stated that Information Systems (IS) are a basic component of DSS which improves the decision-making process and requires a high level of human–computer interaction to support the behavioral part of the decision-making process.
The study in [
31] tested the impact of using DSS on the Top Management (TM) level in developing countries’ governmental institutions by applying Delphi methodology considering Saudi Arabia as a study case of developing nations. Results showed that DSSs improved the quality of decisions taken at the TM level with decreased cognitive bias.
Furthermore, the work in [
32] proposed a DSS which combined Analytical Hierarchy Process (AHP) and Technique for Order of Preference by Similarity to Ideal Solution (TOPSIS) for evaluating government performance in Magelang Regency (Central Java, Indonesia). The study begins with criteria weights specified by AHP then performance ranking set by TOPSIS. Both models were chosen due to their efficiency and simple mathematical calculations. The system had a unique feature of dynamic selection for assessment criteria in which users can add or remove any condition from the available menu as per ongoing situation, regulation or condition. Results showed that 86.67% of users’ ranking and opinions about the proposed system usage in village governmental organization.
A massive number of scenarios were being solved through literature using intelligent systems. Yet, the complexity of these scenarios is increasing, and the need for better-performing DSS has increased as a response. It is the point where researchers combined intelligent models with DSS, in which Artificial Intelligence (AI) techniques were used to support the decision-making process. They were also referred to knowledge-based DSS and are classified into two categories as stated in [
33]: rule-based expert DSS and ML-based DSS.
An example of combining an intelligent system with DSS is the study conducted in [
34] to support decisions made by governments on budgeting national Research and Development (R&D) programs. ML algorithms such as distributed random forest, generalized linear model, gradient boosting machine, deep learning, and stacked ensemble were used to estimate the R&D output per project. Then, a mathematical model was used to set the suitable budget for estimated outcomes from each R&D project.
Moreover, the authors of [
35] conducted a study on multi-criterion DSS for supporting the Indian Government’s decisions during the pandemic conditions of COVID-19. An assumption-based approach was added into the DSS for multi-criterion decision support system (MCDSS) along with accurately specified risk factors of determining input parameters. Results were analyzed in terms of Precision, Recall, F-Score, and Other advanced metrics such as MCC (Matthews Correlation Coefficient), ROC (Receiver Operating Characteristics), and PRC (Precision Recall).
The authors of [
29] conducted a study in which they used fuzzy theory-based DSS to investigate re-opening strategies for post COVID-19 period. The system is examined using principles for multi-criteria decisions to decide the importance of 16 key indicators. The whole study focused on the critical pandemic conditions along with economic consequences and the vital role of decision-taking tools to be exploited in this regard giving the proposed system as an example.
E-participation of citizens has a vital role in affecting policies and regulations taken by most governments around the world during the crisis of COVID-19 as stated in [
3]. The study also observed that most studies during the pandemic condition have applied ML and DL for detecting, predicting, and identifying COVID-19. It was recommended that advanced ML ensemble methods such as bagging, boosting, and stacking need to be incorporated into future studies.
As stated previously, SA can be beneficial for the time being due to COVID-19 conditions along with IDSS to support decisions taken [
36]. Proposed analytics policy using citizens’ e-participation through social media to support the decision-making process. Four cities in Belgium (Li’ege, Mons, Marche-en-Famenne, and Leuven) were subject to study by identifying decision-makers’ requirements and the required information was extracted from social media for the study. Then, data analysis techniques were applied to the extracted data. This is followed by an actionable plan to facilitate the TM decision-making [
2]. The authors of [
2] conducted SA using NLP and ML on data extracted from Twitter to measure Indians citizens’ satisfaction with governmental policies during the nation lockdown forced to control the spread of COVID-19. The results found that the majority of Indians supported the government’s decision during this period.
Furthermore, a DL-based SA was conducted in [
37] on Arabic extracted data from Twitter to track citizens’ emotions expressed during the COVID-19 spread period and the effect of these tweets on daily health behavior; 5.5 million tweets in the period from January to August 2020 were extracted, then a long short-term memory (LSTM) classifier was applied to classify emotions into six categories and two types (symptom and non-symptom tweets). Results showed that the top emotions categories were anger and fear. The study was found to be helpful for the government’s TM to take decisions for educating people about the disease to reduce their fear and anxiety.
Moreover, the authors of [
38] conducted a SA on extracted data from Twitter about COVID-19 using DL techniques and fuzzy logic to examine the importance of data shared on social during this critical pandemic conditions and how it affects other users when includes unnecessary information about the disease. The study urged governments’ on the importance of using data available on social media to prevent sharing unnecessary cases which may increase citizens’ panic regarding the disease. Furthermore, it was recommended that laws should be designed to restrict useless, false, and exaggerated news through social media to control the current situation.
Therefore, this work differs from the previous studies in combing the DSS with sentiment analysis to improve government decisions during the Covid-19 situation. The utilization of WOA-SVM offers more insights and obtained better performance than the state-of-art techniques. Moreover, several datasets were generated to study different scenarios that comprise various feature extraction and stemming methods. Additionally, investigates people’s behavior to provide more efficient countermeasures and decisions. Finally, examine the most relevant features to obtain valuable, useful, and precise information faster.
4. Methodology
The methodology of this paper is described and presented in this section. Three phases have been provided in detail: data description, collection, and preparation; the proposed approach; and the model evaluation.
4.1. Data Description, Collection, and Preparation
The data used in this work portray the users’ opinion of the government regulations during the COVID-19 situation. These regulations started as a countermeasure to face the spread of this disease. The responsibility of designing these regulations—after making several studies—was the crisis committee. In other words, the committee has been placed, with the main objective, to offer strategic plans to control and reduce the number of cases. Moreover, and most importantly, the Government puts huge effort into disseminating advice, information, and risks to raise awareness of the virus. Thus, they gathered their efforts and people’s awareness against this grievous and tragic circumstance.
In this study, we divided the regulations into two categories: first and latter regulations. This categorization was employed to analyze the opinions from two-time intervals, the beginning and the latest periods of the pandemic. Therefore, we investigate the changes in people’s opinions during the whole situation. Doing this is more beneficial than considering one period without examining the modification of the opinions. Furthermore, studying two periods will offer us various insights on important conditions such as before and after increase the number of cases, mandatory lockdown, mitigating measures, and creation of vaccines.
The two datasets were collected from the Facebook online social network through crawling well-known local news pages. This platform was selected due to its popularity in Jordan, minimal restrictions on users’ posts, and simple interface and usage. The extraction of comments took place using R language scripts and the ‘Rfacebook’ package. Further, the handshake process with the platform was also applied to obtain permission for comments extraction. The first data contained 3050 instances, while the second data contained 2200 instances.
Furthermore, the preparation phase of the two data was done by applying several steps, including cleaning, labeling, remove stop words, normalization, and stemming [
55,
56].
The cleaning step in this work consist of removing symbols, special characters, and users’ account name [
57,
58]. Thus, the content of the comment will be ready for labeling from two to three experts. A description of the labeling procedure has been explained to them, which is reading the rule first then labeled the comments based on the sentiment of that rule only. This is done to concentrate on the emotion of users at that time and for that exact rule. Therefore, we can observe and study the comments changes as time pass. The labeling categorizes into three classes, positive, neutral, and negative.
Further, after the labeling is completed, the formatting of the data will begin. First, by removing the stop words of the text, words like قال انت ، كان ، أصبح (translated to said, you, was, and become, respectively) must be deleted as it does not affect the true meaning of the text. Afterward, a normalization process was also carried out to eliminate undesirable emoticons and non-Arabic letters. Both removing stop words and normalizing the text processes were conducted to reduce the number of useless extracted terms (features) from the data. Thus, will enhance the selection of extracted features.
Two well-known Arabic stemming procedures are employed on the text to erase any duplication words and extra letters and standardize most of the used words, namely Arabic Light and Khoja stemming. For example, letters like ال ، كال ، ب will be eliminated from words that further improve the tokenization process. Furthermore, the feature extraction methods applied in this study are TF-IDF, N-Gram, and BOW. Each of which has a different mechanism to tokenize the text. Five versions of each data have been generated with different combinations of tokenization and stemming methods. The details of each version for the two datasets can be found in
Table 1 and
Table 2.
4.2. Proposed Approach
In this subsection, we explain, in detail, the hybrid approach followed to employ the WOA for optimizing SVM hyperparameters and weighting the input features. Nevertheless, before applying the WOA algorithm some procedures needed to be taken into account first. These procedures range from solution representation and fitness evaluation selection to system architecture. In the following, we describe each of the aforementioned procedures extensively.
4.2.1. Solution Representation
The representation of the solution consists of two parts, identifying the optimal
C and
and also determining the weighting of the features. The first part contains two elements to represent (
C &
) and their values range from [0, 1]. Therefore, they need to be scaled into appropriate scales for the SVM. The new search space values of
C range from [0, 32], while the interval range of
falls within [0, 35,000]. This conversion of values is applied according to the min-max normalization equation as demonstrated in (
12).
where
B is the result of the equation and
A denotes the value needed to be scaled. The upper and lower of the old values are represented by
and
, while
and
are the new interval of upper and lower bounds.
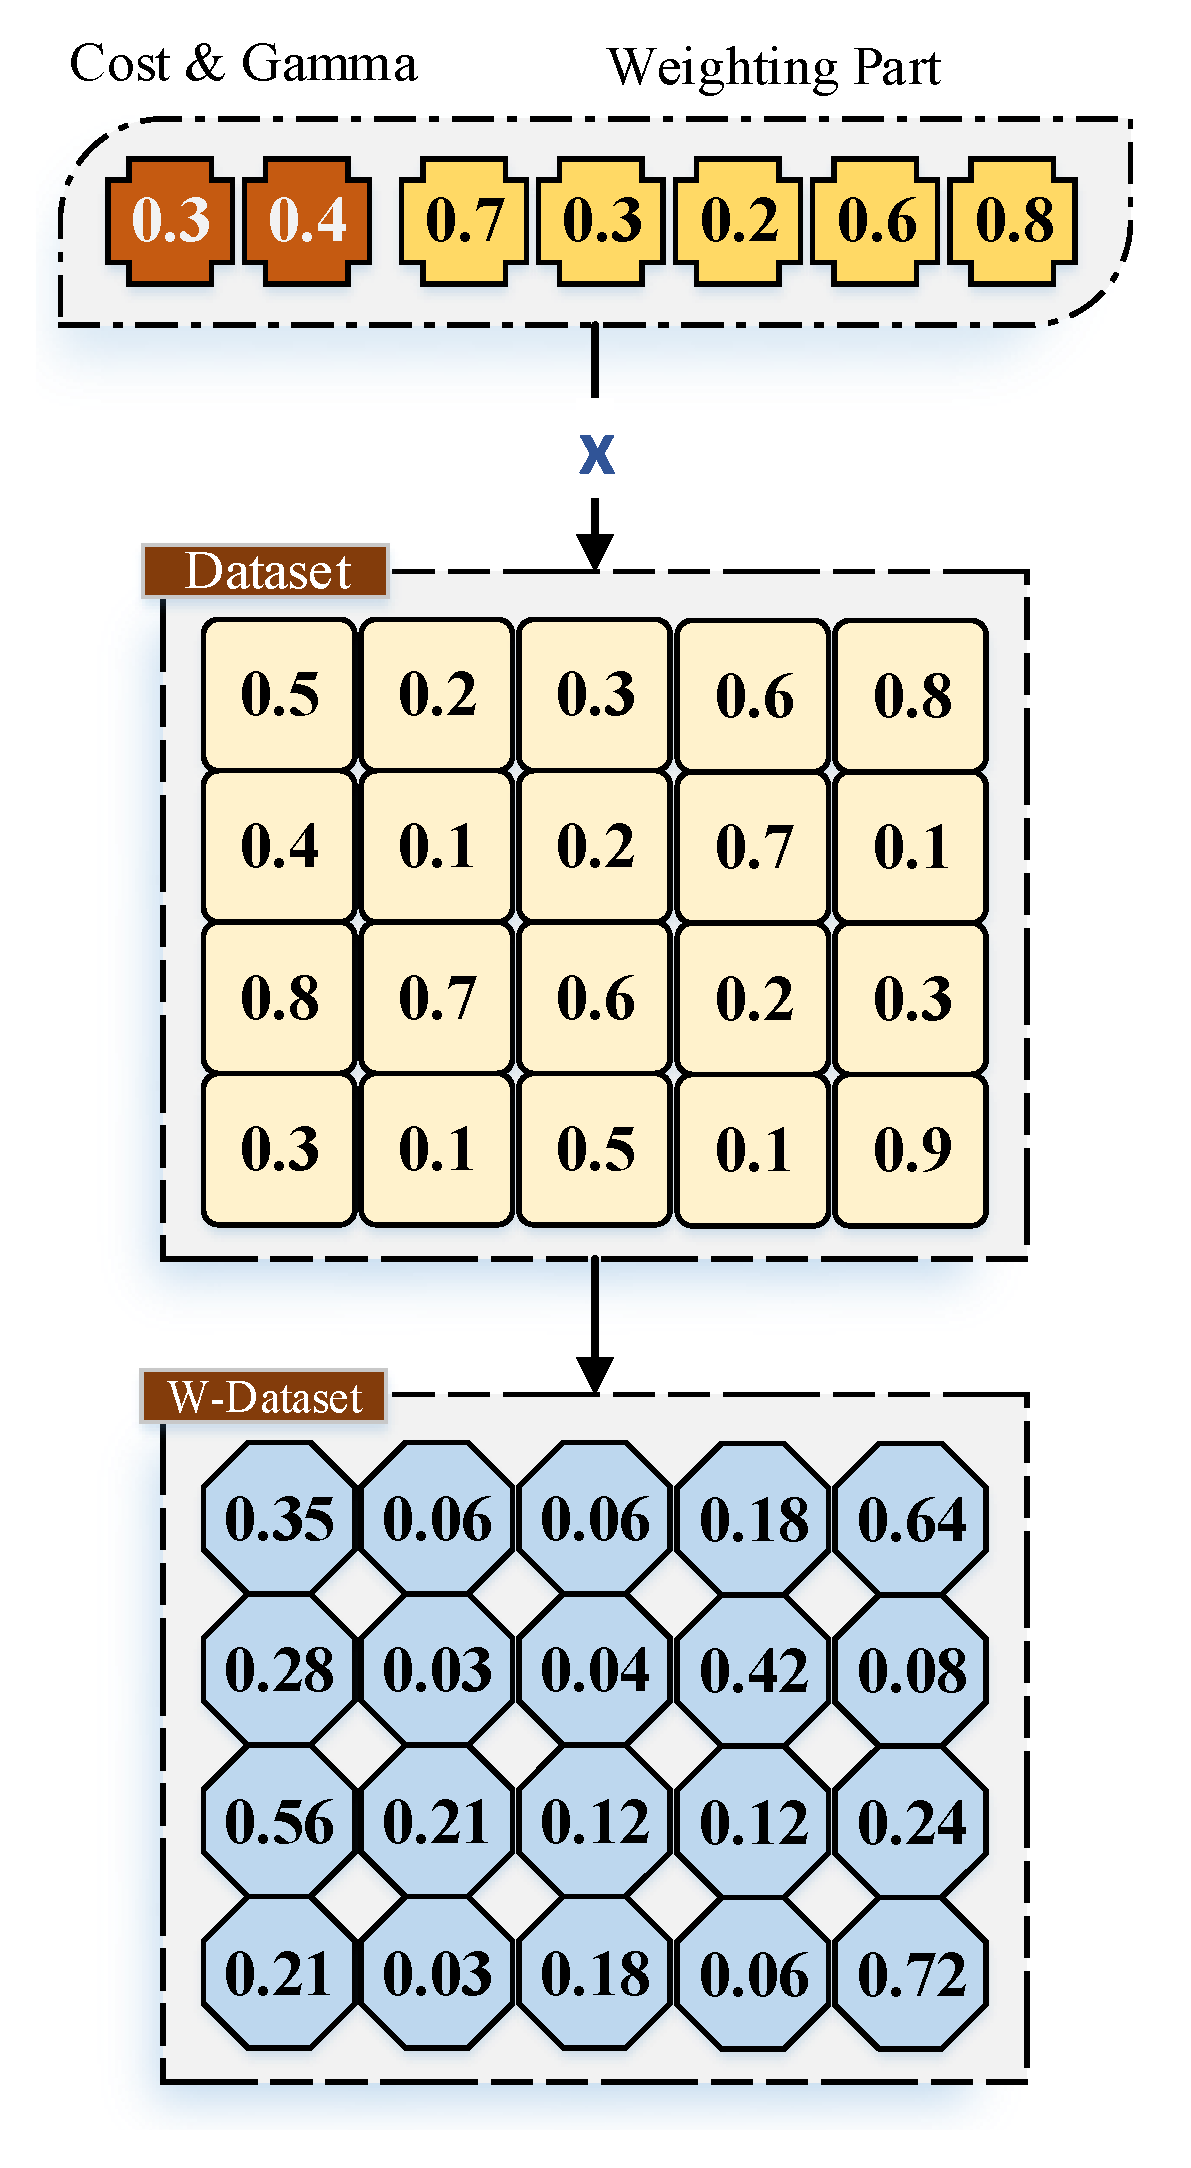
As for the second part of the solution representation, it is corresponding to features (
F) of the dataset that were scaled to be utilized for the weighing mechanism. In this mechanism, each feature in the dataset indicates the 2nd part of the solution elements generated by the WOA algorithm. Further, each element is multiplied by the value of the given feature for all instances as shown in
Figure 2. In other words, suppose that we have a simple dataset consisting of five instances, where the values of the first feature for the five instances are going to be multiplied by the first element of the generated solution. Therefore, the solution structure in this work comprises two elements plus the number of elements for all features of a given dataset (
).
4.2.2. Fitness Function
In this phase, the assessment of each solution provided by the WOA algorithm is measured using the fitness function. Therefore, identifying the quality of every individual can be accomplished through the fitness function performed by the SVM classifier. In our case, the selected fitness function is the classification accuracy that is calculated by Equation (
13). Further, the WOA tries to maximize the value of the accuracy during the whole process, thus achieving the best possible outcome.
where
denotes the accuracy of the
jth instance, while
indicates the label (actual class) of the
jth instance. Further,
is the relation between
and
, where if
=
, then
, else
. The number of folds denoted by
K and
N is the number of instances in the testing subset.
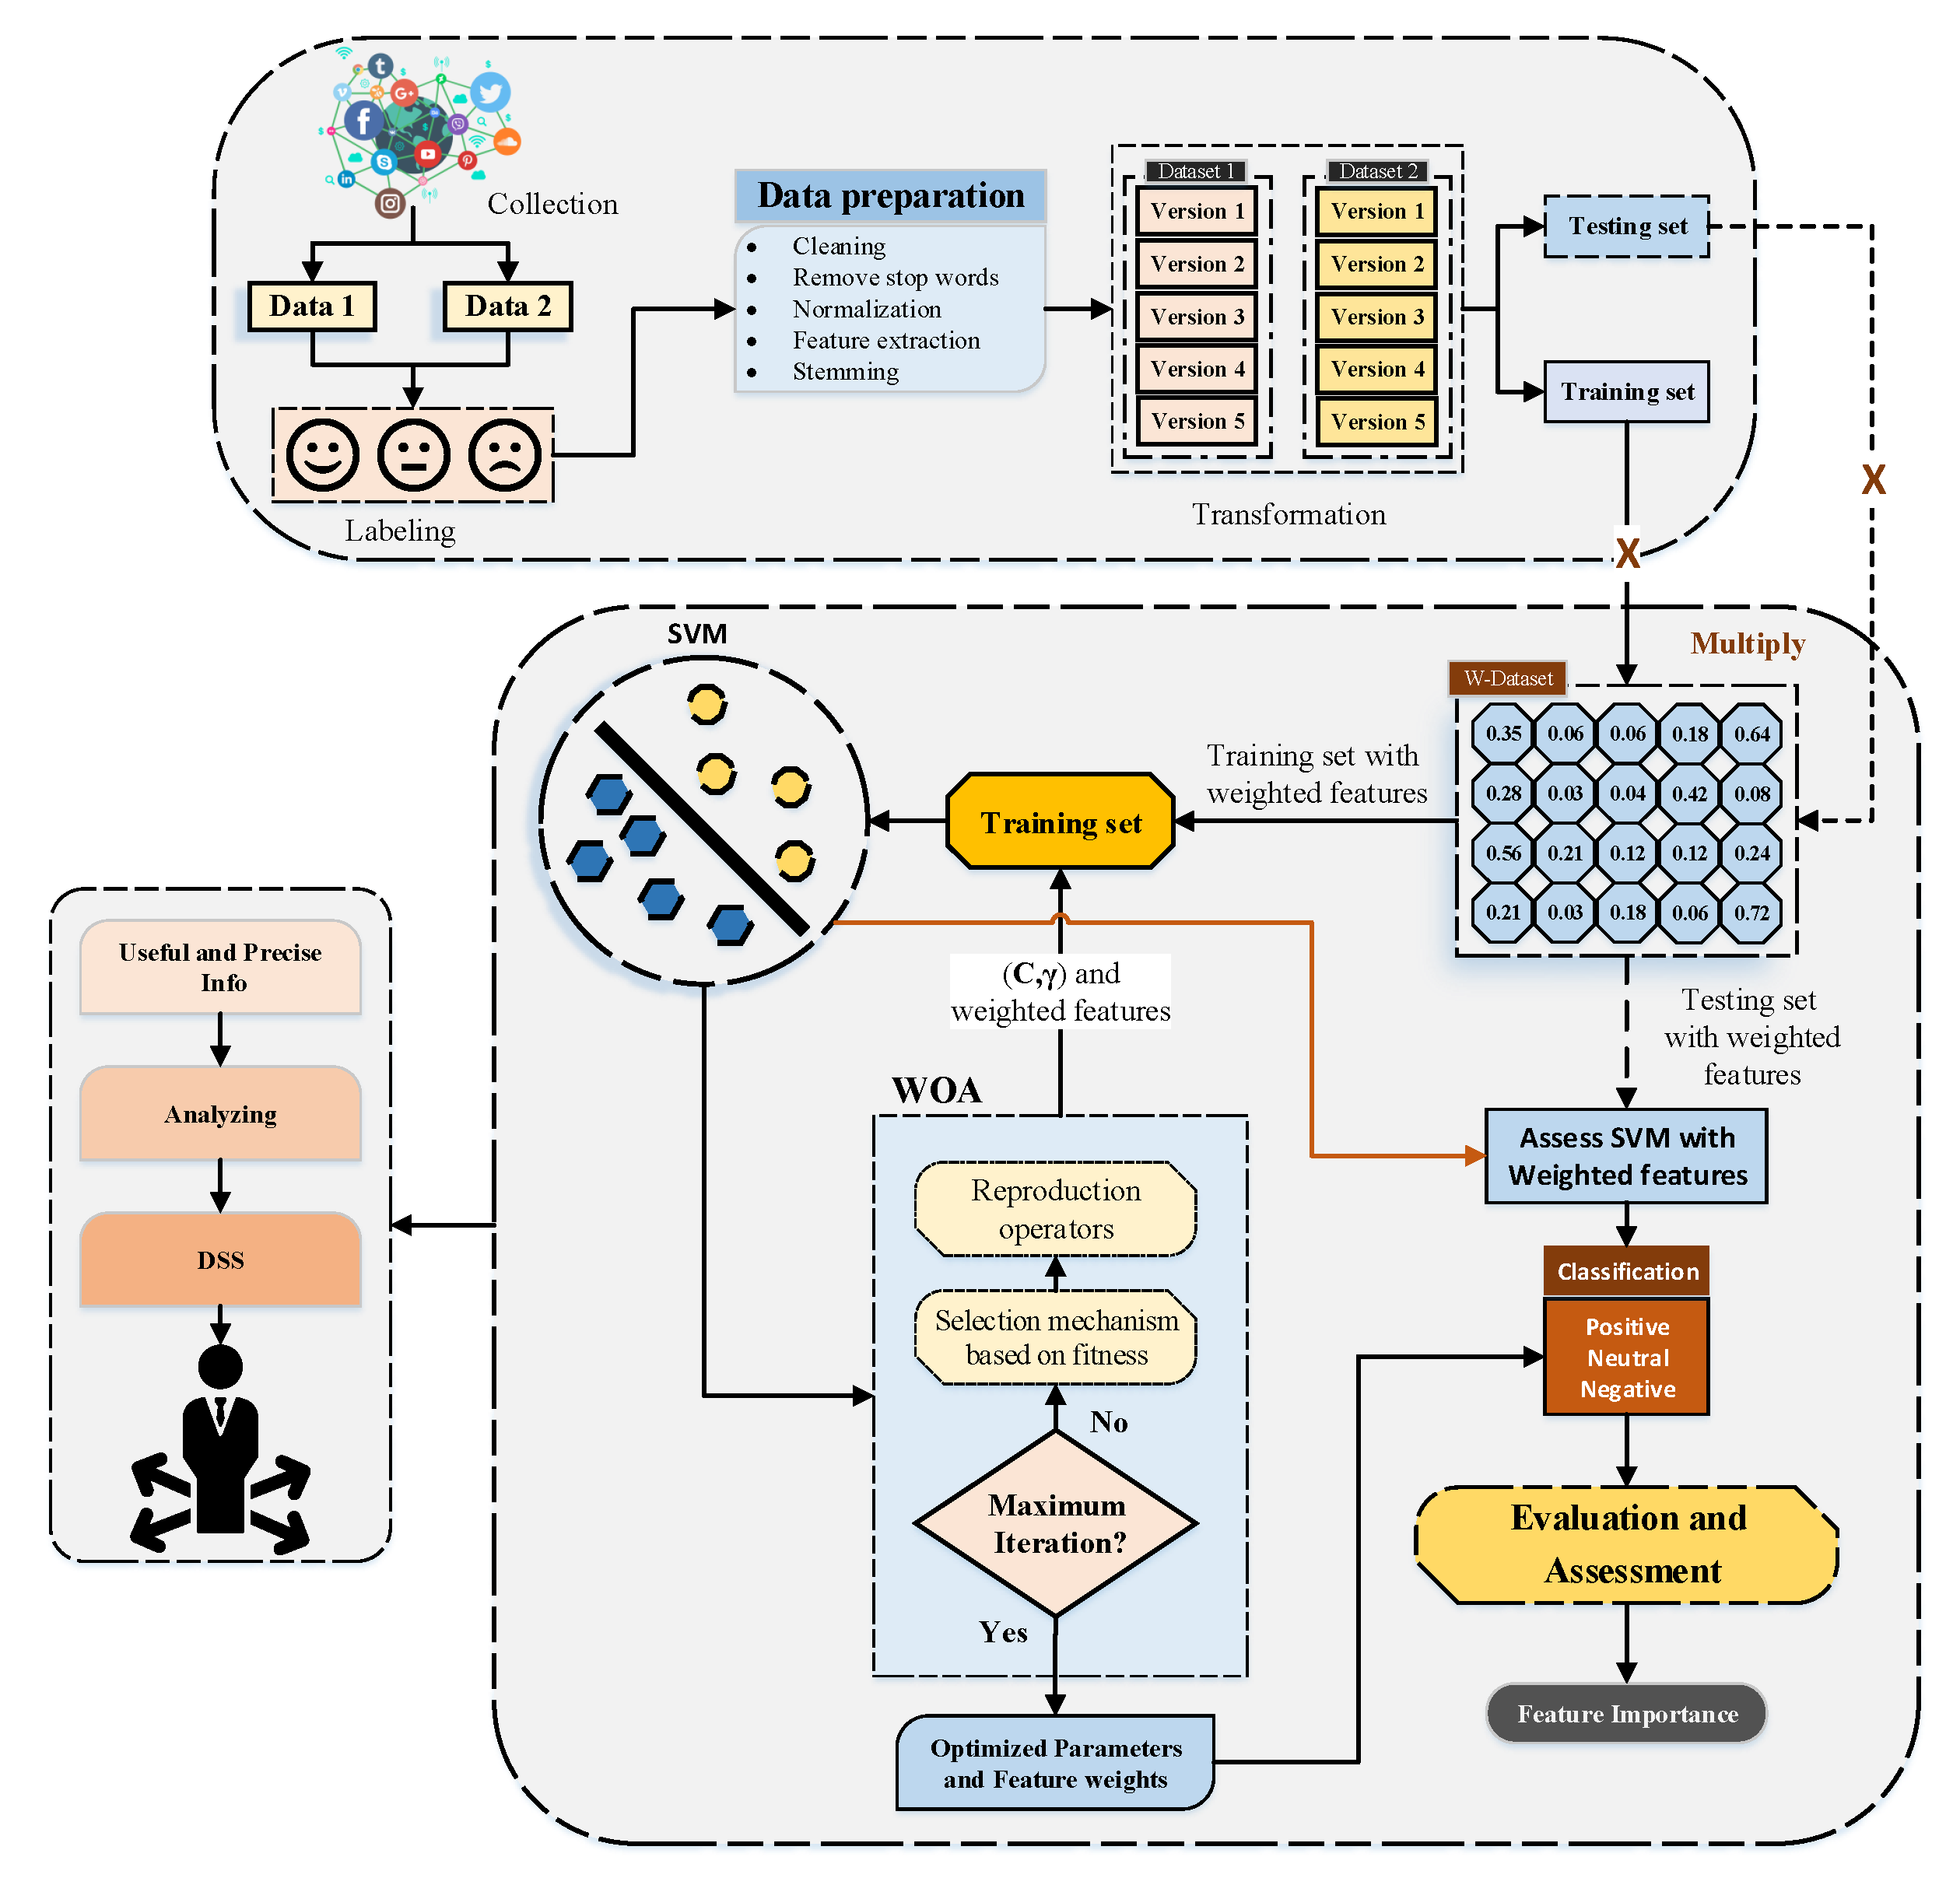
4.2.3. System Architecture
The architecture of our proposed approach consists of various steps to fulfill a complete execution. Starting by dividing the dataset into training and testing subsets, the utilized splitting mechanism is the k-fold criteria. In every k experiment, the training set is split into parts while the testing set (remaining) partitions to part. The process is repeated k times with a unique set for each training and testing partition. This is done to ensure the maximum diversity for training and testing sets to obtain the best possible model.
Moreover, and depending on the training set, the WOA randomly initializes the first solution. The solution consists of, as mentioned earlier, SVM hyperparameter elements (
C and
) and the weighted features of the dataset elements. Then, the SVM is trained based on this given solution (
C,
, and new features value), and during the training inner cross-validation is applied to avoid any overfitting problem. Afterward, the selected
C and
values alongside the weighted features transmitted to WOA as fitness values (accuracy). All the previous processes are repeated in every fold until the maximum number of iterations in the WOA algorithm is reached. The best solution provided by the WOA is used for the testing of that fold, then the average of all folds was taken.
Figure 3 illustrates all the previous processes.
5. Experiment and Results
This section shows the experimental setups and the evaluation measures considered while conducting the experiments. This section also discusses the results achieved by conducting the experiments for the proposed WOA-SVM approach. It includes a comparative analysis of the accuracy and F-measure values between the proposed approach and other standard classification algorithms, which are NB, K-NN, J84, and SVM, in addition to other metaheuristic algorithms, which are the GA, PSO, and MVO. Moreover, this section presents the feature importance analysis of the proposed approach.
5.1. Experimental Setup
The experiments were run on a personal computer with an AMD Ryzen 5600X 3.7 GHz, 16 GB RAM, and Windows 10 specifications. The extraction of the comments from the Facebook website was done using the Rfacebook package. The implementation of the proposed model and other metaheuristic algorithms are developed on Matlab R2016 version.
The values of the parameters for the metaheuristic algorithms can be observed in
Table 3.
5.2. Evaluation Measures
This section presents the evaluation measures applied to the experiments, which include the accuracy and F-measure.
The accuracy measure is calculated by finding the number of correct predictions for all the classes and dividing it by the number of instances [
59,
60], as observed from the following equation:
where
,
, and
represent the number of instances that are predicted correctly as positive sentiment, negative sentiment, or neutral sentiment, respectively.
instances is the number of instances in a dataset.
On the other hand, the
F-measure is the harmonic mean of precision and recall [
61], which is calculated by the following equation:
where the
Precision is the percentage of correct predictions for a class relative to all the predictions of the same class [
61], and the
Recall is the percentage of correct predictions for a class relative to all instances that actually belong to the class [
62].
5.3. Standard Classification Models Comparison
This section discusses the results achieved by conducting the experiments of the proposed WOA-SVM approach in terms of accuracy and F-measure. It also compares the proposed approach with the other standard classification algorithms which are NB, K-NN, J84, and SVM.
The accuracy values for the First-rule dataset for the proposed approach and the other standard algorithms can be observed in
Table 4. The proposed approach has higher accuracy values than any other algorithms for all the first-rules datasets. K-NN algorithm has better accuracy values for the Data 1 and Data 2 datasets than the other basic classification algorithms, but it could not compete with the values achieved by the proposed approach, as the proposed approach is approximately 1.5% and 4.5% higher than K-NN for Data 1 and Data 2, respectively. Likewise, the NB algorithm could not compete with the values achieved by the proposed approach for Data 3, Data 4, and Data 5 datasets, although it has higher values than the other algorithms. The proposed approach is approximately 5%, 6%, and 4.5% higher than NB for Data 3, Data 4, and Data 5, respectively. In contrast, J84 has the worst accuracy values for all the first-rules datasets. The same observations can be concluded from
Table 5 for the latter-rules datasets where the proposed approach has the highest accuracy values compared to the other algorithms. For these datasets, J84 has closer accuracy values to the other algorithms than the ones achieved by the first-rules datasets, but still no algorithm could achieve better values than the proposed approach.
The F-measure values for the first-rules and Latter-rules datasets can be observed by
Table 6 and
Table 7, respectively. It is observed from both tables that the proposed approach has an outstanding performance compared to the other algorithms having a recognizable higher F-measure value than the others. It has a 27–50% increase in the value of the F-measure compared to the other algorithms for the first-rules datasets. In contrast, it has a 20–31% increase in the value of the F-measure compared to the other algorithms for the latter-rules datasets. It is also observed that the SVM has the worst values compared to the others for the first-rules datasets, and NB has better values than the other standard classification algorithms for both first-rules and latter-rules datasets.
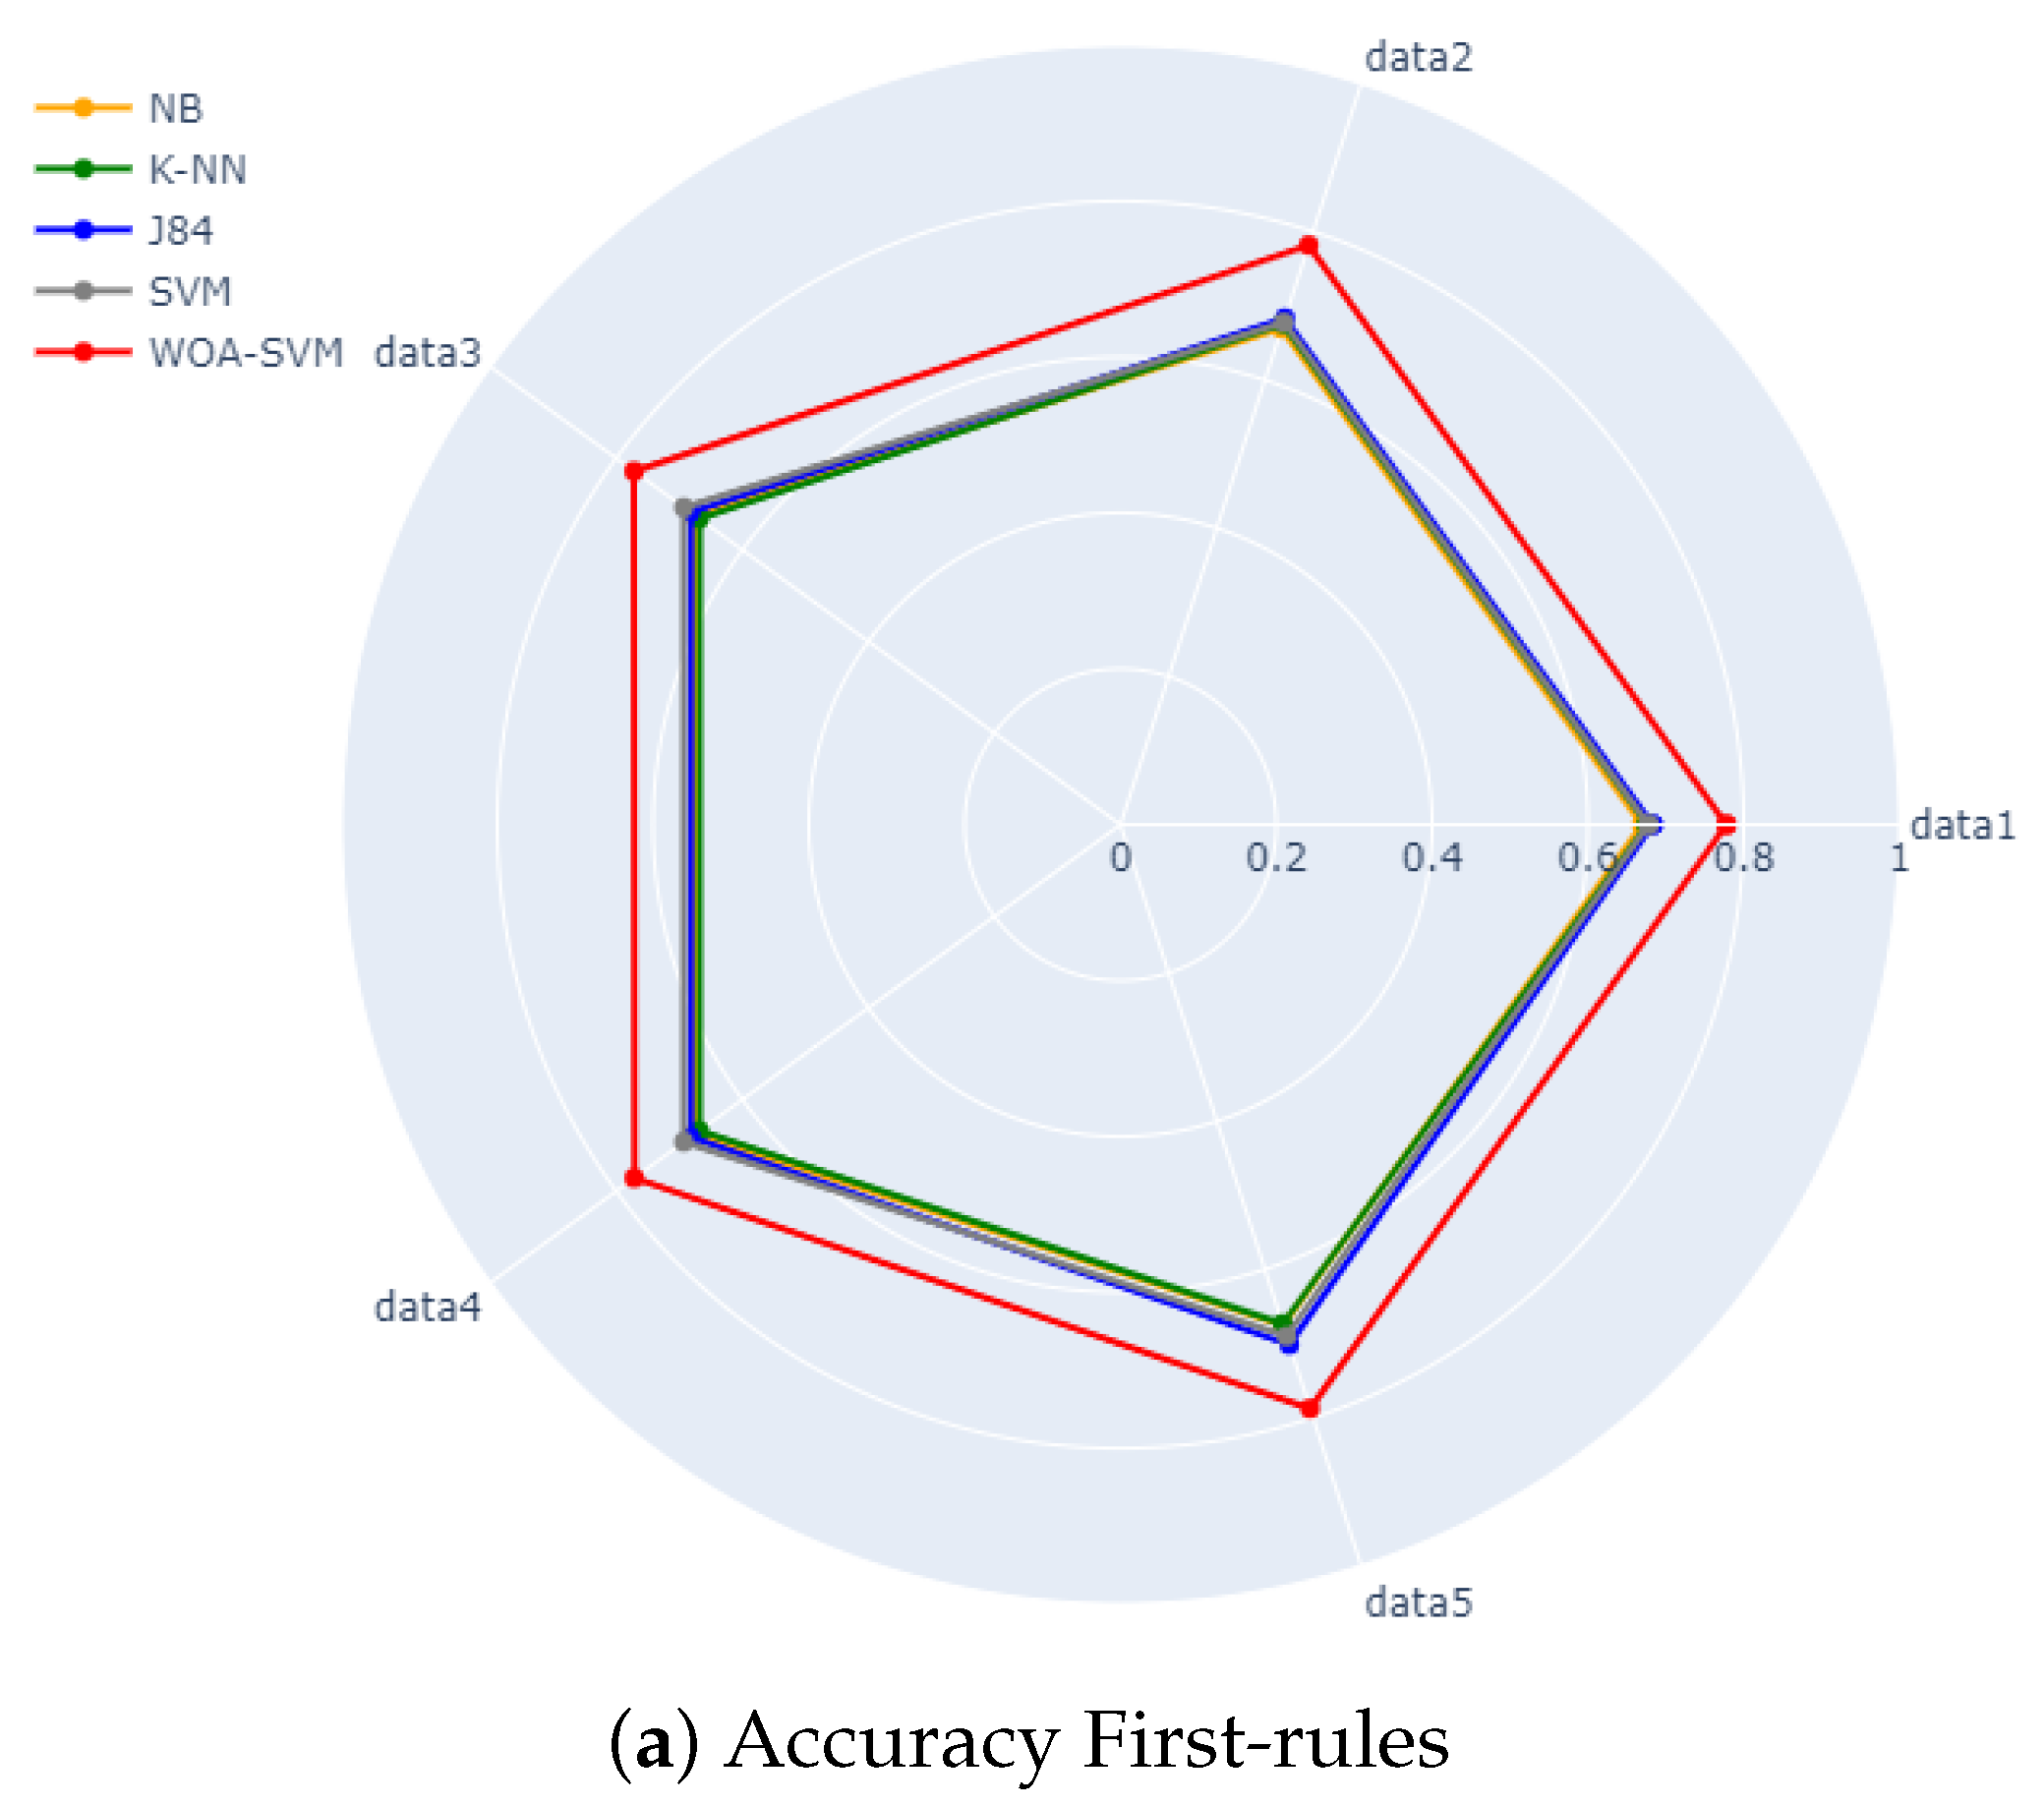
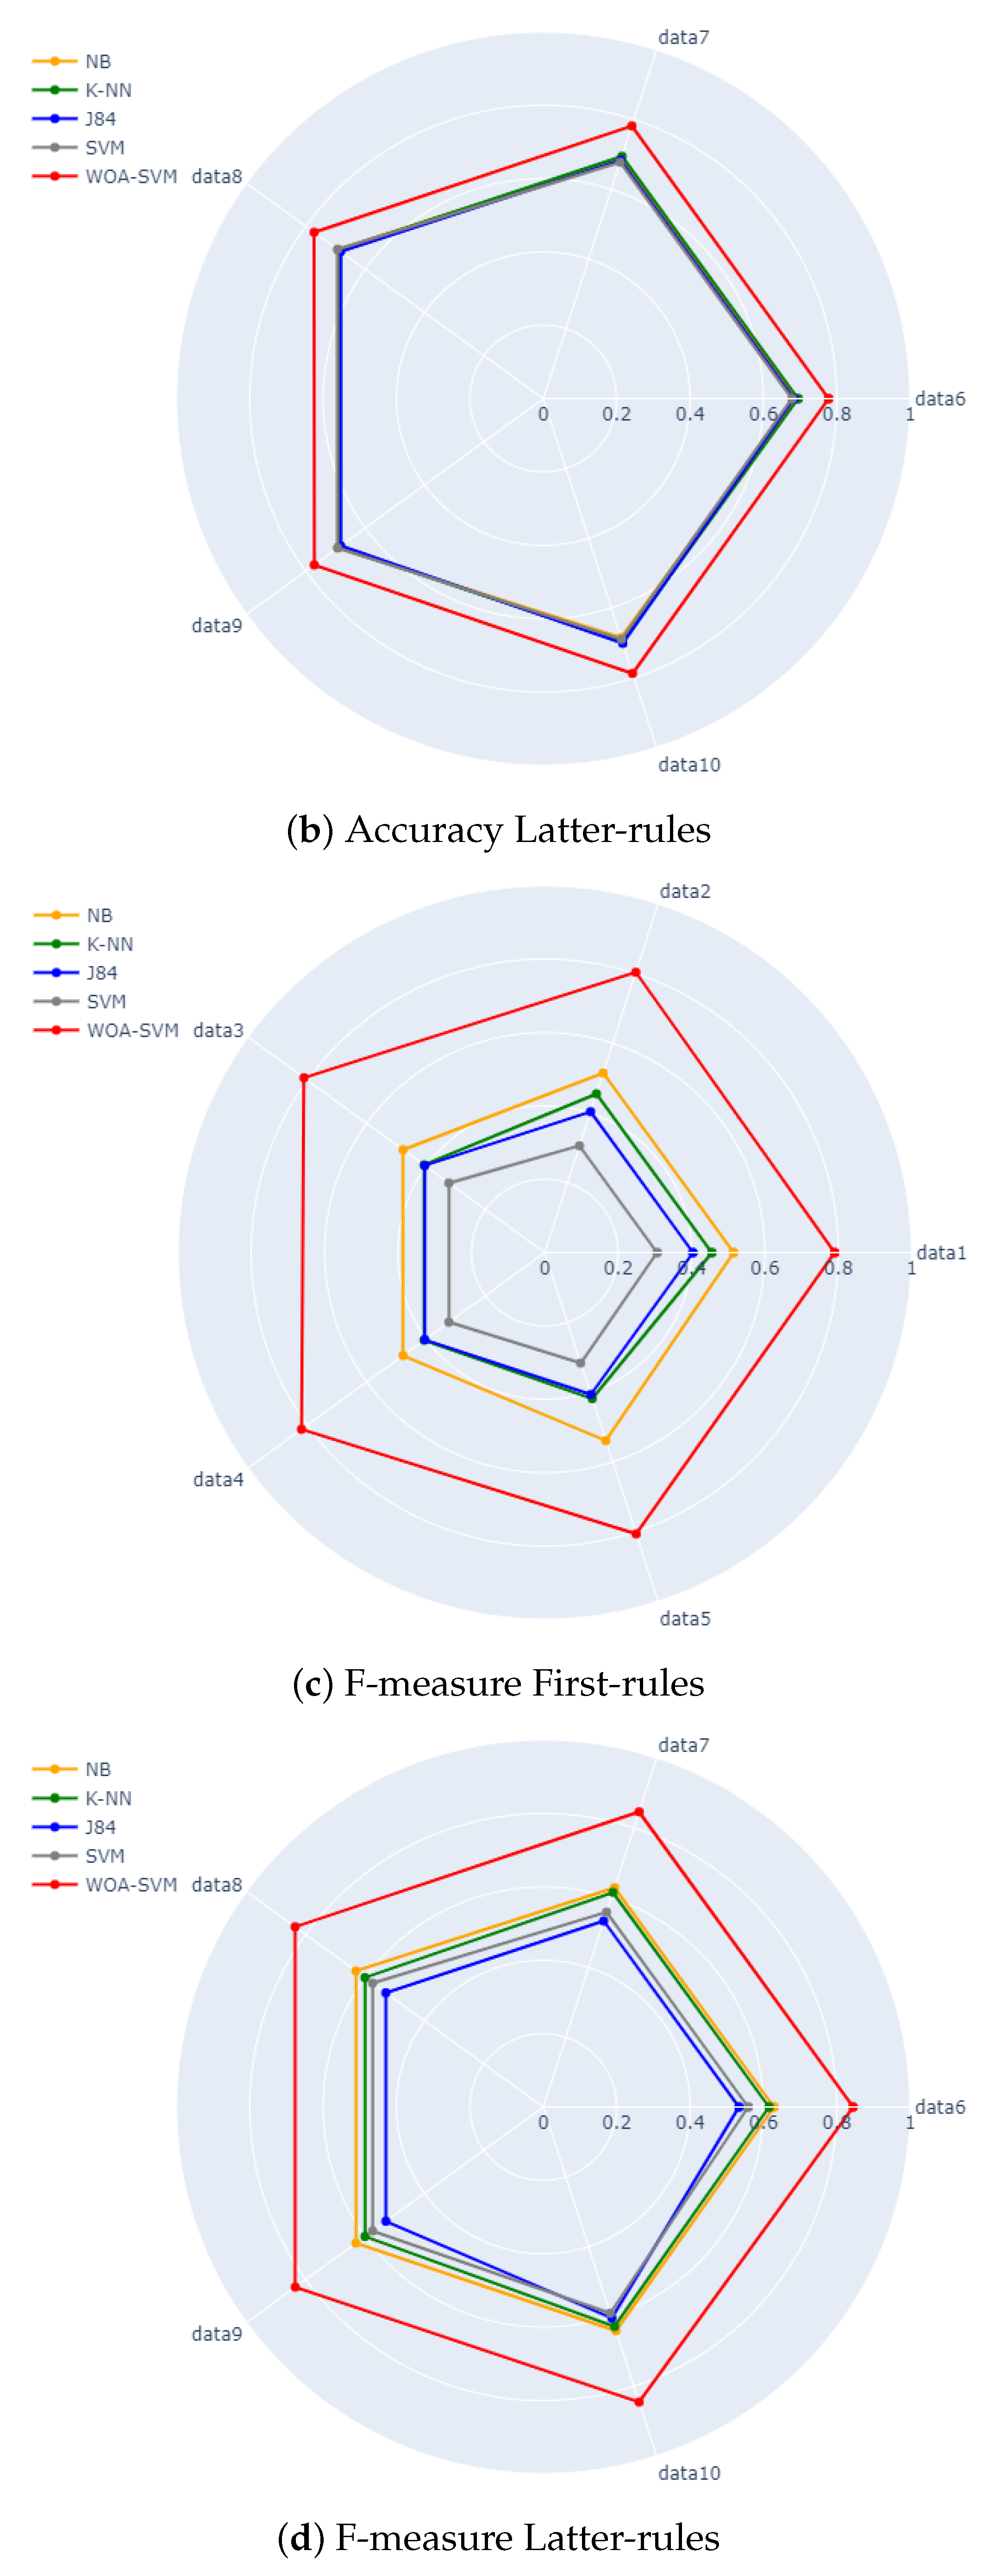
A summary and visualized representation of the results can be observed by the radar chart of
Figure 4 for both the accuracy and F-measure values for both first-rules and latter-rules datasets. It is clearly observed from the figures that the values of the accuracy and F-measure for the proposed WOA-SVM approach, which is represented by the red polygon, are much higher than the other values for the standard algorithms, having a red polygon surrounding all the other polygons. It is also observed that the proposed approach has even advanced values compared to the other algorithms for the F-measure. In addition, the values of the F-measure for the standard algorithms are clearly very low for the first-rules datasets, as the corresponding polygons are closer to the center of the radar compared to the other figures, which is represented by
Figure 4c.
5.4. Metaheuristic Algorithms Comparison
A comparison between the accuracy and F-measure values for the proposed WOA-SVM and the other meta-heuristic algorithms is discussed in this section.
Table 8 and
Table 9 show the accuracy values for the first-rules and latter-rules datasets, respectively. It is observed from
Table 4 that the proposed approach outperforms the other approaches for Data 2, Data 4, and Data 5. However, the PSO-SVM outperforms the proposed approach for Data 1 and Data 3, but the proposed approach still outperforms the GA-SVM and MVO-SVM for these datasets. As for the latter-rules datasets, the proposed WOA-SVM approach outperforms the other algorithms for all the datasets except the Data 9 dataset.
Looking at the other tables considering the F-measure, which are
Table 10 and
Table 11, similar observations can be observed. WOA-SVM outperforms the other algorithms for Data 2 and Data 4 but PSO-SVM has higher F-measure values for Data 1, Data 3, and Data 5. On the other hand, and for the latter-rules datasets in
Table 11, the proposed approach outperforms the other algorithms for all the datasets except the Data 9 dataset, which is also observed from the accuracy values in
Table 9.
5.5. Feature Importance Analysis
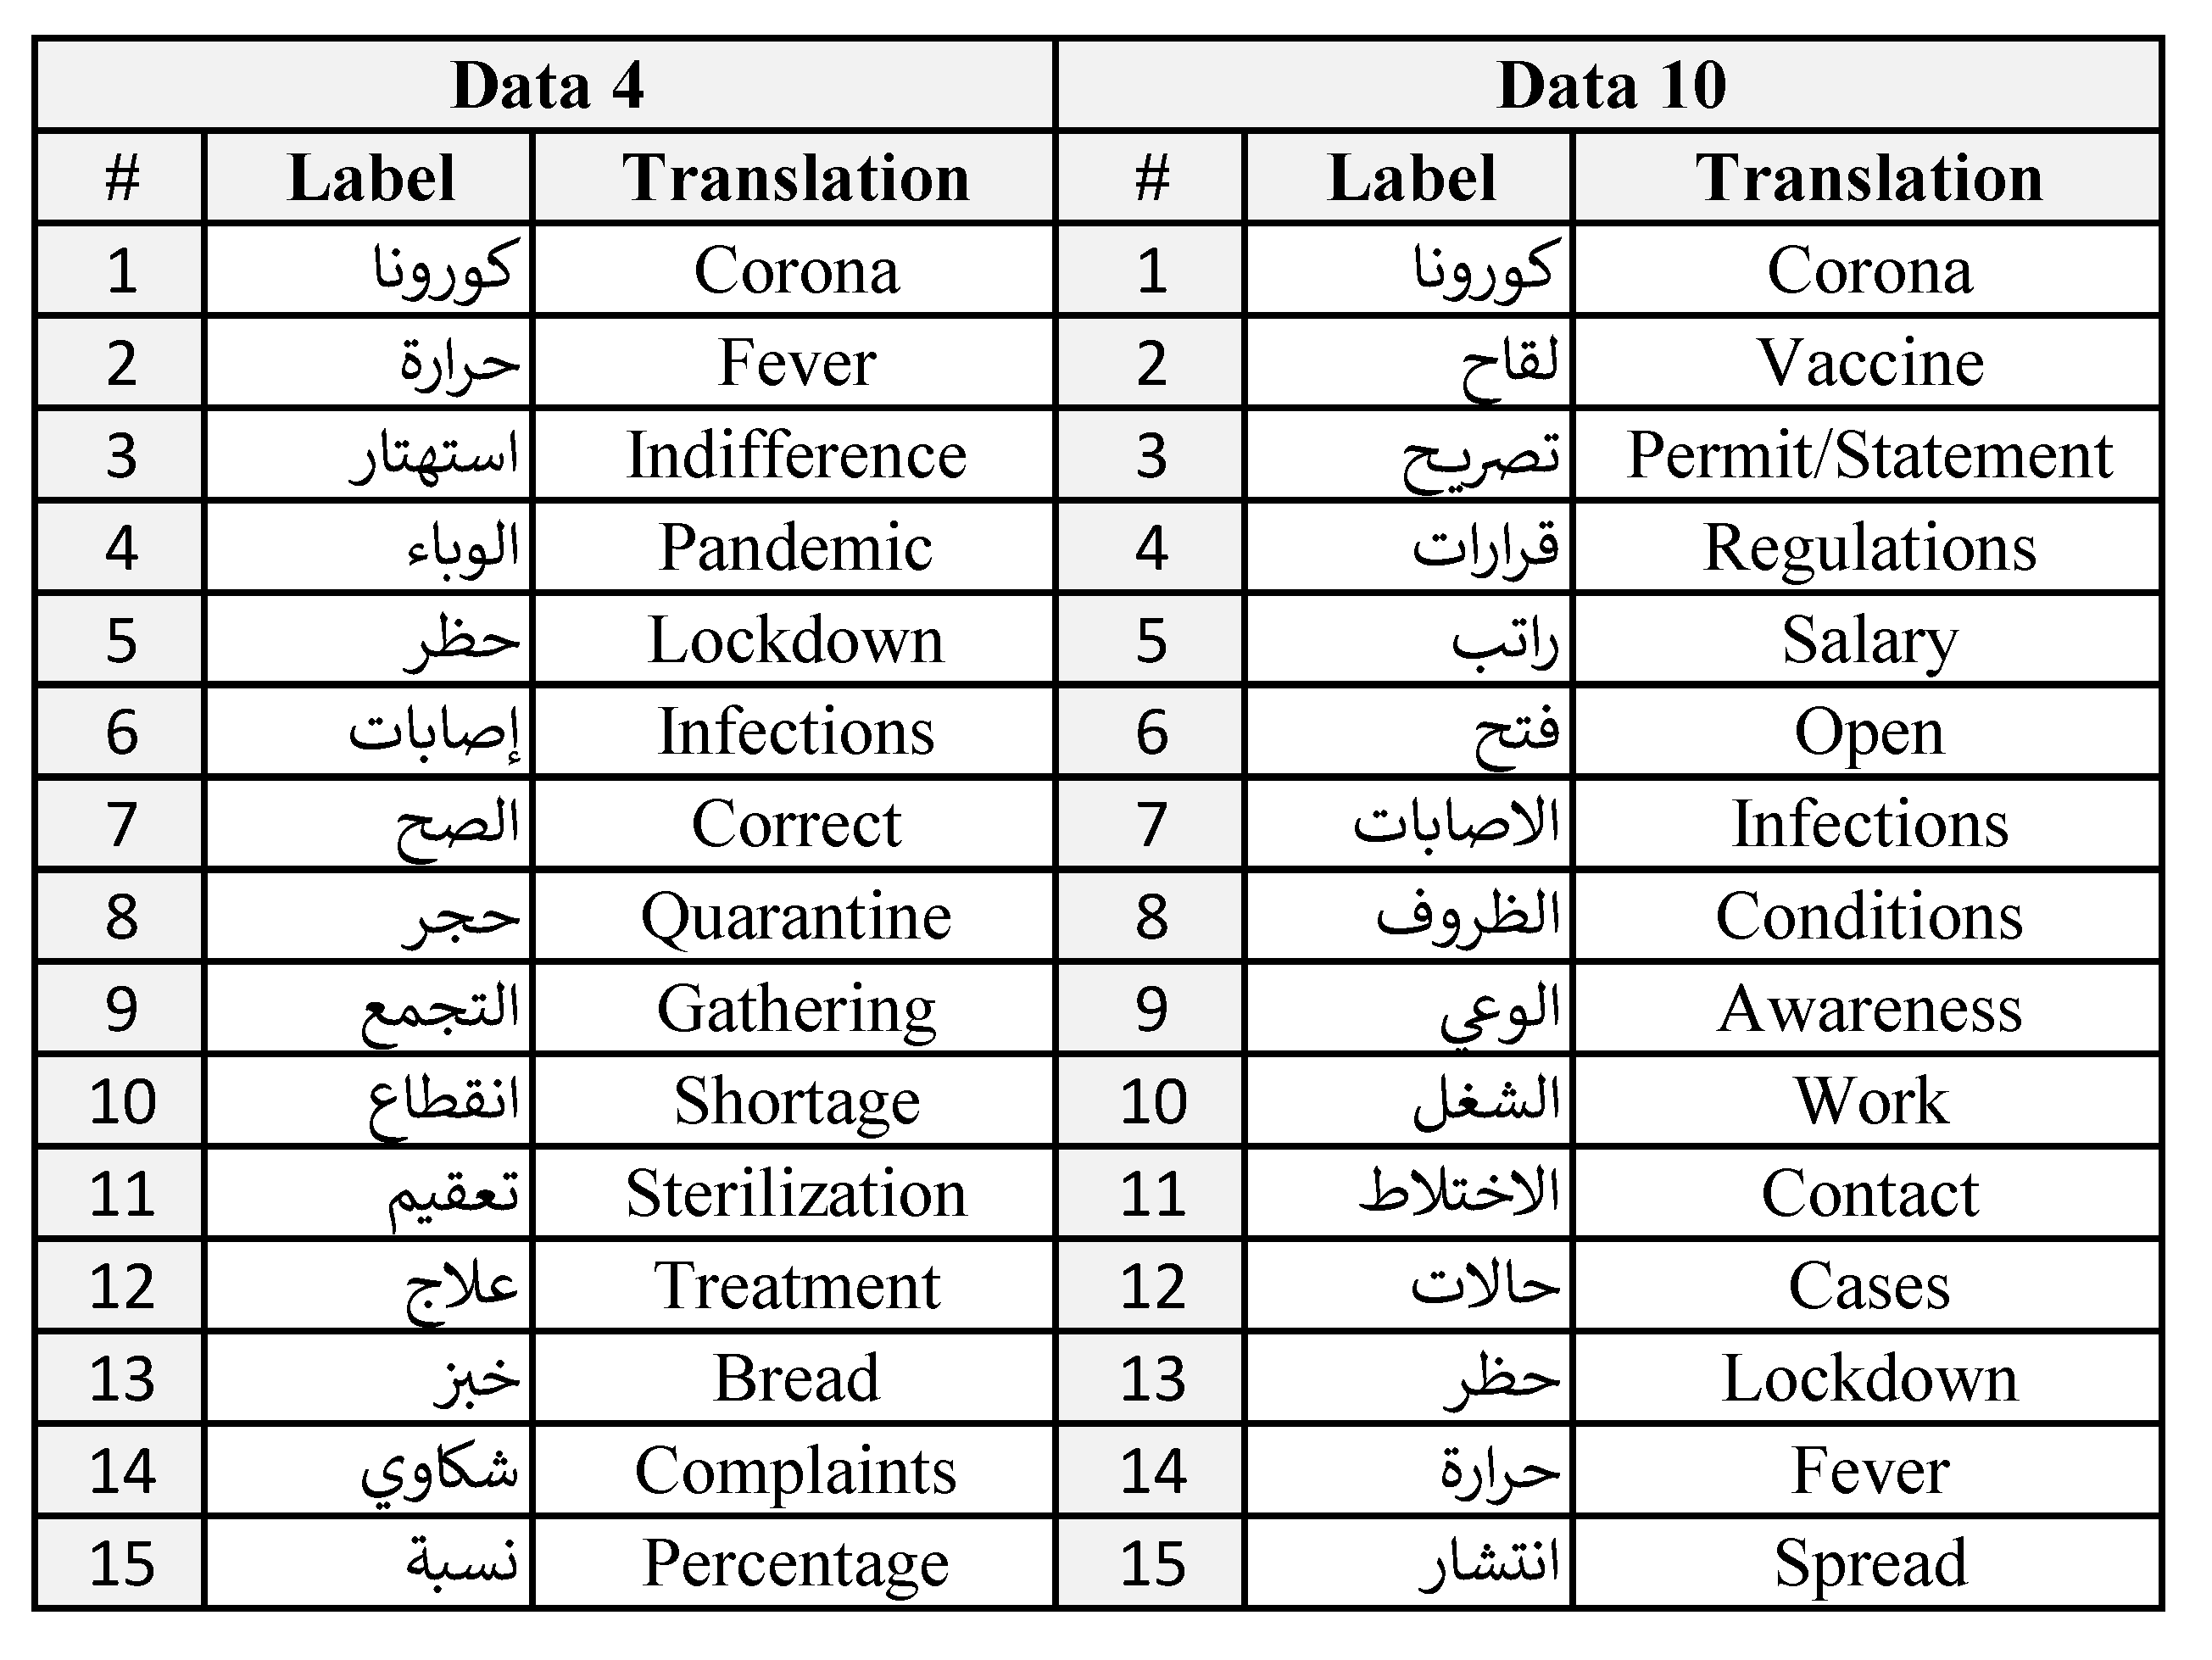
In this subsection, a comprehensive discussion and analysis of the most important features for sentiment prediction are presented. Two datasets were selected from the ten versions (Data 4 and 10) to analyze their features. The selection was performed based on their results performance of the proposed approach, where the highest accuracy was obtained by Data 4 in the first rules and Data 10 in the latter rules with 73.6370% and 78.7798%, respectively.
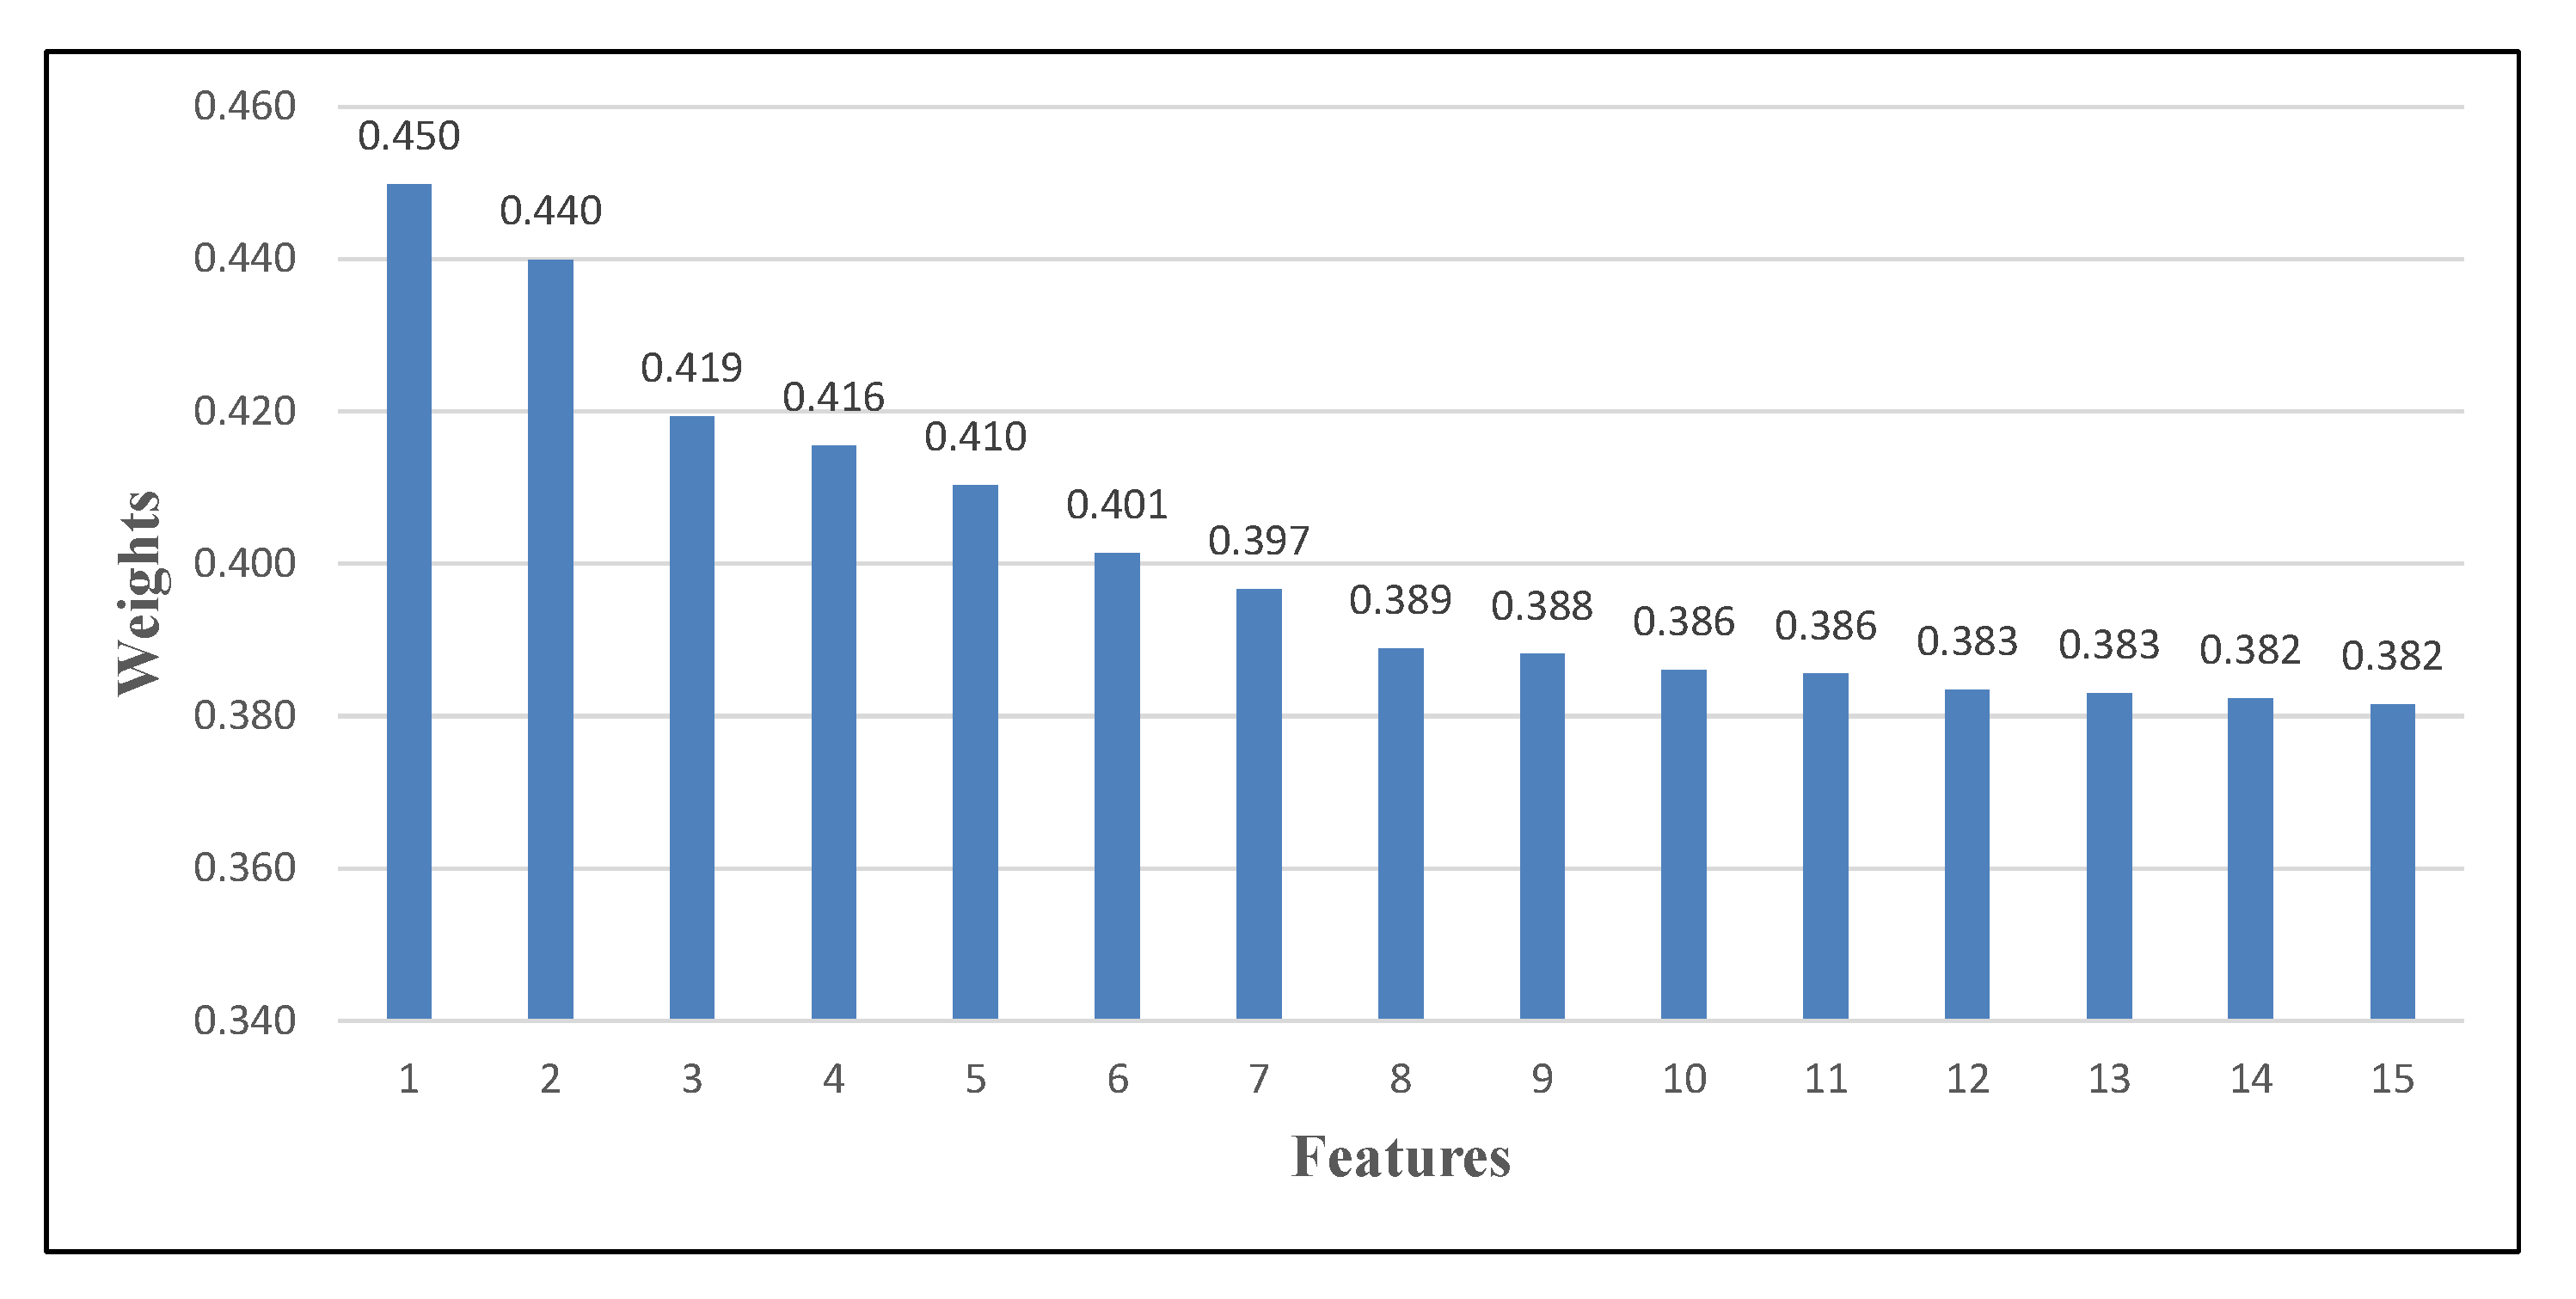
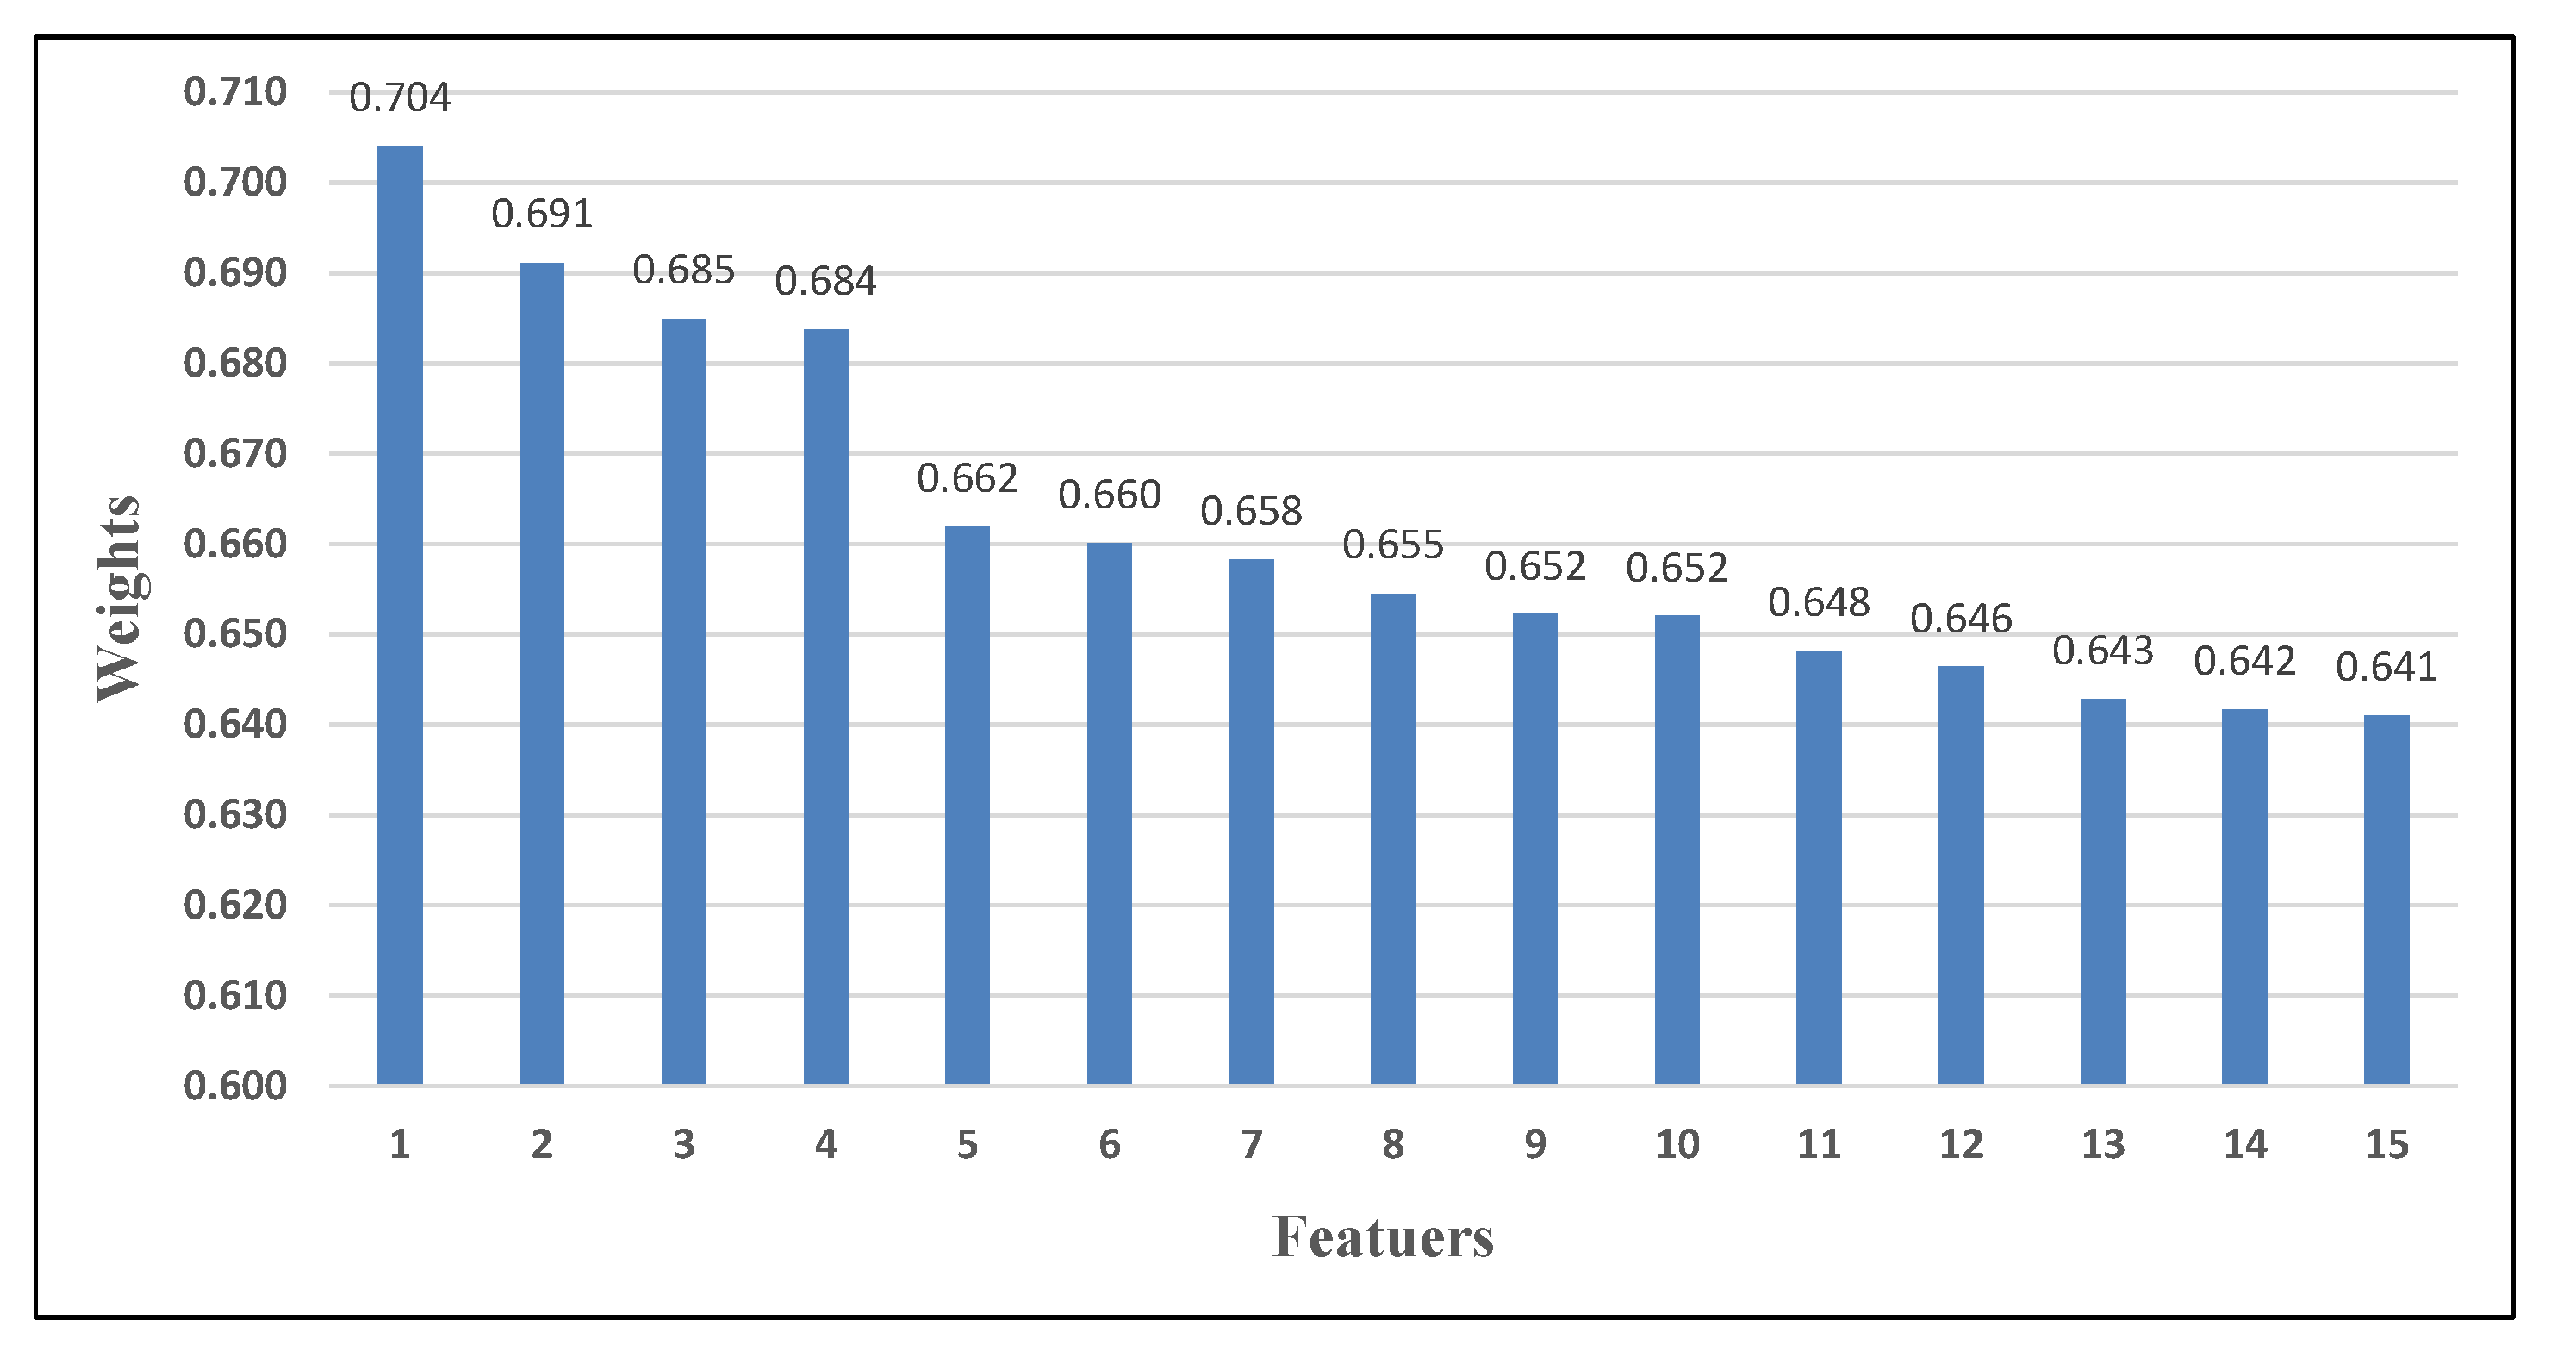
Figure 5 illustrates the features order, names, and their translation for the two datasets, while
Figure 6 and
Figure 7 show the weights of each feature. It is worth mentioning that Data 4 represents the first rules period, whereas Data 10 depicts the latter rules period.
The best feature for Data 4 was the ‘Corona’ term, which means that it is the best feature to differentiate between the sentiment classes. Therefore, whenever the word ‘Corona’ is used in the comments it is usually utilized to describe a negative context. The second feature was accomplished by the ‘Fever’ feature. This feature explains one of the most crucial symptoms of the COVID-19 disease. In other words, the majority of people are considering ‘Fever’ as an important word when they reply to government regulations. Furthermore, the ‘Indifference’ feature placed third, this indicates how people are afraid of others’ reckless/careless behavior during the situation, where they indirectly request and alert others and the government of this attitude. On one hand, feature number four (‘Pandemic’) explains the situation generally. On the other hand, in feature five, citizens were asking and hoping for a ‘Lockdown’ as a solution, either for specific locations or the whole country.
As can be seen in this period, people were interested more in the disease itself. There are several features such as ‘Quarantine, Gathering, Sterilization, and Treatment’ proving that. These features show that most opinions are hoping for more consideration from others, thus seeking to increase awareness. Moreover, other features like ‘Shortage’ and ‘Bread’ implied that there is some anxiety and concerns about merchandise scarcity, particularly goods like ‘Bread’. Additionally, a feature like ‘Correct’ demonstrates that the majority of citizens agree with the government regulations and were satisfied with the government’s overall performance at that time.
As for the top-5 features of Data 10, similar to the previous data, feature ‘Corona’ obtained first place as well, while the second feature was acquired by ‘Vaccine’ which describes a new positive context. The feature explains the existence or the necessity of ‘Vaccine’ at this period. Taking the ‘Vaccine’ becomes the best and the foremost solution to permanently get rid of Covid-19. Besides, the third feature (‘Permit/Statement’) can be described in two ways: first by giving permission of others, stores, and places to get out or open, while in the second way, it could mean that it’s an announcement from the decision-makers which is more likely considering the following feature. The ‘Regulations’ feature shows that there is more interest from people of this period about government regulations and how it can influence their lives and other things like the next feature, ‘Salary’.
In this second period, we can notice that people change their interest from the disease to the declaration of the government. Features such as ‘Open’, ‘Conditions’, and ‘Work’ clarify that. People are now feeling monotonous about the circumstances and they are waiting for new regulations to change the situation, while some individuals remain interested in the disease and its effect as shown in features like ‘Infections’, ‘Contact’, ‘Cases’, and ‘Spread’.
Overall, we can observe that people were first interested in the disease and its impact, while in the second period, they lost interest and consecrated more on other factors, including, work, school, making money, and regulations. Furthermore, we can see that there were features that were important in one data and not in the other, such as ‘Fever’ and ‘Lockdown’. Therefore, decision-makers could take into account some of these features and act directly and quickly to make accurate decisions. Analyzing these features that are extracted from public opinions, concerns, feedback, and requests will help and alert the government about the number of violations that occurred in specific locations, thus taking action immediately.
In the same context, this can also give an early alarm for their governments about the citizens’ negative attitudes or any possible aggressive reactions against the governments’ regulations, which may threaten the country’s safety and cause great damage to the current pandemic situation. Especially in the latter period where people became fed up with the lockdown situation and were more concerned about other issues such as ‘Work’, ‘Salary’, ‘Food’, and education, they started asking for reopening of different life aspects and became more dissatisfied about their governments’ regulations.
All aforementioned points can be addressed by our study decision support system, via investigating and ranking the most important set of key features for COVID-19 posts. Thus, these features can be taken into consideration by governments and policy makers, give them indications about when it is necessary to adjust their regulations or make any proactive actions to minimize risks of violations, unemployment, crimes, violence or even people’s depression and panic, besides trying to maximize the benefits. Therefore, our proposed DSS offers the governments’ decision makers an easy adaptable methodology that could facilitate complex decision-making processes and can be adapted to different scenarios and contexts in the future.
5.6. Approach Discussion
The core objective of this study is to propose a sentiment-based DSS for supporting Jordanian Government work. The study was conducted during the period of the Covid-19 pandemic, in which the whole world witnessed dramatic governmental decisions and a massive amount of posts talking about them. Yet, after conducting experiments as previously explained this section discusses limitations, advantages, and disadvantages of the proposed approach, WOA-SVM, in a comparative manner with the rest of the tested methods: GA-SVM, PSO-SVM, and MVO-SVM.
The proposed approach shows an excellent performance due to combined the SVM and WOA together for solving two major issues simultaneously: tuning the SVM parameters to enhance the sentiment prediction performance as well as weighting the features for identifying the most important information. Furthermore, compared with other approaches, such as deep learning and rule-based techniques, both approaches usually take time to perform due to the complexity of their models. Furthermore, the rule-based techniques required a lot of manual work as well as a deep knowledge of the domain, whereas deep learning cannot perform effectively on small datasets. On the other hand, the WOA-SVM can execute efficiently on small data and does not take long to perform. However, the proposed approach sometimes suffers from selecting the correct meta-heuristic algorithms for the problem, considering there is no optimal meta-heuristic algorithm that solves all problems.


 ,
, 


