Impact of COVID-19 Lockdown on the Fisheries Sector: A Case Study from Three Harbors in Western India

 , ,
, ,  ,
,  and
and
Abstract
:
1. Introduction
2. Materials and Methods
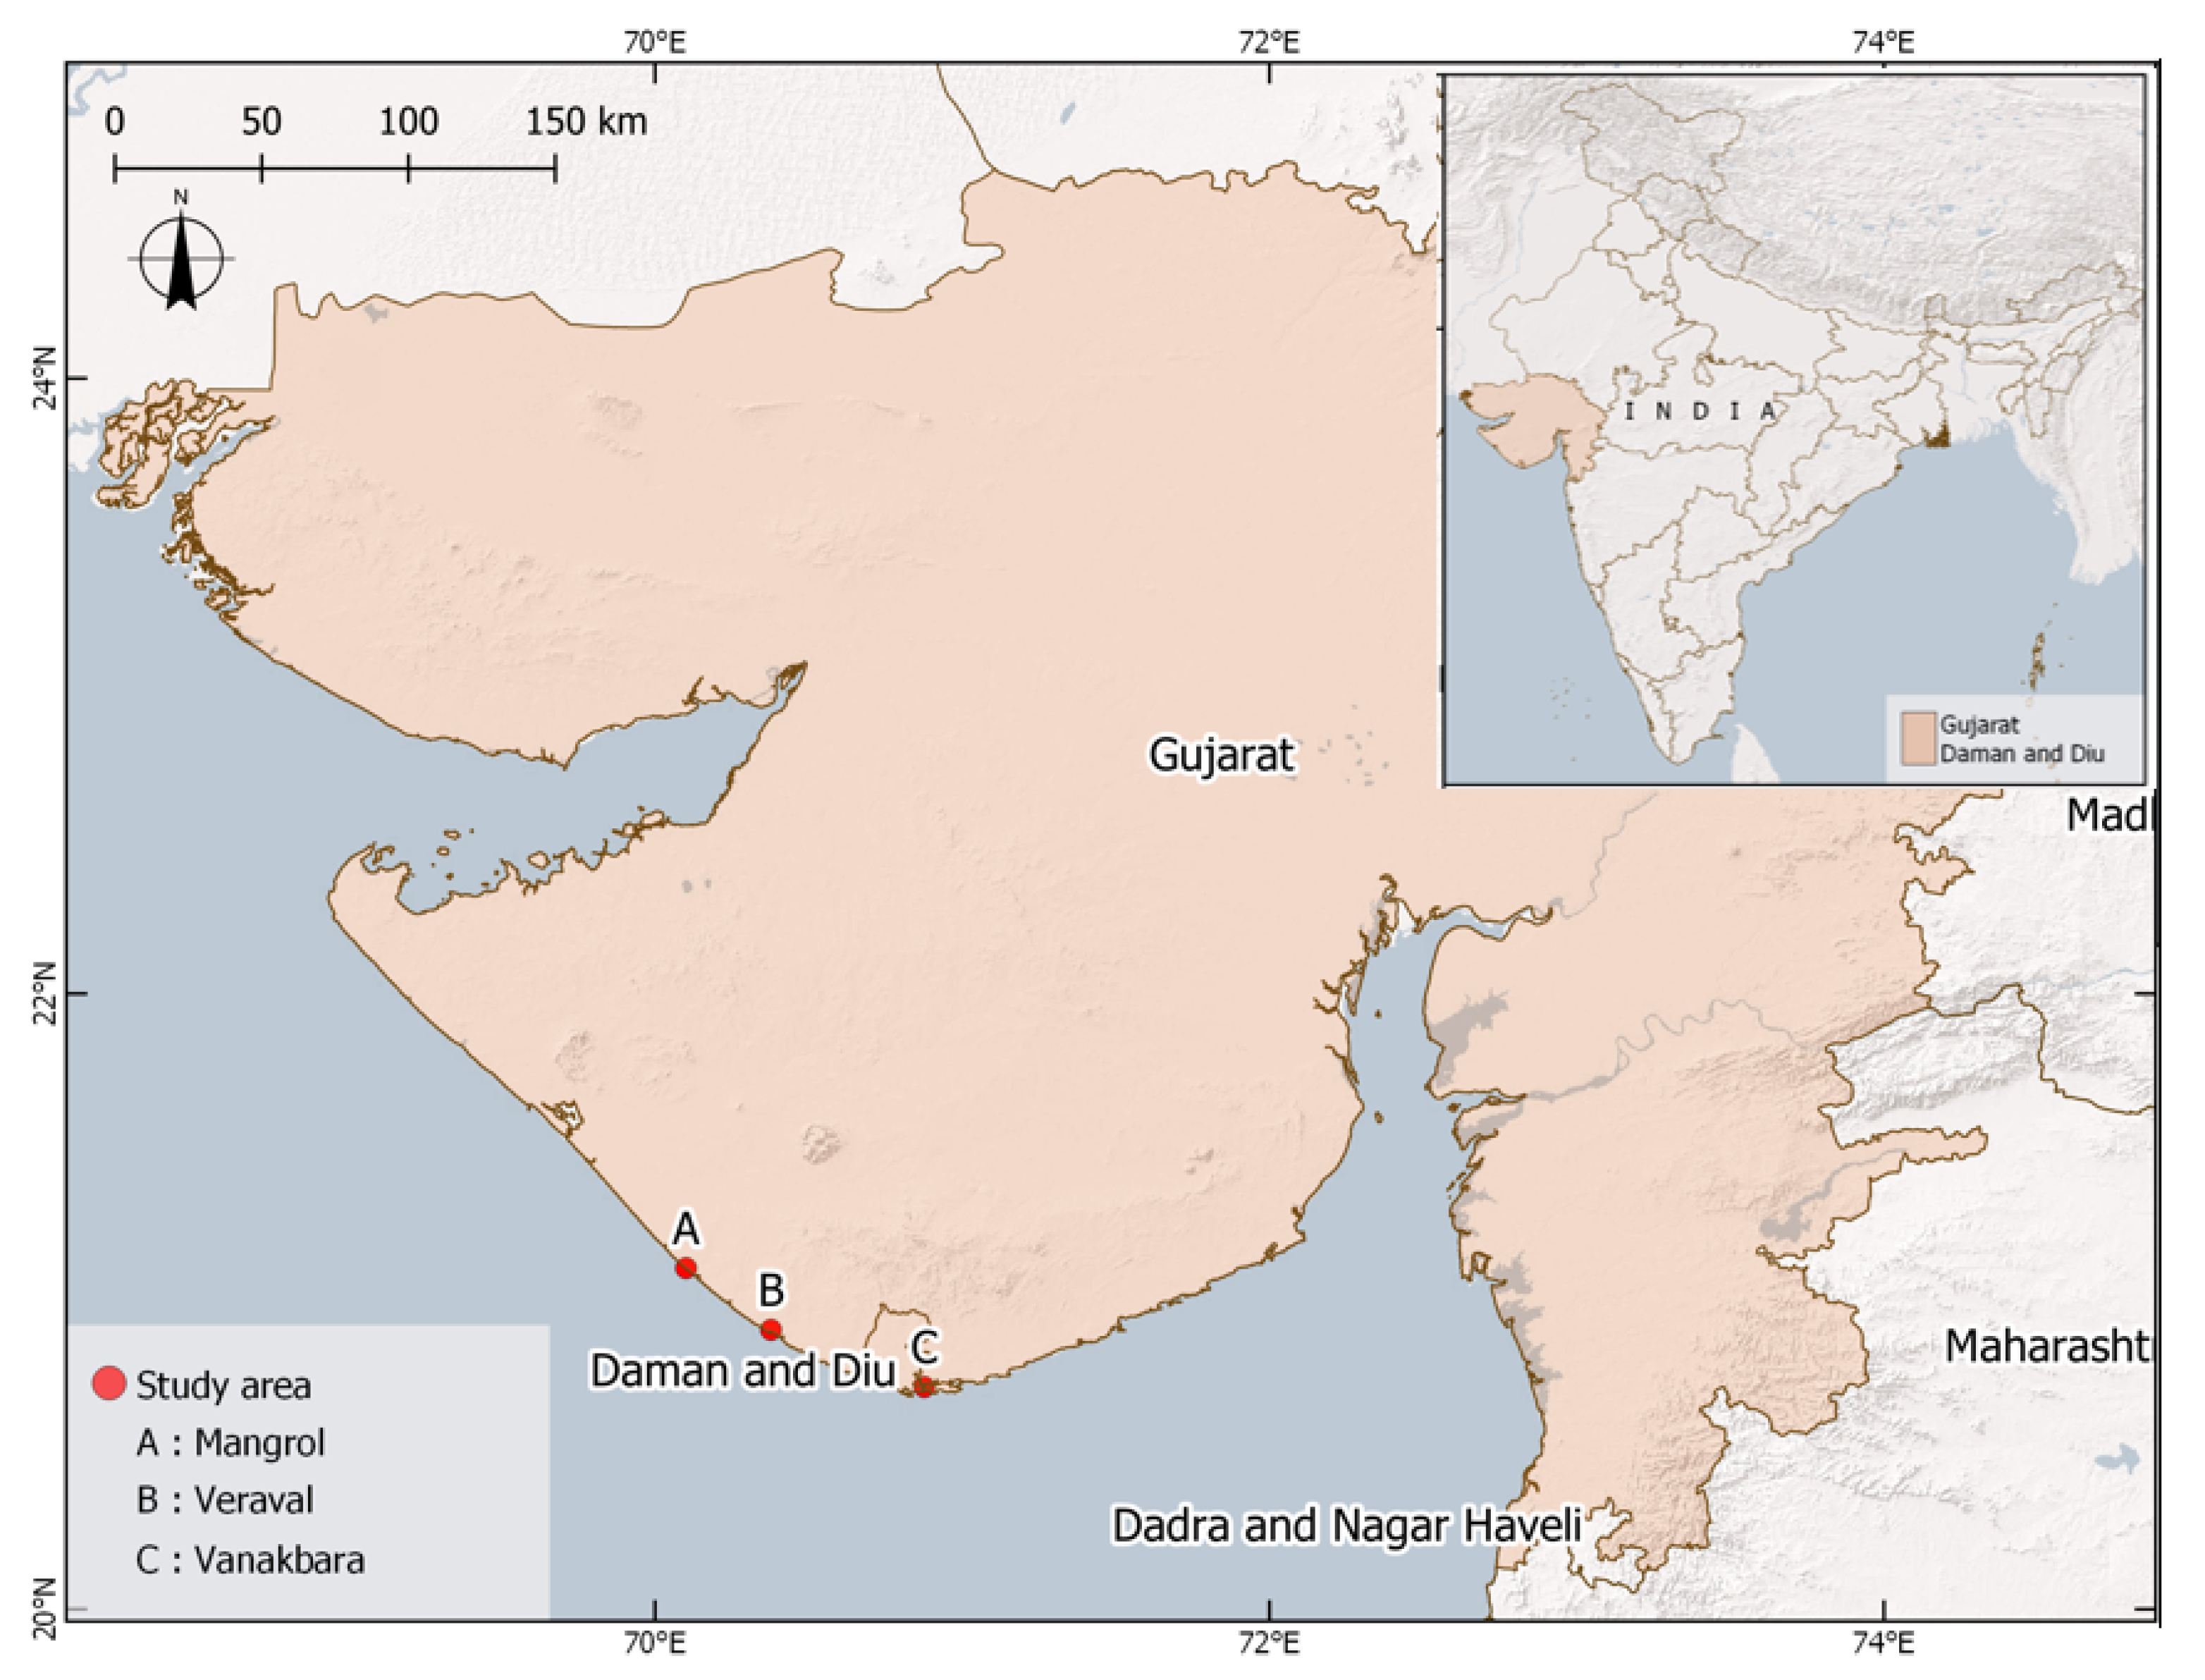
2.1. Study Area
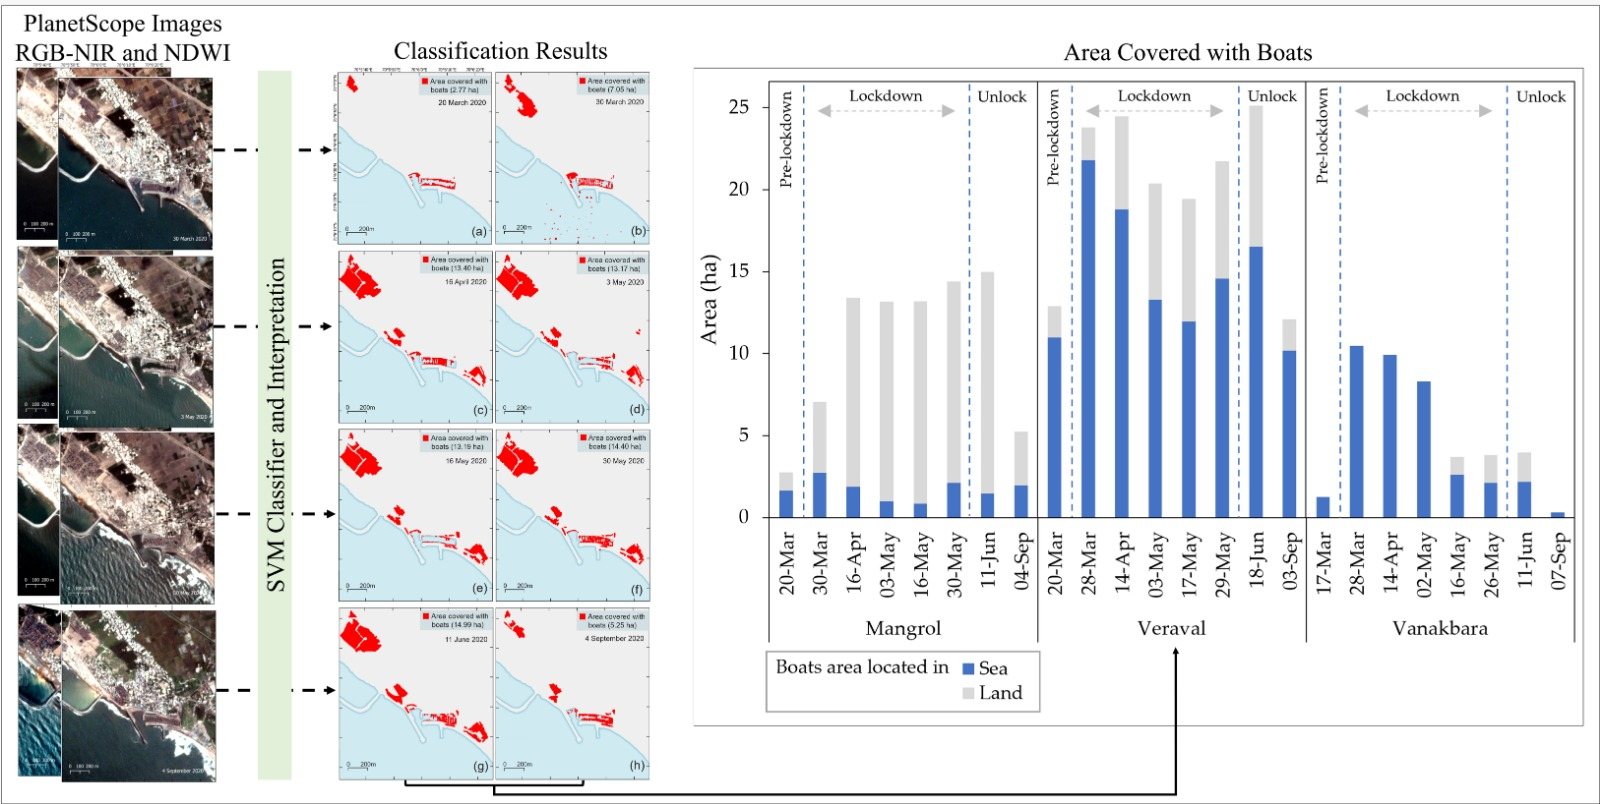
2.2. Remote Sensing Data
2.3. Methods
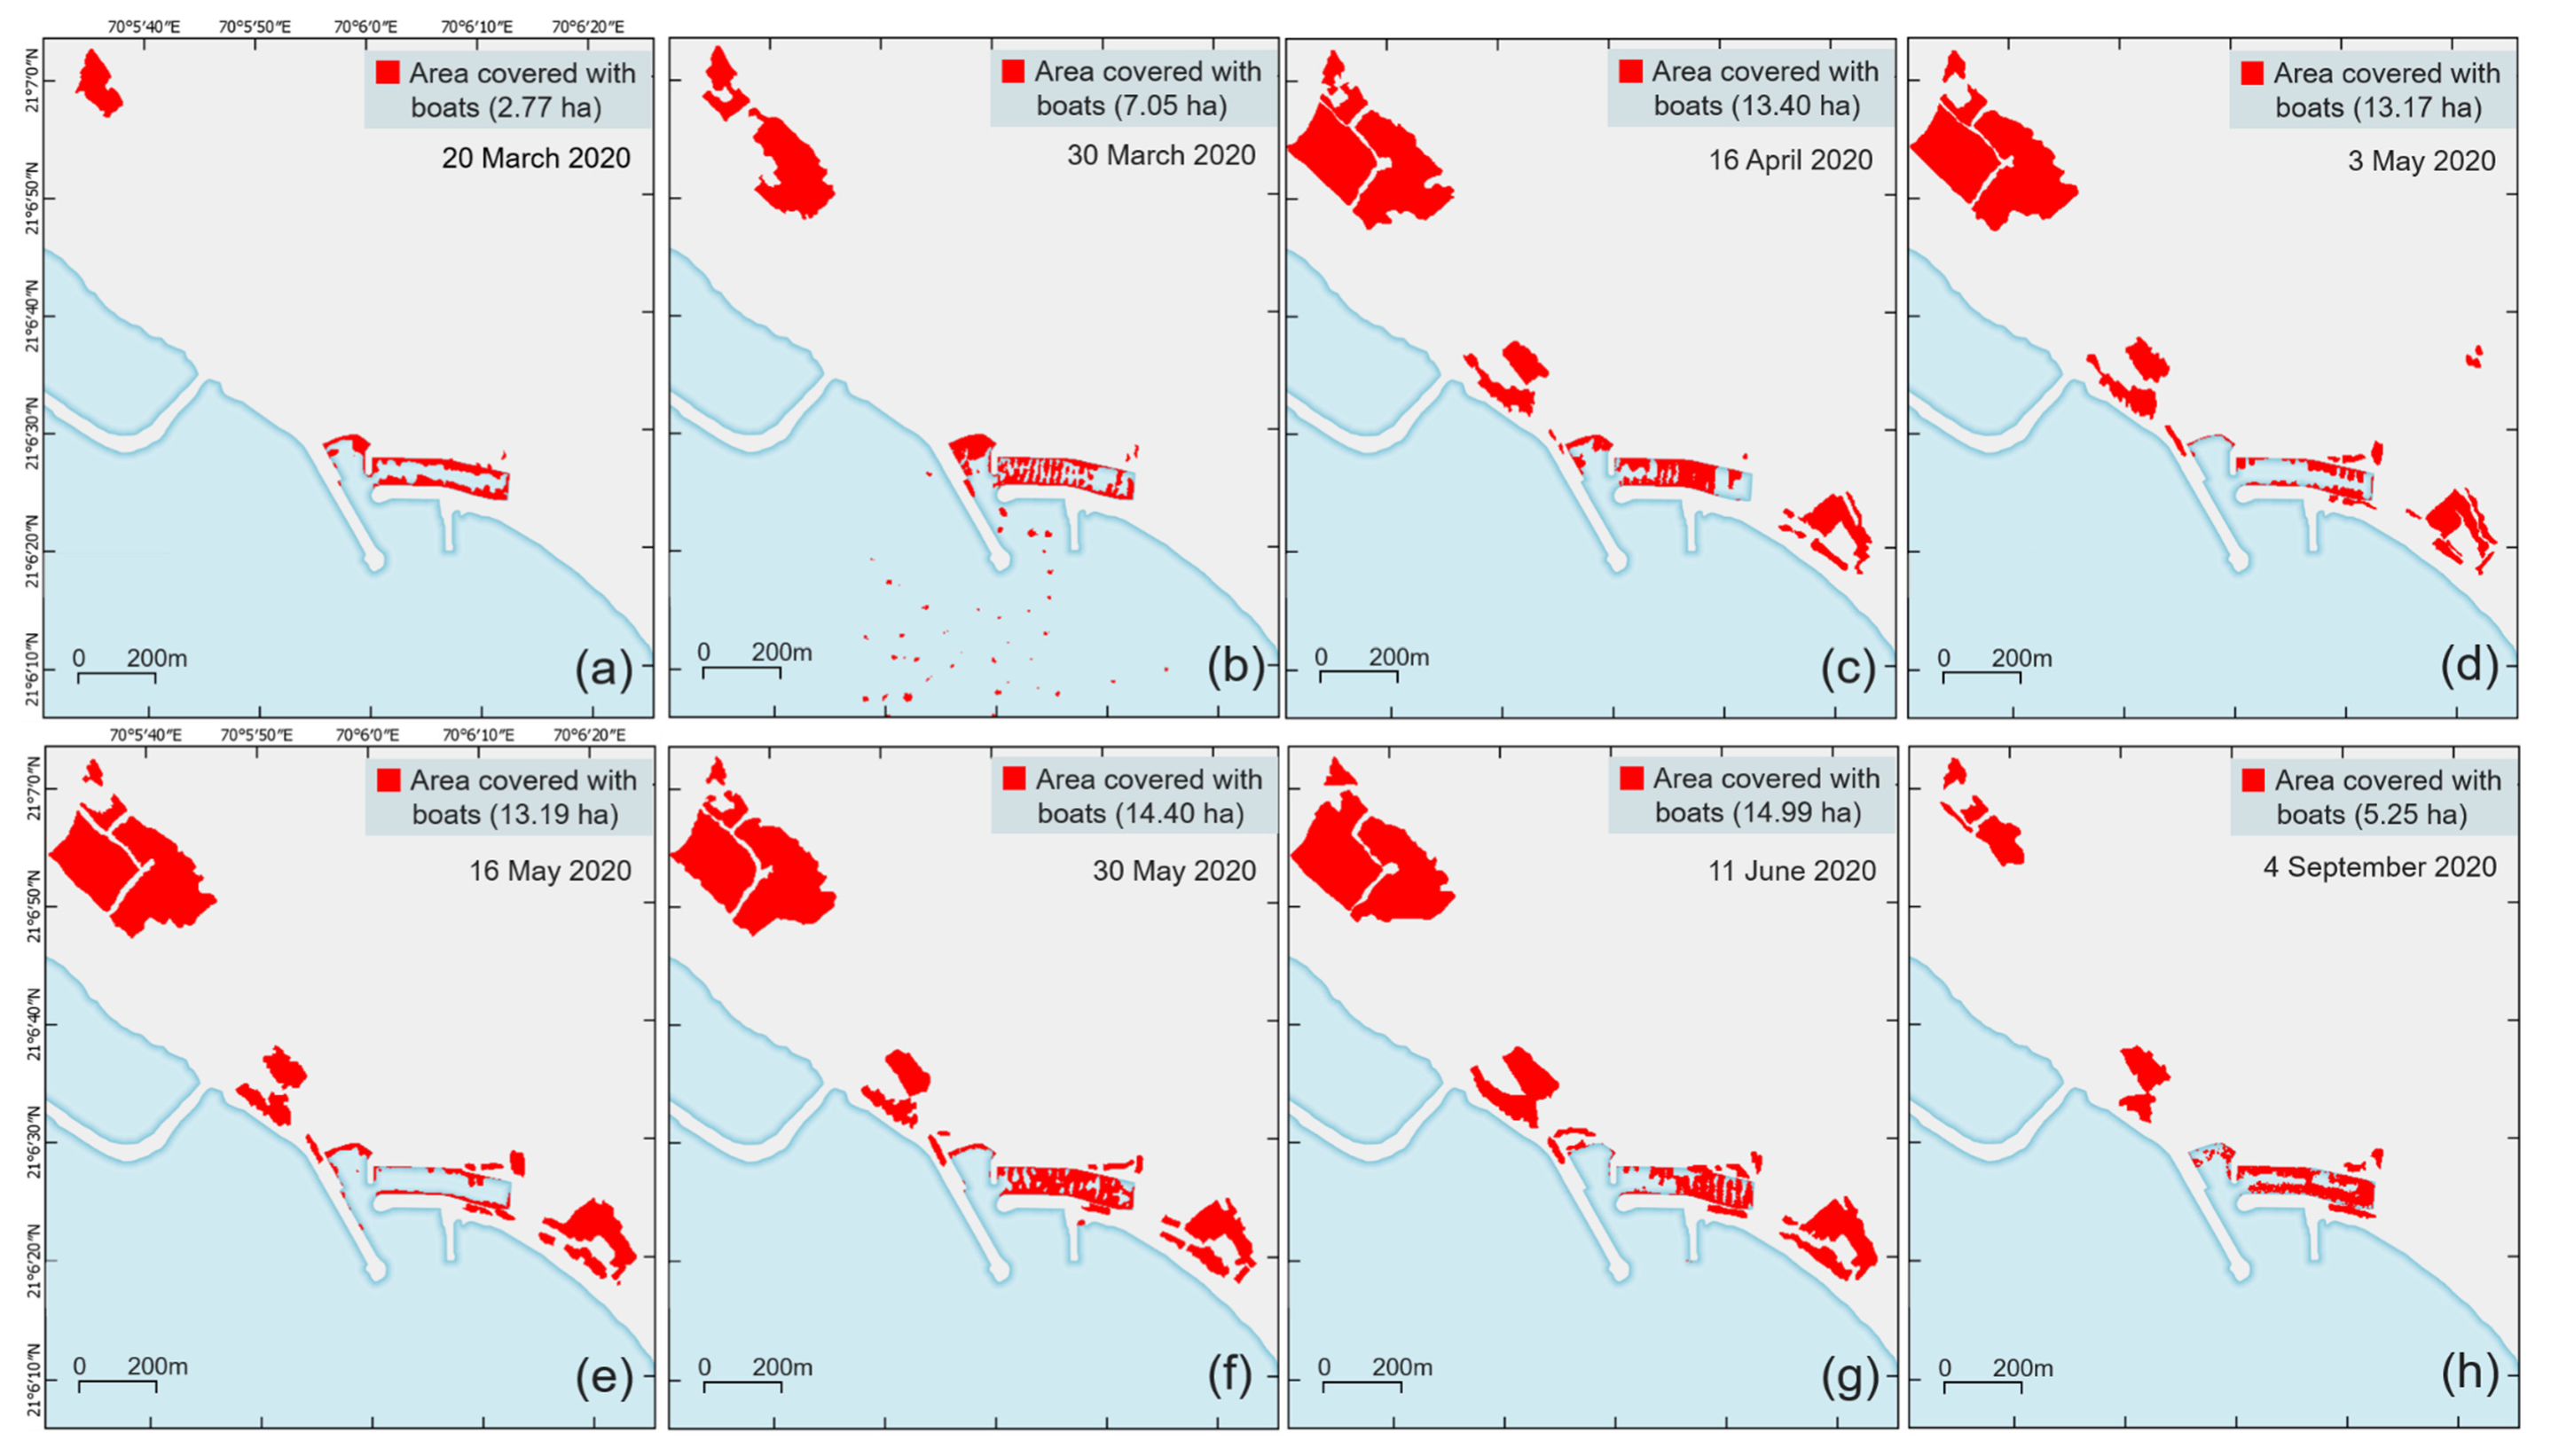
3. Results
4. Discussion
5. Conclusions
Author Contributions
Funding
Data Availability Statement
Acknowledgments
Conflicts of Interest
Appendix A

| Particulars | Mangrol | Veraval | Vanakbara | |||
|---|---|---|---|---|---|---|
| 2018–2019 | 2019–2020 | 2018–2019 | 2019–2020 | 2018–2019 | 2019–2020 | |
| Annual Fish and Prawns Catch (Metric Tonnes) | 40.45 | 41.31 | 234.15 | 238.64 | 41.57 | 42.01 |
| Number of Fisheries Workers | 11,300 | 11,600 | 22,570 | 25,650 | 8570 | 8855 |
| Number of Technical and Processing Workers | 2000 | 2100 | 14,700 | 16,100 | 4566 | 4794 |
| MFV Boats (Trawlers/Gillnetter) | 1459 | 1497 | 3059 | 3097 | 1260 | 1275 |
| FRP Boats (IBM/OBM) | 725 | 775 | 875 | 908 | 145 | 153 |


References
- Gopinath, G. The Great Lockdown: Worst Economic Downturn Since the Great Depression. Available online: https://blogs.imf.org/2020/04/14/the-great-lockdown-worst-economic-downturn-since-the-great-depression/ (accessed on 31 May 2020).
- Yunus, A.P.; Masago, Y.; Hijioka, Y. COVID-19 and Surface Water Quality: Improved Lake Water Quality during the Lockdown. Sci. Total Environ. 2020, 731, 139012. [Google Scholar] [CrossRef]
- Avtar, R.; Kumar, P.; Supe, H.; Jie, D.; Sahu, N.; Mishra, B.; Yunus, A. Did the COVID-19 Lockdown-Induced Hydrological Residence Time Intensify the Primary Productivity in Lakes? Observational Results Based on Satellite Remote Sensing. Water 2020, 12, 2573. [Google Scholar] [CrossRef]
- Tripathi, A. Covid-19 Effect on Micro, Small and Medium Enterprises (MSMEs). Available online: https://timesofindia.indiatimes.com/blogs/agyeya/covid-19-affect-on-micro-small-and-medium-enterprises-msmes/ (accessed on 31 May 2020).
- The Hindu. Moody’s Revises India’s 2020 GDP Contraction Estimate to 8.9% from 9.6%. Available online: https://www.thehindu.com/business/Economy/moodys-revises-indias-2020-gdp-forecast-to-89-from-96/article33082321.ece# (accessed on 1 December 2020).
- Sharma, Y.S. 27 Million Youth in Age Group of 20–30 Years Lost Jobs in April: CMIE. Available online: https://economictimes.indiatimes.com/news/economy/indicators/unemployment-rate-dips-to-23-97-data-from-cmie-shows/articleshow/75689370.cms?from=mdr (accessed on 31 May 2020).
- Desai, P.N. Coastal Marine Environment of Gujarat. In Proceedings of the Science, Technology, Coastal Zone Management and Policy; Allied Publishers: Mangalore, Karnataka, India, November 2000; pp. 115–123. [Google Scholar]
- Desai, P.N. India’s S&T Cooperation with the Developing Countries. World J. Sci. Technol. Sustain. Dev. 2012, 9, 28–37. [Google Scholar] [CrossRef]
- Desai, P.N. India’s STI Policy towards COVID-19. Transdisciplinary Research Cluster on Sustainability Studies (TRCSS), Working Paper 9; Jawaharlal Nehru University (JNU): New Delhi, India, 2020. [Google Scholar]
- The Economist. Scientific Research on the Coronavirus is Being Released in a Torrent. Available online: https://www.economist.com/science-and-technology/2020/05/07/scientific-research-on-the-coronavirus-is-being-released-in-a-torrent (accessed on 31 May 2020).
- UNCTAD. UNCTAD-World Oceans Day 2020 Report. In Proceedings of the The Blue Economy and COVID-19 Pandemic: New Challenges, Recovery Measures and Resilience, 4 June 2020; UNCTAD: Geneva, Switzerland, 2020. [Google Scholar]
- CBD. The “Blue Economy” Is Critical to Food Security and the Fight Against Poverty. Available online: https://www.cbd.int/article/waterforbiodiversity-2 (accessed on 11 May 2020).
- Fisheries Statistics Division. Handbook on Fisheries Statistics of India 2018; Department of Fisheries, Ministry of Fisheries, Animal Husbandry & Dairying, Government of India: New Delhi, India, 2019; p. 190.
- MoF. Union Budget of India; Ministry of Finance (MoF), Government of India: New Delhi, India, 2019.
- The World Bank. The Blue Economy. Available online: https://www.worldbank.org/en/news/infographic/2017/06/06/blue-economy (accessed on 20 May 2020).
- Sathiadhas, R.; Biradar, R.S. Fisheries in the Development of Indian Economy. In Proceedings of the National Conference on Fisheries Economics, Extension and Management, Mumbai, India, 5–6 January 2000; Central Marine Fisheries Research Institute (CMFRI): Mumbai, India, 2000; pp. 1–20. [Google Scholar]
- Mathew SJ, P.T. Marine Fisheries and the Traditional Fisher folk. In Between the Sea and the Sky: Lived Religion on the Seashore; Fortress Press: Minneapolis, MN, USA, 2020; p. 157. ISBN 978-1-5064-5200-5. [Google Scholar]
- Patil, N.R.; Peter, T. National Fishworkers Forum’s (NFF) Communication with Minister of State for the Ministry of Fisheries, Animal Husbandry & Dairying, Government of India. Available online: https://nffindia.org/wp/category/pressstatement/ (accessed on 30 May 2020).
- Ujjania, N.C.; Patel, A.N. Socio-Economic Status of Fishermen Community of Danti Village InValsad District (Gujarat) India. Emerg. Trends Dev. Res. 2011, 18, 25–30. [Google Scholar]
- Ghoshal, S. Fisheries Sector Expected to Touch Rs 1.5 lakh Crore by 2020: Assocham. Available online: https://economictimes.indiatimes.com/news/economy/agriculture/fisheries-sector-expected-to-touch-rs-1-5-lakh-crore-by-2020-assocham/articleshow/58804708.cms?from=mdr (accessed on 20 May 2020).
- Dey, M.M.; Rab, M.A.; Paraguas, F.J.; Piumsombun, S.; Bhatta, R.; Alam, M.F.; Ahmed, M. Fish Consumption and Food Security: A Disaggregated Analysis by Types of Fish and Classes of Consumers in Selected Asian Countries. Aquac. Econ. Manag. 2005, 9, 89–111. [Google Scholar] [CrossRef]
- Johnson, D. Wealth and Waste: Contrasting Legacies of Fisheries Development in Gujarat since 1950s. Econ. Political Wkly. 2001, 1095–1102. [Google Scholar]
- Commissioner of Fisheries. Fisheries at Glance. Available online: https://cof.gujarat.gov.in/Images/commissioneroffisheries/pdf/Fisheries-at-Glance-Jan-2011-12-08-2011.pdf (accessed on 30 May 2020).
- Sherasiya, U.; India’s National Fish Workers Forum (NFF), Kerala, India. Personal communication, 2020.
- Masani, A.K.H. Catch Composition and Economic Analysis of Trawlers Operating from Veraval Fishing Harbour. Master’s Thesis, Junagadh Agricultural University, Veraval, Gujarat, India, 2012. [Google Scholar]
- Jamwal, N. Lockdown Enforced When They Were at Sea—So More Than a Lakh of Fishers Now Wait in Deep Waters. Available online: https://en.gaonconnection.com/lockdown-enforced-when-they-were-at-sea-so-lakhs-of-fishers-now-wait-in-deep-waters/ (accessed on 19 May 2020).
- Vohra, S. India’s Lockdown Has Put 16 Million Fisherfolk Out of Business. Here’s How They’re Coping. Available online: https://scroll.in/article/959062/indias-lockdown-has-put-16-million-fisherfolk-out-of-business-heres-how-theyre-coping (accessed on 19 May 2020).
- Vohra, S. India’s Fishers Have Been Crushed by COVID-19. Available online: https://www.hakaimagazine.com/news/indias-fishers-have-been-crushed-by-covid-19/ (accessed on 11 May 2020).
- Roshan, M. A Study of Migrant Fishers from Andhra Pradesh in the Gujarat Marine Fishing Industry; International Collective in Support of Fishworkers: Chennai, India, 2017; p. 50. [Google Scholar]
- Khakhariya, N. 25K Fishermen Stranded in Boats in Gujarat Coasts. Available online: https://timesofindia.indiatimes.com/city/rajkot/25k-fishermen-stranded-in-boats-in-gujarat-coasts/articleshow/74938000.cms (accessed on 19 May 2020).
- Satheesh, S. Indian Fishermen Stranded at Ports Amid Coronavirus Lockdown. Available online: https://www.aljazeera.com/news/2020/04/indian-fishermen-stranded-ports-coronavirus-lockdown-200426050800842.html (accessed on 11 May 2020).
- MHA. Third Addendum to the Consolidated Guidelines by Ministry of Home Affairs (MHA); Government of India: New Delhi, India. Available online: https://www.mha.gov.in/sites/default/files/3rd%20Addendum%20dated%202.4.2020%20to%20Lockdown%20measures_0.pdf (accessed on 15 August 2020).
- Santos, A.M.P. Fisheries Oceanography Using Satellite and Airborne Remote Sensing Methods: A Review. Fish. Res. 2000, 49, 1–20. [Google Scholar] [CrossRef]
- Chassot, E.; Bonhommeau, S.; Reygondeau, G.; Nieto, K.; Polovina, J.J.; Huret, M.; Dulvy, N.K.; Demarcq, H. Satellite Remote Sensing for an Ecosystem Approach to Fisheries Management. ICES J. Mar. Sci. 2011, 68, 651–666. [Google Scholar] [CrossRef] [Green Version]
- Polovina, J.J.; Howell, E.A. Ecosystem Indicators Derived from Satellite Remotely Sensed Oceanographic Data for the North Pacific. ICES J. Mar. Sci. 2005, 62, 319–327. [Google Scholar] [CrossRef]
- Yen, K.-W.; Lu, H.-J.; Chang, Y.; Lee, M.-A. Using Remote-Sensing Data to Detect Habitat Suitability for Yellowfin Tuna in the Western and Central Pacific Ocean. Int. J. Remote Sens. 2012, 33, 7507–7522. [Google Scholar] [CrossRef]
- Dulvy, N.; Chassot, E.; Heymans, J.; Hyde, K.; Pauly, D.; Platt, T.; Sherman, K. Climate Change, Ecosystem Variability and Fisheries Productivity; The International Ocean-Colour Coordinating Group (IOCCG): Dartmouth, Canada, 2009; pp. 11–28. [Google Scholar]
- Zainuddin, M.; Kiyofuji, H.; Saitoh, K.; Saitoh, S.-I. Using Multi-Sensor Satellite Remote Sensing and Catch Data to Detect Ocean Hot Spots for Albacore (Thunnus Alalunga) in the Northwestern North Pacific. Deep Sea Res. Part II Top. Stud. Oceanogr. 2006, 53, 419–431. [Google Scholar] [CrossRef]
- He, H.; Lin, Y.; Chen, F.; Tai, H.-M.; Yin, Z. Inshore Ship Detection in Remote Sensing Images via Weighted Pose Voting. IEEE Trans. Geosci. Remote Sens. 2017, 55, 3091–3107. [Google Scholar] [CrossRef]
- Klemas, V. Fisheries Applications of Remote Sensing: An Overview. Fish. Res. 2013, 148, 124–136. [Google Scholar] [CrossRef]
- Snapir, B.; Waine, T.; Biermann, L. Maritime Vessel Classification to Monitor Fisheries with SAR: Demonstration in the North Sea. Remote Sens. 2019, 11, 353. [Google Scholar] [CrossRef] [Green Version]
- Avtar, R.; Aggarwal, R.; Kharrazi, A.; Kumar, P.; Kurniawan, T.A. Utilizing Geospatial Information to Implement SDGs and Monitor Their Progress. Environ. Monit. Assess. 2020, 192, 35. [Google Scholar] [CrossRef]
- Ultra-Tech. Environment Impact Assessment for Proposed Veraval Fishery Harbour—Phase II; Ultra-Tech, Environmental Consultancy and Laboratory, Thane, Maharashtra. Prepared for the Fisheries Department Govt. of Gujarat NABET/EIA/1417/RA010. September 2017. Available online: http://environmentclearance.nic.in/writereaddata/FormB/EC/EIA_EMP/20092017S7YNM2DTVeravalEIAReportwithpagenumber.pdf (accessed on 15 August 2020).
- Marta, S. Planet Imagery Product Specifications. Available online: https://assets.planet.com/docs/Combined-Imagery-Product-Spec-Dec-2018.pdf (accessed on 15 August 2020).
- Supe, H.; Avtar, R.; Singh, D.; Gupta, A.; Yunus, A.P.; Dou, J.; Ravankar, A.A.; Mohan, G.; Chapagain, S.K.; Sharma, V.; et al. Google Earth Engine for the Detection of Soiling on Photovoltaic Solar Panels in Arid Environments. Remote Sens. 2020, 12, 1466. [Google Scholar] [CrossRef]
- Kanjir, U.; Greidanus, H.; Oštir, K. Vessel Detection and Classification from Spaceborne Optical Images: A Literature Survey. Remote Sens. Environ. 2018, 207, 1–26. [Google Scholar] [CrossRef]
- Beşbinar, B.; Alatan, A.A. Inshore Ship Detection in High-Resolution Satellite Images: Approximation of Harbors Using Sea-Land Segmentation. In Proceedings of the SPIE 9643, Image and Signal Processing for Remote Sensing XXI, 96432D; International Society for Optics and Photonics: Toulouse, France, 2015. [Google Scholar]
- Xu, J.; Sun, X.; Zhang, D.; Fu, K. Automatic Detection of Inshore Ships in High-Resolution Remote Sensing Images Using Robust Invariant Generalized Hough Transform. IEEE Geosci. Remote Sens. Lett. 2014, 11, 2070–2074. [Google Scholar] [CrossRef]
- Li, N.; Zhang, Q.; Zhao, H.; Dong, C.; Meng, L. Ship Detection in High Spatial Resolution Remote Sensing Image Based on Improved Sea-Land Segmentation. In Hyperspectral Remote Sensing Applications and Environmental Monitoring and Safety Testing Technology; International Society for Optics and Photonics (SPIE): Beijing, China, 2016; Volume 101560T-1, pp. 1–9. [Google Scholar]
- Zhang, R.; Yao, J.; Zhang, K.; Feng, C.; Zhang, J. S-CNN-Based Ship Detection from High-Resolution Remote Sensing Images. Int. Arch. Photogramm. Remote Sens. Spatial Inf. Sci. 2016, XLI-B7, 423–430. [Google Scholar] [CrossRef]
- Janyala, S. Coronavirus Lockdown: Gujarat Govt Hires Cargo Ships to Send Andhra Fishermen Home. Available online: https://indianexpress.com/article/india/coronavirus-india-lockdown-gujarat-govt-hires-cargo-ships-to-send-andhra-fishermen-home-6376558/ (accessed on 15 May 2020).
- Liu, B.; Li, Y.; Zhang, Q.; Han, L. The Application of GF-1 Imagery to Detect Ships on the Yangtze River. J. Indian Soc. Remote Sens. 2017, 45, 179–183. [Google Scholar] [CrossRef]
- Gao, B.-C. NDWI—A Normalized Difference Water Index for Remote Sensing of Vegetation Liquid Water from Space. Remote Sens. Environ. 1996, 58, 257–266. [Google Scholar] [CrossRef]
- Congalton, R.G.; Green, K. Assessing the Accuracy of Remotely Sensed Data: Principles and Practices, 3rd ed.; CRC Press: Boca Raton, FL, USA, 2019; ISBN 978-0-429-05272-9. [Google Scholar]
- Maxar Technologies. Imagery Basemaps. Available online: https://www.maxar.com/products/imagery-basemaps (accessed on 14 November 2020).
- Zhan, Q.; Molenaar, M.; Tempfli, K.; Shi, W. Quality Assessment for Geo-spatial Objects Derived from Remotely Sensed Data. Int. J. Remote Sens. 2005, 26, 2953–2974. [Google Scholar] [CrossRef]
- Whiteside, T.; Boggs, G.; Maier, S. Area-Based Validity Assessment of Single-and Multi-Class Object-Based Image Analysis. In Proceedings of the 15th Australasian Remote Sensing and Photogrammetry Conference; ARSPC: Alice Springs, Australia, 2010. [Google Scholar]
- Kamal, M.; Phinn, S.; Johansen, K. Object-Based Approach for Multi-Scale Mangrove Composition Mapping Using Multi-Resolution Image Datasets. Remote Sens. 2015, 7, 4753–4783. [Google Scholar] [CrossRef] [Green Version]
- Niroumand-Jadidi, M.; Bovolo, F.; Bruzzone, L.; Gege, P. Physics-Based Bathymetry and Water Quality Retrieval Using PlanetScope Imagery: Impacts of 2020 COVID-19 Lockdown and 2019 Extreme Flood in the Venice Lagoon. Remote Sens. 2020, 12, 2381. [Google Scholar] [CrossRef]
- Khan, S. Gujarat HC Moved Over Boat Parking Issue on Seashore. Available online: https://timesofindia.indiatimes.com/city/ahmedabad/Gujarat-HC-moved-over-boat-parking-issue-on-seashore/articleshow/14271068.cms (accessed on 16 November 2020).
- Gunakar, S.; Jadhav, A.; Bhatta, R. Protections for small-scale fisheries in india: A study of india’s monsoon fishing ban. In The Small-Scale Fisheries Guidelines: Global Implementation; Jentoft, S., Chuenpagdee, R., Barragán-Paladines, M.J., Franz, N., Eds.; Springer International Publishing: Cham, Switzerland, 2017; pp. 291–311. ISBN 978-3-319-55074-9. [Google Scholar]
- Mondal, M. On the Road: Tracing the Current Patterns of Fishworkers’ Migration in India. Available online: https://thebastion.co.in/covid-19/on-the-road-tracing-the-current-patterns-of-fishworkers-migration-in-india/ (accessed on 10 October 2020).
- MSSRF. COVID-19 Impact on Livelihoods of Marine Fishing Communities. Available online: https://www.mssrf.org/content/covid19-impact-livelihoods-marine-fishing-communities-0 (accessed on 28 November 2020).
- Sathianandan, T.V. Marine Fish Production in India—Present Status. In Proceedings of the Course Manual ICAR funded Summer School on Advanced Methods for Fish Stock Assessment and Fisheries Management; Fishery Resources Assessment Division-ICAR, Central Marine Fisheries Research Institute: Kochi, Kerala, 2017; pp. 23–27. Available online: http://eprints.cmfri.org.in/12164/1/2-Marine%20fish%20production%20in%20India.pdf (accessed on 15 August 2020).
- Lan, J.; Wan, L. Automatic Ship Target Classification Based on Aerial Images. In Proceedings of the SPIE 7156, 2008 International Conference on Optical Instruments and Technology; Optical Systems and Optoelectronic Instruments: Beijing, China, 2008. [Google Scholar]
- Xu, C.; Zhang, D.; Zhang, Z.; Feng, Z. BgCut: Automatic Ship Detection from UAV Images. Sci. World J. 2014, 2014, 1–11. [Google Scholar] [CrossRef]


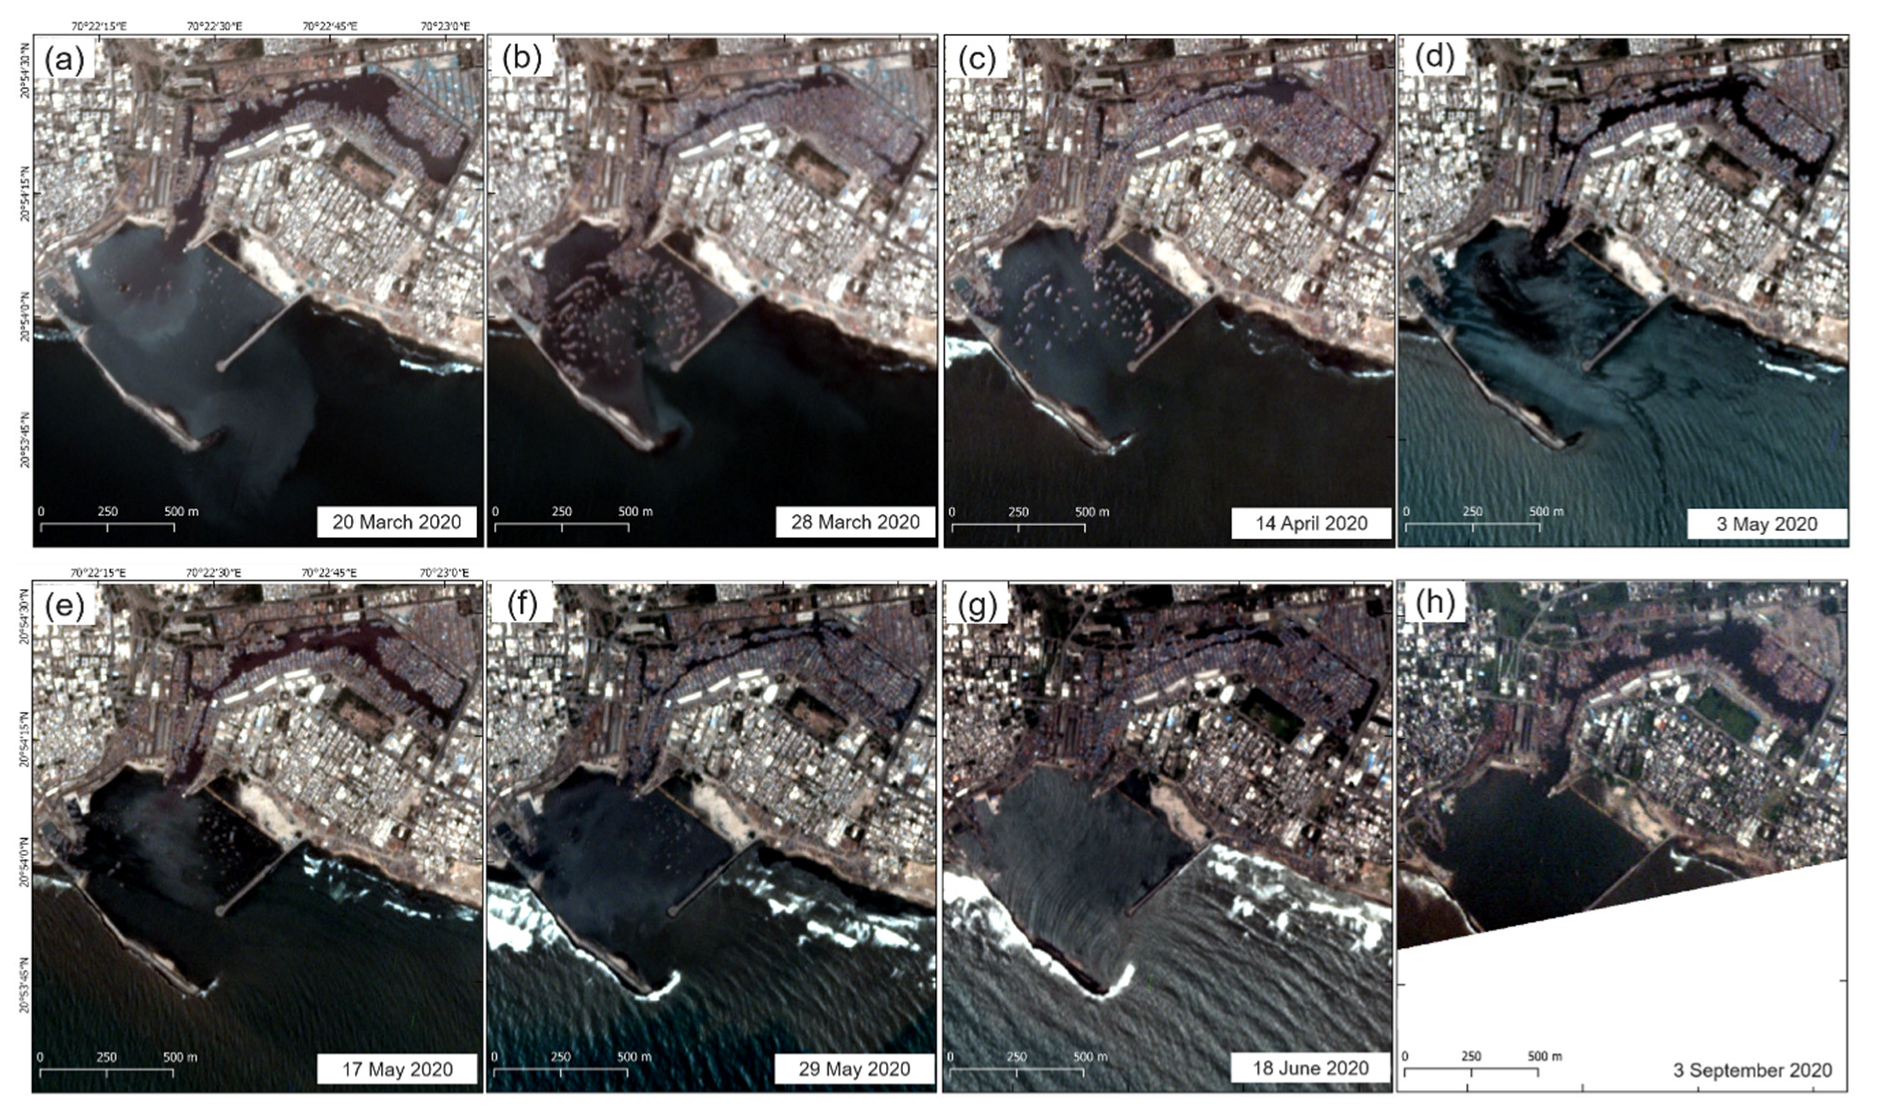
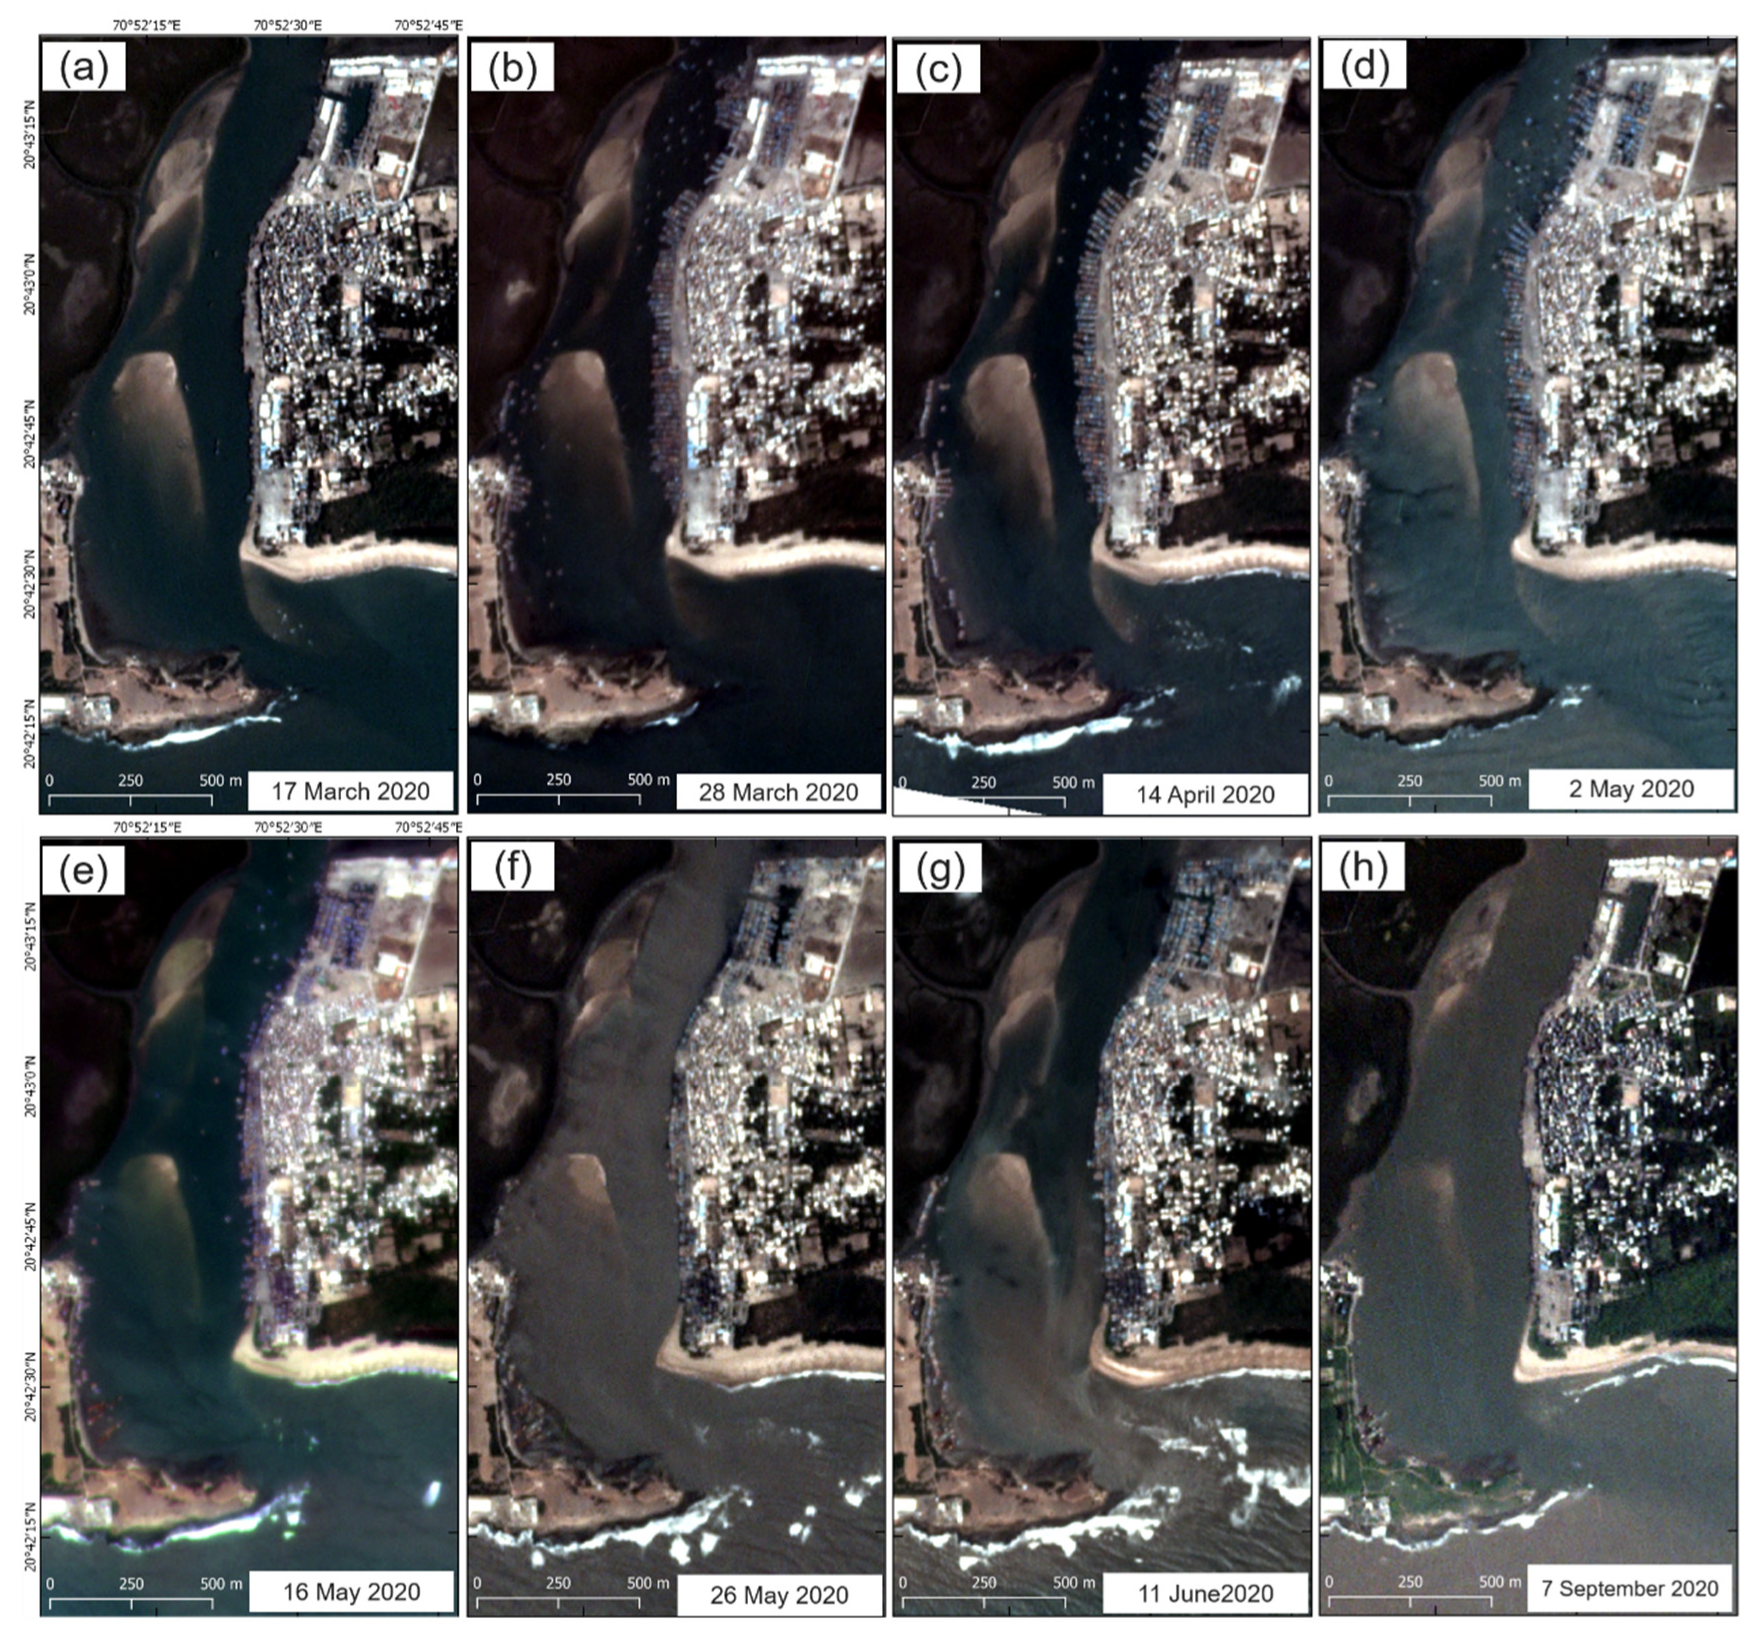
| Lockdown Stage | Acquisition date | ||
|---|---|---|---|
| Mangrol | Veraval | Vanakbara | |
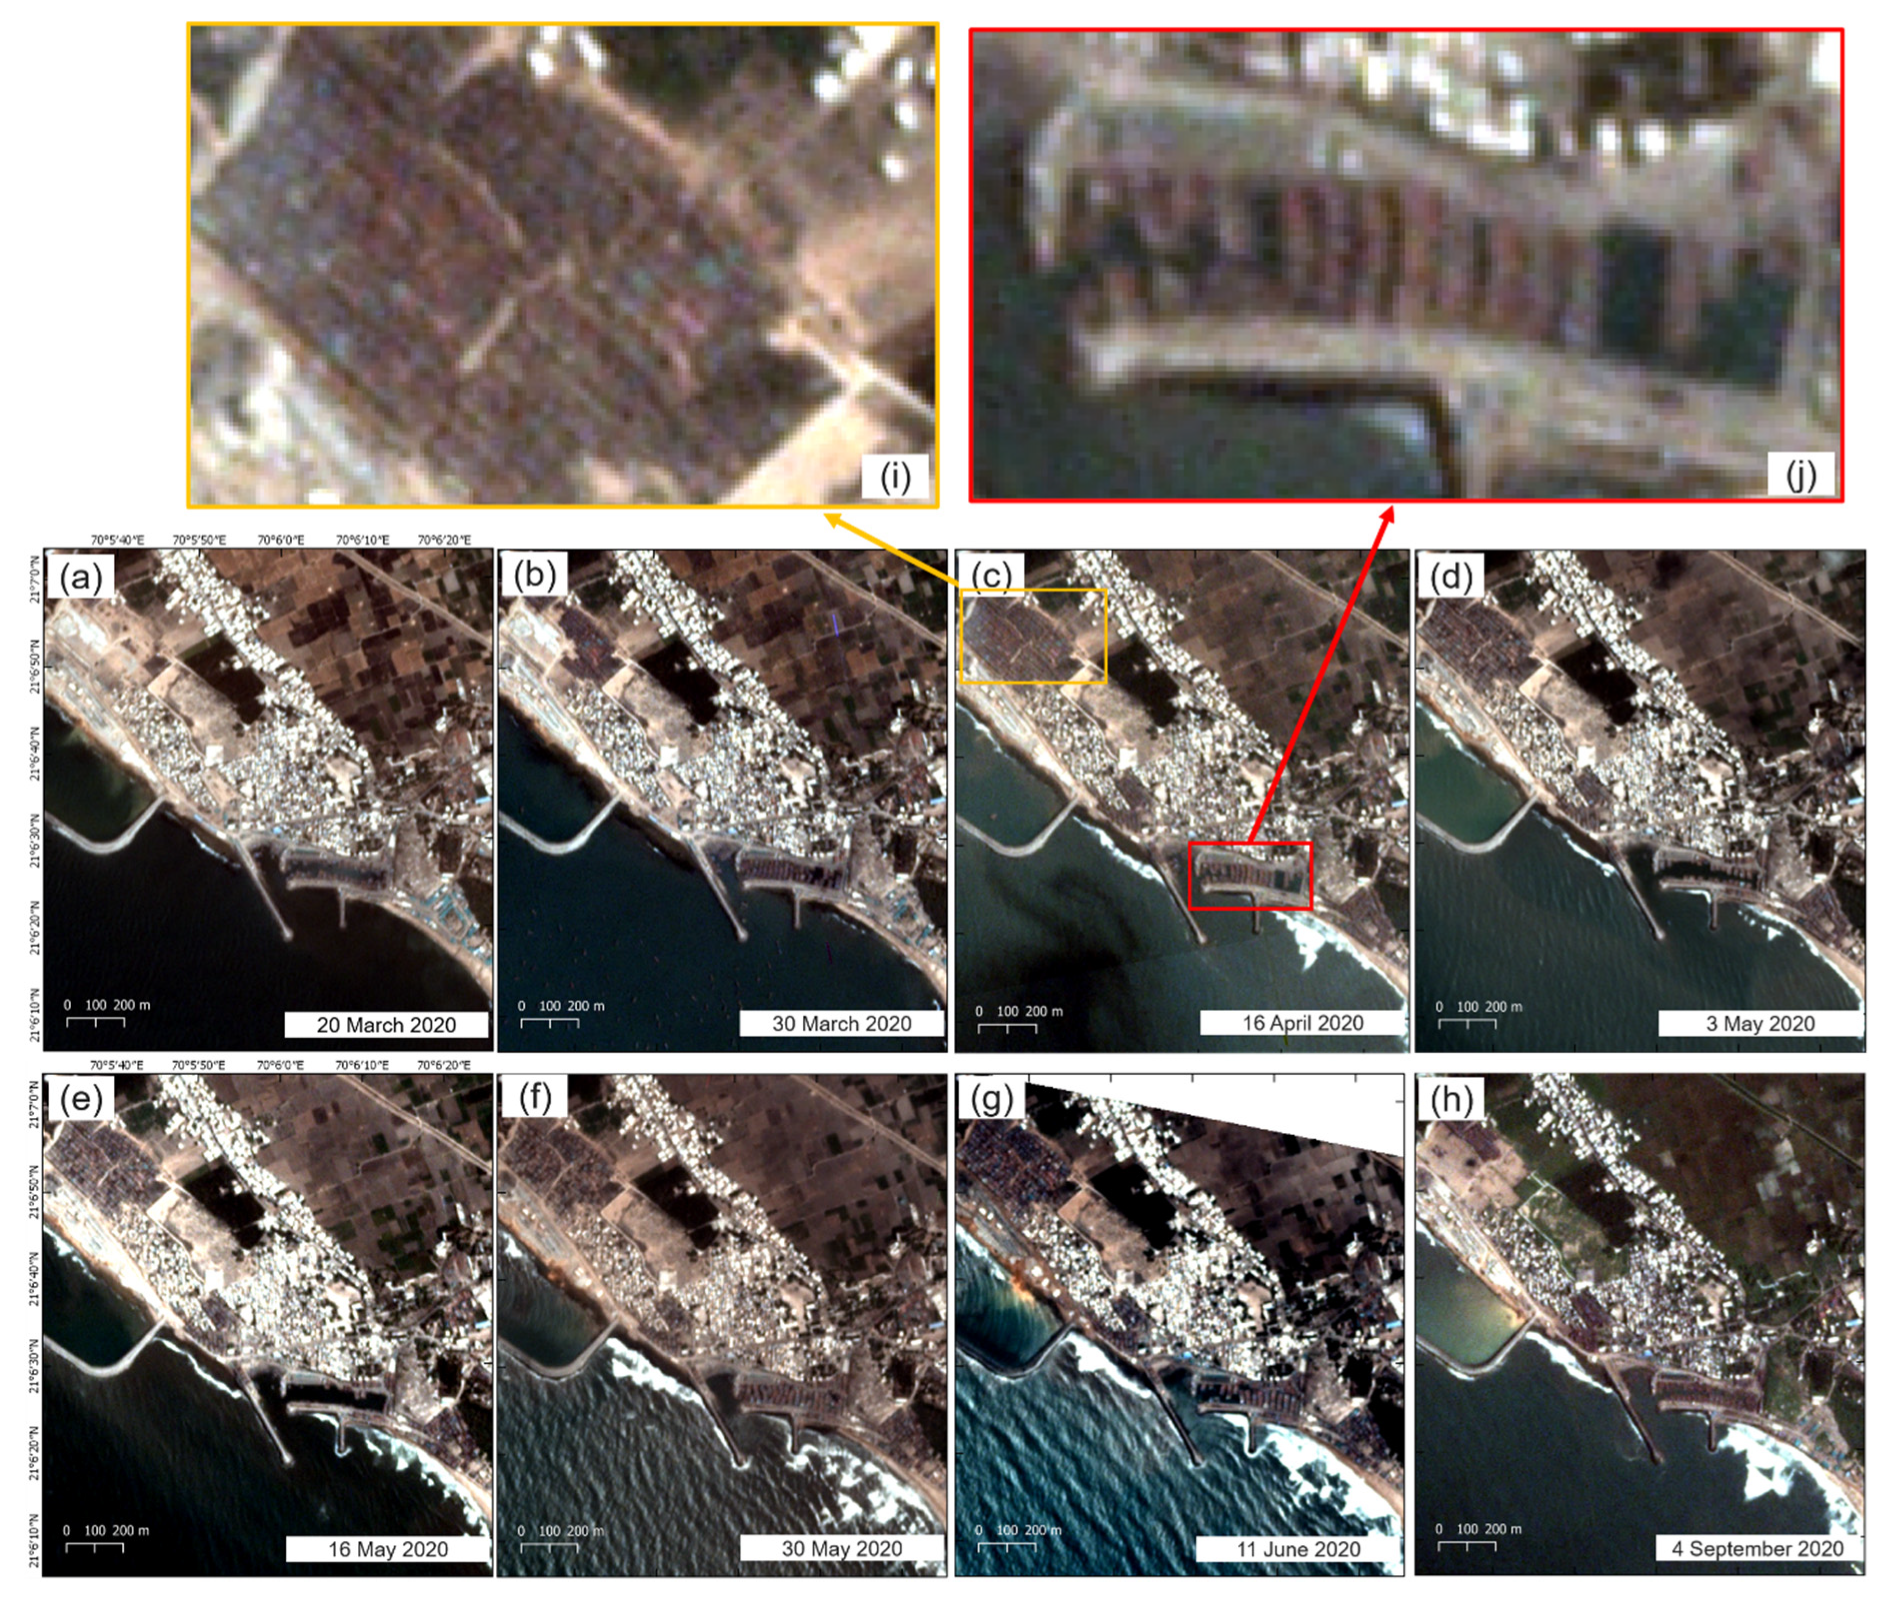
| Pre-lockdown | 20 March 2020 | 20 March 2020 | 17 March 2020 |
| Phase I | 30 March 2020 | 28 March 2020 | 28 March 2020 |
| Phase I | 16 April 2020 | 14 April 2020 | 14 April 2020 |
| Phase II | 3 May 2020 | 3 May 2020 | 2 May 2020 |
| Phase III | 16 May 2020 | 17 May 2020 | 16 May 2020 |
| Phase IV | 30 May 2020 | 29 May 2020 | 26 May 2020 |
| Unlock 1.0 | 11 June 2020 | 18 June 2020 | 11 June 2020 |
| Unlock 4.0 | 4 September 2020 | 3 September 2020 | 7 September 2020 |
Publisher’s Note: MDPI stays neutral with regard to jurisdictional claims in published maps and institutional affiliations. |
© 2021 by the authors. Licensee MDPI, Basel, Switzerland. This article is an open access article distributed under the terms and conditions of the Creative Commons Attribution (CC BY) license (http://creativecommons.org/licenses/by/4.0/).
Share and Cite
Avtar, R.; Singh, D.; Umarhadi, D.A.; Yunus, A.P.; Misra, P.; Desai, P.N.; Kouser, A.; Kurniawan, T.A.; Phanindra, K. Impact of COVID-19 Lockdown on the Fisheries Sector: A Case Study from Three Harbors in Western India. Remote Sens. 2021, 13, 183. https://doi.org/10.3390/rs13020183
Avtar R, Singh D, Umarhadi DA, Yunus AP, Misra P, Desai PN, Kouser A, Kurniawan TA, Phanindra K. Impact of COVID-19 Lockdown on the Fisheries Sector: A Case Study from Three Harbors in Western India. Remote Sensing. 2021; 13(2):183. https://doi.org/10.3390/rs13020183
Chicago/Turabian StyleAvtar, Ram, Deepak Singh, Deha Agus Umarhadi, Ali P. Yunus, Prakhar Misra, Pranav N. Desai, Asma Kouser, Tonni Agustiono Kurniawan, and KBVN Phanindra. 2021. "Impact of COVID-19 Lockdown on the Fisheries Sector: A Case Study from Three Harbors in Western India" Remote Sensing 13, no. 2: 183. https://doi.org/10.3390/rs13020183