Forecasting the Spread of COVID-19 in Kuwait Using Compartmental and Logistic Regression Models


1
Department of Electronics Engineering Technology, College of Technological Studies, Public Authority for Applied Education and Training, P.O. Box 42325, Shuwaikh 70654, Kuwait
2
Department of Manufacturing Engineering Technology, College of Technological Studies, Public Authority for Applied Education and Training, P.O. Box 42325, Shuwaikh 70654, Kuwait
*
Author to whom correspondence should be addressed.
Appl. Sci. 2020, 10(10), 3402; https://doi.org/10.3390/app10103402
Submission received: 22 April 2020
/
Revised: 10 May 2020
/
Accepted: 12 May 2020
/
Published: 14 May 2020
(This article belongs to the Special Issue COVID-19: Impact on Human Health and Behavior)
Abstract
:The state of Kuwait is facing a substantial challenge in responding to the spread of the novel coronavirus 2019 (COVID-19). The government’s decision to repatriate stranded citizens back to Kuwait from various COVID-19 epicenters has generated a great concern. It has heightened the need for prediction models to estimate the epidemic size. Mathematical modeling plays a pivotal role in predicting the spread of infectious diseases to enable policymakers to implement various health and safety measures to contain the spread. This research presents a forecast of the COVID-19 epidemic size in Kuwait based on the confirmed data. Deterministic and stochastic modeling approaches were used to estimate the size of COVID-19 spread in Kuwait and determine its ending phase. In addition, various simulation scenarios were conducted to demonstrate the effectiveness of nonpharmaceutical intervention measures, particularly with time-varying infection rates and individual contact numbers. Results indicate that, with data until 19 April 2020 and before the repatriation plan, the estimated reproduction number in Kuwait is 2.2. It also confirms the efficiency of the containment measures of the state of Kuwait to control the spread even after the repatriation plan. The results show that a high contact rate among the population implies that the epidemic peak value is yet to be reached and that more strict intervention measures must be incorporated
1. Introduction
Since the detection of the first case of the novel coronavirus 2019 (COVID-19) in December 2019 in Wuhan City, Hubei Province, China, the number of identified cases has been increasing rapidly. Significant spread prevention measures were implemented by the Chinese government such as locking down the city of Wuhan and closing routes to all cities in Hubei Province in late January 2020. Despite these measures, the COVID-19 disease spread globally and was declared as an epidemic by the World Health Organization (WHO) [1]. The drastic increase in the number of cases for COVID-19 became an emergency and a profound health issue worldwide. Today, the spread of COVID-19 is a growing public health concern worldwide, which imposes a significant challenge politically, economically and socially. Efforts are being exerted globally to limit and slow down the spread of the virus. The COVID-19 characteristics of strong infectivity, long incubation period, difficulties of detection, and uncertainty in ways of transmission increase the vagueness and the complications of controlling the outbreak. Therefore, solidarity in the fight against COVID-19 is recognized and considered an imperative necessity during this time.
Studies on modeling and forecasting of the epidemic were carried out by various researchers [2] to tackle this spread and provide analytical predictions on the size and end phase of the spread. Kuniya [3] applied the Susceptible–Exposed–Infected–Recovered (SEIR) compartmental model for the prediction of the epidemic peak in order to provide an insight of the feasibility of conducting the Summer Olympics of 2020 in Japan. Al-qaness et al. [4] forecast the number of confirmed cases of COVID-19 for ten days in China using a modified version for the flower pollination algorithm (FPA) coupled with the salp swarm algorithm (SSA). Koczkodaj et al. [5] forecast the increase of COVID-19 cases outside of China by a specific date to reach 1 million cases based on heuristic and WHO situation reports. Wu, J. T., et al, [6] estimated the size of the epidemic in Wuhan and forecast the extent of domestic and global public health risks of the epidemic taking into account the social and nonpharmaceutical spread interventions. To date, researchers from science, engineering and social sciences disciplines are contributing rapidly with studies that provide governments and health institutions with analyses that are helpful in decision making and predicting the unforeseen challenges on local and global scales.
Various prevention measures were implemented by various countries as a reaction to the different patterns of the outbreak. Reporting these measures and their impact on the spread should be carried out to the benefit of implementing an appropriate containment plan. Globally, the outbreak nature of the COVID-19 disease is negatively impacting the economy, education, industry, trade supply chains and social aspects of life.
The state of Kuwait, with a total population of 4.270 million [7], was faced by the new epidemic of COVID-19 and reported the first five cases on 24 February 2020. The cases were imported from travelers and were not caused by local transmission. Table 1 shows the number of newly reported COVID-19 cases in Kuwait from 24 February until 19 April 2020. As a result, Kuwait undertook rigorous containment and quarantine efforts to reduce the results of the outbreak, to keep the health system efficient and robust and to slow down the time to reach the peak of the epidemic. The containment measures, presented in Table 2, were extracted from the official releases of the government of Kuwait [8]. The intervention measures aim to reduce the contact rate between individuals and hence reducing the rate of the outbreak. These measures include slowing the epidemic spread rate among elderly persons and people with chronic disease; mitigating the transmission rate among the clinical and nursing staff; reducing the overall death rate, and protecting the overall health system.
The different actions taken by the Kuwait Government are considered as nonpharmaceutical intervention measures that are expected to reduce the spread of COVID-19 cases [9]. In addition, the ministry of health carried out Polymerase Chain Reaction (PCR) tests to diagnose all the travelers to contain the spread. The number of detected infected cases of COVID-19 has been increasing gradually with controlled increments as a result of the containment measures. Most of the confirmed cases were imported cases of citizens coming back to Kuwait. However, some of the recently reported cases are identified as locally transmitted. This has resulted in a significant increase in the number of cases compared to the early days.
Recently, Kuwait government announced that it will embark a repatriation plan of approximately 40,000 citizens who are located in various countries back to Kuwait, starting from 19 April 2020 until 5 May 2020. The repatriation plan adds another dimension of uncertainty for the prediction of the spread in the upcoming period. It is of utmost importance to investigate the various spread scenarios and their impact on the current infection spread and growth rate in Kuwait. In this study, predictions of the epidemic COVID-19 spread in Kuwait is presented using two mathematical prediction approaches of susceptible–infected–recovered (SIR) and logistics regression modeling. Additionally, an investigation of the possible impact of the repatriation plan on the spread of COVID-19 in Kuwait is reported, taking into account the current prevention measures.
The original contributions of this study can be listed as:
- To present the first mathematical model to predict the spread of COVID-19 in Kuwait to estimate the epidemic size, the reproduction number and an estimate for ending phase of the epidemic
- To provide an assessment of the current government interventions measures and their effectiveness in containing the spread of COVID-19 in Kuwait with various simulation scenarios
- To provide a forecast of the spread of COVID-19 after the repatriating plan of Kuwaiti citizens for policymakers to plan intervention measures
2. Methods
Previous studies have established the effectiveness of mathematical modeling in predicting the spread of various diseases such as Ebola and Human Immunodeficiency Virus (HIV) as well as the novel coronavirus COVID-19 [10,11]. Numerous epidemiological modeling approaches have been discussed in literature including the logistic growth model, deterministic compartmental models (DCM) and agent-based models (ABM). Deterministic compartmental models (DCM) are nonlinear models of differential equations that provide analytical epidemic predictions based on the input parameters. The classical DCM, such as susceptible–infected–recovered (SIR) model, assumes a homogenous and well-mixed population. On the other hand, agent-based modeling (ABM) is an approach to simulate the interactions between individual agents and a group of agents. Therefore, ABM simulations include heterogeneous attributes among individual agents. ABM allows for defining complex networks of interactions for a more realistic representation of epidemic situations. However, one major drawback of ABM is that it requires more detailed information of the dataset and would significantly increase computational complexity. In addition, the interpretation of ABM behavior to its structure tends to be more challenging with sophisticated details and networks [12]. Thus, ABM predictions are useful when detailed data is available and is stable over the required forecast timeframe. In early-stage epidemic modeling, where data is limited, the importance of choosing a modeling approach depends on the purpose. Unlike ABM, the SIR modeling approach requires less data with reduced computational requirements which makes it particularly more useful for an early-stage epidemic estimation. A recent study reported that the SIR model provides sufficient and reliable predictions in estimating the early-stage epidemic [13]. In addition, the authors further indicated that complex modeling approaches might not be as reliable as simpler models when data is limited.
SIR model consists of divided compartments of susceptible–infected–recovered to forecast the disease spread based on the actual infected cases per day. Hence, the logistic growth regression model is used for fitting the actual infected cases and the growth of the infection per day.
In this section, the SIR and the logistic growth models are utilized to estimate the epidemic size of the infected population from the period of 24 February 2020 until 19 April 2020. Furthermore, stochastic simulations were carried out to address the simultaneous changes of the susceptible and infected number of individuals at a given time. The results were analyzed to provide insightful predictions of current situation and examine the effectiveness of the ongoing intervention measures. Consequently, allowing policymakers to intervene with the needed health and safety measures to contain the spread of the disease.
2.1. Logistics Growth Model
The logistic growth model is a regression model that is widely used in epidemiology mathematical models to estimate the growth and decline rate of pathogens [14]. The model assumes an exponential growth at the beginning of the epidemic, followed by steady increase and finally ending with a declining growth rate. The logistic model is presented by Batista in [15] in Equation (1) as:
where C is the number of infected cases, r defined as the rate of infection and K is the final epidemic size. Given that the initial condition of C(0) = Co, the number of infected cases is define as:
And the maximum growth rate peaks at the time:
With the peak number of cases defined as:
And a growth rate at the maximum peak as:
To fit the actual confirmed cases of the infected population, the regression model is written in the form:
where with i = (1, 2,3 …n) are estimated parameters from the actual data of the epidemic.
2.2. Susceptible–Infected–Recovered (SIR) Model
The SIR model has been extensively utilized in literature and by policymakers to predict the spread of many diseases. The basic SIR model divides the population (N) into three compartments as:
- S: Susceptible healthy population that is at risk of getting infected.
- I: Infected population who have symptoms whether mild or severe
- R: Recovered population who has recovered from the disease and has gained immunity
Thus, the total population can be written as:
N = S + I + R
In the basic SIR model, the population is assumed to be constant; no births during the prediction of the epidemic stages and people are equal in terms of recovery and infection rates. There exist numerous variations of the SIR model that include many other parameters to model the spread such as the death rate, birth rates, departure rates and vital dynamics [10,16]. The model estimates the rate of change of the susceptible, infected and recovered population by differential equations respectively as:
With the parameters defined as:
- : The infection rate and defined as the proportion of the infected population per day.
- : The recovery rate and defined as the proportion of the recovered population per day.
Also, the reproduction number of the disease is an important indicator of the severity of the spread and is defined as the total number of days that an infected person can spread the disease to others. Using the infection and recovery rate parameters, the SIR model estimates the reproduction number of the disease as the ratio:
WHO estimates the reproduction number of the COVID-19 to be within the range of 2−2.5 [17,18]. The reproduction number is an estimated number that depends on infection and recovery rates of each region and used as an indicator of the severity of the disease spread. To fit the model to the actual data values, a stochastic SIR-individual contact model (SIR-ICM) is utilized with multiple iterations to minimize the fitting deviations. In addition, the stochastic SIR-ICM is used to simulate the time-varying number of infected and susceptible individuals. The Residual Sum of Squares (RSS) approach is utilized to find optimal parameters of the infection and recovery rates as:
The models were simulated using Matlab (MathWorks, Natick, MA, USA) and RStudio (RStudio PBC, Boston, MA) environments using combined hardcoded parts as well as open-source packages of SIR and logistic models found in [15,19,20]. In the following section, the results are presented to illustrate the current situation in Kuwait and the forecast of the upcoming repatriation phase with intervention scenarios in the discussion.
3. Results
3.1. Forecast of COVID-19 Spread in Kuwait from 24 February 2020 to 19 April 2020
The logistic regression approach was utilized to fit the confirmed cumulative cases in Kuwait from the start of the outbreak in 24 February 2020 until 19 April 2020 and to predict the short term forecast with the current prevention measures in Kuwait. Simulations were carried out and the estimated parameters are presented in Table 3.
It can be noted that the logistic regression model resulted in fitting the actual data with a root mean square error (RMSE) of 48 and R2 of 0.992 as reported in Table 3. The results of the regression of the confirmed cumulative cases are illustrated in Figure 1. The prediction curve highlights an increasing trend in the cumulative cases in the upcoming days in Kuwait and predicts an epidemic size of 4,223. Furthermore, the simulation estimates the epidemic ending phase to start from 15 June 2020. A closer look at Figure 2 along with the parameters of Table 3, shows that the infection rate reaches the peak value on 22 April 2020 with estimated daily cases of 120. In addition, SIR model simulations were used to estimate the reproduction rate of Kuwait and was found to be Ro = 2.2 which falls within the estimated range reported by WHO [17].
Short term forecasting of the cumulative cases in Kuwait is presented in Table 4. The confirmed cumulative cases with the predicted cumulative cases between 14 April 2020 until 25 April 2020 were compared and the model error percentage was found to vary between 0.42% and 3.13%.
3.2. Prediction of the Spread of COVID-19 in Kuwait with Higher Reproduction Rate of Ro = 2.5
To estimate the impact of the current spread prevention measures applied by the government of Kuwait, such as the partial curfew, quarantine measures and social distancing, the SIR model was utilized. The simulations were carried out with a higher reproduction number of Ro = 2.5. A significant increase in the estimated epidemic size can be noted with 17,684 cumulative infections as presented in Figure 3 and Table 5. Compared with the current estimated reproduction number, it is apparent that the current prevention measures have resulted in a reduction of 76.12% of the estimated epidemic size. Figure 4 illustrates the impact of a high reproduction number on the peak value and ending phase of the epidemic. The ending phase is estimated to occur on 20 August 2020 and thus would result in a delay of approximately 11 weeks.
3.3. Prediction of the Spread of COVID-19 in Kuwait after the Repatriation of Citizens back to Kuwait
Kuwait will implement a repatriation plan for bringing back 40,000 citizens who are located in various countries starting from 19 April 2020 until 7 May 2020. Because some of these citizens are located within epicenters of coronavirus, the government of Kuwait is planning to conduct strict measures for preventing the spread from infected travelers. Nevertheless, it will be a challenging phase due to the asymptomatic nature of COVID-19. The government of Kuwait, therefore, has arranged quarantine centers for these citizens at various locations to guarantee the containment of the spread. Each person will be provided with a smart wristband and a smart mobile application that was developed by the ministry of health for tracking patients and monitoring the social distancing measures [21]. The smart application serves as a hotline for offering consultation with the medical staff in the case of visible symptoms among them.
In this section, the SIR model is utilized to predict the spread of COVID-19 infections in Kuwait after the start repatriation period as a measure to estimate the epidemic size and end phase. The purpose of these simulation scenarios is to predict the epidemic peak associated with the repatriating plan of Kuwait to assess the risk and act appropriately with required prevention and containment measures. The conducted simulation scenarios were based on varying the reproduction rate between 2.2 to 2.3 as follows:
- To reflect the current situation with the partial curfew and social distancing measures.
- To reflect the arrival of citizens from COVID-19 epicenters, higher probability of infected persons, with the partial curfew and social distancing measures.
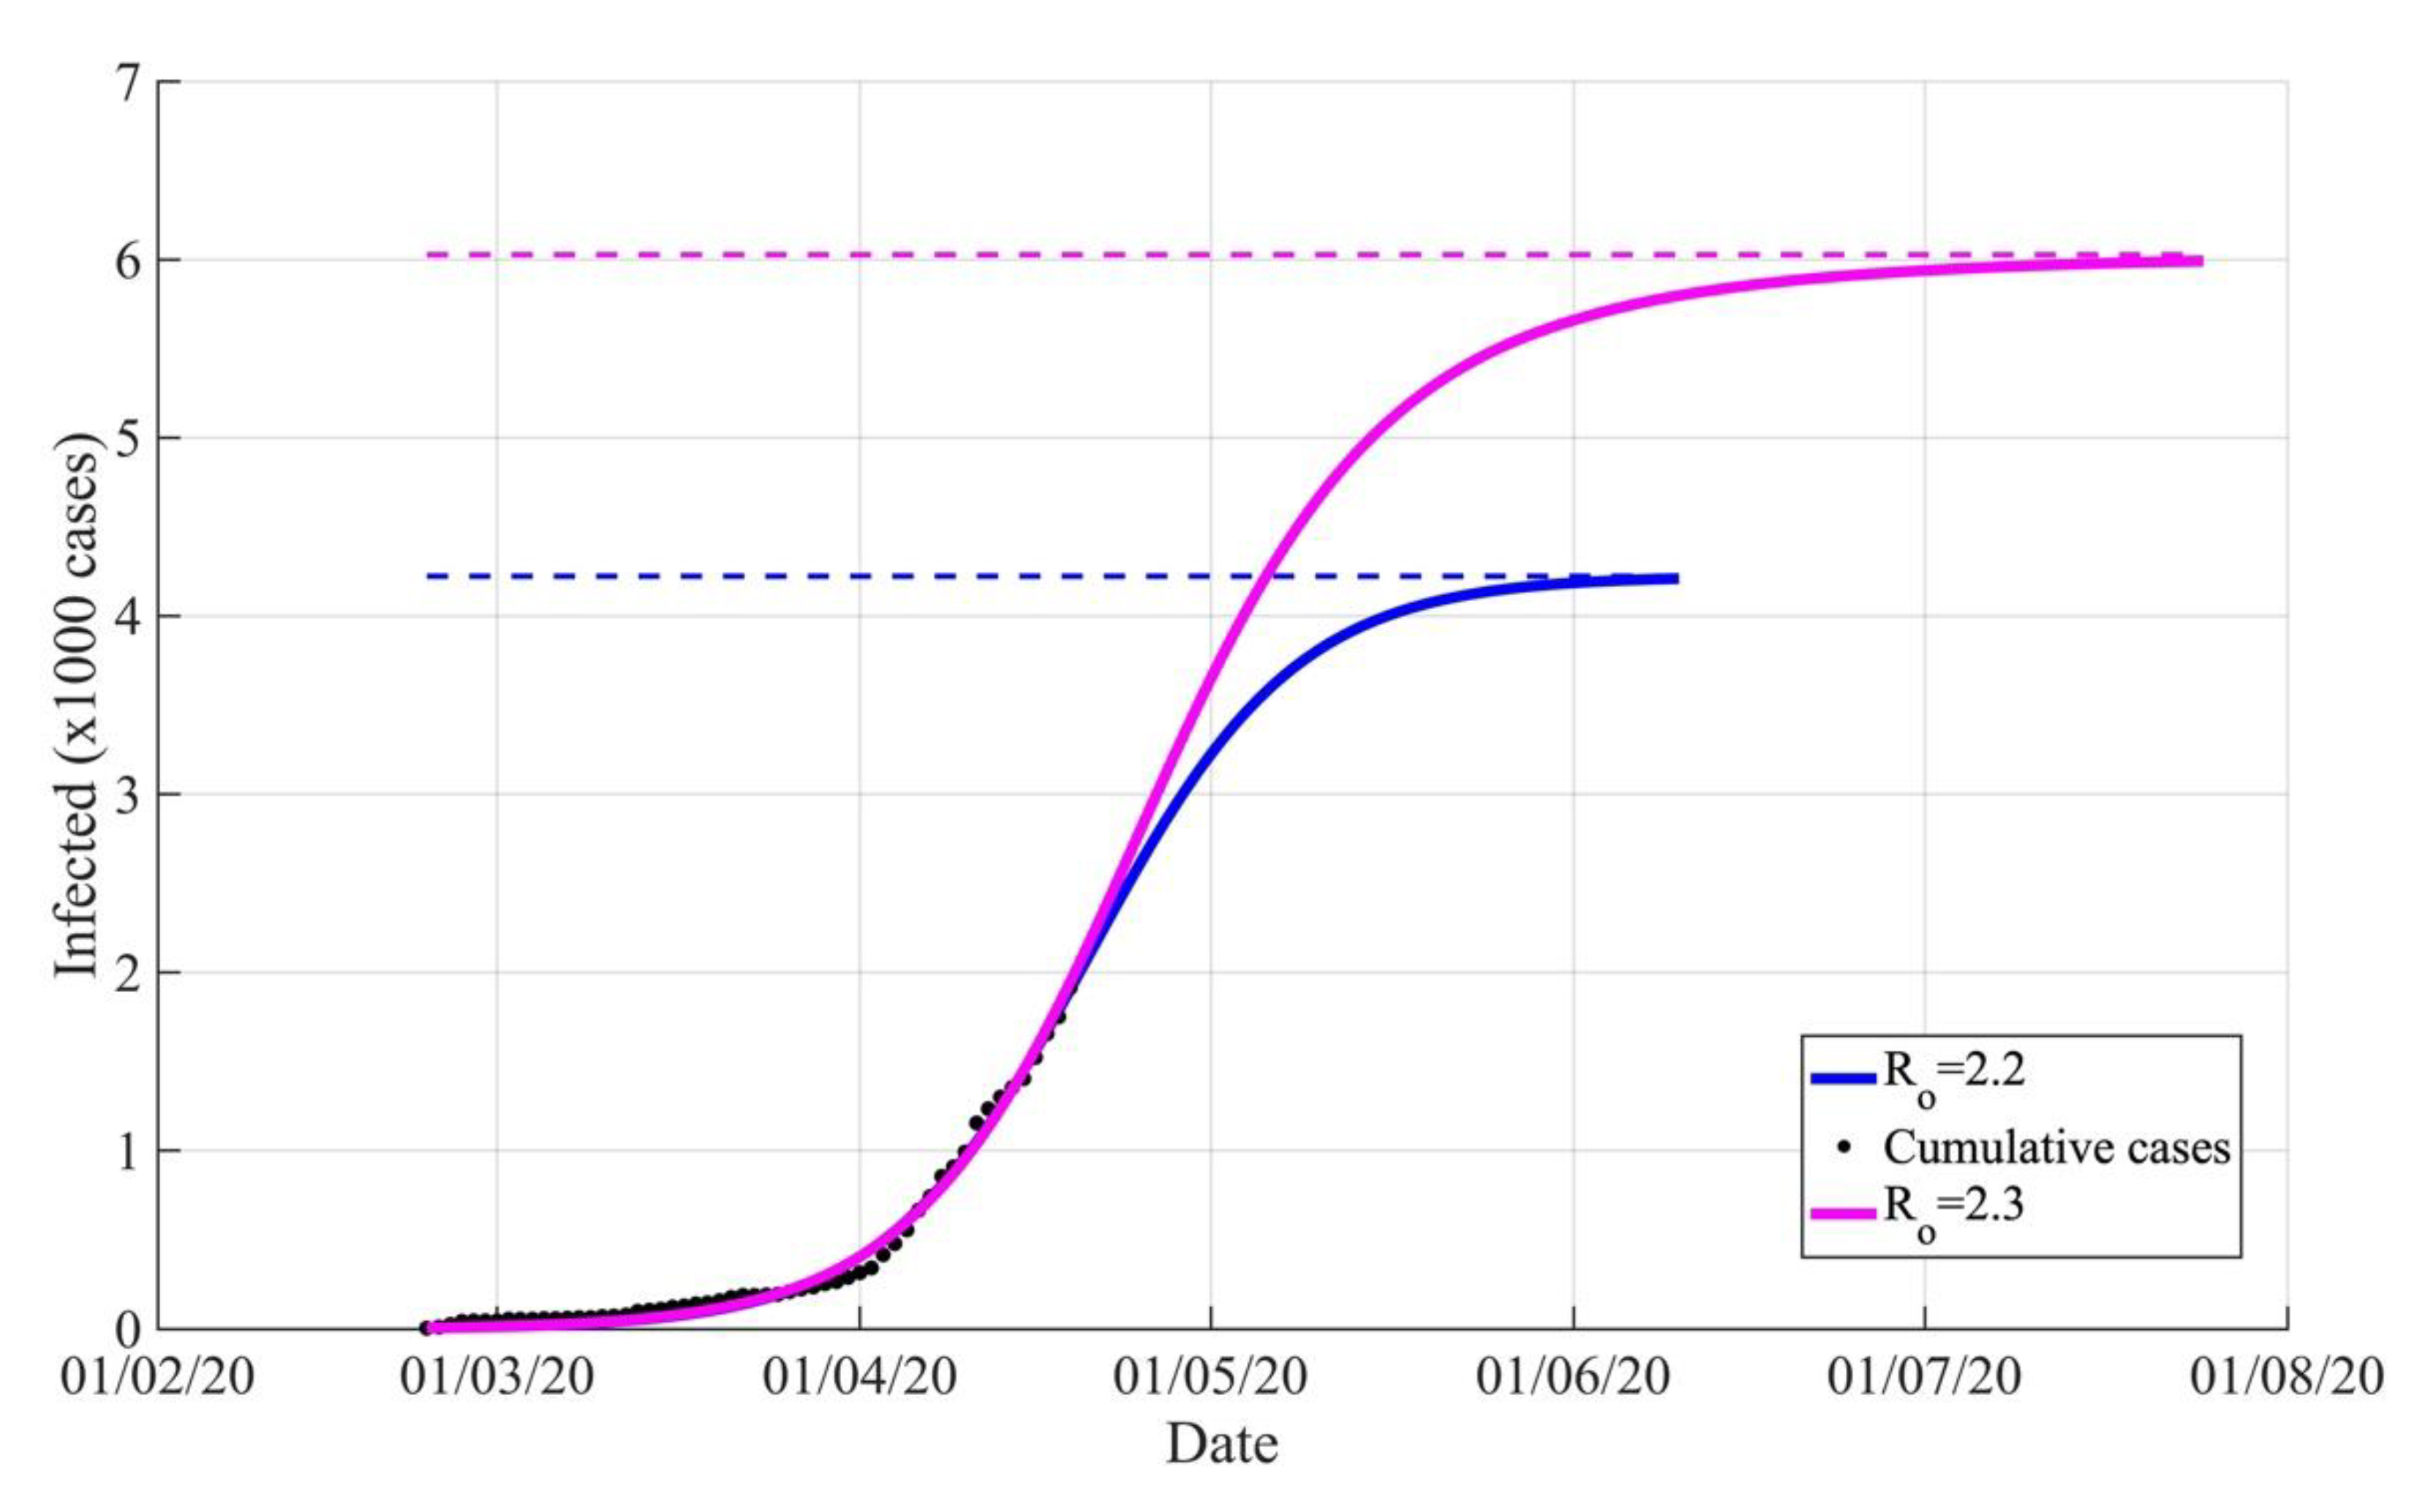
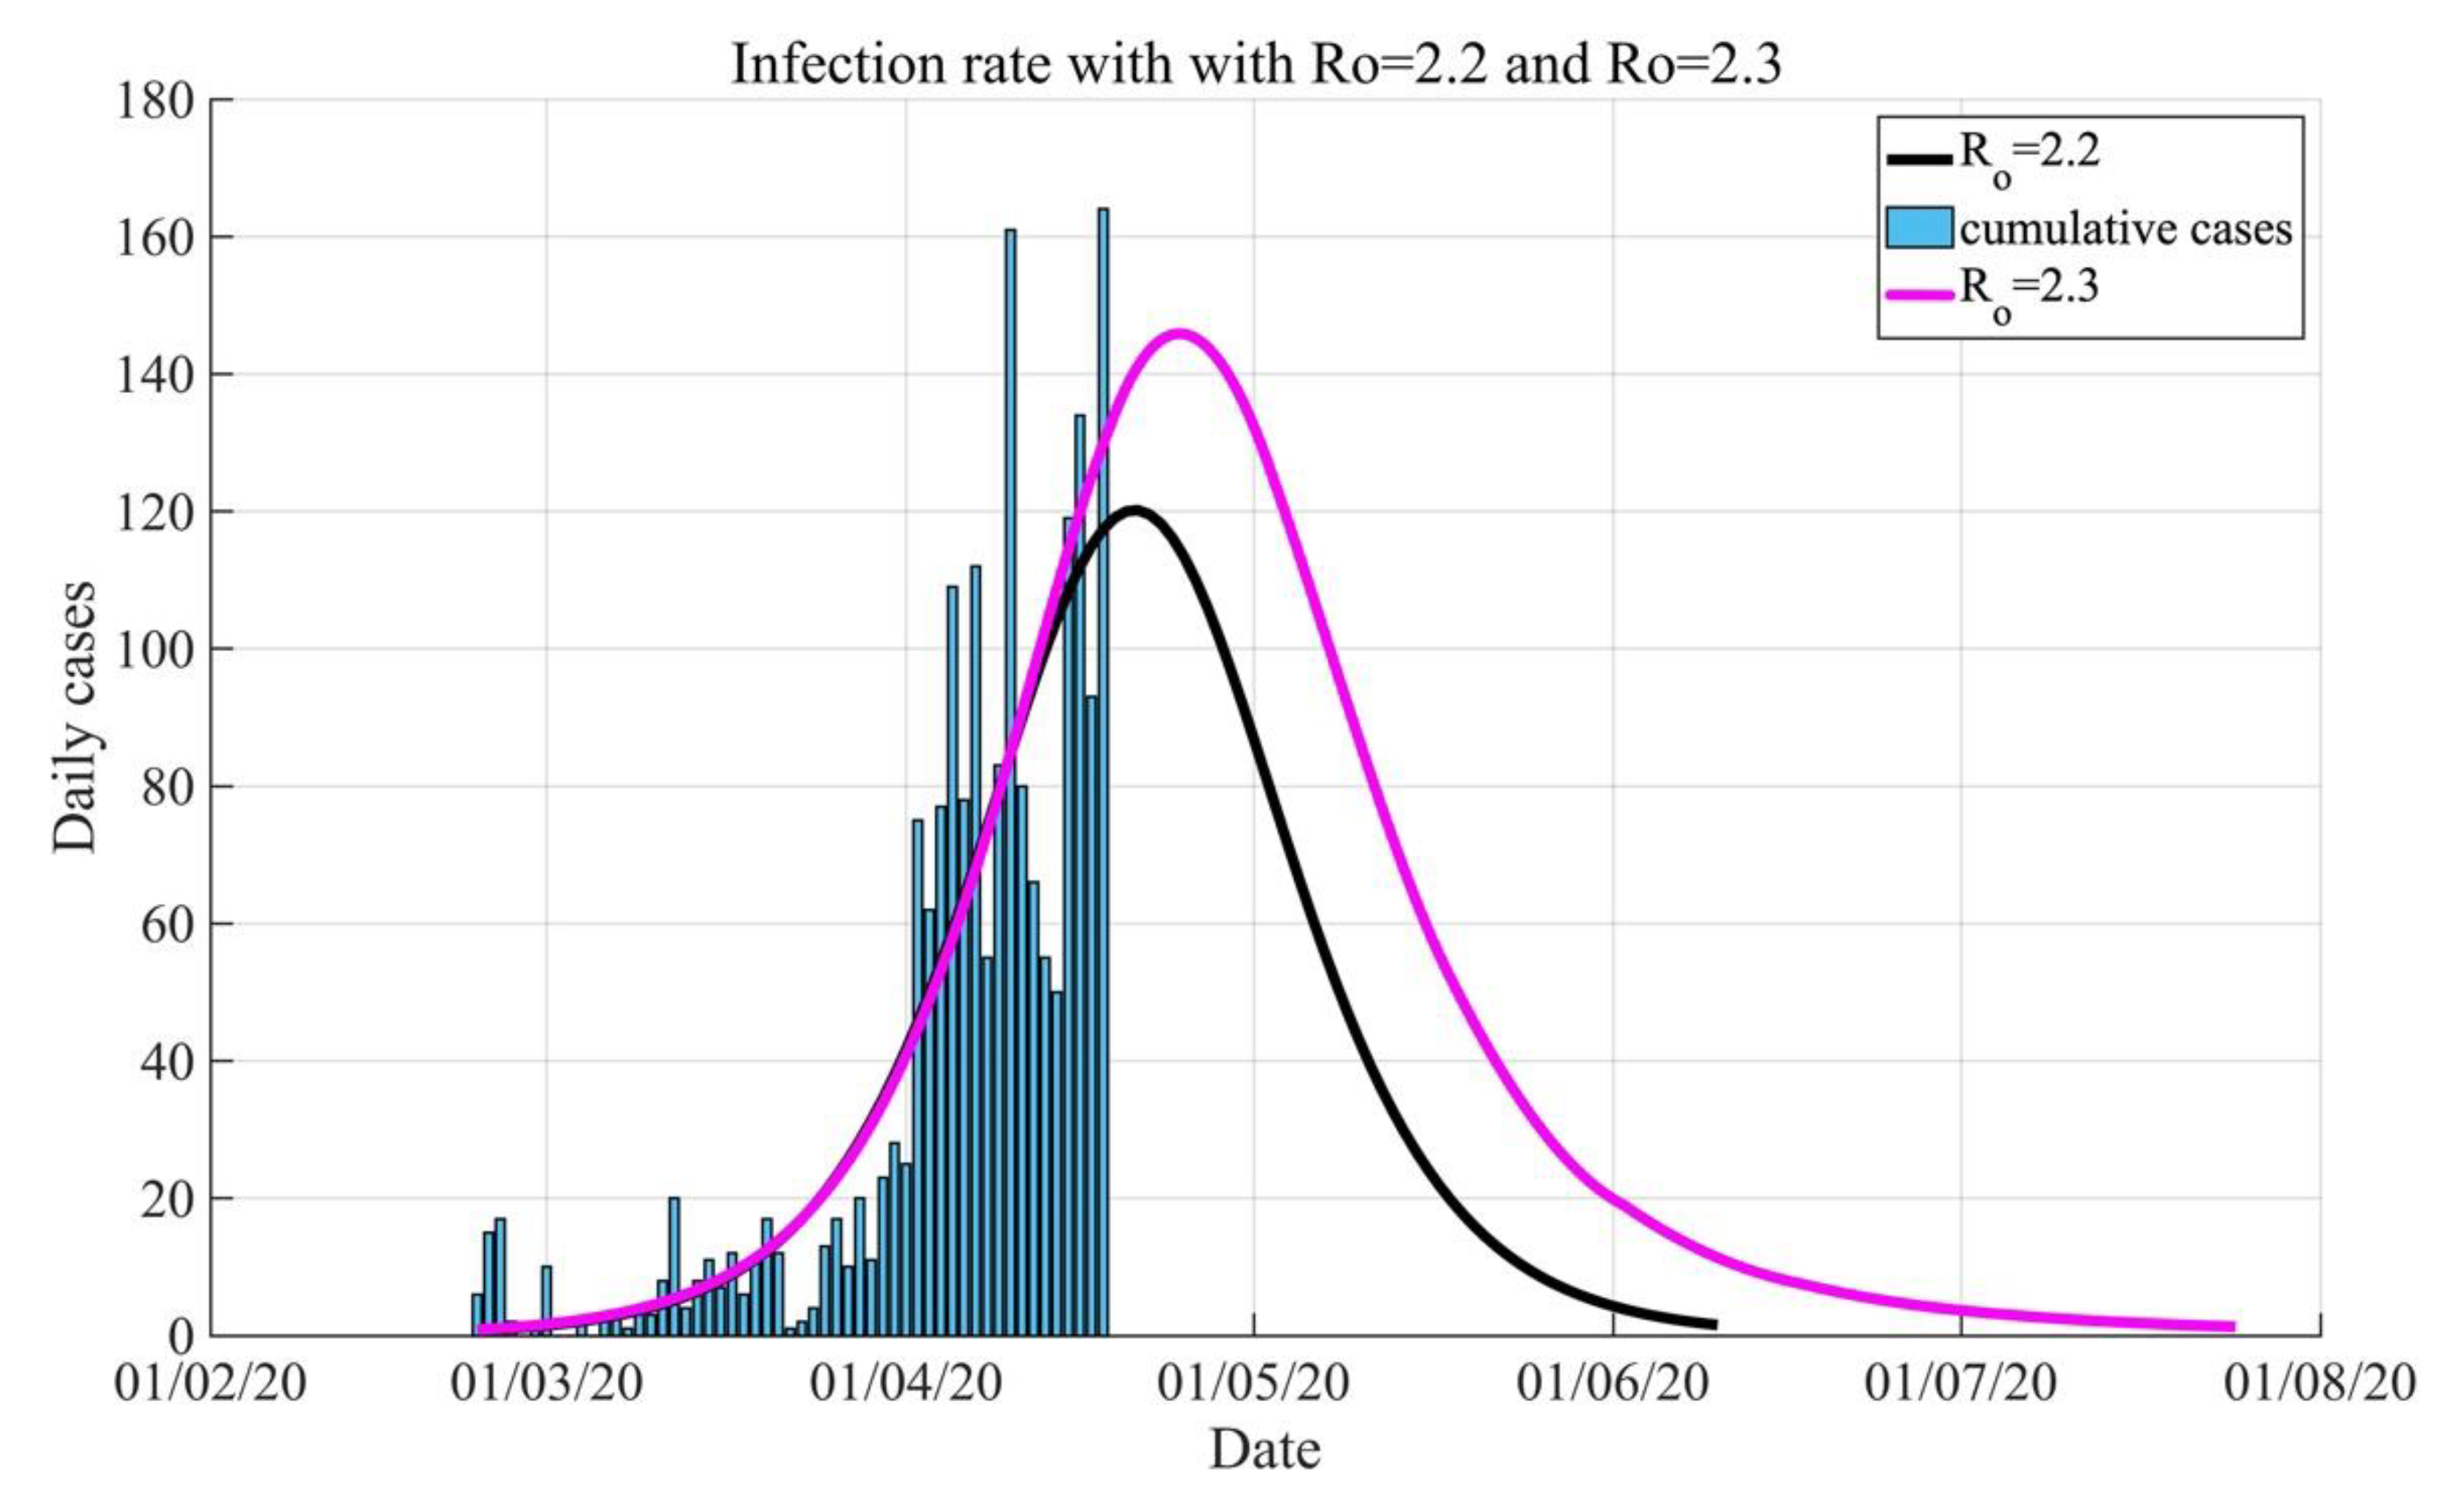
The simulation results of the SIR model with the predefined scenarios are shown in Figure 5 and Figure 6 to illustrate the prediction of the cumulative infections and the rate of infection peaks respectively. The simulation parameters of each scenario are provided in Table 6. In Figure 5, the highest predicted cumulative cases are estimated to be 6023 with along with an estimated start of the ending phase to occur at 23 July 2020. In addition, the infection and recovery rates are 0.397 and 0.173 respectively.
Figure 6 illustrates the impact of varying the reproduction number on controlling the spread and peak of the infection. It is evident that the increase of the reproduction number would delay the estimated ending phase by approximately seven weeks, with an estimated increase in the epidemic size of 29.57%. This increase could be attributed to the fact that the citizens are repatriating from epicenters with higher reproduction number and could be asymptomatic and thus may spread the infection to the susceptible population.
3.4. Prediction of the Spread of COVID-19 in Kuwait with Time-Varying Numbers of Susceptible and Infected Individuals
There is an associated amount of uncertainty in modeling the spread of COVID-19 [22]. The uncertainty is due to several parameters including the latent period in the patient infected with COVID-19, the period of infectivity, and patients’ recovery time. It is therefore crucial to consider these uncertainties when interpreting the prediction results. To address these uncertainties, a stochastic SIR ICM approach was utilized to simulate the spread with a variable number of contacts before and after the repatriation plan. The approach will be effective in estimating the peak value and time of the epidemic due to simultaneous changes in the number of susceptible and infected individuals at time t. Also, to assess whether the intervention measures, such as partial curfew and social distancing, are effective in responding to the outbreak. Consequently, a combination of 18 simulations were carried out to illustrate the impact of adherence to social distancing in controlling the spread of COVID-19 in Kuwait.
To demonstrate the effect of simultaneous changes in the number of susceptible individuals, the stochastic SIR ICM model was simulated with a varying population size. Similarly, to illustrate the effect of the rapid changes in the number of infected individuals at a given time, different infection rates and individual contact numbers were simulated simultaneously. As a result, various infection rates were assumed for the simulation scenarios. The base infection rate was selected as 0.38 and increased further to 0.405 and 0.43 to examine the effect of the variation of infectivity on the epidemic peak value. Furthermore, an individual’s number of contacts was chosen to be 2, 6, and 10 contacts to represent low, medium and high social mixing, respectively. Figure 7 and Figure 8 present the stochastic simulation of the Kuwaiti population before and after the repatriation plan, respectively, and the associated simulation results are presented in Table 7.
It can be noted that repatriating the citizens would increase the daily cases peak value by an average increase of 11.71%, which highlights the impact of increased susceptible population on the epidemic peak size. Furthermore, Figure 7 and Figure 8 show that the peak value is proportionally affected by the number of contacts per person and the infection rate. Reducing individual contact rate from 10 to 6 contacts results in an average reduction of 36.1% of the daily cases peak values. In addition, reducing the individual contact rates from 10 to 2 contacts, results in a significant reduction average of 68.07% of the daily cases peak value. The simulation results evidently show that social distancing is a critical intervention measure and will substantially reduce the epidemic peak value.
4. Discussion
Different scenarios were investigated for the Kuwait COVID-19 outbreak to provide insights for policymakers to implement appropriate intervention actions. Compartmental and logistic models were used in this study to forecast the peak of daily cases, the total infected cases and the expected dates of the start and ending phase of the epidemic. Also, stochastic SIR ICM simulations were carried out to examine the impact of the simultaneous changes in the number of the susceptible and infected populations. Furthermore, stochastic SIR-ICM simulations assess the effectiveness of intervention measures such as social distancing and lockdown.
Different control measures were taken by the Kuwait government as indicated in Table 2. The measures were increased gradually into more restricted measures in response to the spread of COVID-19. The first measure was the closure of schools and universities since the percentage of people in the age range of 5–24 years represent approximately 25% of the whole Kuwait population as of 1 January 2019 according to the Central Statistical Bureau [23]. The action is important despite the early report that indicated the low percentage of this age range [24] as they could transmit the virus to other age groups. In addition, a recent report from WHO indicated a steady-state increase over time in the proportion of cases aged 20-39 [25]. Such actions are believed to assist in the absence of any local transmission in the first two weeks as shown in Table 8. However, the number of local transmission cases increased drastically and have reached 274 cases during the 6th week of the epidemic. Another increase of 635 and 665 cases in the 7th and 8th weeks respectively was observed. Therefore, additional controlling measures were implemented. Partial curfew was imposed all over Kuwait from Sunday evening, 22 March 2020, from 5 p.m. until 4 a.m. daily. On 6 April 2020, complete isolation and lockdown was imposed in selected areas that have had the highest local transmission. These areas are Jleeb Al-Shuyaukh and Al-mahaboula, with a lockdown period of two weeks.
The results of the first scenario depicted in Figure 1 indicated that the ending phase is expected to start at 22 April 2020 and the estimated number of maximum cases as 4223. The expected date is based on the fitting of the logistics regression model of confirmed infected cases recorded in Kuwait. In addition, the scenario was simulated using the SIR model to estimate the reproduction number from the model and was found to be 2.2. The value Ro is in the lower band of the world range which was reported to be between 2.0 to 2.5 as provided by WHO estimation [17]. This can be used to indicate the positive impact of the implemented governmental measures to mitigate and slow down the outbreak of COVID-19. The measures emphasized and focused on social distancing to reduce the contact of people and thus reducing human-to-human transmission.
In addition, the effect of the repatriation plan of approximately 40,000 citizens on the current COVID-19 spread was simulated and analyzed. Simulation results encourage strict intervention measures of Kuwait to contain the spread of COVID-19 and suggest that Kuwait will be able to contain the spread by extending the prevention measures period. Although there is an increase in the predicted cases due to the repatriation plan, Kuwait has kept the integrity of its citizens, and prevented possible failures in the health system by the proper arrangement of repatriating flights. The flights were arranged with an arrivals rate that is within the range of available quarantine locations.
The maximum reproduction number value (Ro = 2.5) was used to predict the worst scenario and was compared to the current forecasting as shown in Figure 3 and Figure 4. There is a great difference between the two scenarios in the estimated cumulative cases. The model based on actual infected cases forecasts a maximum of 4244 cases while the worst-case scenario reached 17,684 cumulative cases with Ro = 2.5. The reduction of the predicted peak values highlights the efficiency of rigorous efforts in the epidemic containment measures of the government of Kuwait.
Due to the uncertainty in modeling the spread of COVID-19, further simulations were introduced using a stochastic SIR ICM approach. The simulations illustrated the effect of varying the number of the infected and susceptible populations simultaneously with a variable number of contact rates and infectivity. The results showed that reducing the number of contacts and complying with the social distancing regulations would significantly reduce the epidemic peak value. Furthermore, it is in accord with the several intervention measures taken by the government of Kuwait. However, a high stake in preventing the spread and controlling the epidemic size relies on the adherence of the population with the intervention measures and health regulations. Therefore, it is critical to raise awareness among the population about the importance of complying with nonpharmaceutical interventions.
5. Conclusions
A forecast of COVID-19 spread in Kuwait was carried out using various deterministic and stochastic modeling approaches. The forecast was based on the data from 24 February 2020 until 19 April 2020. The reproduction number was estimated based on the confirmed cumulative cases and was found to be 2.2. The study aimed to investigate and assess the effectiveness of preventive measures of the government of Kuwait to control the spread of COVID-19. The study assessed the impact of the repatriation plan on the current situation. The reported results have generally shown that the intervention measures are efficient in containing the spread of COVID-19 in Kuwait with the assumption that the population comply with these measures. However, a lean adherence to these measures would result in an increase in the epidemic size and spread. The study further considered the variation of population size and contact rates between individuals. The results assert that high contact rates among the population would significantly increase the epidemic peak value and more strict intervention measures must be incorporated, such as lockdown and contact tracing. A key priority is to raise the awareness of the population about the significant impact of social distancing and population behavior, in terms of contacts, in containing the spread of COVID-19 in Kuwait. In addition, the study suggests that these measures should be extended further to counteract the impact of the repatriation plan. Finally, the study demonstrated the vital implication on the future practice of the government of Kuwait to integrate mathematical predictive models as significant indicators in containing epidemics and to assess the policies in a quantitative approach.
Author Contributions
Conceptualization, A.M.A. and A.I.A. ; methodology, A.M.A. and A.I.A. ; software, A.M.A.; validation, A.M.A., A.I.A., M.R.A., and S.N.A.; formal analysis, A.M.A. and A.I.A.; investigation, A.M.A. and A.I.A.; resources, A.M.A., A.I.A., M.R.A., and S.N.A.; data curation, A.M.A. and A.I.A.; writing—original draft preparation, A.M.A., A.I.A., M.R.A., and S.N.A.; writing—review and editing, A.M.A., A.I.A., M.R.A., and S.N.A. ; visualization, A.M.A., A.I.A., M.R.A., and S.N.A.; All authors have read and agreed to the published version of the manuscript.
Funding
This research received no external funding.
Conflicts of Interest
The authors declare no conflict of interest.
References
- World Health Organization. Coronavirus Disease COVID-19 Situation Report—51. 6 March 2020. Available online: https://www.who.int/docs/default-source/coronaviruse/situation-reports/20200311-sitrep-51-covid-19.pdf?sfvrsn=1ba62e57_10; p (accessed on 17 April 2020).
- Boccaletti, S.; Ditto, W.; Mindlin, G.; Atangana, A. Modeling and forecasting of epidemic spreading: The case of Covid-19 and beyond. Chaos Solitons Fractals 2020, 135, 109794. [Google Scholar] [CrossRef] [PubMed]
- Kuniya, T. Prediction of the epidemic peak of coronavirus disease in Japan. J. Clin. Med. 2020, 9, 789. [Google Scholar] [CrossRef] [PubMed] [Green Version]
- Al-qaness, M.A.; Ewees, A.A.; Fan, H.; Abd El Aziz, M. Optimization method for forecasting confirmed cases of COVID-19 in China. J. Clin. Med. 2020, 9, 674. [Google Scholar] [CrossRef] [PubMed] [Green Version]
- Koczkodaj, W.W.; Mansournia, M.A.; Pedrycz, W.; Wolny-Dominiak, A.; Zabrodskii, P.F.; Strzaška, D.; Armstrong, T.; Zolfaghari, A.H.; Debski, M.; Mazurek, J. 1,000,000 cases of COVID-19 outside of China: The date predicted by a simple heuristic. Glob. Epidemiol. 2020, 100023. [Google Scholar] [CrossRef] [PubMed]
- Wu, J.T.; Leung, K.; Leung, G.M. Nowcasting and forecasting the potential domestic and international spread of the 2019-nCoV outbreak originating in Wuhan, China: A modelling study. Lancet 2020, 395, 689–697. [Google Scholar] [CrossRef] [Green Version]
- Macrotrends. Available online: https://www.macrotrends.net/countries/KWT/kuwait/population (accessed on 14 April 2020).
- Centre of Government Comunnication- State of Kuwait. Available online: https://www.cmgs.gov.kw/CGC (accessed on 12 April 2020).
- Ferguson, N.; Laydon, D.; Nedjati-Gilani, G. Impact of Non-Pharmaceutical Interventions (NPIs) to Reduce COVID-19 Mortality and Healthcare Demand; peprint at Spiral; Imperial College COVID-19 Response Team: South Kensington Campus, London, UK, 2020. [Google Scholar] [CrossRef]
- Chowell, G.; Sattenspiel, L.; Bansal, S.; Viboud, C. Mathematical models to characterize early epidemic growth: A review. Phys. Life Rev. 2016, 18, 66–97. [Google Scholar] [CrossRef] [PubMed] [Green Version]
- Brauer, F.; Castillo-Chavez, C.; Feng, Z. Mathematical Models in Epidemiology, 1st ed.; Springer: New York, NY, USA, 2019; Volume 69, p. XVIII 619. [Google Scholar]
- Rahmandad, H.; Sterman, J. Heterogeneity and network structure in the dynamics of diffusion: Comparing agent-based and differential equation models. Manag. Sci. 2008, 54, 998–1014. [Google Scholar] [CrossRef] [Green Version]
- Roda, W.C.; Varughese, M.B.; Han, D.; Li, M.Y. Why is it difficult to accurately predict the COVID-19 epidemic? Infect. Dis. Model. 2020, 5, 71–281. [Google Scholar] [CrossRef] [PubMed]
- Singh, H.; Dhar, J. Mathematical Population Dynamics and Epidemiology in Temporal and Spatio-Temporal Domains; Apple Academic Press: Wallingford, CT, USA, 2018. [Google Scholar]
- Batista, M. Estimation of the Final Size of the Coronavirus Epidemic by the Logistic Model. 2020. Available online: https://www.medrxiv.org/content/10.1101/2020.03.11.20024901v2 (accessed on 11 April 2020).
- Hethcote, H.W. The mathematics of infectious diseases. SIAM Rev. 2000, 42, 599–653. [Google Scholar] [CrossRef] [Green Version]
- World Health Organization. Coronavirus Disease COVID-19 Situation Report—46. 6 March 2020. Available online: https://www.who.int/docs/default-source/coronaviruse/situation-reports/20200306-sitrep-46-covid-19.pdf?sfvrsn=96b04adf_4; p (accessed on 11 April 2020).
- Liu, Y.; Gayle, A.A.; Wilder-Smith, A.; Rocklöv, J. The reproductive number of COVID-19 is higher compared to SARS coronavirus. J. Travel Med. 2020, 27. [Google Scholar] [CrossRef] [PubMed] [Green Version]
- Jenness, S.M.; Goodreau, S.M.; Morris, M. EpiModel: An R package for mathematical modeling of infectious disease over networks. J. Stat. Softw. 2018, 84. [Google Scholar] [CrossRef] [PubMed] [Green Version]
- Churches, T. Health Data Science Blog: Modelling the Effects of Public Health Interventions on COVID-19 Transmission Using R—Part 1. Available online: https://timchurches.github.io/blog/posts/2020-03-10-modelling-the-effects-of-public-health-interventions-on-covid-19-transmission-part-1/ (accessed on 15 April 2020).
- Agency, K.N. Kuwait News Agency. Available online: https://www.kuna.net.kw/ArticleDetails.aspx?id=2886637 (accessed on 11 April 2020).
- Petropoulos, F.; Makridakis, S. Forecasting the novel coronavirus COVID-19. PLoS ONE 2020, 15, e0231236. [Google Scholar] [CrossRef] [PubMed]
- Bureau, C.S. Population Estimates in Kuwait by Age, Nationality and Sex at 1-1-2019. Available online: https://www.csb.gov.kw/Pages/Statistics_en?ID=67&ParentCatID=1/ (accessed on 19 April 2020).
- Wu, Z.; McGoogan, J.M. Characteristics of and important lessons from the coronavirus disease 2019 (COVID-19) outbreak in China: Summary of a report of 72 314 cases from the Chinese Center for Disease Control and Prevention. JAMA 2020, 323, 1239–1242. [Google Scholar] [CrossRef] [PubMed]
- World Health Organization. Coronavirus Disease COVID-19 Situation Report—89. 6 March 2020. Available online: https://www.who.int/docs/default-source/coronaviruse/situation-reports/20200418-sitrep-89-covid-19.pdf?sfvrsn=3643dd38_2; p (accessed on 19 April 2020).
Figure 1.
Confirmed and predicted cumulative infections in Kuwait from 24 February to 19 April.

Figure 2.
Confirmed infected daily cases and the prediction of infection rate in Kuwait.

Figure 3.
A comparison between the prediction curves of the current estimated reproduction number (Ro = 2.2) and a higher reproduction number of Ro = 2.5.
Figure 3.
A comparison between the prediction curves of the current estimated reproduction number (Ro = 2.2) and a higher reproduction number of Ro = 2.5.

Figure 4.
A comparison between the peaks of the current estimated reproduction number (Ro = 2.2) and a higher reproduction number of Ro = 2.5.
Figure 4.
A comparison between the peaks of the current estimated reproduction number (Ro = 2.2) and a higher reproduction number of Ro = 2.5.

Figure 5.
Predicted cumulative infections with various reproduction numbers of and .

Figure 6.
Predicted infection rates with various reproduction number of and

Figure 7.
Stochastic simulation results of SIR model with various infection rates and contacts before the repatriation plan.
Figure 7.
Stochastic simulation results of SIR model with various infection rates and contacts before the repatriation plan.

Figure 8.
Stochastic simulation results of SIR model with various infection rates and contacts after the repatriation plan.
Figure 8.
Stochastic simulation results of SIR model with various infection rates and contacts after the repatriation plan.


Table 1.
Number of newly reported novel coronavirus 2019 (COVID-19) cases in Kuwait from 24 February until 19 April 2020.
Table 1.
Number of newly reported novel coronavirus 2019 (COVID-19) cases in Kuwait from 24 February until 19 April 2020.
| Date | Number of New Cases | Accumulated Cases | Date | Number of New Cases | Accumulated Cases | Date | Number of New Cases | Accumulated Cases |
|---|---|---|---|---|---|---|---|---|
| 24 February | 5 | 5 | 14 March | 4 | 104 | 2 April | 25 | 342 |
| 25 February | 6 | 11 | 15 March | 8 | 112 | 3 April | 75 | 417 |
| 26 February | 15 | 26 | 16 March | 11 | 123 | 4 April | 62 | 479 |
| 27 February | 17 | 43 | 17 March | 7 | 130 | 5 April | 77 | 556 |
| 28 February | 2 | 45 | 18 March | 12 | 142 | 6 April | 109 | 665 |
| 29 February | 0 | 45 | 19 March | 6 | 148 | 7 April | 78 | 743 |
| 1 March | 1 | 46 | 20 March | 11 | 159 | 8 April | 112 | 855 |
| 2 March | 10 | 56 | 21 March | 17 | 176 | 9 April | 55 | 910 |
| 3 March | 0 | 56 | 22 March | 12 | 188 | 10 April | 83 | 993 |
| 4 March | 0 | 56 | 23 March | 1 | 189 | 11 April | 161 | 1154 |
| 5 March | 2 | 58 | 24 March | 2 | 191 | 12 April | 80 | 1234 |
| 6 March | 0 | 58 | 25 March | 4 | 195 | 13 April | 66 | 1300 |
| 7 March | 3 | 61 | 26 March | 13 | 208 | 14 April | 55 | 1355 |
| 8 March | 3 | 64 | 27 March | 17 | 225 | 15 April | 50 | 1405 |
| 9 March | 1 | 65 | 28 March | 10 | 235 | 16 April | 119 | 1524 |
| 10 March | 4 | 69 | 29 March | 20 | 255 | 17 April | 134 | 1658 |
| 11 March | 3 | 72 | 30 March | 11 | 266 | 18 April | 93 | 1751 |
| 12 March | 8 | 80 | 31 March | 23 | 289 | 19 April | 164 | 1915 |
| 13 March | 20 | 100 | 1 April | 28 | 317 |
Table 2.
The rigorous containments and orders taken by Kuwait Government.
| Decision | |
|---|---|
| 26 February | Disruption of studies in all public and private schools, universities and colleges, as of March 1, 2020, for a period of two weeks. |
| 27 February | The Civil Service Bureau decided to temporarily suspend the operation of the fingerprint system in all government agencies from 1 March. |
| 7 March | Suspending flights to and from China, Hong Kong, the Islamic Republic of Iran, the Republic of South Korea, the Kingdom of Thailand, the Italian Republic, the Republic of Singapore, Japan, and the Republic of Iraq). |
| Suspending all incoming and outgoing flights to and from Kuwait International Airport for the following countries (Bangladesh, the Philippines, India, Sri Lanka, the Syrian Arab Republic, the Lebanese Republic, and the Arab Republic of Egypt), for a period of one week. | |
| Citizens of the State of Kuwait coming from those countries are allowed to enter, provided that the necessary quarantine procedures are applied to them, and they instruct the concerned authorities to take the necessary measures to implement this decision. | |
| 9 March | Extending the suspension of studies in all public and private schools, universities and colleges for a period of two weeks. |
| 11 March | Suspension of flights to and from Kuwait from midnight until further notice, and flights coming to Kuwait are limited to citizens and their first degree relatives. |
| Preventing the presence of all restaurants and cafes, including shopping malls. | |
| Close the clubs and health institutes. | |
| The period from Thursday 12 March 2020 to Thursday 26 March 2020 is considered an official holiday, provided that the official working hours are resumed on Sunday 29 March 2020. | |
| 13 March | Stopping the Friday sermon and congregational prayer in the mosques until further notice. |
| Friday market closed until further notice. | |
| It is forbidden to establish auctions for livestock and plants, and direct selling is sufficient. | |
| Canceling fish market and fixing prices. | |
| Closure of condolence halls in cemeteries. | |
| Stop licensing of mobile sales cars and ice cream cars. | |
| Close public parks. | |
| Preventing the establishment of any activities or gatherings in parks belonging to the Public Authority for Agriculture Affairs and Fish Resources. | |
| 14 March | Closing of commercial complexes, shopping centers (malls) and public markets, except for food and food outlets. |
| Closing of all the centers and entertainment halls for children. | |
| Closing of all women and men salons. | |
| Only 5 customers are allowed to queue inside a restaurant or café. In case of standing in a queue, please keep a distance of at least 1 meter between each person. | |
| 18 March | It is forbidden to hold parties, including weddings and others, whether they are held in a public place or a private place, including private accommodation and private bureaus. |
| Banquets, receptions, and other activities for nonfamily members are not permitted. | |
| Receptions and gatherings are prohibited in public or private bureaus. | |
| 19 March | The extension of the decision of suspension of schools, both public and private, universities, military colleges, and ministry of Awqaf and Islamic Affairs centers so that all will return on Tuesday 4 August 2020 for both government and private schools including public and higher studies. |
| 21 March | Partial curfew will be imposed in the country from Sunday evening, 22 March 2020, from 5 p.m. until 4 a.m. daily. |
| Extension of the official holyday until 9 April 2020. | |
| 26 March | A one month salary to all scholarship and private students, who are registered in the cultural centers abroad. |
| Halt to all taxi services. | |
| All press conferences will be held without media attendance, communication will be via a video conference. | |
| Assign the Kuwait Supply Company to fill any shortage of basic materials and food that are mentioned by Ministry of Commerce and Industry through local and international markets. | |
| 6 April | All ministries, government agencies, public bodies and institutions are to be on days of rest due to the outbreak of the New Coronavirus, COVID-19, beginning on Sunday 12 April 2020 to resume regular working hours on 26 April 2020. |
| Amending the period of the curfew in the country to be from 5 p.m. to 6 a.m. daily starting from 6 April 2020. | |
| Imposing complete isolation and 24 hours in the areas of Jleeb Al-Shuyaukh and Al-mahaboula for the period of two weeks, starting on Monday evening 6 April 2020. |
Table 3.
Estimated simulation results of the logistics regression model.
| Parameters | Values |
|---|---|
| Estimated epidemic size | 4223 cumulative cases |
| Estimated epidemic rate (per day) | 0.113 |
| Estimated peak date | 22-4-2020 |
| Estimated peak day cases | 120 cases |
| Estimated start of ending phase date | 15-6-2020 |
| Root mean square error | 48 |
| R2 | 0.992 |
Table 4.
Short term forecasting for Kuwait.
| Day. | Date | Confirmed Cases | Predicted Cases | Error Percentage | Confirmed Daily Cases | Predicted Daily Cases | Error Percentage |
|---|---|---|---|---|---|---|---|
| 51 | 14 April 2020 | 1355 | 1343 | 0.89 | 55 | 102 | 85.45 |
| 52 | 15 April 2020 | 1405 | 1449 | 3.13 | 50 | 106 | 112 |
| 53 | 16 April 2020 | 1524 | 1559 | 2.30 | 119 | 110 | 7.56 |
| 54 | 17 April 2020 | 1658 | 1673 | 0.90 | 134 | 114 | 14.93 |
| 55 | 18 April 2020 | 1751 | 1789 | 2.17 | 93 | 116 | 24.73 |
| 56 | 19 April 2020 | 1915 | 1907 | 0.42 | 164 | 118 | 28.05 |
| 57 | 20 April 2020 | - | 2027 | - | - | 120 | - |
| 58 | 21 April 2020 | - | 2147 | - | - | 120 | - |
| 59 | 22 April 2020 | - | 2267 | - | - | 120 | - |
| 60 | 23 April 2020 | - | 2386 | - | - | 119 | - |
| 61 | 24 April 2020 | - | 2503 | - | - | 117 | - |
| 62 | 25 April 2020 | - | 2618 | - | - | 115 | - |
Table 5.
Susceptible–infected–recovered (SIR) simulation results with Ro = 2.2 and Ro = 2.5.
| Parameters | ||
|---|---|---|
| Infection rate | 0.38 | 0.43 |
| Recovery rate | 0.173 | 0.173 |
| Infectious period per infected person | 5.8 days | 5.8 days |
| Estimated epidemic size (cumulative cases) | 4244 | 17684 |
| Estimated peak date | 23-4-2020 | 9-5-2020 |
| Estimated peak day cases | 124 cases | 363 cases |
| Estimated start of ending phase date | 28-5-2020 | 20-8-2020 |
| Root mean square error | 50.2 | 52.76 |
| R2 | 0.993 | 0.996 |
Table 6.
SIR simulation parameters with various reproduction numbers.
| Parameters | ||
|---|---|---|
| Infection rate | 0.38 | 0.397 |
| Recovery rate | 0.173 | 0.173 |
| Infectious period per infected person | 5.8 days | 5.8 days |
| Estimated epidemic size (cumulative cases) | 4244 | 6026 |
| Estimated peak date | 23 April 2020 | 25 April 2020 |
| Estimated peak day cases | 124 cases | 145 cases |
| Estimated start of ending phase date | 28 May 2020 | 23 July 2020 |
| Root mean square error | 50.2 | 47.55 |
| R2 | 0.993 | 0.995 |
Table 7.
Stochastic SIR simulation results.
| Peak Values | Contacts Per Day before Repatriation | Contacts Per Day after Repatriation | |||||
|---|---|---|---|---|---|---|---|
| Infection Rate | 2 | 6 | 10 | 2 | 6 | 10 | |
| 0.38 | 97 cases Day 54 | 211 cases Day 51 | 348 cases Day 49 | 108 cases Day 56 | 223 cases Day 53 | 399 cases Day 49 | |
| 0.405 | 189 cases Day 48 | 352 cases Day 47 | 520 cases Day 46 | 199 cases Day 48 | 398 cases Day 47 | 601 cases Day 46 | |
| 0.43 | 198 cases Day 46 | 401 cases Day 45 | 599 cases Day 45 | 215 cases Day 46 | 460 cases Day 45 | 698 cases Day 45 | |
Table 8.
Number local transmission cases from 24 February 2020 to 19 April 2020 by weeks.
| No | Week | Number of Local Transmission Cases |
|---|---|---|
| 1 | 24 February to 1 March | 0 |
| 2 | 2 March to 8 March | 0 |
| 3 | 9 March to 15 March | 11 |
| 4 | 16 March to 22 March | 25 |
| 5 | 23 March to 29 March | 39 |
| 6 | 30 March to 5 April | 274 |
| 7 | 6 April to 12 April | 635 |
| 8 | 13 April to 19 April | 663 |
© 2020 by the authors. Licensee MDPI, Basel, Switzerland. This article is an open access article distributed under the terms and conditions of the Creative Commons Attribution (CC BY) license (http://creativecommons.org/licenses/by/4.0/).
Share and Cite
MDPI and ACS Style
Almeshal, A.M.; Almazrouee, A.I.; Alenizi, M.R.; Alhajeri, S.N. Forecasting the Spread of COVID-19 in Kuwait Using Compartmental and Logistic Regression Models. Appl. Sci. 2020, 10, 3402. https://doi.org/10.3390/app10103402
AMA Style
Almeshal AM, Almazrouee AI, Alenizi MR, Alhajeri SN. Forecasting the Spread of COVID-19 in Kuwait Using Compartmental and Logistic Regression Models. Applied Sciences. 2020; 10(10):3402. https://doi.org/10.3390/app10103402
Chicago/Turabian StyleAlmeshal, Abdullah M., Abdulla I. Almazrouee, Mohammad R. Alenizi, and Saleh N. Alhajeri. 2020. "Forecasting the Spread of COVID-19 in Kuwait Using Compartmental and Logistic Regression Models" Applied Sciences 10, no. 10: 3402. https://doi.org/10.3390/app10103402
Note that from the first issue of 2016, this journal uses article numbers instead of page numbers. See further details here.