
Real-World Evidence of COVID-19 Patients’ Data Quality in the Electronic Health Records

 , and
, and
Abstract
:1. Introduction
Related Work
2. Materials and Methods
2.1. Study Type
2.2. Inclusion and Exclusion Criteria
2.3. EHR System and Setting
2.4. Data Extraction and Chart Review
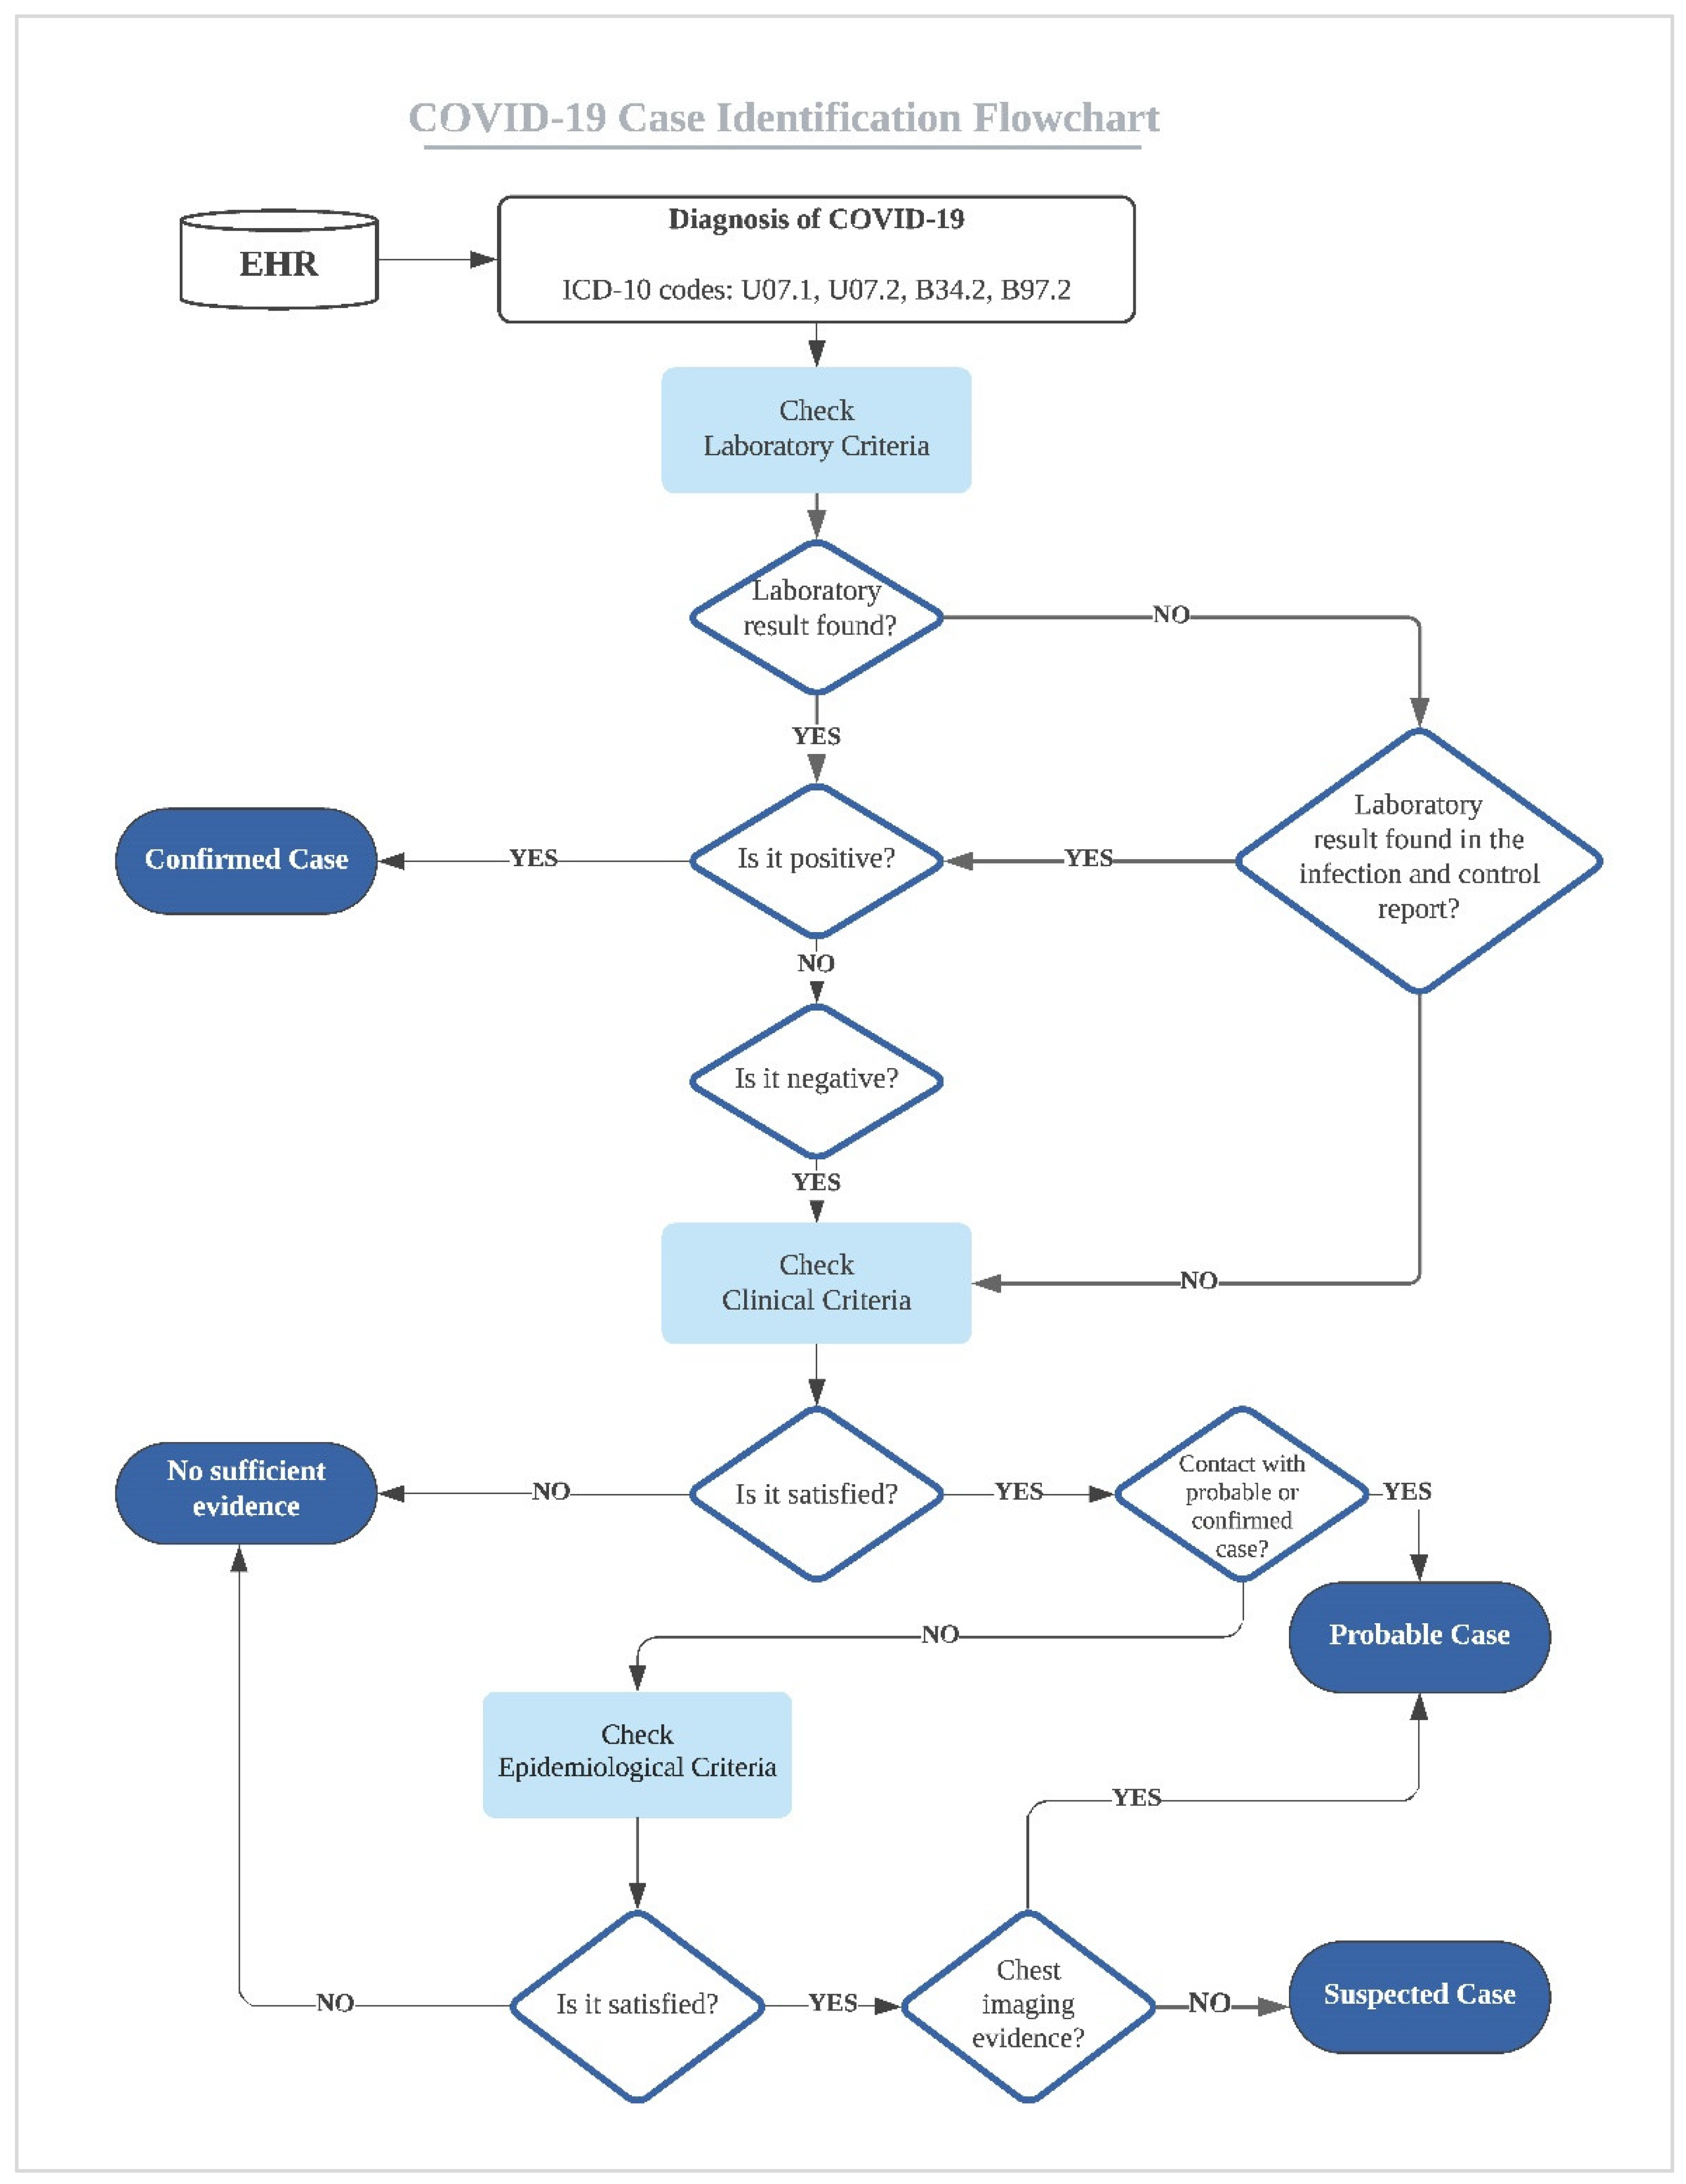
2.5. COVID-19 Case Definition
2.6. Data Quality Evaluation and Data Analysis
3. Results
4. Discussion
- Conduct similar EHR studies across different institutions to fully understand the barriers of high-quality documentation and secondary use of EHR data with the goal to improve the efficiency and quality of EHR data, EHR documentation, and EHR secondary use.
- Avoid using single diagnosis-based phenotyping strategies to define patients, such as diagnosis codes, because it can lead to inaccurate and biased conclusions with negative implications on clinical research and public health surveillance.
- Define the minimum standard content for documentation for EHR at point-of-care within an institution or across different institutions to address the lack of accurate, consistent, and complete EHR data and documentation.
- Develop structured documentation guidelines to document clinical or epidemiological information that is usually documented in unstructured clinical notes.
- Develop natural language processing and automated methods to mine this information from unstructured clinical notes.
- Build an infrastructure for health information exchange across institutions and implement interoperability standards, which have a significant role in establishing shared and aggregated EHR data, standardizing EHR data, and improving EHR data quality to improve the quality and safety of patients’ care.
- Develop automated data quality assessment and validation tools and methods that can be used before EHR applications in conducting secondary research studies, building phenotyping algorithms, and performing data analytics.
- Encourage educational and training efforts to motivate healthcare providers with the importance and benefits of accurate and complete documentation at the point of care.
- Build a multi-disciplinary collaborative team during the initial stages of the clinical crisis could address many of the data quality challenges.
5. Conclusions
Author Contributions
Funding
Institutional Review Board Statement
Informed Consent Statement
Data Availability Statement
Acknowledgments
Conflicts of Interest
Appendix A

|
| Laboratory Criteria | Positive Nucleic Acid Amplification Test (NAAT) |
|---|---|
| Clinical criteria |
|
| Epidemiologic Criteria (within the 14 days before symptom onset) |
|
| Chest Imaging | Findings suggestive of COVID-19. |
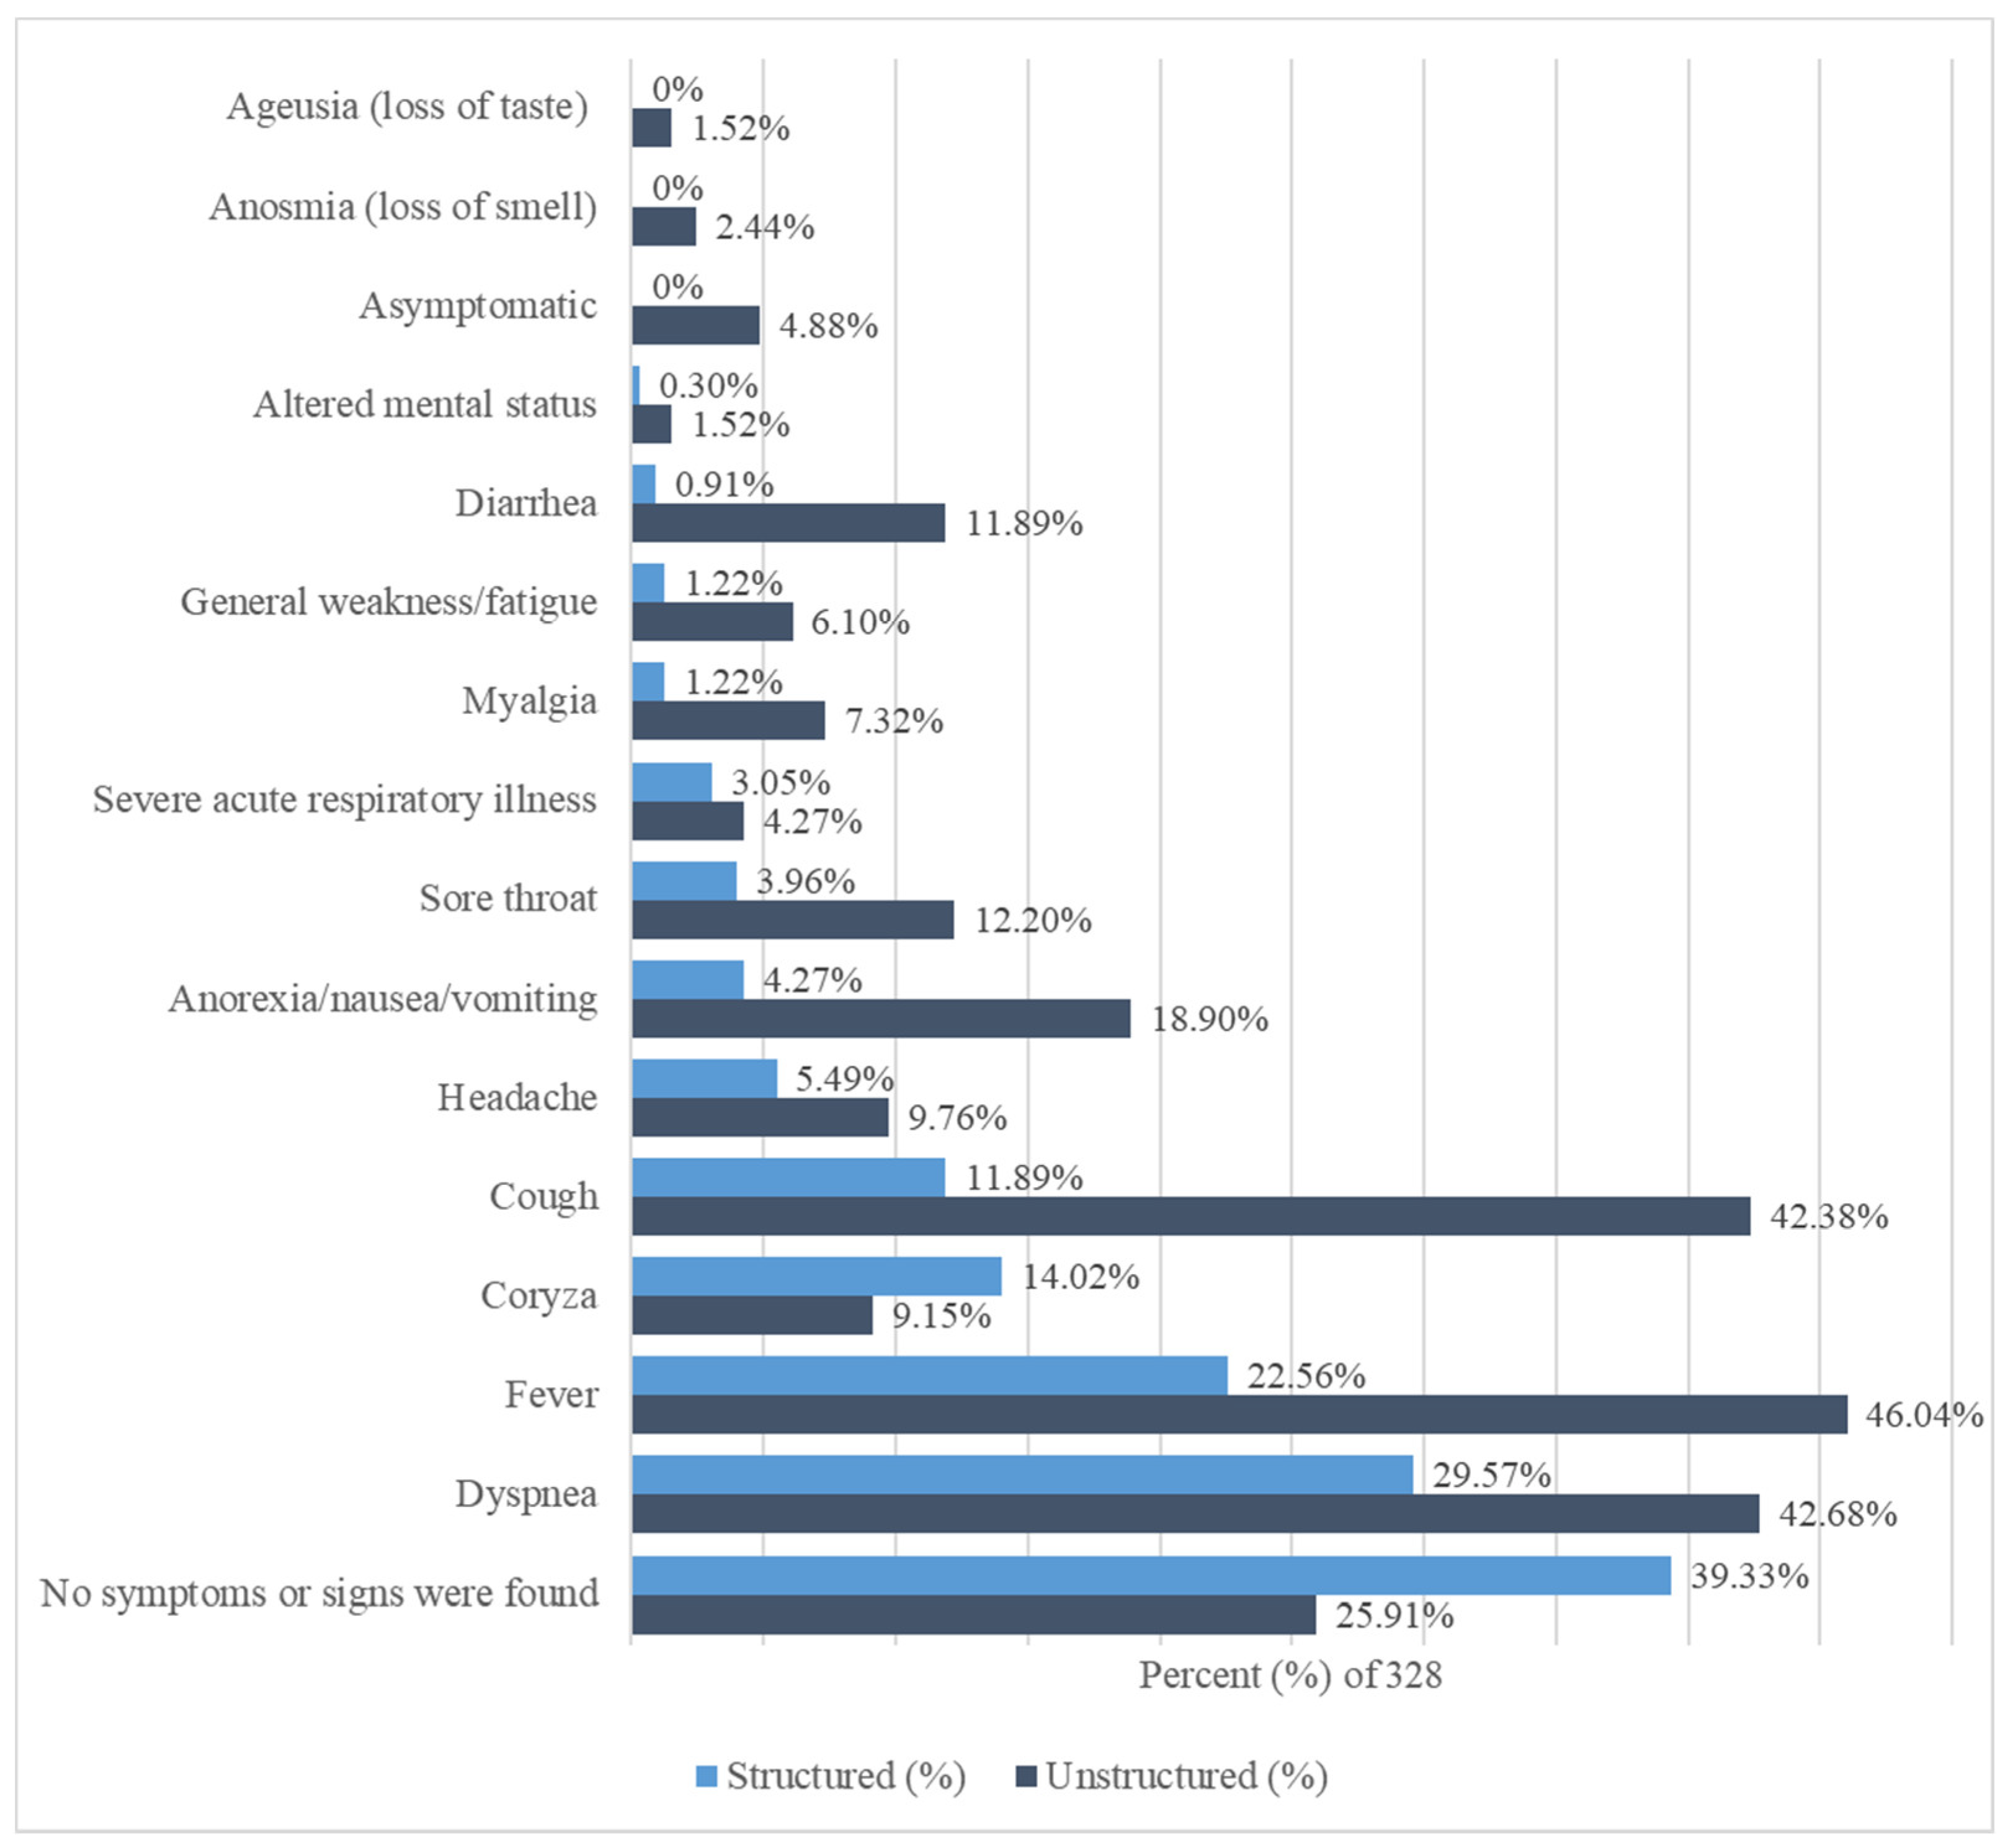
| Signs and Symptoms | Structured | % of 328 | Unstructured | % of 328 |
|---|---|---|---|---|
| Ageusia (loss of taste) | 0 | 0% | 5 | 1.52% |
| Altered mental status | 1 | 0.30% | 5 | 1.52% |
| Anorexia/nausea/vomiting | 14 | 4.27% | 62 | 18.90% |
| Anosmia (loss of smell) | 0 | 0% | 8 | 2.44% |
| Asymptomatic | 0 | 0% | 16 | 4.88% |
| Coryza | 46 | 14.02% | 30 | 9.15% |
| Cough | 39 | 11.89% | 139 | 42.38% |
| Diarrhea | 3 | 0.91% | 39 | 11.89% |
| Dyspnea | 97 | 29.57% | 140 | 42.68% |
| Fever | 74 | 22.56% | 151 | 46.04% |
| General weakness/fatigue | 4 | 1.22% | 20 | 6.10% |
| Headache | 18 | 5.49% | 32 | 9.76% |
| Myalgia | 4 | 1.22% | 24 | 7.32% |
| Severe acute respiratory illness | 10 | 3.05% | 14 | 4.27% |
| Sore throat | 13 | 3.96% | 40 | 12.20% |
| No symptoms or signs were found | 129 | 39.33% | 85 | 25.91% |
References
- Denny, J.C. Chapter 13: Mining electronic health records in the genomics era. PLoS Comput. Biol. 2012, 8, e1002823. [Google Scholar] [CrossRef] [Green Version]
- Weiskopf, N.G.; Hripcsak, G.; Swaminathan, S.; Weng, C. Defining and measuring completeness of electronic health records for secondary use. J. Biomed. Inform. 2013, 46, 830–836. [Google Scholar] [CrossRef] [Green Version]
- Al Shaikh, A.; Farahat, F.; Saeedi, M.; Bakar, A.; Al Gahtani, A.; Al-Zahrani, N.; Jaha, L.; Aseeri, M.A.; Al-Jifree, H.M.; Al Zahrani, A. Incidence of diabetic ketoacidosis in newly diagnosed type 1 diabetes children in western Saudi Arabia: 11-year experience. J. Pediatr. Endocrinol. Metab. 2019, 32, 857–862. [Google Scholar] [CrossRef]
- Abualhamael, S.; Mosli, H.; Baig, M.; Noor, A.M.; Alshehri, F.M. Prevalence and Associated Risk Factors of Gestational Diabetes Mellitus at a University Hospital in Saudi Arabia. Pak. J. Med. Sci. 2019, 35, 325–329. [Google Scholar] [CrossRef] [Green Version]
- Al Hamid, A.; Aslanpour, Z.; Aljadhey, H.; Ghaleb, M. Hospitalisation Resulting from Medicine-Related Problems in Adult Patients with Cardiovascular Diseases and Diabetes in the United Kingdom and Saudi Arabia. Int. J. Environ. Res. Public Health 2016, 13, 479. [Google Scholar] [CrossRef] [PubMed] [Green Version]
- Xu, J.; Rasmussen, L.V.; Shaw, P.L.; Jiang, G.; Kiefer, R.C.; Mo, H.; Pacheco, J.A.; Speltz, P.; Zhu, Q.; Denny, J.C.; et al. Review and evaluation of electronic health records-driven phenotype algorithm authoring tools for clinical and translational research. J. Am. Med. Inform. Assoc. 2015, 22, 1251–1260. [Google Scholar] [CrossRef] [PubMed]
- Newton, K.M.; Peissig, P.L.; Kho, A.N.; Bielinski, S.J.; Berg, R.L.; Choudhary, V.; Basford, M.; Chute, C.G.; Kullo, I.J.; Li, R.; et al. Validation of electronic medical record-based phenotyping algorithms: Results and lessons learned from the eMERGE network. J. Am. Med. Inform. Assoc. 2013, 20, 147. [Google Scholar] [CrossRef] [Green Version]
- Liao, K.P.; Cai, T.; Savova, G.K.; Murphy, S.N.; Karlson, E.W.; Ananthakrishnan, A.N.; Gainer, V.S.; Shaw, S.Y.; Xia, Z.; Szolovits, P.; et al. Development of phenotype algorithms using electronic medical records and incorporating natural language processing. BMJ 2015, 350, h1885. [Google Scholar] [CrossRef] [PubMed] [Green Version]
- Sudat, S.E.K.; Robinson, S.C.; Mudiganti, S.; Mani, A.; Pressman, A.R. Mind the clinical-analytic gap: Electronic health records and COVID-19 pandemic response. J. Biomed. Inform. 2021, 116, 103715. [Google Scholar] [CrossRef] [PubMed]
- Reimer, A.P.; Milinovich, A.; Madigan, E.A. Data quality assessment framework to assess electronic medical record data for use in research. Int. J. Med. Inform. 2016, 90, 40–47. [Google Scholar] [CrossRef] [PubMed] [Green Version]
- Liu, C.; Zowghi, D.; Talaei-Khoei, A. An empirical study of the antecedents of data completeness in electronic medical records. Int. J. Inf. Manag. 2020, 50, 155–170. [Google Scholar] [CrossRef]
- Liu, C.; Zowghi, D.; Talaei-Khoei, A.; Daniel, J. Achieving data completeness in electronic medical records: A conceptual model and hypotheses development. In Proceedings of the 51st Hawaii International Conference on System Sciences, University of Hawaii, HI, USA, 3–6 January 2018. [Google Scholar] [CrossRef] [Green Version]
- Botsis, T.; Hartvigsen, G.; Chen, F.; Weng, C. Secondary Use of EHR: Data Quality Issues and Informatics Opportunities. Summit Transl. Bioinform. 2010, 2010, 1–5. [Google Scholar]
- Farzandipour, M.; Sheikhtaheri, A. Evaluation of factors influencing accuracy of principal procedure coding based on ICD-9-CM: An Iranian study. Perspect. Health Inf. Manag. 2009, 6, 5. [Google Scholar]
- Poulos, J.; Zhu, L.; Shah, A.D. Data gaps in electronic health record (EHR) systems: An audit of problem list completeness during the COVID-19 pandemic. Int. J. Med. Inform. 2021, 150, 104452. [Google Scholar] [CrossRef]
- Liu, Y.-N.; Li, J.-Z.; Zou, Z.-N. Determining the Real Data Completeness of a Relational Dataset. J. Comut. Sci. Technol. 2016, 31, 720–740. [Google Scholar] [CrossRef]
- Overmyer, K.A.; Shishkova, E.; Miller, I.J.; Balnis, J.; Bernstein, M.N.; Peters-Clarke, T.M.; Meyer, J.G.; Quan, Q.; Muehlbauer, L.K.; Trujillo, E.A.; et al. Large-Scale Multi-omic Analysis of COVID-19 Severity. Cell Syst. 2021, 12, 23–40.e27. [Google Scholar] [CrossRef] [PubMed]
- Carlotti, A.P.C.P.; Carvalho, W.B.; Johnston, C.; Rodriguez, I.S.; Delgado, A.F. COVID-19 Diagnostic and Management Protocol for Pediatric Patients. Clinics 2020, 75, e1894. [Google Scholar] [CrossRef]
- World Health Organization. Public Health Surveillance for COVID-19: Interim Guidance, 16 December 2020; World Health Organization: Geneva, Switzerland, 2020. [Google Scholar]
- Chen, Z.-M.; Fu, J.-F.; Shu, Q.; Chen, Y.-H.; Hua, C.-Z.; Li, F.-B.; Lin, R.; Tang, L.-F.; Wang, T.-L.; Wang, W.; et al. Diagnosis and treatment recommendations for pediatric respiratory infection caused by the 2019 novel coronavirus. World J. Pediatr. 2020, 16, 240–246. [Google Scholar] [CrossRef] [PubMed] [Green Version]
- Dagliati, A.; Malovini, A.; Tibollo, V.; Bellazzi, R. Health informatics and EHR to support clinical research in the COVID-19 pandemic: An overview. Brief. Bioinform. 2021, 22, 812–822. [Google Scholar] [CrossRef]
- Wu, J.; Wang, J.; Nicholas, S.; Maitland, E.; Fan, Q. Application of Big Data Technology for COVID-19 Prevention and Control in China: Lessons and Recommendations. J. Med. Int. Res. 2020, 22, e21980. [Google Scholar] [CrossRef]
- Biswas, R.K.; Afiaz, A.; Huq, S. Underreporting COVID-19: The curious case of the Indian subcontinent. Epidemiol. Infect. 2020, 148, e207. [Google Scholar] [CrossRef] [PubMed]
- Kohane, I.S.; Aronow, B.J.; Avillach, P.; Beaulieu-Jones, B.K.; Bellazzi, R.; Bradford, R.L.; Brat, G.A.; Cannataro, M.; Cimino, J.J.; García-Barrio, N.; et al. What Every Reader Should Know About Studies Using Electronic Health Record Data but May Be Afraid to Ask. J. Med. Int. Res. 2021, 23, e22219. [Google Scholar] [CrossRef] [PubMed]
- Blatz, A.M.; David, M.Z.; Otto, W.R.; Luan, X.; Gerber, J.S. Validation of International Classification of Disease-10 Code for Identifying Children Hospitalized With Coronavirus Disease-2019. J. Pediatr. Infect. Dis. Soc. 2021, 10, 547–548. [Google Scholar] [CrossRef]
- Lynch, K.E.; Viernes, B.; Gatsby, E.; DuVall, S.L.; Jones, B.E.; Box, T.L.; Kreisler, C.; Jones, M. Positive Predictive Value of COVID-19 ICD-10 Diagnosis Codes Across Calendar Time and Clinical Setting. Clin. Epidemiol. 2021, 13, 1011–1018. [Google Scholar] [CrossRef] [PubMed]
- DeLozier, S.; Bland, S.; McPheeters, M.; Wells, Q.; Farber-Eger, E.; Bejan, C.A.; Fabbri, D.; Rosenbloom, T.; Roden, D.; Johnson, K.B.; et al. Phenotyping coronavirus disease 2019 during a global health pandemic: Lessons learned from the characterization of an early cohort. J. Biomed. Inform. 2021, 117, 103777. [Google Scholar] [CrossRef]
- Gianfrancesco, M.A.; Goldstein, N.D. A narrative review on the validity of electronic health record-based research in epidemiology. BMC Med. Res. Methodol. 2021, 21, 234. [Google Scholar] [CrossRef]
- Downey, S.; Indulska, M.; Sadiq, S. Perceptions and Challenges of EHR Clinical Data Quality. In Proceedings of the Australasian Conference on Information Systems 2019, Perth, WA, Australia, 9–11 December 2019. [Google Scholar]
- Santostefano, C.M.; White, E.M.; Feifer, R.A.; Mor, V. Accuracy of ICD-10 codes for identifying skilled nursing facility residents with lab-confirmed COVID-19. J. Am. Geriatr. Soc. 2021, 1–3. [Google Scholar] [CrossRef]
- Kadri, S.S.; Gundrum, J.; Warner, S.; Cao, Z.; Babiker, A.; Klompas, M.; Rosenthal, N. Uptake and Accuracy of the Diagnosis Code for COVID-19 Among US Hospitalizations. J. Am. Med. Assoc. 2020, 324, 2553–2554. [Google Scholar] [CrossRef]
- Sáez, C.; Romero, N.; Conejero, J.A.; García-Gómez, J.M. Potential limitations in COVID-19 machine learning due to data source variability: A case study in the nCov2019 dataset. J. Am. Med. Inform. Assoc. 2020, 28, 360–364. [Google Scholar] [CrossRef]
- Mamidi, T.K.K.; Tran-Nguyen, T.K.; Melvin, R.L.; Worthey, E.A. Development of An Individualized Risk Prediction Model for COVID-19 Using Electronic Health Record Data. Front. Big Data 2021, 4, 675882. [Google Scholar] [CrossRef]
- Anantharama, N.; Buntine, W.; Nunn, A. A Systematic Approach to Reconciling Data Quality Failures: Investigation Using Spinal Cord Injury Data. ACI Open 2021, 5, e94–e103. [Google Scholar] [CrossRef]
- Navar, A.M. Electronic Health Record Data Quality Issues Are Not Remedied by Increasing Granularity of Diagnosis Codes. JAMA Cardiol. 2019, 4, 465. [Google Scholar] [CrossRef] [PubMed]
- Cerner. Available online: https://www.cerner.com/about (accessed on 1 September 2021).
- King Saud University Medical City. Available online: https://medicalcity.ksu.edu.sa/en/page/about-ksumc (accessed on 1 September 2021).
- Weiskopf, N.G.; Weng, C. Methods and dimensions of electronic health record data quality assessment: Enabling reuse for clinical research. J. Am. Med. Inform. Assoc. 2013, 20, 144–151. [Google Scholar] [CrossRef] [Green Version]
- Simundic, A.M. Measures of Diagnostic Accuracy: Basic Definitions. Electron. J. Int. Fed. Clin. Chem. Lab. Med. 2009, 19, 203–211. [Google Scholar]
- Microsoft Excel. Available online: https://www.microsoft.com/en-us/microsoft-365/excel (accessed on 1 September 2021).
- R Core Team. R: A Language and Environment for Statistical Computing; R Foundation for Statistical Computing: Vienna, Austria, 2013. [Google Scholar]
- Alwhaibi, M.; Balkhi, B.; Alshammari, T.M.; AlQahtani, N.; Mahmoud, M.A.; Almetwazi, M.; Ata, S.; Basyoni, M.; Alhawassi, T. Measuring the quality and completeness of medication-related information derived from hospital electronic health records database. Saudi. Pharm. J. 2019, 27, 502–506. [Google Scholar] [CrossRef]
- AlJishi, J.M.; Alhajjaj, A.H.; Alkhabbaz, F.L.; AlAbduljabar, T.H.; Alsaif, A.; Alsaif, H.; Alomran, K.S.; Aljanobi, G.A.; Alghawi, Z.; Alsaif, M.; et al. Clinical characteristics of asymptomatic and symptomatic COVID-19 patients in the Eastern Province of Saudi Arabia. J. Infect. Public Health 2021, 14, 6–11. [Google Scholar] [CrossRef] [PubMed]
- Jiang, F.; Deng, L.; Zhang, L.; Cai, Y.; Cheung, C.W.; Xia, Z. Review of the Clinical Characteristics of Coronavirus Disease 2019 (COVID-19). J. Gen. Int. Med. 2020, 35, 1545–1549. [Google Scholar] [CrossRef] [PubMed] [Green Version]
- Alzoubi, H.; Alzubi, R.; Ramzan, N.; West, D.; Al-Hadhrami, T.; Alazab, M. A Review of Automatic Phenotyping Approaches using Electronic Health Records. Electronics 2019, 8, 1235. [Google Scholar] [CrossRef] [Green Version]
- Maria, S.S.; Nair, A.A.; Rohit, R. Data Mining in Healthcare Records: A Review Based on the Kind of Knowledge. In Proceedings of the International Conference on Industrial Engineering and Operations Management, Bangkok, Thailand, 5–7 March 2019. [Google Scholar]
- Juhn, Y.; Liu, H. Artificial intelligence approaches using natural language processing to advance EHR-based clinical research. J. Allergy Clin. Immunol. 2020, 145, 463–469. [Google Scholar] [CrossRef] [PubMed] [Green Version]
- Silverman, G.M.; Sahoo, H.S.; Ingraham, N.E.; Lupei, M.; Puskarich, M.A.; Usher, M.; Dries, J.; Finzel, R.L.; Murray, E.; Sartori, J. NLP Methods for Extraction of Symptoms from Unstructured Data for Use in Prognostic COVID-19 Analytic Models. J. Artif. Intell. Res. 2021, 72, 429–474. [Google Scholar] [CrossRef]
- Carriere, J.; Shafi, H.; Brehon, K.; Pohar Manhas, K.; Churchill, K.; Ho, C.; Tavakoli, M. Case Report: Utilizing AI and NLP to Assist with Healthcare and Rehabilitation During the COVID-19 Pandemic. Front. Artif. Intell. 2021, 4, 613637. [Google Scholar] [CrossRef] [PubMed]
- Satterfield, B.A.; Dikilitas, O.; Kullo, I.J. Leveraging the Electronic Health Record to Address the COVID-19 Pandemic. Mayo Clin. Proc. 2021, 96, 1592–1608. [Google Scholar] [CrossRef] [PubMed]
- Essay, P.; Mosier, J.; Subbian, V. Phenotyping COVID-19 Patients by Ventilation Therapy: Data Quality Challenges and Cohort Characterization. Stud. Health Technol. Inform. 2021, 281, 198–202. [Google Scholar] [CrossRef]
- Chen, J.; Li, K.; Zhang, Z.; Li, K.; Yu, P.S. A Survey on Applications of Artificial Intelligence in Fighting Against COVID-19. ACM Comput. Surv. 2021, 54, 1–32. [Google Scholar] [CrossRef]
- Electronic Health Data Quality and Population Health Management Algorithms. Popul. Health Manag. 2021, 1–3. [CrossRef]
- Saudi Data & Artificial Intelligence Authority (SADIA). Available online: https://sdaia.gov.sa/?Lang=en&page=SectionAbout# (accessed on 1 September 2021).
- Deeds, S.A.; Hagan, S.L.; Geyer, J.R.; Vanderwarker, C.; Grandjean, M.W.; Reddy, A.; Nelson, K.M. Leveraging an electronic health record note template to standardize screening and testing for COVID-19. Healthcare 2020, 8, 100454. [Google Scholar] [CrossRef]
- Reeves, J.J.; Hollandsworth, H.M.; Torriani, F.J.; Taplitz, R.; Abeles, S.; Tai-Seale, M.; Millen, M.; Clay, B.J.; Longhurst, C.A. Rapid response to COVID-19: Health informatics support for outbreak management in an academic health system. J. Am. Med. Inform. Assoc. 2020, 27, 853–859. [Google Scholar] [CrossRef] [Green Version]


| ICD-10 Codes | Code Description |
|---|---|
| U07.1 | COVID-19, virus identified. The code is assigned to a disease diagnosis of COVID-19 confirmed by laboratory testing. |
| U07.2 | COVID-19, virus not identified. The code is assigned to a clinical or epidemiological diagnosis of COVID-19 where laboratory confirmation is inconclusive or not available. |
| B34.2 | Coronavirus infection, unspecified site. |
| B97.2 | Coronavirus as the cause of 0020 diseases classified to other chapters. |
| Characteristic | Frequency | % |
|---|---|---|
| Gender | ||
| Female | 139 | 42.38% |
| Male | 189 | 57.62% |
| Age (Years) | ||
| Less than or equal to 10 | 15 | 4.57% |
| 11–20 | 18 | 5.49% |
| 21–30 | 39 | 11.89% |
| 31–40 | 69 | 21.04% |
| 41–50 | 38 | 11.59% |
| 51–60 | 57 | 17.38% |
| 61–70 | 50 | 15.24% |
| 71+ | 42 | 12.80% |
| Nationality | ||
| Saudi | 233 | 71.04% |
| Non-Saudi | 95 | 28.96% |
| Medical departments (by encounters) | ||
| Medical (General, Cardiology, Endocrinology, Gastroenterology, Hematology, Nephrology, Neurology, Oncology, Pulmonary, Rheumatology) | 258 | 71.47% |
| Gynecology-Obstetrics | 46 | 12.74% |
| Surgery (General, Neurosurgery, Orthopedics, Plastic, Peripheral Vascular, Pediatric, Urology) | 24 | 6.65% |
| Emergency Medicine | 16 | 4.43% |
| Pediatric (General, Hematology, Infectious Disease, Neonatology, Nephrology) | 15 | 4.16% |
| Ophthalmology | 1 | 0.28% |
| Ear, nose, and throat (ENT) | 1 | 0.28% |
| Item | Confirmed Case (% of 328) | Probable Case (% of 328) | Suspected Case (% of 328) | No Sufficient Evidence (% of 328) |
|---|---|---|---|---|
| COVID-19 ICD-10 codes | ||||
| U07.1 | 1 (0.30%) | 2 (0.61%) | 2 (0.61%) | 68 (20.73%) |
| U07.2 | 1 (0.30%) | 0 (0%) | 0 (0%) | 0 (0%) |
| B34.2 | 0 (0%) | 0 (0%) | 0 (0%) | 1 (0.30%) |
| B97.2 | 164 (50%) | 7 (2.13%) | 4 (1.22%) | 18 (5.49%) |
| U07.1 and B97.2 | 52 (15.85%) | 1 (0.30%) | 3 (0.91%) | 4 (1.22%) |
| COVID-19 Laboratory test | ||||
| Positive | 194 (59.15%) | 0 (0%) | 0 (0%) | 0 (0%) |
| Positive (results obtained from infection and control report within patients’ records) | 24 (7.32%) | 0 (0%) | 0 (0%) | 0 (0%) |
| Negative | 0 (0%) | 7 (2.13%) | 2 (0.61%) | 83 (25.30%) |
| No laboratory test found | 0 (0%) | 3 (0.91%) | 7 (2.13%) | 8 (2.44%) |
| History of Contact with a probable or confirmed case | ||||
| Yes | 90 (27.44%) | 8 (2.44%) | 2 (0.61%) | 17 (5.18%) |
| No | 128 (39.02%) | 2 (0.61%) | 7 (2.13%) | 74 (22.56%) |
| Epidemiological criteria | ||||
| (1) Residing or working in a setting with high risk of transmission of the virus | 14 (4.27%) | 0 (0%) | 7 (2.13%) | 5 (1.52%) |
| (2) Working in a health setting, including within health facilities and within households. | 4 (1.22%) | 1 (0.30%) | 2 (0.61%) | 2 (0.61%) |
| (3) Residing in or travel to an area with community transmission anytime (e.g., China, Iran) | 3 (0.91%) | 0 (0%) | 0 (0%) | 3 (0.91%) |
| (1) and (2) | 0 (0%) | 0 (0%) | 0 (0%) | 1 (0.30%) |
| None (No information is documented about epidemiological criteria) | 197 (60.06%) | 9 (2.74%) | 0 (0%) | 80 (24.39%) |
| Chest Imaging | ||||
| Evidence of COVID-19 | 103 (31.40%) | 3 (0.91%) | 0 (0%) | 8 (2.44%) |
| No evidence of COVID-19 | 66 (20.12%) | 5 (1.52%) | 8 (2.44%) | 31 (9.45%) |
| No chest imaging was found | 49 (14.94%) | 2 (0.61%) | 1 (0.30%) | 52 (15.85%) |
| Total | 218 (66.46%) | 10 (3.05%) | 9 (2.74%) | 91 (27.74%) |
| Item | Number of Records (% of 328) | Sensitivity | Specificity | Accuracy |
|---|---|---|---|---|
| COVID-19 ICD-10 codes | ||||
| U07.1 | 133 (40.55%) | 24.31% | 27.27% | 25.30% |
| U07.2 | 1 (0.30%) | 0.46% | 100% | 33.84% |
| B34.2 | 1 (0.30%) | 0% | 99.09% | 33.23% |
| B97.2 | 253 (77.13%) | 99.08% | 66.36% | 85.37% |
| U07.1 and B97.2 | 60 (18.29%) | 23.85% | 92.73% | 46.95% |
| COVID-19 Laboratory test | ||||
| Positive | 194 (59.15%) | 89% | 100% | 92.68% |
Publisher’s Note: MDPI stays neutral with regard to jurisdictional claims in published maps and institutional affiliations. |
© 2021 by the authors. Licensee MDPI, Basel, Switzerland. This article is an open access article distributed under the terms and conditions of the Creative Commons Attribution (CC BY) license (https://creativecommons.org/licenses/by/4.0/).
Share and Cite
Binkheder, S.; Asiri, M.A.; Altowayan, K.W.; Alshehri, T.M.; Alzarie, M.F.; Aldekhyyel, R.N.; Almaghlouth, I.A.; Almulhem, J.A. Real-World Evidence of COVID-19 Patients’ Data Quality in the Electronic Health Records. Healthcare 2021, 9, 1648. https://doi.org/10.3390/healthcare9121648
Binkheder S, Asiri MA, Altowayan KW, Alshehri TM, Alzarie MF, Aldekhyyel RN, Almaghlouth IA, Almulhem JA. Real-World Evidence of COVID-19 Patients’ Data Quality in the Electronic Health Records. Healthcare. 2021; 9(12):1648. https://doi.org/10.3390/healthcare9121648
Chicago/Turabian StyleBinkheder, Samar, Mohammed Ahmed Asiri, Khaled Waleed Altowayan, Turki Mohammed Alshehri, Mashhour Faleh Alzarie, Raniah N. Aldekhyyel, Ibrahim A. Almaghlouth, and Jwaher A. Almulhem. 2021. "Real-World Evidence of COVID-19 Patients’ Data Quality in the Electronic Health Records" Healthcare 9, no. 12: 1648. https://doi.org/10.3390/healthcare9121648