
I. Introduction
This paper examines the asymmetric causal relationship from COVID-19 to fossil energy prices. The emergence of COVID-19 has challenged the global economic and financial systems (Iyke, 2020b; Phan & Narayan, 2020; Sharma & Sha, 2020). On March 11, the World Health Organization (WHO) announced that the COVID-19 pandemic had become a “global pandemic” and cumulative confirmed cases had reached 42 million in more than 200 nations in October 2020. This pandemic brought more serious repercussions than SARS in 2003, MERS in 2012[1] and Ebola in 2014. The crude oil market suffered due to high uncertainties because of the COVID-19 pandemic and political instabilities during this period (Ali et al., 2020; Devpura & Narayan, 2020; Narayan, 2020).
COVID-19 is also a major cause of the historic demand shock for the global gas market, which is expected to fall 4% year-on-year in the first half of 2020 and represents the largest annual drop on record (IEA (International Energy Agency), 2020). Meanwhile, natural gas spot prices plummeted to their lowest levels in at least a decade across all major gas-consuming regions. As an important coal exporter, Indonesian coal exports dropped below average in February and March 2020 and is expected to decline further in April, which reached the lowest level since October 2010. The main message is that the pandemic has significantly impacted the energy market.
Previous studies have carried out considerable work on the effects of the COVID-19 pandemic on the energy industry. One group of studies focuses on COVID-19 and energy firms. Iyke (2020a), for instance, finds that the US oil and gas firms have heterogenous reactions to the COVID-19 pandemic. Polemis & Soursou (2020) indicate that the pandemic influenced returns of the majority of Greek energy listed firms. Fu & Shen (2020) point out that COVID-19 has had a significant negative effect on the performance of energy companies.
The second group of studies analyzes how the COVID-19 pandemic is related to the energy market. Ertuğrul et al. (2020), for instance, find that volatility dynamics of the Turkish diesel market starts rising with the announcement of the first COVID-19 case and peaks at the end of May 2020. Salisu & Adediran (2020) find that the new uncertainty index includes infectious diseases and is a good predictor of energy market volatility in both in-sample and out-of-sample tests. Devpura & Narayan (2020) show that COVID-19 cases and deaths led to an increase in daily oil price volatility by between 8% and 22%. Gil-Alana & Monge (2020) demonstrate that oil price is mean reverting. Narayan (2020) shows that there is a threshold effect of COVID-19 infections after which COVID-19 has had a bigger effect on oil prices.
The third group of studies tests the link between energy and financial markets. Prabheesh et al. (2020), for instance, find evidence of a positive co-movement between oil price returns and stock price returns during the COVID-19 period. Huang & Zheng (2020) show that there is a structural change in the relationship between investor sentiment and crude oil futures price due to COVID-19. Liu et al. (2020) show that the COVID-19 pandemic cannot exert a negative effect but has a statistically significantly and positive effect on crude oil returns and stock returns.
We add to this energy-COVID-19 literature by focusing on oil, natural gas, and coal prices. We apply a Bootstrap Fourier Granger Causality test in Quantiles (BFGC-Q), and find that COVID-19 cases influence oil and natural gas prices in high quantiles. In other words, only an increase in COVID-19 cases would influence fossil energy market. When compared to previous studies, our contributions can be summarized as follows. First, the existing studies mainly focus on the link between COVID-19 and oil market (Jefferson, 2020; Mensi et al., 2020; Salisu et al., 2020). However, natural gas and coal also play important roles in the global energy consumption and demand structure. Therefore, we take natural gas and coal into consideration in our study to understand the impacts on their pricing due to the pandemic. Second, previous studies just show that COVID-19 influences energy prices (Liu et al., 2020; Prabheesh et al., 2020). However, they ignore the COVID-19 heterogeneity (in terms of cases and deaths) effect on energy price. The empirical results demonstrate that COVID-19 influences oil and gas prices in quantiles [0.6, 0.8] and [0.8, 1].
Following this introduction, the rest of the paper is structured as follows: Section II introduces the research method; Section III shows data and empirical results; and Section IV provides conclusions and policy implications.
II. Methodology
To test the null hypothesis of non-Granger causality using the BFGC-Q approach, we design a two-step procedure. In the first step, to control for smooth breaks of deterministic terms, the Fourier expansions are included in the following Granger causality equation:
Yt=γ0+γ1sin(2πktT)+γ2cos(2πktT)+p+h∑i=1θiYt−i+m∑j=1p+h∑i=1θj,tXj,t−1+εt(1)
where Y is energy price, X is volatility of COVID-19, T is sample size, t is time, and are coefficients, i and j are subscript to count, p is the lag length, h is the maximum integration degree of the variables, and m is the number of covariates. To estimate Equation (1), we select the optimal value of k, say k* and optimal value of lags, say p*. To this end, we do a grid search and for each we select k = k* as optimum frequency when the sum of squared residuals are minimized and then select the optimal value of lags, p*, using the Akaike Information Criteria. We apply the standard restricted F test statistic to test the null hypothesis of By choosing the k* and p*, we estimate Equation (1) by quantile regression rather than the ordinary least squares estimator:
QYt(τ|Z)=γ0(τ)+γ1(τ)sin(2πk∗tT)+γ2(τ)cos(2πk∗tT)+p∗+h∑i=1θi(τ)Yt−i+p∗+h∑i=1θj,i(τ)Xj,t−i+εt(2)
where Z is a matrix of all covariates in the regression model (2). Estimating regression model (2) by quantile regression approach allows for testing the null hypothesis of Granger non-causality from X to Y at different quantiles as follows:
H0:ˆθj,1(τ)=ˆθj,2(τ)=⋯=ˆθj,p∗(τ)=0,∀τ∈(0,1)(3)
The null hypothesis of Granger non-causality is tested by following Wald test:
Wald=[T((ˆθj(τ))′(ˆΩ(τ))−1ˆθj(τ))]τ(1−τ)(4)
where is the vector of estimated coefficients of quantile, is the consistence estimator of variance covariance matrix of the
III. Data and empirical results
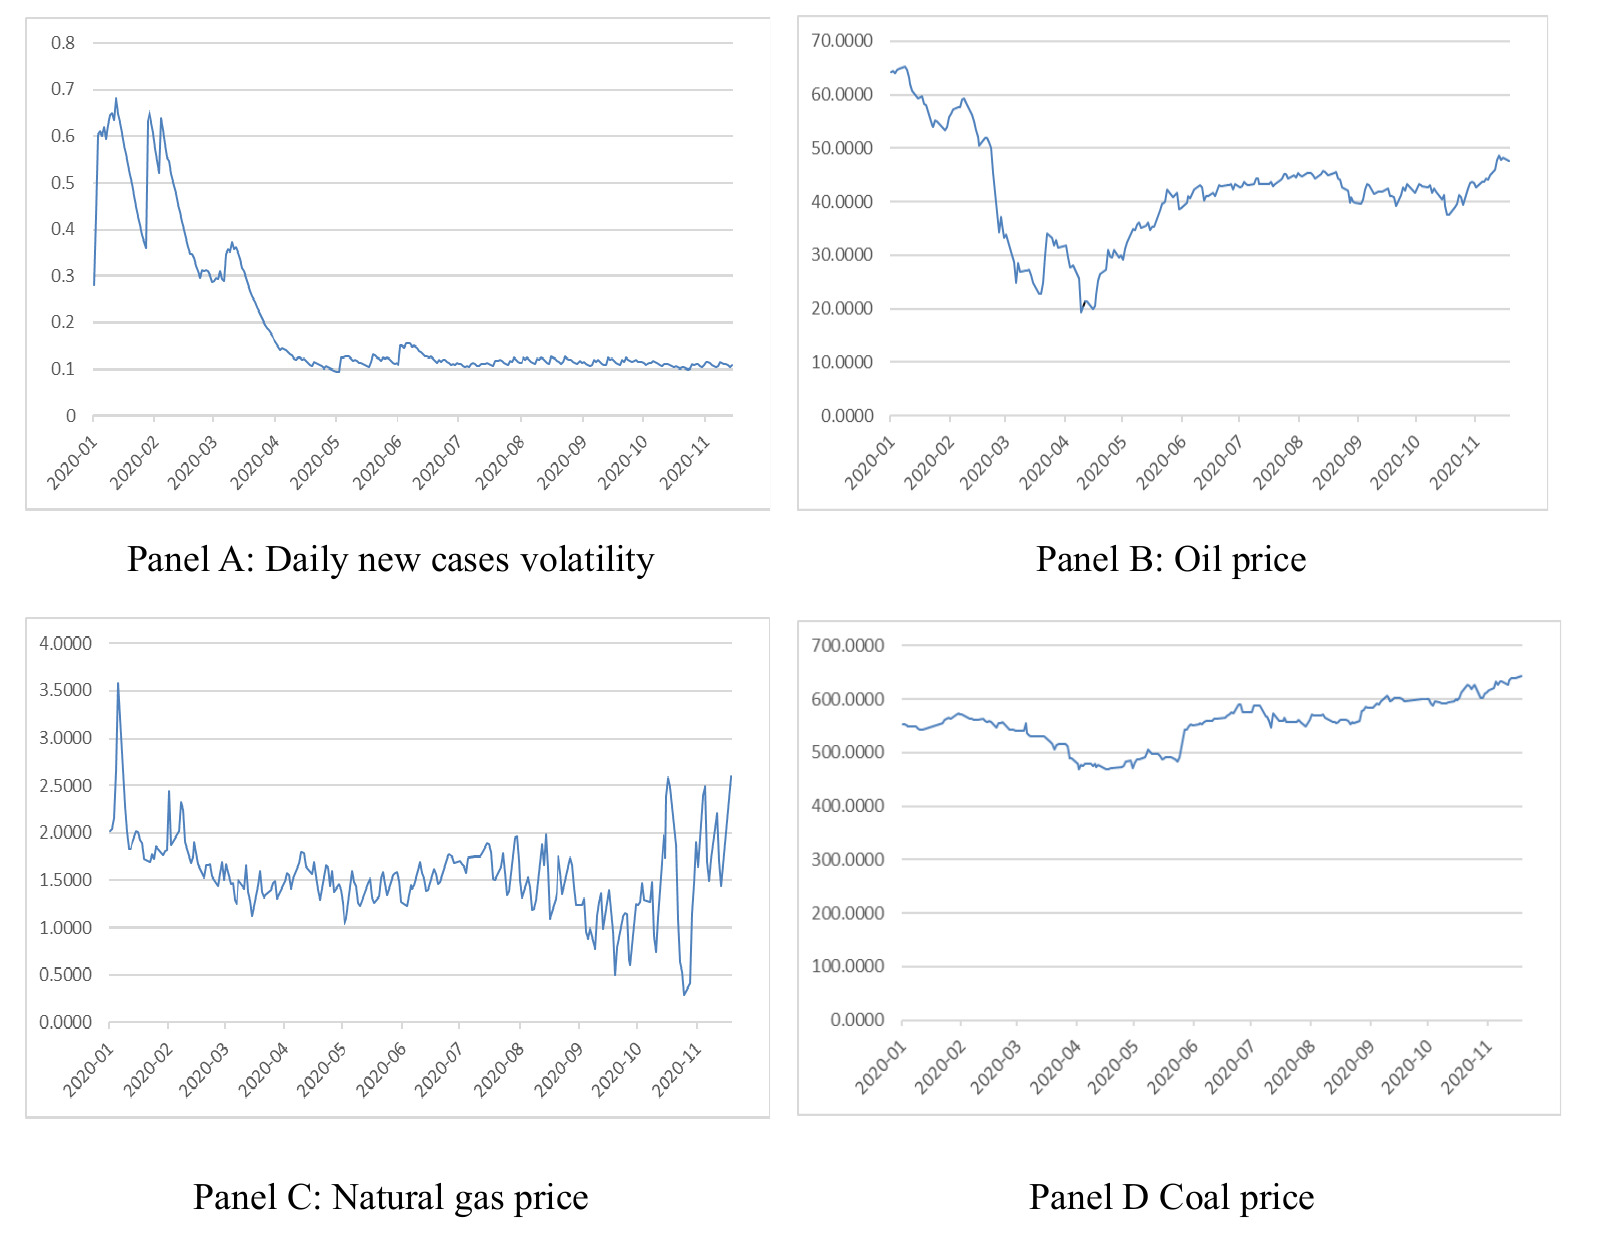
We follow Liu et al. (2020) and adopt the COVID-19 data from the official website of WHO. The sample spans the period January 13, 2020 to November 30, 2020, consisting of 230 daily observations. The starting date corresponds to the date that the Chinese authorities officially reported its COVID-19 cases to the WHO. We further employ the Generalized Autoregressive Conditional Heteroscedasticity (GARCH) model to estimate the volatility of COVID-19 new cases. The prices of oil, natural gas and coal come from the Wind Financial Terminal, which is recognized as the leading firm in providing accurate and real-time data in China. Figure 1 plots the data. Panel A has the daily global new confirmed cases. The data show fluctuating upward trend. Panel B shows oil price volatility: a significant drop from US$68 to US$20 can be observed. Panel C displays natural gas price and shows a downward trend. Panel D describes coal price: the fluctuation amplitude is obviously less than oil and natural gas. With respect to the results of the Jarque-Bera test in Table 1 (Panel A), the variables except OIL are significantly non-normally distributed. COVID-19 and OIL show a positive skewness. COVID-19 and GAS follow leptokurtic distribution, meaning that it contains heavy-tailed or profusion of outliers, and others follow platykurtic distribution. The standard unit root tests were conducted and all variables were found to be stationary. The results are not reported here but are available upon request.
Table 1 (Panel B) points out that the asymmetric link between COVID-19 and energy price exists in oil and natural gas market in quantiles [0.6, 0.8] and [0.8, 1]. This means the high volatility of COVID-19 cases influences oil and natural gas prices. According to Figure 1, we notice that high volatility appears in January, February, and March of 2020, which corresponds to the beginning of the COVID-19 outbreak. During this period, COVID-19 was declared a global pandemic. However, we find that there is no causal link between COVID-19 and coal market. Coal has not been the major fossil energy in the world, except China and other developing countries, and therefore it is less affected by global energy demand changes. Meanwhile, it does not have an active future market and its trading volume is less than oil and natural gas. Figure 1 (Panel B) points out that the coal price presents mild volatility pattern when compared to the other two markets.
In summary, relying on BFGC-Q test, we find that the hypothesis of no causal link is rejected in oil and gas markets in quantiles [0.6, 0.8] and [0.8, 1]. That means COVID-19 influences oil and gas prices when COVID-19 is highly volatile. It is also noticed that there is no significant causal link in the coal market.
IV. Concluding remarks
This paper investigates the link between COVID-19 and fossil energy prices. The results indicate that the asymmetric link exists in quantiles [0.6, 0.8] and [0.8, 1], implying that only high volatility of COVID-19 cases influences oil and natural gas prices. However, there is no significant causal link in the coal market due largely to global economies less reliance on it.
SARS and MERS are abbreviations for the Severe Acute Respiratory Syndrome and the Middle East Respiratory Syndrome, respectively.