
Empirical Study on Classifiers for Earlier Prediction of COVID-19 Infection Cure and Death Rate in the Indian States


 , and
, and 
Abstract
:1. Introduction
2. Literature Review
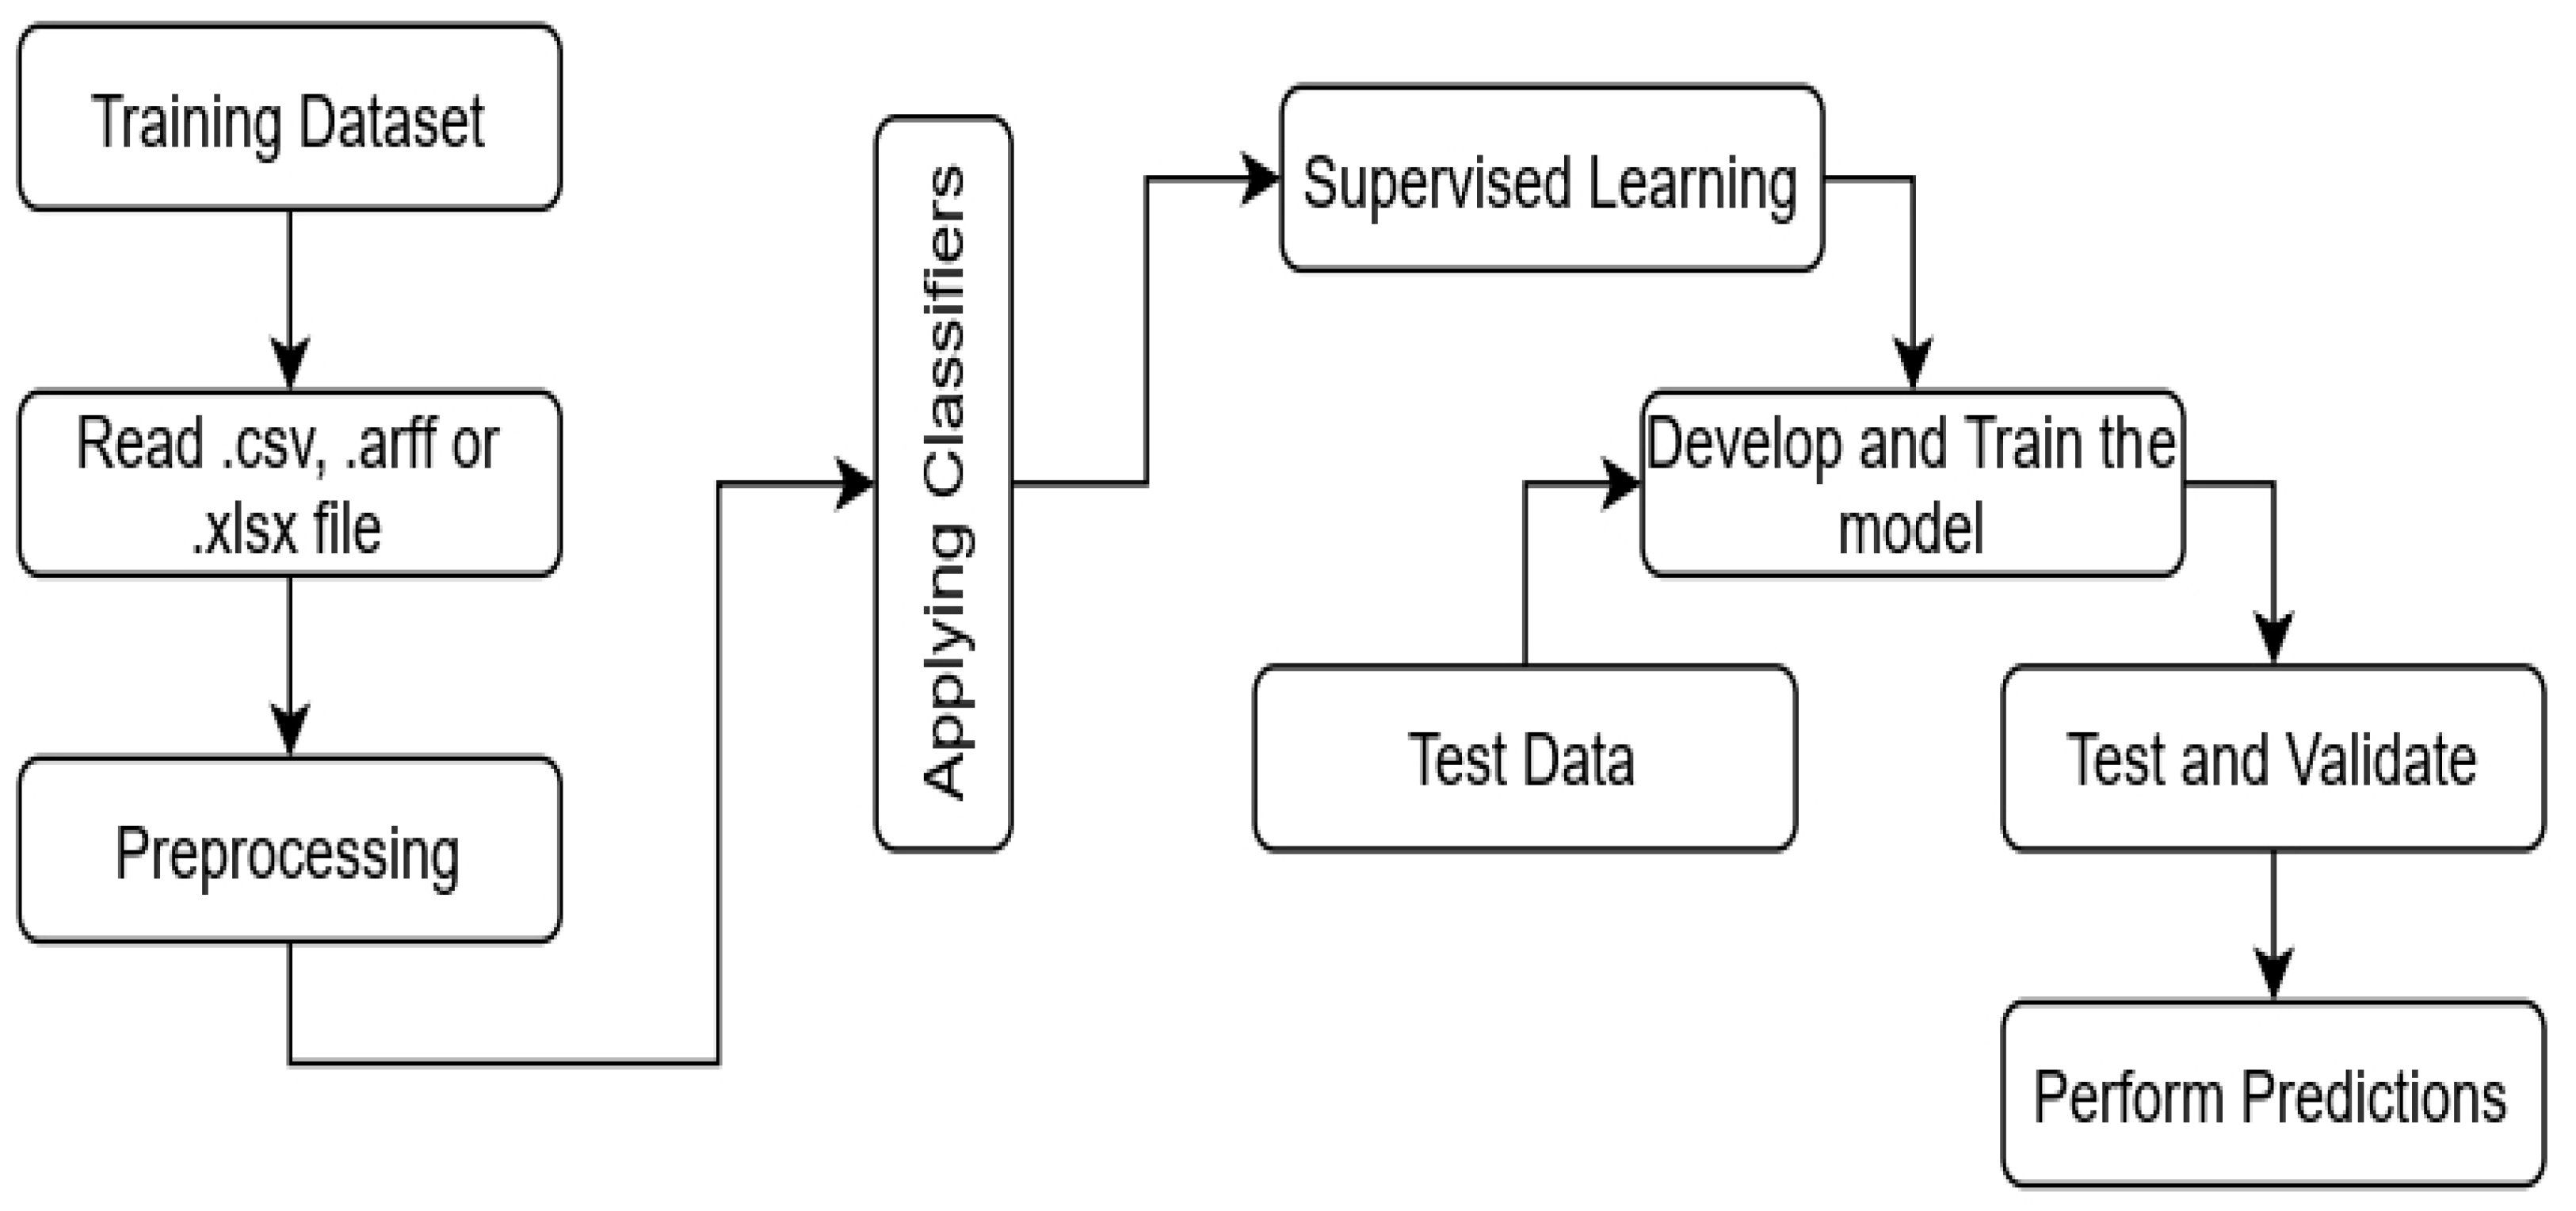
3. Machine Learning for Predictive Analytics
3.1. Ordinal Decision Tree
3.2. Gaussian Naïve Bayes
3.3. Support Vector Machines
3.4. AdaBoost Algorithm
3.5. Random Forest and Bagging
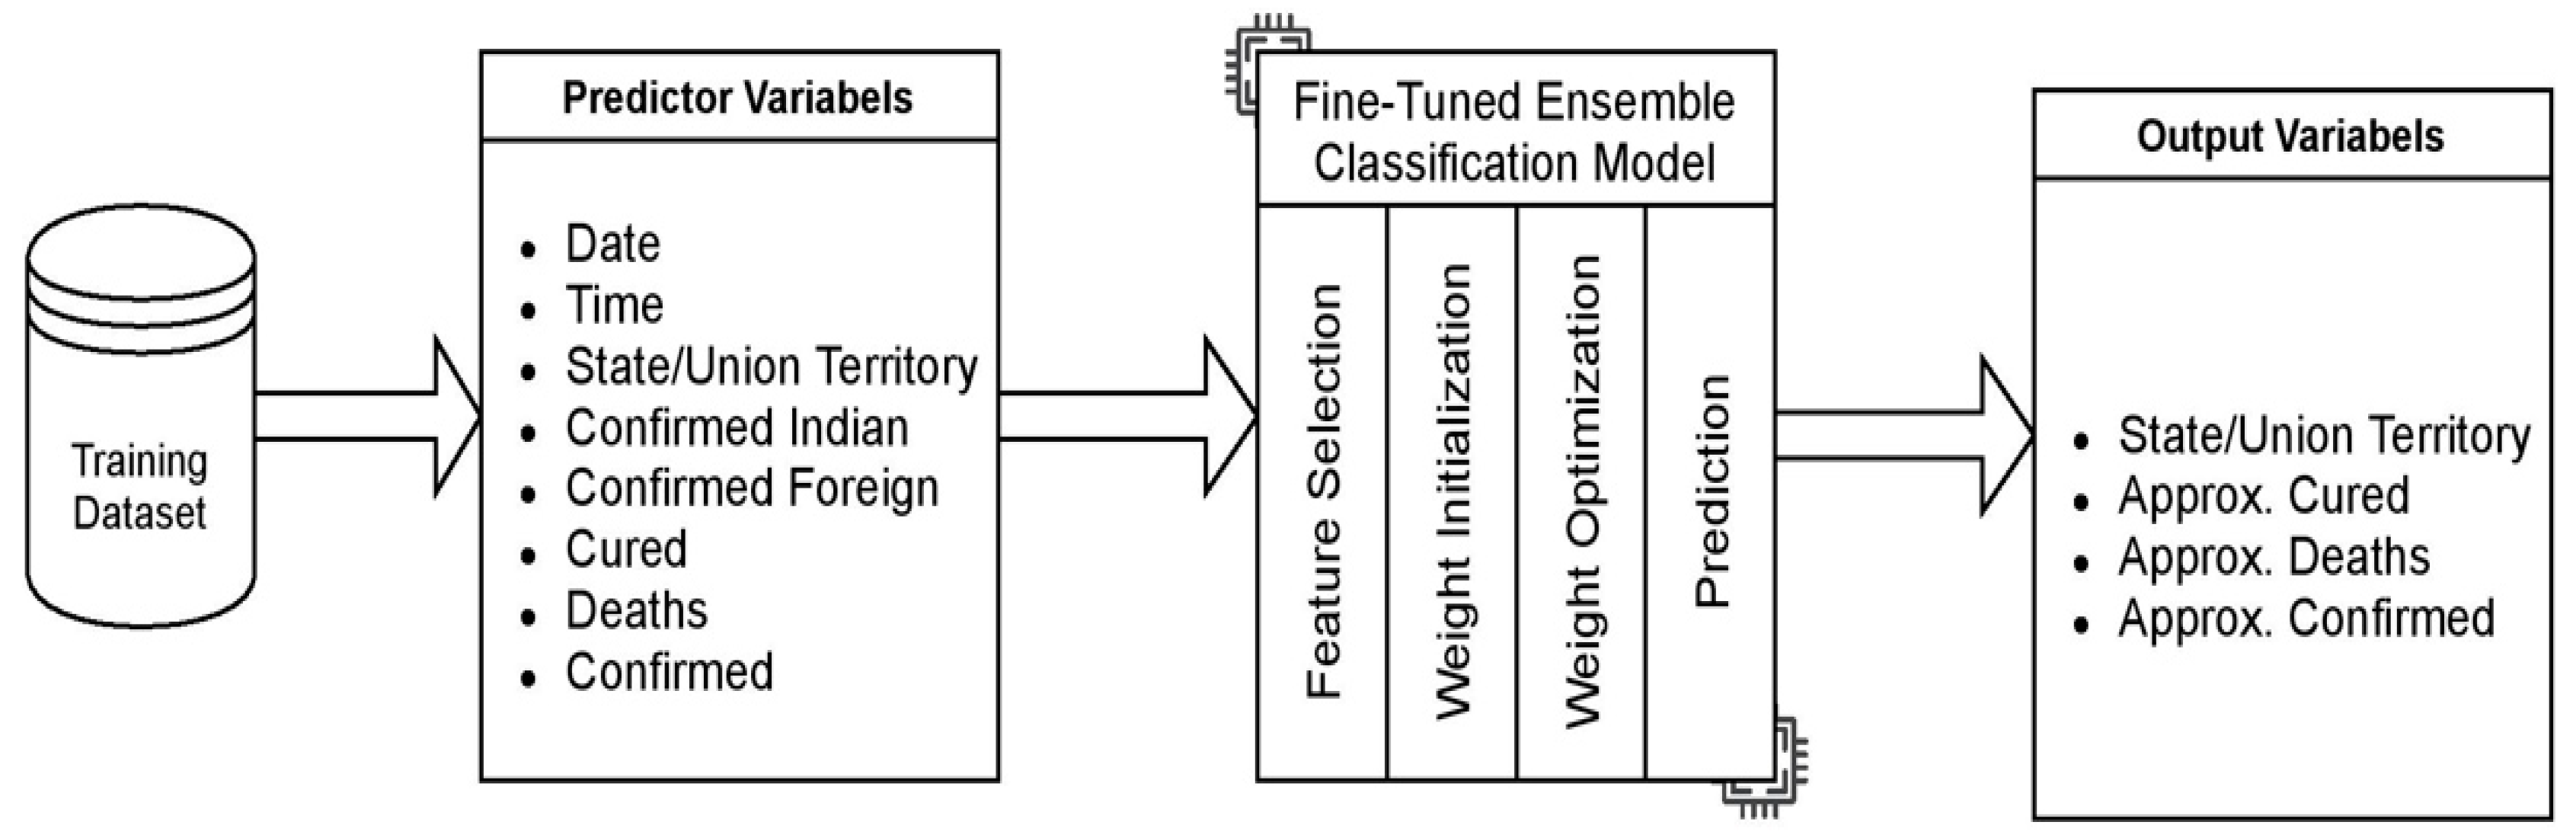
4. Proposed Fine-Tuned Ensemble Classifiers
4.1. Preprocessing and Feature Extraction
4.2. Class Incorporation for the Ensemble Model
4.3. Dataset and Implementatiomn Framework
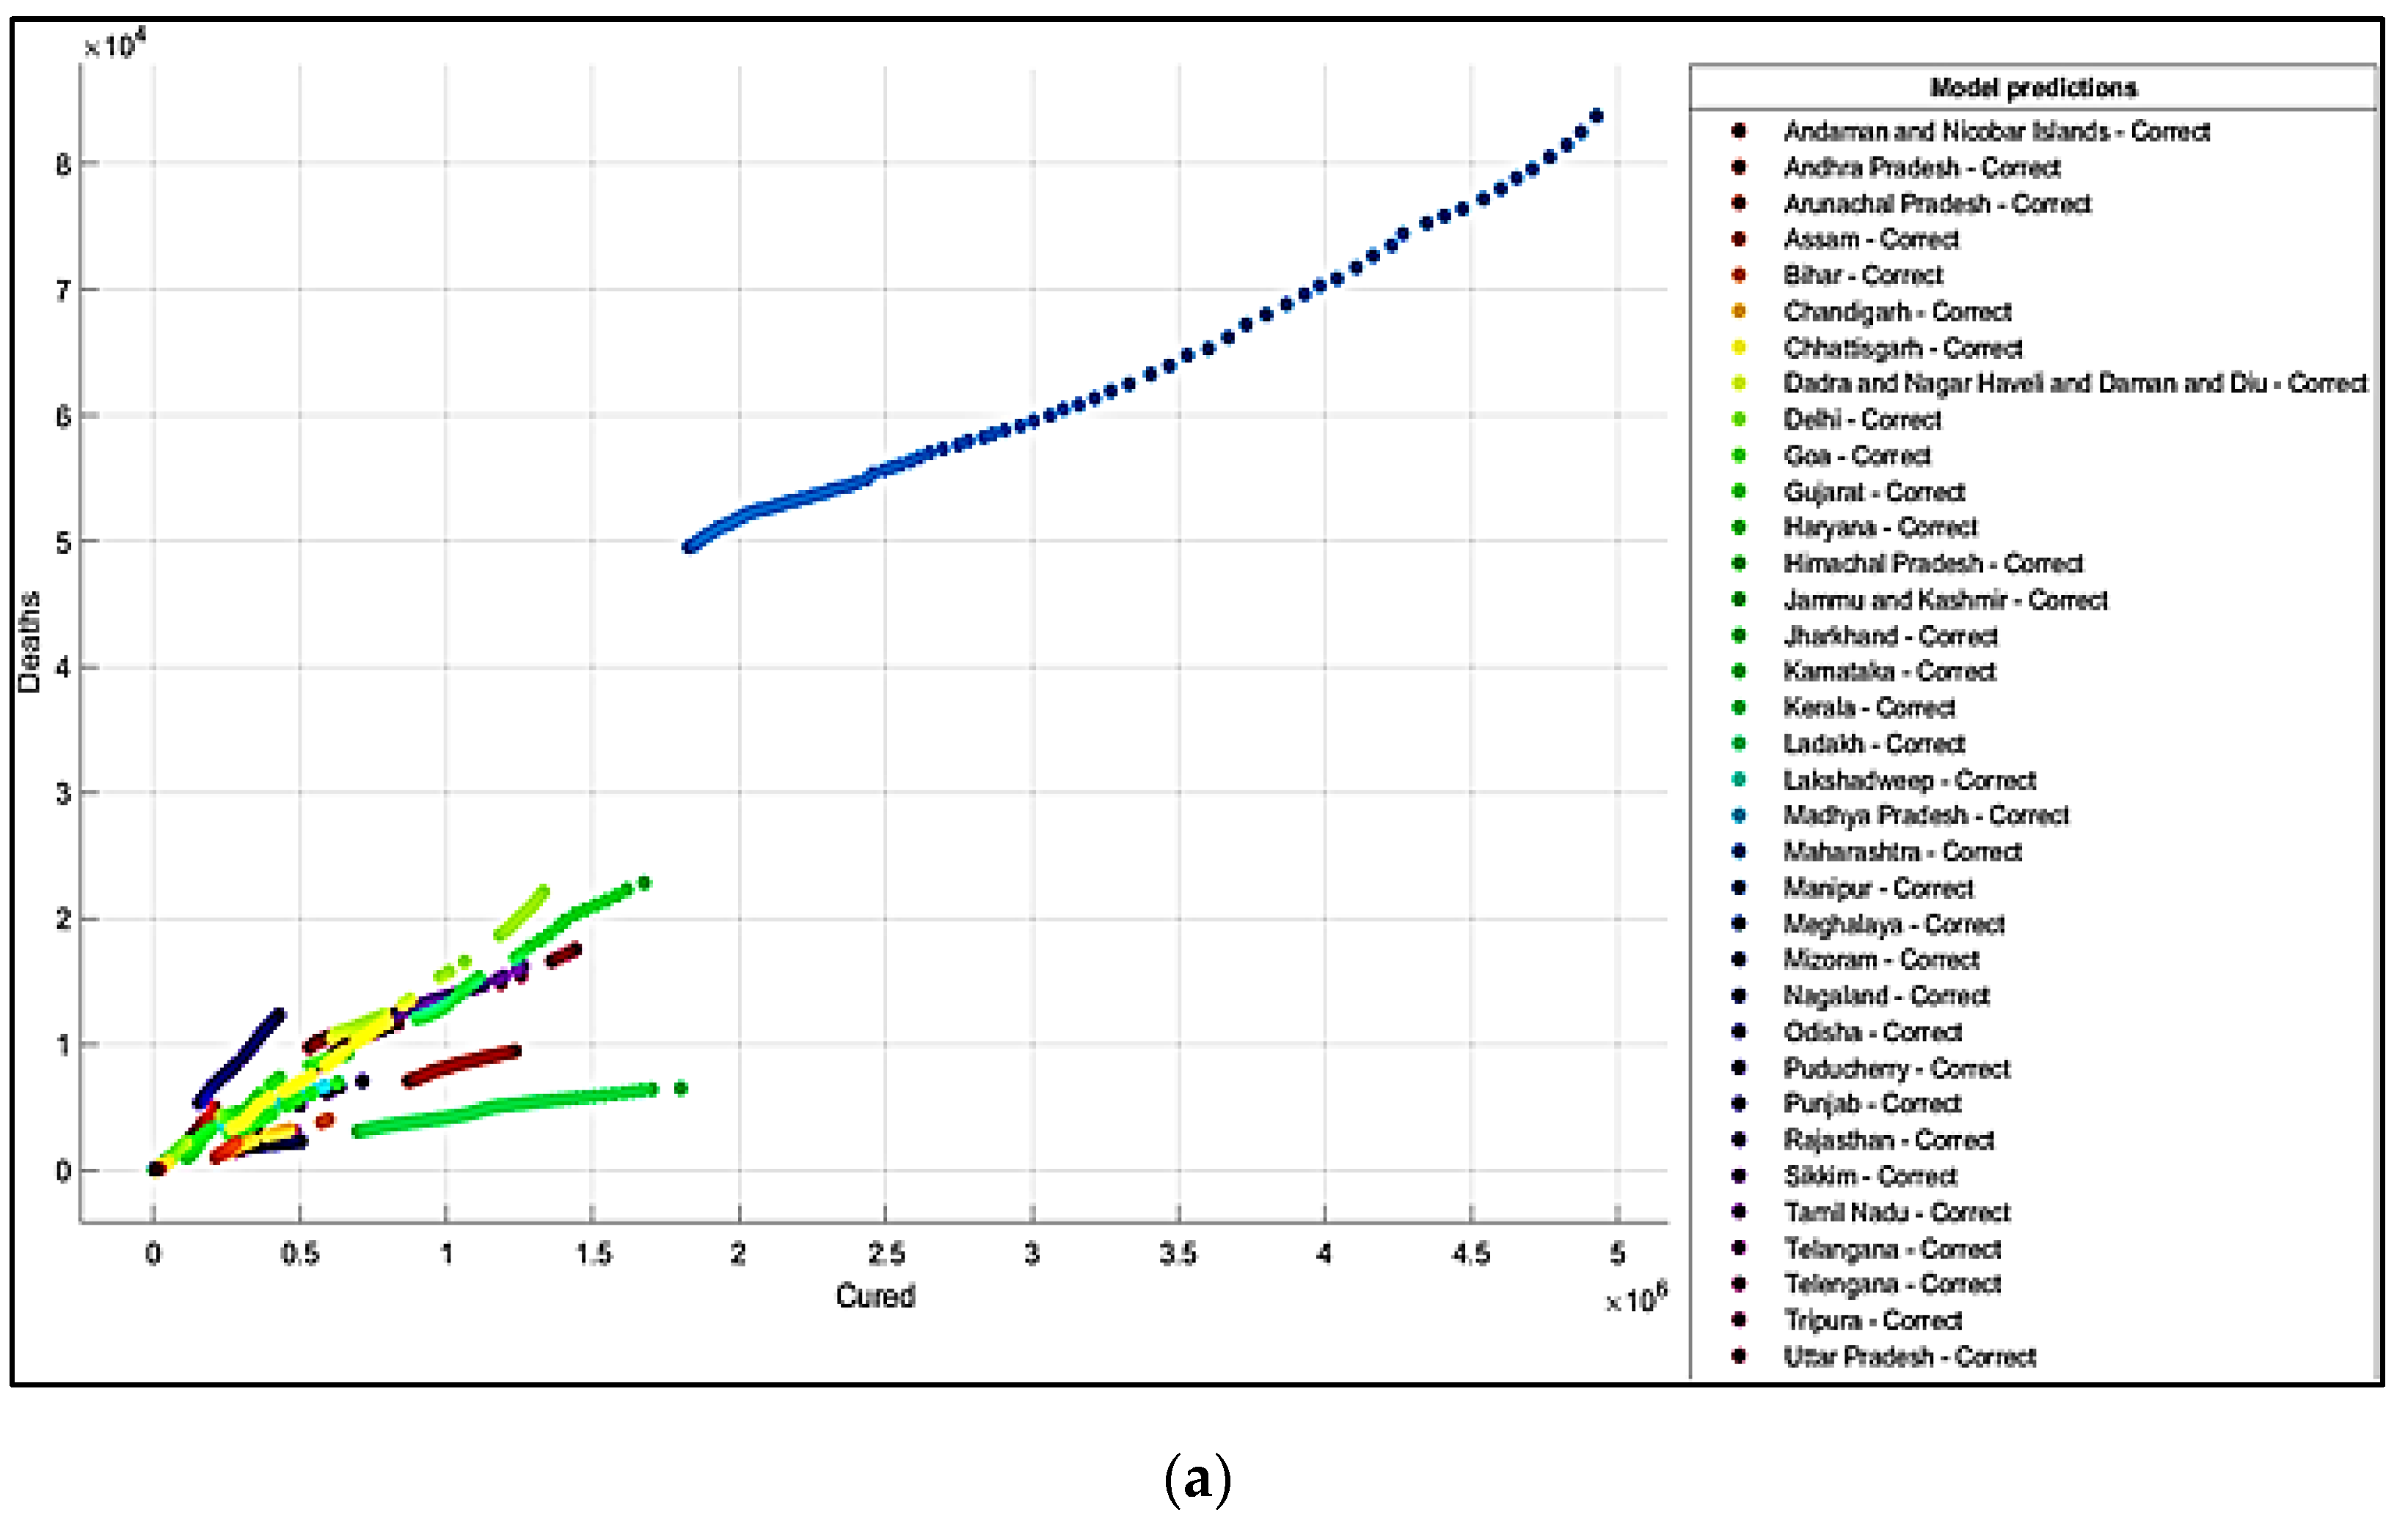
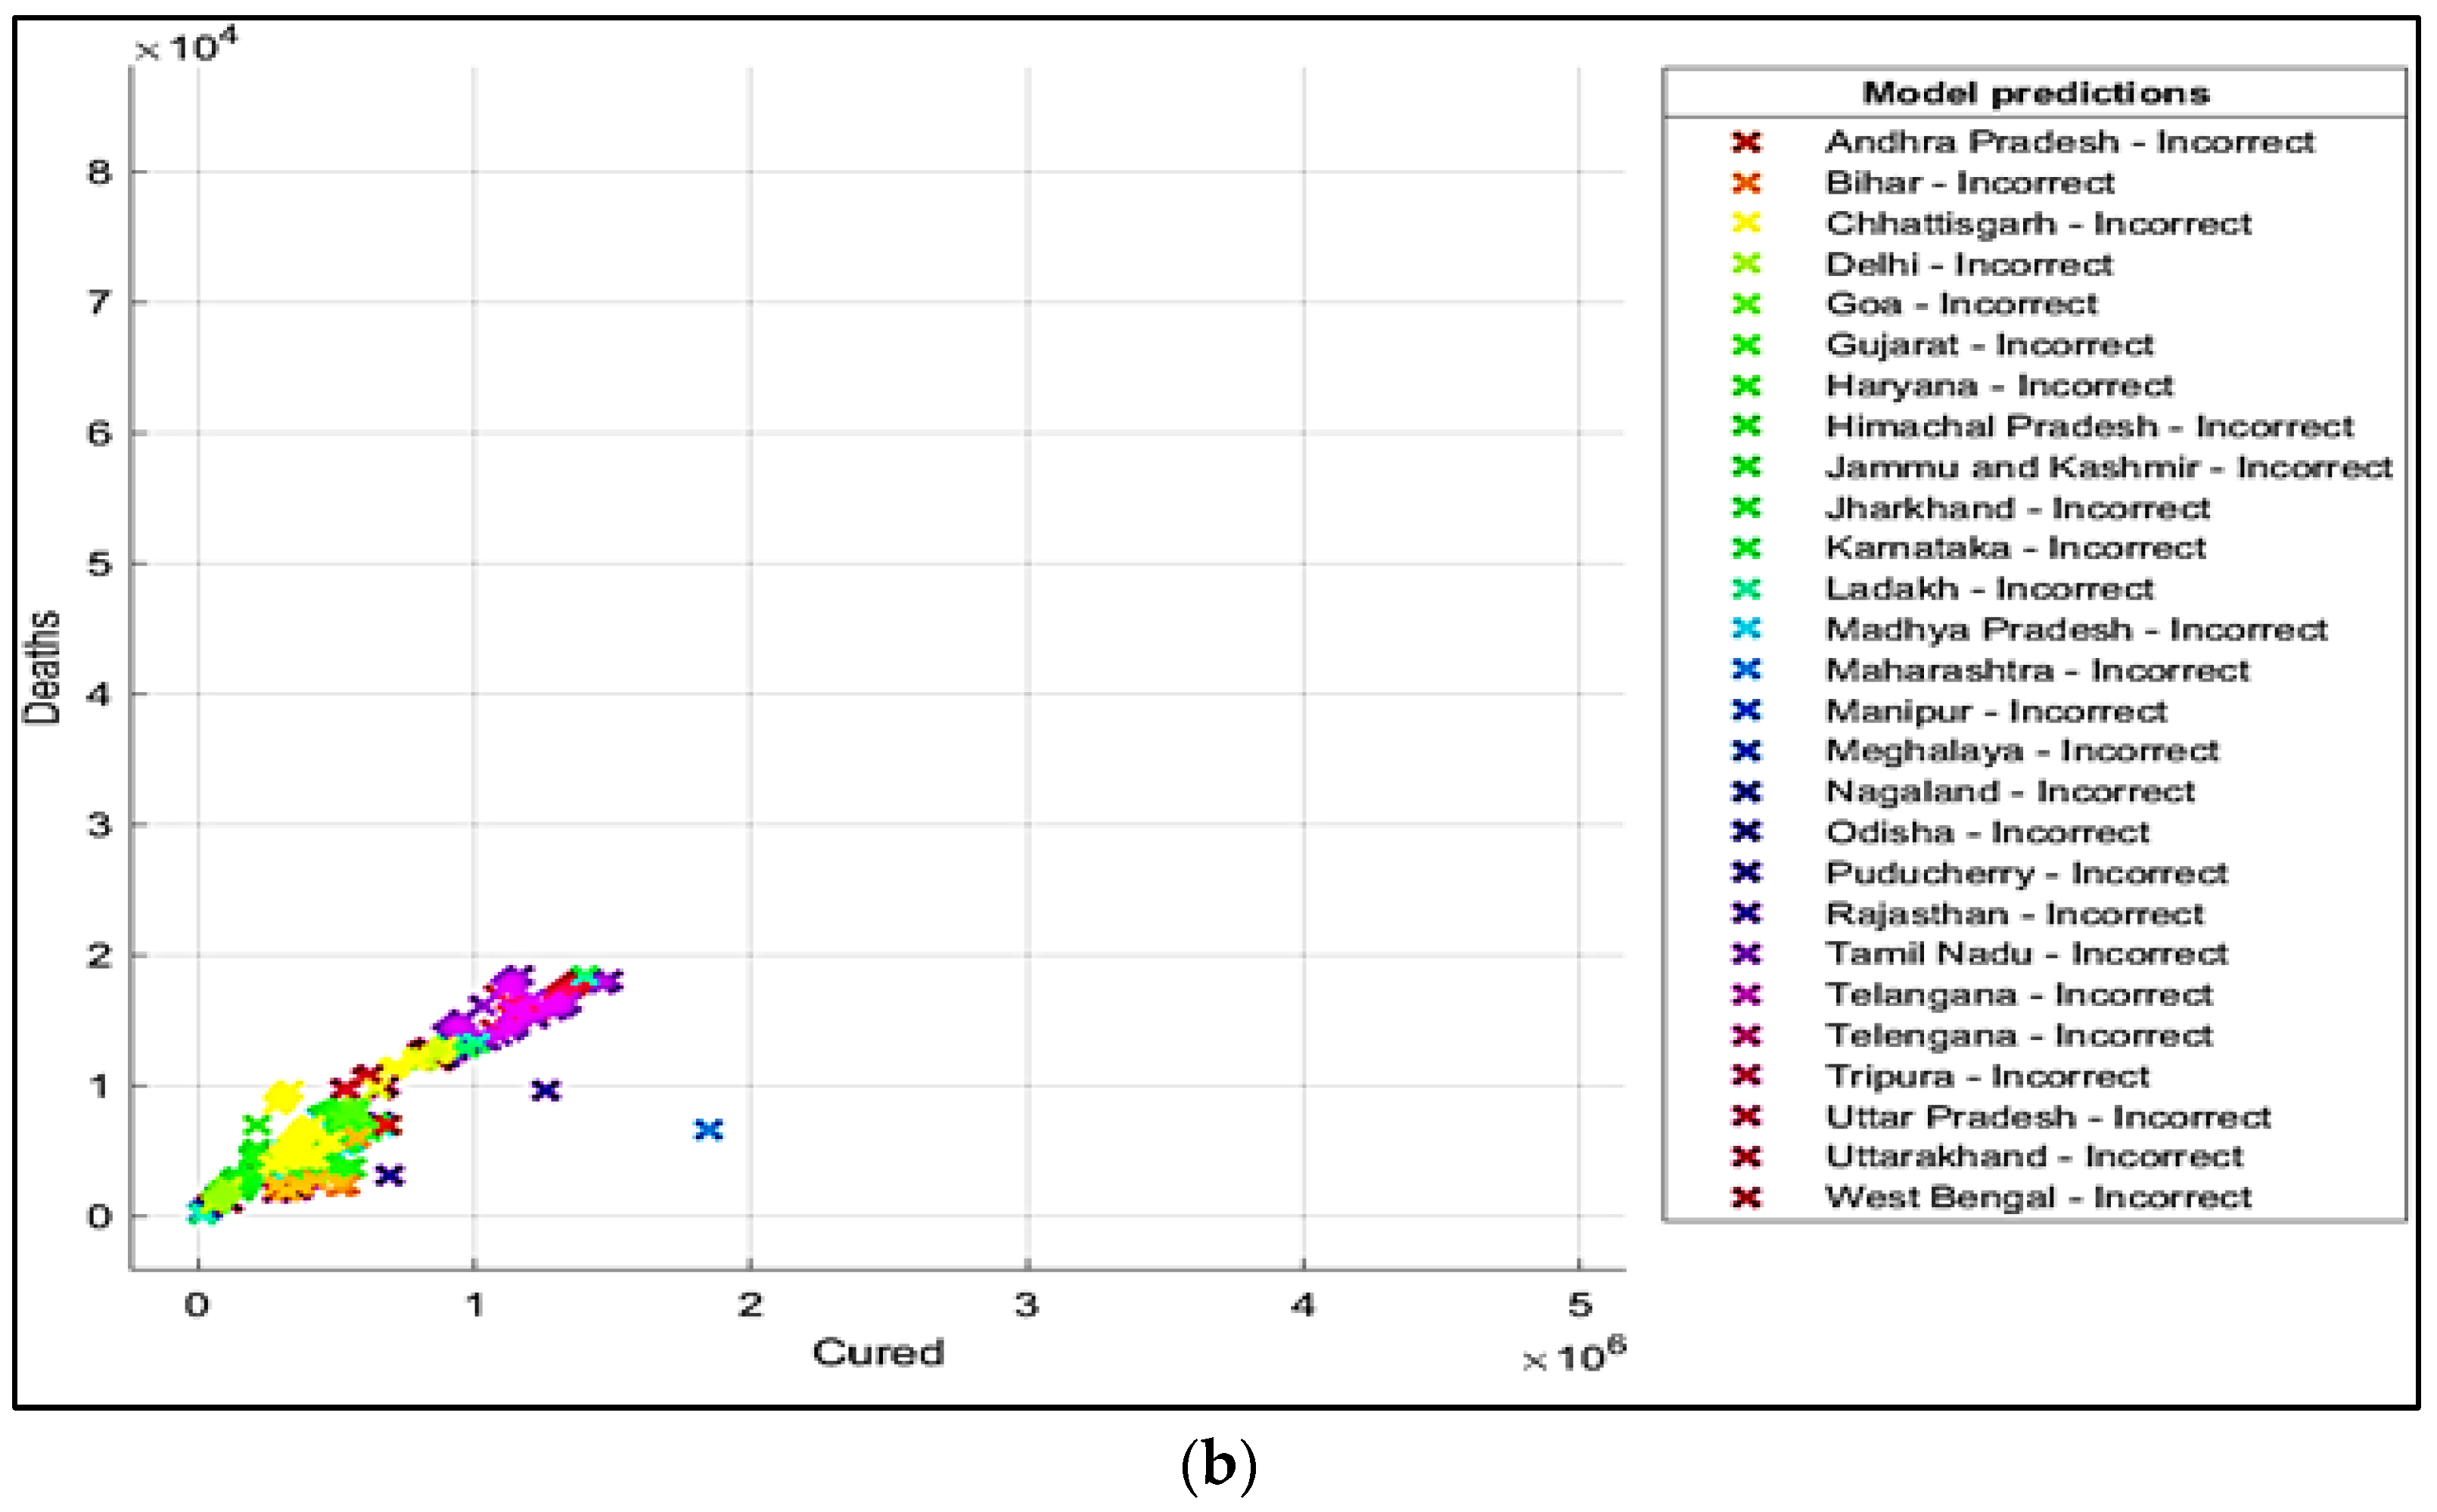
5. Results and Discussions
6. Conclusions
7. Future Scope
Author Contributions
Funding
Data Availability Statement
Conflicts of Interest
Abbreviations
| ANN | Artificial Neural Network |
| AI | Artificial Intelligence |
| AUC | Area under curve |
| CNN | Convolutional Neural Network |
| DM | Data Mining |
| ECG | Electrocardiogram |
| ES | Expert Systems |
| FPR | False Positive Rate |
| FNR | False Negative Rate |
| GIS | Geographic Information Systems |
| GNB | Gaussian Naïve Bayes |
| HDFS | Hadoop Distributed File System |
| KNN | K Nearest Neighbor |
| ML | Machine Learning |
| NCA | Neighborhood Component Analysis |
| NLP | Natural Language Processing |
| NaN | Not a Number |
| NN | Neural Network |
| PCA | Principal Component Analysis |
| RF | Random Forest |
| RNA | Ribonucleic Acid |
| RT-PCR | Reverse transcription-polymerase chain reaction |
| ROC | Receiver Operating Characteristics |
| SARS | Severe acute respiratory syndrome |
| SVM | Support Vector Machines |
| TPR | True Positive Rate |
| WHO | World Health Organization |
| WEKA | Waikato Environment for Knowledge Analysis |
References
- Malik, Y.S.; Sircar, S.; Bhat, S.; Ansari, M.I.; Pande, T.; Kumar, P.; Dhama, K. How artificial intelligence may help the COVID-19 pandemic: Pitfalls and lessons for the future—reviews in Medical. Virology 2020, 31, e2205. [Google Scholar] [CrossRef]
- Truong, T.C.; Diep, Q.B.; Zelinka, I. Artificial intelligence in the cyber domain: Offense and defense. Symmetry 2020, 12, 410. [Google Scholar] [CrossRef] [Green Version]
- Naudé, W. Artificial Intelligence against COVID-19: An Early Review. Available online: https://ssrn.com/abstract=3568314 (accessed on 6 April 2020).
- Vaishya, R.; Javaid, M.; Khan, I.H.; Haleem, A. Artificial Intelligence (AI) applications for COVID-19 pandemic. Diabetes Metab. Syndr. Clin. Res. Rev. 2020, 14, 337–339. [Google Scholar] [CrossRef]
- Shahid, O.; Nasajpour, M.; Pouriyeh, S.; Parizi, R.M.; Han, M.; Valero, M.; Sheng, Q.Z. Machine Learning Research towards Combating COVID-19: Virus Detection, Spread Prevention, and Medical Assistance. arXiv 2020, arXiv:2010.07036. [Google Scholar] [CrossRef]
- Jain, R.; Gupta, M.; Taneja, S.; Hemanth, D.J. Deep learning-based detection and analysis of COVID-19 on chest X-ray images. Appl. Intell. 2021, 51, 1690–1700. [Google Scholar] [CrossRef]
- Aronson, J.E. Expert Systems. In Encyclopedia of Information Systems; Academic Press: Cambridge, MA, USA, 2003; pp. 277–289. [Google Scholar] [CrossRef]
- Alafif, T.; Tehame, A.M.; Bajaba, S.; Barnawi, A.; Zia, S. Machine and Deep Learning towards COVID-19 Diagnosis and Treatment: Survey, Challenges, and Future Directions. Int. J. Environ. Res. Public Health 2021, 18, 1117. [Google Scholar] [CrossRef] [PubMed]
- Wiens, J.; Shenoy, E.S. Machine learning for healthcare: On the verge of a major shift in healthcare epidemiology. Clin. Infect. Dis. 2018, 66, 149–153. [Google Scholar] [CrossRef] [PubMed] [Green Version]
- Alarsan, F.I.; Younes, M. Analysis and classification of heart diseases using heartbeat features and machine learning algorithms. J. Big Data 2019, 6, 81. [Google Scholar] [CrossRef] [Green Version]
- Alzubi, J.; Nayyar, A.; Kumar, A. Machine learning from theory to algorithms: An overview. J. Phys. Conf. Ser. 2018, 1142, 012012. [Google Scholar] [CrossRef]
- Xu, Z.; Shi, L.; Wang, Y.; Zhang, J.; Huang, L.; Zhang, C.; Liu, S.; Zhao, P.; Liu, H.; Zhu, L.; et al. Pathological findings of COVID-19 associated with acute respiratory distress syndrome. Lancet Respir. Med. 2020, 8, 420–422. [Google Scholar] [CrossRef]
- Dey, S.K.; Rahman, M.M.; Siddiqi, U.R.; Howlader, A. Analyzing the Epidemiological Outbreak of COVID-19: A Visual Exploratory Data Analysis (EDA) Approach. J. Med. Virol. 2020, 92, 632–638. [Google Scholar] [CrossRef] [PubMed]
- Harringtion, P. Machine Learning in Action; Manning Publications Co.: New York, NY, USA, 2012. [Google Scholar]
- De Souza, F.S.H.; Hojo-Souza, N.S.; Dos Santos, E.B.; Da Silva, C.M.; Guidoni, D.L. Predicting the disease outcome in COVID-19 positive patients through Machine Learning: A retrospective cohort study with Brazilian data. Front. Artif. Intell. 2021, 4, 579931. [Google Scholar] [CrossRef] [PubMed]
- Kaur, P.; Sharma, M.; Mittal, M. Big data and machine learning-based secure healthcare framework. Procedia Comput. Sci. 2018, 132, 1049–1059. [Google Scholar] [CrossRef]
- Li, M.; Zhang, Z.; Jiang, S.; Liu, Q.; Chen, C.; Zhuang, Y.; Wang, X. Predicting the epidemic trend of COVID-19 in China and across the world using the Machine Learning Approach. medRxiv 2020. [Google Scholar]
- Michie, D.; Spiegelhalter, D.J.; Taylor, C.C. Machine learning. Neural Stat. Classif. 1994, 13, 1–298. [Google Scholar]
- Magdon-Ismail, M. Machine Learning the Phenomenology of COVID-19 from early infection Dynamics. arXiv 2020, arXiv:2003.07602. [Google Scholar]
- Randhawa, G.S.; Soltysiak, M.P.; El Roz, H.; de Souza, C.P.; Hill, K.A.; Kari, L. Machine learning using intrinsic genomic signatures for rapid classification of novel pathogens: COVID-19 case study. PLoS ONE 2020, 15, e0232391. [Google Scholar] [CrossRef] [Green Version]
- Rao, A.S.S.; Vazquoz, J.A. Identification of COVID-19 can be quicker through Artificial Intelligence framework using a Mobile Phone-based survey in the populations when cities/towns are under quarantine. Infect. Control. Hosp. Epidemiol. 2020, 41, 826–830. [Google Scholar]
- Wang, C.J.; Ng, C.Y.; Brook, R.H. Response to COVID-19 in Taiwan: Big data analytics, new technology, and proactive testing. JAMA 2020, 323, 1341–1342. [Google Scholar] [CrossRef]
- Yan, L.; Zhang, H.T.; Goncalves, J.; Xiao, Y.; Wag, M.; Guo, Y.; Sun, C.; Tang, X.; Jin, L.; Zhang, M.; et al. A Machine Learning-based model for survival prediction in patients with severe COVID-19 infection. medRxiv 2020. [Google Scholar]
- Pinter, G.; Felde, I.; Mosavi, A.; Ghamisi, P.; Gloaguen, R. COVID-19 pandemic prediction for Hungary; a hybrid machine learning approach. Mathematics 2020, 8, 890. [Google Scholar] [CrossRef]
- Rabcan, J.; Levashenko, V.; Zaitseva, E.; Kvassay, M. Review of methods for EEG signal classification and development of new fuzzy classification-based approach. IEEE Access 2020, 8, 189720–189734. [Google Scholar] [CrossRef]
- Liang, R.; Lu, Y.; Qu, X.; Su, Q.; Li, C.; Xia, S.; Niu, B. Prediction for global African swine fever outbreaks based on a combination of random forest algorithms and meteorological data. Transbound. Emerg. Dis. 2020, 67, 935–946. [Google Scholar] [CrossRef]
- Tapak, L.; Hamidi, O.; Fathian, M.; Karami, M. Comparative evaluation of time series models for predicting influenza outbreaks: Application of influenza-like illness data from sentinel sites of healthcare centers in Iran. BMC Res. Notes 2019, 12, 1–6. [Google Scholar] [CrossRef] [PubMed] [Green Version]
- Anno, S.; Hara, T.; Kai, H.; Lee, M.A.; Chang, Y.; Oyoshi, K.; Tadono, T. Spatiotemporal dengue fever hotspots associated with climatic factors in taiwan including outbreak predictions based on machine-learning. Geospat. Health 2019, 14, 183–194. [Google Scholar] [CrossRef] [PubMed]
- Chenar, S.S.; Deng, Z. Development of artificial intelligence approach to forecasting oyster norovirus outbreaks along Gulf of Mexico coast. Environ. Int. 2018, 111, 212–223. [Google Scholar] [CrossRef]
- Muurlink, O.T.; Stephenson, P.; Islam, M.Z.; Taylor-Robinson, A.W. Long-term predictors of dengue outbreaks in Bangladesh: A data mining approach. Infect. Dis. Model. 2018, 3, 322–330. [Google Scholar] [CrossRef]
- Iqbal, N.; Islam, M. Machine learning for dengue outbreak prediction: A performance evaluation of different prominent classifiers. Informatica 2019, 43, 363–371. [Google Scholar] [CrossRef] [Green Version]
- Raja, D.B.; Mallol, R.; Ting, C.Y.; Kamaludin, F.; Ahmad, R.; Ismail, S.; Sundram, B.M. Artificial intelligence model as predictor for dengue outbreaks. Malays. J. Public Health Med. 2019, 19, 103–108. [Google Scholar] [CrossRef]
- Agarwal, N.; Koti, S.R.; Saran, S.; Senthil Kumar, A. Data mining techniques for predicting dengue outbreak in geospatial domain using weather parameters for New Delhi, India. Curr. Sci. 2018, 114, 2281–2291. [Google Scholar] [CrossRef]
- Ponmalar, P.P.; Vijayalakshmi, C.R. Aggregation in IoT for Prediction of Diabetics with Machine Learning Techniques. In International Conference on Computer Networks, Big Data and Iot, Proceedings of the International Conference on Computer Networks, Big Data and IoT (ICCBI-2019), Melur Madurai, India, 19–20 December 2019; Springer: Cham, Switzerland, 2019; pp. 789–798. [Google Scholar]
- Woldemichael, F.G.; Menaria, S. Prediction of Diabetes Using Data Mining Techniques. In Proceedings of the 2018 2nd International Conference on Trends in Electronics and Informatics (ICOEI), Tirunelveli, India, 11–12 May 2018; pp. 414–418. [Google Scholar]
- Aich, S.; Younga, K.; Hui, K.L.; Al-Absi, A.A.; Sain, M. A Non-linear decision tree-based classification approach to predict the Parkinson’s disease using different feature sets of voice data. In Proceedings of the 2018 20th International Conference on Advanced Communication Technology (ICACT), Chuncheon, Korea, 11–14 February 2018; pp. 638–642. [Google Scholar]
- Liu, D.; Clemente, L.; Poirier, C.; Ding, X.; Chinazzi, M.; Davis, J.T.; Santillana, M. A machine learning methodology for real-time forecasting of the 2019-2020 COVID-19 outbreak using Internet searches, news alerts, and estimates from mechanistic models. arXiv 2020, arXiv:2004.04019. [Google Scholar]
- Codish, S.; Shiffman, R. A model of ambiguity and vagueness in clinical practice guideline recommendations. Proc. Annu. Symp. AMIA 2005, 2005, 146–150. [Google Scholar]
- Hofmann, B. Vagueness in Medicine: On Disciplinary Indistinctness, Fuzzy Phenomena, Vague Concepts, Uncertain Knowledge, and Fact-Value-Interaction. Axiomathes 2021, 1–18. [Google Scholar] [CrossRef]
- Levashenko, V.; Rabcan, J.; Zaitseva, E. Reliability Evaluation of the Factors That Influenced COVID-19 Patients’ Condition. Appl. Sci. 2021, 11, 2589. [Google Scholar] [CrossRef]
- Digvijay, P.; Sumeet, G.; Harjinder, S.; Joginder, S.; Rahul, K.; Srinivasu, P.N. Mathematical Modeling for prediction of spread of COVID-19 & AI/ML based technique to Detect SARS-CoV-2 via Smartphone Sensors. Int. J. Model. Identif. Control. 2022, in press. [Google Scholar]
- Srinivasu, P.N.; Bhoi, A.K.; Jhaveri, R.H.; Reddy, G.T.; Bilal, M. Probabilistic Deep Q Network for real-time path planning in censorious robotic procedures using force sensors. J. Real-Time Image Proc. 2021, 18, 1773–1785. [Google Scholar] [CrossRef]
- Suzuki, Y.; Suzuki, A.; Nakamura, S.; Ishikawa, T.; Kinoshita, A. Machine learning model estimating number of COVID-19 infection cases over coming 24 days in every province of South Korea (XGBoost and MultiOutputRegressor). medRxiv 2020. [Google Scholar]
- Apostolopoulos, I.D.; Mpesiana, T.A. COVID-19: Automatic detection from x-ray images utilizing transfer learning with convolutional neural networks. Phys. Eng. Sci. Med. 2020, 43, 635–640. [Google Scholar] [CrossRef] [Green Version]
- Rehman, A.; Iqbal, M.A.; Xing, H.; Ahmed, I. COVID-19 Detection Empowered with Machine Learning and Deep Learning Techniques: A Systematic Review. Appl. Sci. 2021, 11, 3414. [Google Scholar] [CrossRef]
- Singer, G.; Marudi, M. Ordinal Decision-Tree-Based Ensemble Approaches: The Case of Controlling the Daily Local Growth Rate of the COVID-19 Epidemic. Entropy 2020, 22, 871. [Google Scholar] [CrossRef]
- Abdulkareem, A.B.; Sani, N.S.; Sahran, S.; Abdi, Z.; Alyessari, A.; Adam, A.; Abdulkarem, A.B. Predicting COVID-19 Based on Environmental Factors With Machine Learning. Intell. Autom. Soft Comput. 2021, 28, 305–320. [Google Scholar] [CrossRef]
- Alotaibi, A.; Shiblee, M.; Alshahrani, A. Prediction of severity of COVID-19-infected patients using machine learning techniques. Computers 2021, 10, 31. [Google Scholar] [CrossRef]
- Khan, I.U.; Aslam, N.; Aljabri, M.; Aljameel, S.S.; Kamaleldin, M.M.A.; Alshamrani, F.M.; Chrouf, S.M. Computational Intelligence-Based Model for Mortality Rate Prediction in COVID-19 Patients. Int. J. Environ. Res. Public Health 2021, 18, 6429. [Google Scholar] [CrossRef]
- Mansour, R.F.; Alfar, N.M.; Abdel-Khalek, S.; Abdelhaq, M.; Saeed, R.A.; Alsaqour, R. Optimal deep learning based fusion model for biomedical image classification. Expert Syst. 2021, e12764. [Google Scholar] [CrossRef]
- Ko, H.; Chung, H.; Kang, W.S.; Park, C.; Kim, S.E.; Chung, C.R.; Lee, J. An artificial intelligence model to predict the mortality of COVID-19 patients at hospital admission time using routine blood samples: Development and validation of an ensemble model. J. Med. Internet Res. 2020, 22, e25442. [Google Scholar] [CrossRef] [PubMed]
- Bertsimas, D.; Lukin, G.; Mingardi, L.; Nohadani, O.; Orfanoudaki, A.; Stellato, B.; Hellenic COVID-19 Study Group. COVID-19 mortality risk assessment: An international multi-center study. PLoS ONE 2020, 15, e0243262. [Google Scholar] [CrossRef] [PubMed]
- Das, A.K.; Mishra, S.; Gopalan, S.S. Predicting CoVID-19 community mortality risk using machine learning and development of an online prognostic tool. PeerJ 2020, 8, e10083. [Google Scholar] [CrossRef]
- Li, L.; Sun, L.; Xue, Y.; Li, S.; Huang, X.; Mansour, R.F. Fuzzy multilevel image thresholding based on improved coyote optimization algorithm. IEEE Access 2021, 9, 33595–33607. [Google Scholar] [CrossRef]
- Mansour, R.F.; Escorcia-Gutierrez, J.; Gamarra, M.; Villanueva, J.A.; Leal, N. Intelligent video anomaly detection and classification using faster RCNN with deep reinforcement learning model. Image Vis. Comput. 2021, 112, 104229. [Google Scholar] [CrossRef]
- Mansour, R.F.; Al-Otaibi, S.; Al-Rasheed, A.; Aljuaid, H.; Pustokhina, I.; Pustokhin, D.A. An Optimal Big Data Analytics with Concept Drift Detection on High-Dimensional Streaming Data. CMC-Comput. Mater. Contin. 2021, 68, 2843–2858. [Google Scholar] [CrossRef]
- Mayank Tripathi. Data Science Foundation, under Fitting and Over Fitting in Machine Learning. Available online: https://datascience.foundation/sciencewhitepaper/underfitting-and-overfitting-in-machine-learning (accessed on 2 December 2021).
- Nithya, B.; Ilango, V. Predictive analytics in health care using machine learning tools and techniques. In Proceedings of the 2017 International Conference on Intelligent Computing and Control Systems (ICICCS), Madurai, India, 15–16 June 2017; pp. 492–499. [Google Scholar]
- Freund, Y.; Schapire, R.E. A decision-theoretic generalization of on-line learning and an application to boosting. J. Comput. Syst. Sci. 1997, 55, 119–139. [Google Scholar] [CrossRef] [Green Version]
- Adaboost Team. G. Youngmin Jun. PowerPoint Presentation. Available online: https://slideplayer.com/slide/14583815/ (accessed on 31 December 2021).
- Available online: https://medium.com/machine-learning-101/https-medium-com-savanpatel-chapter-6-adaboost-classifier-b945f330af06#:~:text=alpha_t%20is%20calculated%20as%20follows,training%20example%20has%20equal%20weightage (accessed on 31 December 2021).
- Ho, T.K. Random decision forests. In Proceedings of the 3rd International Conference on Document Analysis and Recognition, Montreal, QC, Canada, 14–16 August 1995; Volume 1, pp. 278–282. [Google Scholar]
- Ho, T.K. The random subspace method for constructing decision forests. IEEE Trans. Pattern Anal. Mach. Intell. 1998, 20, 832–844. [Google Scholar]
- Hastie, T.; Tibshirani, R.; Friedman, J. The Elements of Statistical Learning, 2nd ed.; Springer: Berlin/Heidelberg, Germany, 2008; ISBN 0-387-95284-5. [Google Scholar]
- Breiman, L. Bagging predictors. Mach. Learn. 1996, 24, 123–140. [Google Scholar] [CrossRef] [Green Version]
- Introduction to Bagging and Ensemble Methods. Available online: https://blog.paperspace.com/bagging-ensemble-methods/amp/ (accessed on 21 September 2021).
- Cohen, W.W. Fast, effective rule induction. In Proceedings of the Twelfth International Conference on Machine Learning, San Francisco, CA, USA, 9–12 July 2012; pp. 115–123. [Google Scholar]
- COVID-19 in India: Dataset on Novel Corona Virus Disease 2019 in India. Available online: https://www.kaggle.com/sudalairajkumar/covid19-in-india?select=covid_19_india.csv (accessed on 21 September 2021).
- Naga, S.P.; Rao, T.; Balas, V. A systematic approach for identification of tumor regions in the human brain through HARIS algorithm. In Deep Learning Techniques for Biomedical and Health Informatics; Academic Press: Cambridge, MA, USA, 2020; pp. 97–118. [Google Scholar]
- Mongan, J.; Moy, L.; Kahn, C. Checklist for Artificial Intelligence in Medical Imaging (CLAIM): A Guide for Authors and Reviewers. Radiol. Artif. Intell. 2020, 2, e200029. [Google Scholar] [CrossRef] [Green Version]
- An, C.; Lim, H.; Kim, D.W.; Chang, J.H.; Choi, Y.J.; Kim, S.W. Machine learning prediction for mortality of patients diagnosed with COVID-19: A nationwide Korean cohort study. Sci. Rep. 2020, 10, 18716. [Google Scholar] [CrossRef]
- Sánchez-Montañés, M.; Rodríguez-Belenguer, P.; Serrano-López, A.J.; Soria-Olivas, E.; Alakhdar-Mohmara, Y. Machine learning for mortality analysis in patients with COVID-19. Int. J. Environ. Res. Public Health 2020, 17, 8386. [Google Scholar] [CrossRef] [PubMed]
- Parchure, P.; Joshi, H.; Dharmarajan, K.; Freeman, R.; Reich, D.L.; Mazumdar, M.; Kia, A. Development and validation of a machine learning-based prediction model for near-term in-hospital mortality among patients with COVID-19. BMJ Supportive Palliat. Care 2020, 1–8. [Google Scholar] [CrossRef] [PubMed]
- Agbelusi, O.; Olayemi, O.C. Prediction of Mortality Rate of COVID-19 Patients using Machine Learning Techniques in Nigeria. Int. J. Comput. Sci. Softw. Eng. 2020, 9, 30–34. [Google Scholar]
- Tezza, F.; Lorenzoni, G.; Azzolina, D.; Barbar, S.; Leone, L.A.C.; Gregori, D. Predicting in-Hospital Mortality of Patients with COVID-19 Using Machine Learning Techniques. J. Pers. Med. 2021, 11, 343. [Google Scholar] [CrossRef]
- Ferreira, A.T.; Fernandes, C.; Vieira, J.; Portela, F. Pervasive Intelligent Models to Predict the Outcome of COVID-19 Patients. Future Internet 2021, 13, 102. [Google Scholar] [CrossRef]
- Pourhomayoun, M.; Shakibi, M. Predicting mortality risk in patients with COVID-19 using artificial intelligence to help medical decision-making. MedRxiv 2020. [Google Scholar]
- Naga Srinivasu, P.; Balas, V.E. Self-Learning Network-based segmentation for real-time brain M.R. images through HARIS. PeerJ Comput. Sci. 2021, 7, e654. [Google Scholar] [CrossRef] [PubMed]


| Reference | Technique Followed | Work Done |
|---|---|---|
| [10] | Decision Tree and Random Forest Algorithms | Classifying ECG signals |
| [12] | Exploratory Data Analysis | Exploratory data analysis and visualization are performed for virus-infected, recovered, and death cases through classification techniques |
| [14] | Linear Regression, Multilayer Perceptron, and Vector Auto Regression Methods | Forecast the pandemic |
| [20] | Digital Signal Processing | Classification of the COVID-19 genomes analysis performed with precision |
| [21] | AI Framework | A mobile phone-based survey was conducted in provinces that are under quarantine |
| [22] | Big Data Analytics | The study discussed the response to COVID-19 in Taiwan |
| [24] | Fuzzy Inference System And Multi-Layered Perceptron | Predicting infection and mortality rates due to COVID-19 for Hungary |
| [25] | Fuzzy Classifier | EEG Signal Classification is done |
| [26] | Random Forest | The outbreak of African fever-like diseases was predicted successfully. |
| [27] | Comparative Evaluation of Time Series Models | Forecasting of influenza diseases outbreak in Iran |
| [28] | Deep AlexNet Model | Identifying fever hotspots and diseases outbreak predictions associated with climatic factors in Taiwan |
| [29] | Artificial Neural Network | Predicted oyster norovirus outbreaks along the Gulf of Mexico coast |
| [30] | Data Mining approach | Predicted dengue outbreaks in Bangladesh |
| [32] | Bayesian Network | Predicted dengue outbreaks in the Malaysian region |
| [34] | KNN and SVM techniques | Forecast of diabetic patients |
| [35] | Backpropagation algorithm implemented in R Programming Language | The study has predicted diabetic diseases. The results generated in the study are compared with J48, SVM, and Naive Bayes |
| [36] | Random forest classifier | Predicted Parkinson’s disease |
| [41] | Mathematical Modelling | Predicted the critical condition of patients suffering from COVID-19 in Wuhan |
| [42] | Support Vector Machine | Predicted the survival of patients suffering from COVID |
| [43] | XGBoost, Multioutput Regressor | Forecasting COVID-19 infection cases in provinces of South Korea |
| [44] | Convolution Neural Network (CNN) and Transfer Learning Approach | The technique implemented for detecting the COVID-19 from the X-ray images |
| [45] | Machine Learning and Deep Learning techniques | A systematic review was conducted in the study to detect COVID-19 |
| [47] | Convolutional Neural Network (CNN), DTree Classifier and BayesNet | A study was conducted to identify the best classification model to classify COVID-19 by using significant weather features chosen by the Principal Component Analysis (PCA) feature selection method |
| [48] | Artificial Neural Network, SVM, and Random Forest | Predicted the severity of COVID-19-infected patients using ML methods |
| [49] | Deep Learning (DL) | Deep Learning-based model for predicting the mortality rates in COVID-19 patients |
| [51] | Ensemble-based Deep Neural Network | Predicted the in-hospital mortality due to COVID-19 using routine blood samples |
| [52] | XGBoost | XGBoost used as a mortality risk tool for hospitalized COVID-19 cases |
| [53] | LR, SVM, KNN, Random Forest, Gradient Boosting | Predicted the mortality cases in South Korea using classification techniques |
| Sno | Date | Time | State/ Union Territory | Confirmed Indian National | Confirmed Foreign National | Cured | Deaths | Confirmed |
|---|---|---|---|---|---|---|---|---|
| 1 | 22 March 2020 | 6:00 p.m. | Delhi | 28 | 1 | 5 | 1 | 29 |
| 2 | 22 March 2020 | 6:00 p.m. | Gujarat | 18 | 0 | 0 | 1 | 18 |
| 3 | 22 March 2020 | 6:00 p.m. | Haryana | 7 | 14 | 0 | 0 | 21 |
| 4 | 8 April 2020 | 5:00 p.m. | Karnataka | - | - | 25 | 4 | 175 |
| 5 | 1 August 2020 | 8:00 a.m. | Assam | - | - | 30,357 | 98 | 40,269 |
| 6 | 22 March 2020 | 6:00 p.m. | Punjab | 21 | 0 | 0 | 1 | 21 |
| - | - | - | - | - | - | - | - | - |
| 5004 | 31 May 2021 | 8:00 a.m. | Mizoram | - | - | 9015 | 38 | 12,087 |
| Classifier | Correctly Classified Instances | Incorrectly Classified Instances | Mean Absolute Error | Root Mean Squared Error | Relative Absolute Error | Root relative Squared Error | Accuracy of Correctly Classified Instances | Time Is Taken to Build the Model (in Seconds) |
|---|---|---|---|---|---|---|---|---|
| Decision Trees | 4422 | 582 | 0.0072 | 0.0634 | 13.76% | 39.12% | 88.37% | 0.28 |
| Naïve Bayes | 3119 | 1885 | 0.0231 | 0.1191 | 43.95% | 73.45% | 62.33% | 0.02 |
| SVM | 4658 | 346 | 0.0037 | 0.0611 | 7.11% | 37.71% | 93.09% | 128.61 |
| Bagging | 897 | 4107 | 0.0465 | 0.1631 | 88.55% | 100.59% | 17.92% | 0.47 |
| AdaBoost | 262 | 4742 | 0.0511 | 0.1598 | 97.21% | 98.60% | 5.23% | 0.05 |
| Random Forest | 1348 | 3656 | 0.0464 | 0.157 | 88.26% | 96.81% | 26.93% | 3.59 |
| Proposed Model | 4704 | 300 | 0.0363 | 0.1145 | 69.05% | 70.62% | 94.00% | 1.49 |
| Reference | Technique | Dataset Size | Country | Results |
|---|---|---|---|---|
| [47] | XGBoost | 3062 | USA and Southern Europe | Accuracy: 0.85, NPV: 0.93 |
| [71] | SVM(Linear) | 10,237 | Korea | Accuracy: 0.91 |
| [72] | LR | 2307 | Madrid | Sensitivity: 0.81, Specificity: 0.81 |
| [73] | Random Forest | 567 | - | Accuracy: 0.655 |
| [74] | Multilayer Perceptron | 302 | Nigeria | Accuracy: 0.85 |
| [75] | Random Forest | 341 | Itlay | ROC:0.84 |
| [76] | Decision Trees | - | Portugal | Sensitivity: 0.95, Accuracy: 0.9, Specificity: 0.86 |
| [77] | ANN | - | - | Accuracy: 0.89 |
| Proposed Model | 5004 | India | Accuracy: 0.94, ROC: 97.8, F-Measure: 0.94 |
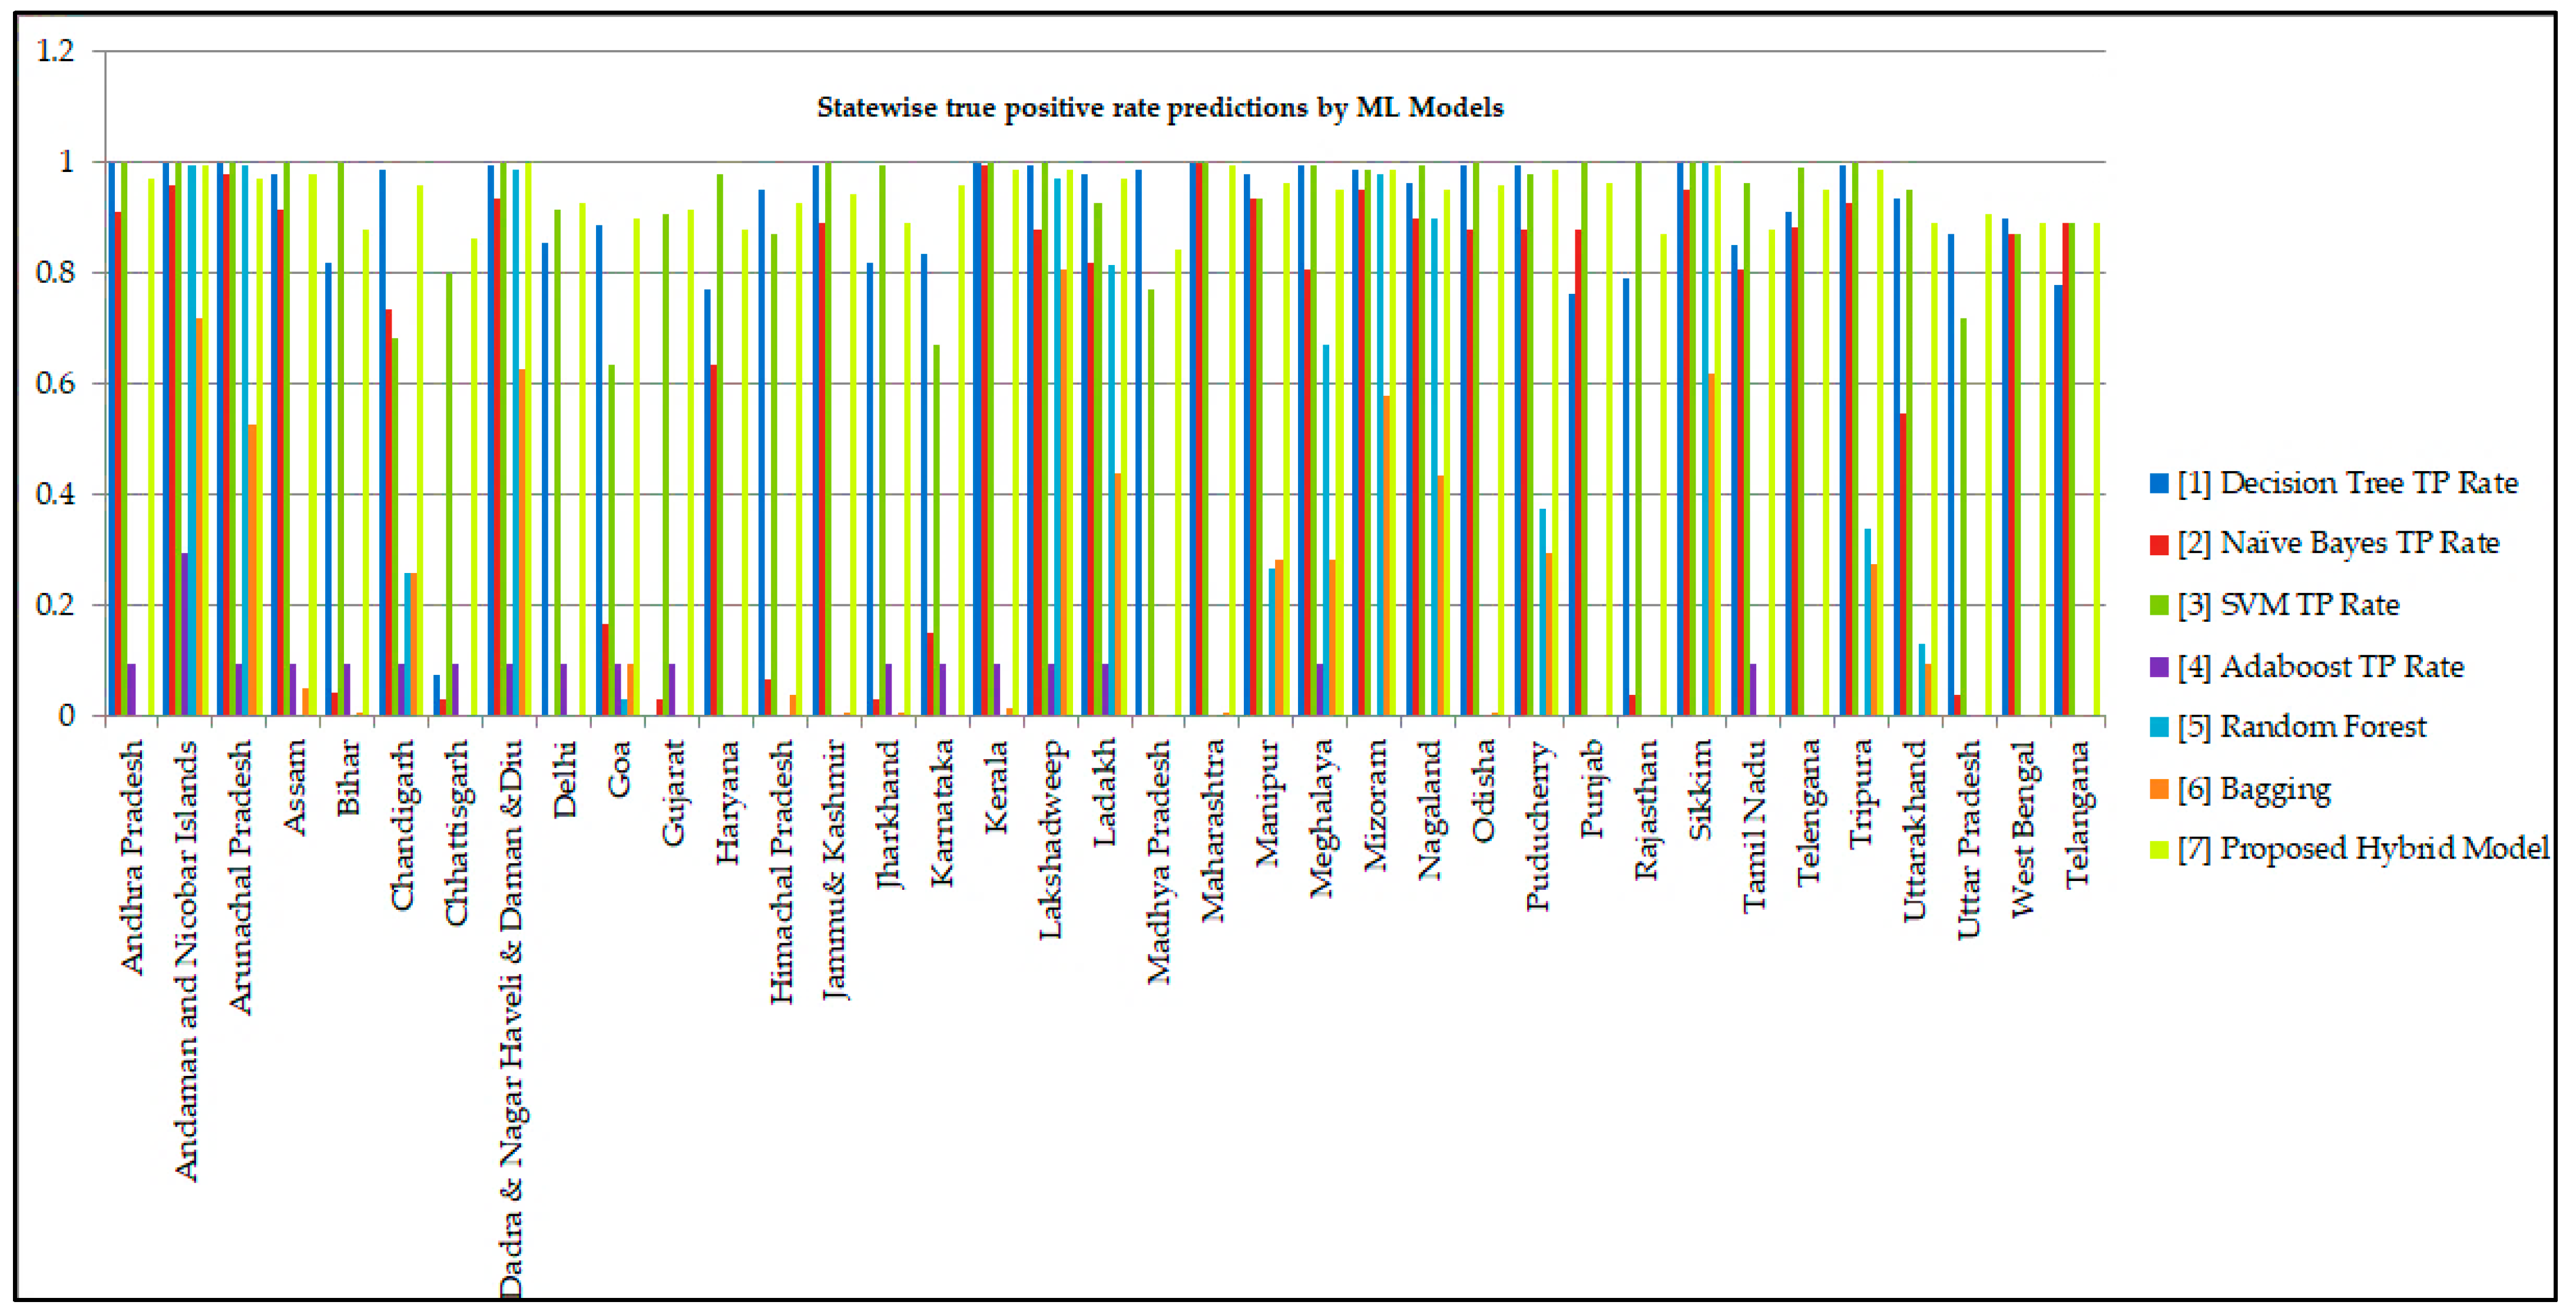
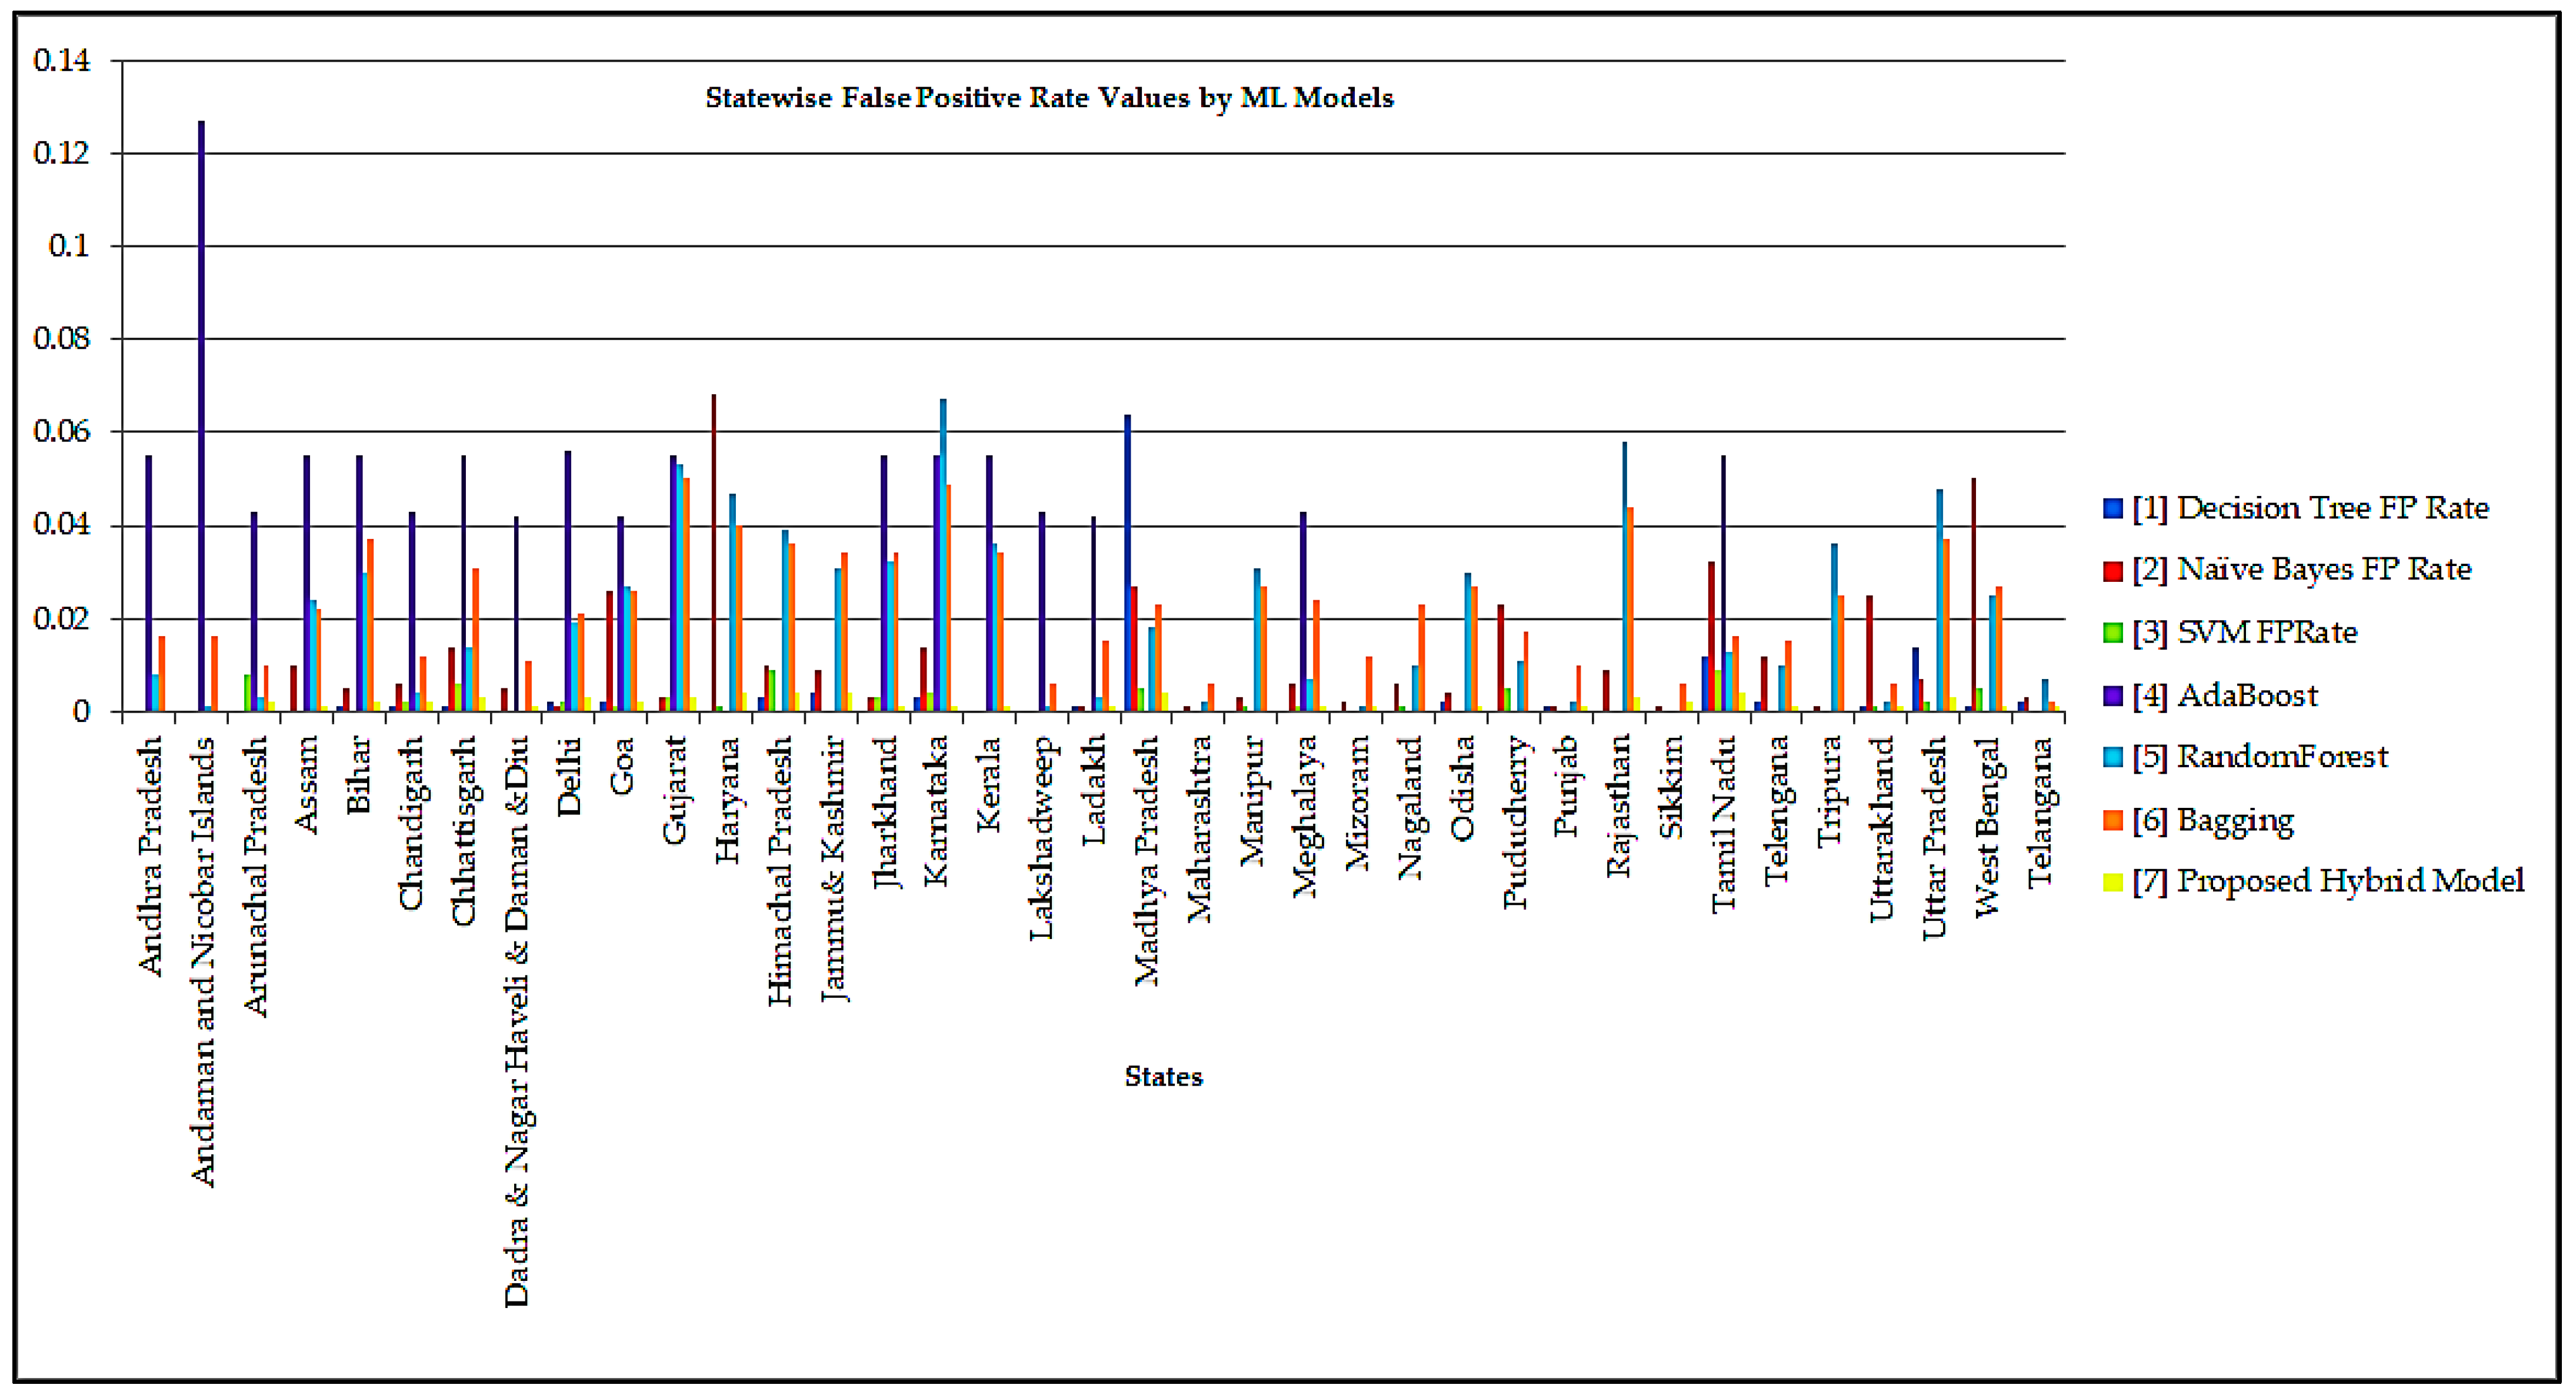
| TP Rate | FP Rate | Class | ||||||||||||
|---|---|---|---|---|---|---|---|---|---|---|---|---|---|---|
| Decision Tree | Naïve Byes | SVM | AdaBoost | Random Forest | Bagging | Hybrid Model | Decision Tree | Naïve Byes | SVM | AdaBoost | Random Forest | Bagging | Proposed Model | State/Union Territory |
| 1 | 0.91 | 1 | 0.094 | 0 | 0 | 0.971 | 0 | 0 | 0 | 0.055 | 0.008 | 0.016 | 0 | Andhra Pradesh |
| 1 | 0.957 | 1 | 0.295 | 0.993 | 0.719 | 0.993 | 0 | 0 | 0 | 0.127 | 0.001 | 0.016 | 0 | Andaman and Nicobar Islands |
| 1 | 0.978 | 1 | 0.094 | 0.993 | 0.525 | 0.971 | 0 | 0 | 0.008 | 0.043 | 0.003 | 0.01 | 0.002 | Arunachal Pradesh |
| 0.978 | 0.914 | 1 | 0.094 | 0 | 0.05 | 0.978 | 0 | 0.01 | 0 | 0.055 | 0.024 | 0.022 | 0.001 | Assam |
| 0.82 | 0.043 | 1 | 0.094 | 0 | 0.007 | 0.878 | 0.001 | 0.005 | 0 | 0.055 | 0.03 | 0.037 | 0.002 | Bihar |
| 0.986 | 0.734 | 0.683 | 0.094 | 0.259 | 0.259 | 0.957 | 0.001 | 0.006 | 0.002 | 0.043 | 0.004 | 0.012 | 0.002 | Chandigarh |
| 0.072 | 0.029 | 0.799 | 0.094 | 0 | 0 | 0.863 | 0.001 | 0.014 | 0.006 | 0.055 | 0.014 | 0.031 | 0.003 | Chhattisgarh |
| 0.993 | 0.935 | 1 | 0.094 | 0.986 | 0.626 | 1 | 0 | 0.005 | 0 | 0.042 | 0 | 0.011 | 0.001 | Dadra & Nagar Haveli |
| 0.856 | 0 | 0.914 | 0.094 | 0 | 0 | 0.928 | 0.002 | 0.001 | 0.002 | 0.056 | 0.019 | 0.021 | 0.003 | Delhi |
| 0.885 | 0.165 | 0.633 | 0.094 | 0.029 | 0.094 | 0.899 | 0.002 | 0.026 | 0.001 | 0.042 | 0.027 | 0.026 | 0.002 | Goa |
| 0 | 0.029 | 0.906 | 0.094 | 0 | 0 | 0.914 | 0 | 0.003 | 0.003 | 0.055 | 0.053 | 0.05 | 0.003 | Gujarat |
| 0.77 | 0.633 | 0.978 | 0 | 0 | 0 | 0.878 | 0 | 0.068 | 0.001 | 0 | 0.047 | 0.04 | 0.004 | Haryana |
| 0.95 | 0.065 | 0.871 | 0 | 0 | 0.036 | 0.928 | 0.003 | 0.01 | 0.009 | 0 | 0.039 | 0.036 | 0.004 | Himachal Pradesh |
| 0.993 | 0.892 | 1 | 0 | 0 | 0.007 | 0.942 | 0.004 | 0.009 | 0 | 0 | 0.031 | 0.034 | 0.004 | Jammu& Kashmir |
| 0.82 | 0.029 | 0.993 | 0.094 | 0 | 0.007 | 0.892 | 0 | 0.003 | 0.003 | 0.055 | 0.032 | 0.034 | 0.001 | Jharkhand |
| 0.835 | 0.151 | 0.669 | 0.094 | 0 | 0 | 0.957 | 0.003 | 0.014 | 0.004 | 0.055 | 0.067 | 0.049 | 0.001 | Karnataka |
| 1 | 0.993 | 1 | 0.094 | 0 | 0.014 | 0.986 | 0 | 0 | 0 | 0.055 | 0.036 | 0.034 | 0.001 | Kerala |
| 0.993 | 0.878 | 1 | 0.094 | 0.971 | 0.806 | 0.986 | 0 | 0 | 0 | 0.043 | 0.001 | 0.006 | 0 | Lakshadweep |
| 0.978 | 0.82 | 0.928 | 0.094 | 0.813 | 0.439 | 0.971 | 0.001 | 0.001 | 0 | 0.042 | 0.003 | 0.015 | 0.001 | Ladakh |
| 0.986 | 0 | 0.77 | 0 | 0 | 0 | 0.842 | 0.064 | 0.027 | 0.005 | 0 | 0.018 | 0.023 | 0.004 | Madhya Pradesh |
| 1 | 1 | 1 | 0 | 0 | 0.007 | 0.993 | 0 | 0.001 | 0 | 0 | 0.002 | 0.006 | 0 | Maharashtra |
| 0.978 | 0.935 | 0.935 | 0 | 0.266 | 0.281 | 0.964 | 0 | 0.003 | 0.001 | 0 | 0.031 | 0.027 | 0 | Manipur |
| 0.993 | 0.806 | 0.993 | 0.094 | 0.669 | 0.281 | 0.95 | 0 | 0.006 | 0.001 | 0.043 | 0.007 | 0.024 | 0.001 | Meghalaya |
| 0.986 | 0.95 | 0.986 | 0 | 0.978 | 0.576 | 0.986 | 0 | 0.002 | 0 | 0 | 0.001 | 0.012 | 0.001 | Mizoram |
| 0.964 | 0.899 | 0.993 | 0 | 0.899 | 0.432 | 0.95 | 0 | 0.006 | 0.001 | 0 | 0.01 | 0.023 | 0 | Nagaland |
| 0.993 | 0.878 | 1 | 0 | 0 | 0.007 | 0.957 | 0.002 | 0.004 | 0 | 0 | 0.03 | 0.027 | 0.001 | Odisha |
| 0.993 | 0.878 | 0.978 | 0 | 0.374 | 0.295 | 0.986 | 0 | 0.023 | 0.005 | 0 | 0.011 | 0.017 | 0 | Puducherry |
| 0.763 | 0.878 | 1 | 0 | 0 | 0 | 0.964 | 0.001 | 0.001 | 0 | 0 | 0.002 | 0.01 | 0.001 | Punjab |
| 0.791 | 0.036 | 1 | 0 | 0 | 0 | 0.871 | 0 | 0.009 | 0 | 0 | 0.058 | 0.044 | 0.003 | Rajasthan |
| 1 | 0.95 | 1 | 0 | 1 | 0.619 | 0.993 | 0 | 0.001 | 0 | 0 | 0 | 0.006 | 0.002 | Sikkim |
| 0.849 | 0.806 | 0.964 | 0.094 | 0 | 0 | 0.878 | 0.012 | 0.032 | 0.009 | 0.055 | 0.013 | 0.016 | 0.004 | Tamil Nadu |
| 0.909 | 0.884 | 0.992 | 0 | 0 | 0 | 0.95 | 0.002 | 0.012 | 0 | 0 | 0.01 | 0.015 | 0.001 | Telangana |
| 0.993 | 0.928 | 1 | 0 | 0.338 | 0.273 | 0.986 | 0 | 0.001 | 0 | 0 | 0.036 | 0.025 | 0 | Tripura |
| 0.935 | 0.547 | 0.95 | 0 | 0.129 | 0.094 | 0.892 | 0.001 | 0.025 | 0.001 | 0 | 0.002 | 0.006 | 0.001 | Uttarakhand |
| 0.871 | 0.036 | 0.719 | 0 | 0 | 0 | 0.906 | 0.014 | 0.007 | 0.002 | 0 | 0.048 | 0.037 | 0.003 | Uttar Pradesh |
| 0.899 | 0.871 | 0.871 | 0 | 0 | 0 | 0.892 | 0.001 | 0.05 | 0.005 | 0 | 0.025 | 0.027 | 0.001 | West Bengal |
| 0.778 | 0.889 | 0.889 | 0 | 0 | 0 | 0.889 | 0.002 | 0.003 | 0 | 0 | 0.007 | 0.002 | 0.001 | Telangana |
| 0.88 | 0.623 | 0.93 | 0.052 | 0.269 | 0.179 | 0.94 | 0.003 | 0.011 | 0.002 | 0.027 | 0.021 | 0.023 | 0.002 | Weighted Avg. |
| Recall | F-Measure | Class | ||||||||||||
|---|---|---|---|---|---|---|---|---|---|---|---|---|---|---|
| Decision Tree | Naïve Byes | SVM | AdaBoost | Random Forest | Bagging | Proposed Hybrid Model | Decision Tree | Naïve Byes | SVM | AdaBoost | Random Forest | Bagging | Proposed Model | State/Union Territory |
| 1 | 0.914 | 1 | 0.094 | 0 | 0 | 0.971 | 0 | 0 | 0 | 0.062 | 0 | 0 | 0.985 | Andhra Pradesh |
| 1 | 0.957 | 1 | 0.295 | 0.993 | 0.719 | 0.993 | 0 | 0 | 0 | 0.103 | 0.986 | 0.631 | 0.996 | Andaman and Nicobar Islands |
| 1 | 0.978 | 1 | 0.094 | 0.993 | 0.525 | 0.971 | 0 | 0 | 0.008 | 0.072 | 0.942 | 0.564 | 0.954 | Arunachal Pradesh |
| 0.978 | 0.914 | 1 | 0.094 | 0 | 0.05 | 0.978 | 0 | 0.01 | 0 | 0.062 | 0 | 0.055 | 0.968 | Assam |
| 0.82 | 0.043 | 1 | 0.094 | 0 | 0.007 | 0.878 | 0.001 | 0.005 | 0 | 0.062 | 0 | 0.006 | 0.9 | Bihar |
| 0.986 | 0.734 | 0.683 | 0.094 | 0.259 | 0.259 | 0.957 | 0.001 | 0.006 | 0.002 | 0.072 | 0.369 | 0.31 | 0.947 | Chandigarh |
| 0.072 | 0.029 | 0.799 | 0.094 | 0 | 0 | 0.863 | 0.001 | 0.014 | 0.006 | 0.062 | 0 | 0 | 0.879 | Chhattisgarh |
| 0.993 | 0.935 | 1 | 0.094 | 0.986 | 0.626 | 1 | 0 | 0.005 | 0 | 0.073 | 0.986 | 0.619 | 0.989 | Dadra & Nagar Haveli |
| 0.856 | 0 | 0.914 | 0.094 | 0 | 0 | 0.928 | 0.002 | 0.001 | 0.002 | 0.061 | 0 | 0 | 0.912 | Delhi |
| 0.885 | 0.165 | 0.633 | 0.094 | 0.029 | 0.094 | 0.899 | 0.002 | 0.026 | 0.001 | 0.073 | 0.029 | 0.093 | 0.912 | Goa |
| 0 | 0.029 | 0.906 | 0.094 | 0 | 0 | 0.914 | 0 | 0.003 | 0.003 | 0.062 | 0 | 0 | 0.898 | Gujarat |
| 0.77 | 0.633 | 0.978 | 0 | 0 | 0 | 0.878 | 0 | 0.068 | 0.001 | 0 | 0 | 0 | 0.868 | Haryana |
| 0.95 | 0.065 | 0.871 | 0 | 0 | 0.036 | 0.928 | 0.003 | 0.01 | 0.009 | 0 | 0 | 0.032 | 0.899 | Himachal Pradesh |
| 0.993 | 0.892 | 1 | 0 | 0 | 0.007 | 0.942 | 0.004 | 0.009 | 0 | 0 | 0 | 0.007 | 0.91 | Jammu& Kashmir |
| 0.82 | 0.029 | 0.993 | 0.094 | 0 | 0.007 | 0.892 | 0 | 0.003 | 0.003 | 0.062 | 0 | 0.007 | 0.919 | Jharkhand |
| 0.835 | 0.151 | 0.669 | 0.094 | 0 | 0 | 0.957 | 0.003 | 0.014 | 0.004 | 0.062 | 0 | 0 | 0.967 | Karnataka |
| 1 | 0.993 | 1 | 0.094 | 0 | 0.014 | 0.986 | 0 | 0 | 0 | 0.062 | 0 | 0.013 | 0.975 | Kerala |
| 0.993 | 0.878 | 1 | 0.094 | 0.971 | 0.806 | 0.986 | 0 | 0 | 0 | 0.072 | 0.975 | 0.797 | 0.993 | Lakshadweep |
| 0.978 | 0.82 | 0.928 | 0.094 | 0.813 | 0.439 | 0.971 | 0.001 | 0.001 | 0 | 0.073 | 0.85 | 0.449 | 0.964 | Ladakh |
| 0.986 | 0 | 0.77 | 0 | 0 | 0 | 0.842 | 0.064 | 0.027 | 0.005 | 0 | 0 | 0 | 0.848 | Madhya Pradesh |
| 1 | 1 | 1 | 0 | 0 | 0.007 | 0.993 | 0 | 0.001 | 0 | 0 | 0 | 0.012 | 0.993 | Maharashtra |
| 0.978 | 0.935 | 0.935 | 0 | 0.266 | 0.281 | 0.964 | 0 | 0.003 | 0.001 | 0 | 0.225 | 0.254 | 0.975 | Manipur |
| 0.993 | 0.806 | 0.993 | 0.094 | 0.669 | 0.281 | 0.95 | 0 | 0.006 | 0.001 | 0.072 | 0.705 | 0.264 | 0.96 | Meghalaya |
| 0.986 | 0.95 | 0.986 | 0 | 0.978 | 0.576 | 0.986 | 0 | 0.002 | 0 | 0 | 0.975 | 0.582 | 0.982 | Mizoram |
| 0.964 | 0.899 | 0.993 | 0 | 0.899 | 0.432 | 0.95 | 0 | 0.006 | 0.001 | 0 | 0.804 | 0.387 | 0.967 | Nagaland |
| 0.993 | 0.878 | 1 | 0 | 0 | 0.007 | 0.957 | 0.002 | 0.004 | 0 | 0 | 0 | 0.007 | 0.964 | Odisha |
| 0.993 | 0.878 | 0.978 | 0 | 0.374 | 0.295 | 0.986 | 0 | 0.023 | 0.005 | 0 | 0.423 | 0.313 | 0.986 | Puducherry |
| 0.763 | 0.878 | 1 | 0 | 0 | 0 | 0.964 | 0.001 | 0.001 | 0 | 0 | 0 | 0 | 0.961 | Punjab |
| 0.791 | 0.036 | 1 | 0 | 0 | 0 | 0.871 | 0 | 0.009 | 0 | 0 | 0 | 0 | 0.877 | Rajasthan |
| 1 | 0.95 | 1 | 0 | 1 | 0.619 | 0.993 | 0 | 0.001 | 0 | 0 | 1 | 0.683 | 0.965 | Sikkim |
| 0.849 | 0.806 | 0.964 | 0.094 | 0 | 0 | 0.878 | 0.012 | 0.032 | 0.009 | 0.062 | 0 | 0 | 0.868 | Tamil Nadu |
| 0.909 | 0.884 | 0.992 | 0 | 0 | 0 | 0.95 | 0.002 | 0.012 | 0 | 0 | 0 | 0 | 0.954 | Telangana |
| 0.993 | 0.928 | 1 | 0 | 0.338 | 0.273 | 0.986 | 0 | 0.001 | 0 | 0 | 0.262 | 0.256 | 0.986 | Tripura |
| 0.935 | 0.547 | 0.95 | 0 | 0.129 | 0.094 | 0.892 | 0.001 | 0.025 | 0.001 | 0 | 0.218 | 0.144 | 0.922 | Uttarakhand |
| 0.871 | 0.036 | 0.719 | 0 | 0 | 0 | 0.906 | 0.014 | 0.007 | 0.002 | 0 | 0 | 0 | 0.894 | Uttar Pradesh |
| 0.899 | 0.871 | 0.871 | 0 | 0 | 0 | 0.892 | 0.001 | 0.05 | 0.005 | 0 | 0 | 0 | 0.922 | West Bengal |
| 0.778 | 0.889 | 0.889 | 0 | 0 | 0 | 0.889 | 0.002 | 0.003 | 0 | 0 | 0 | 0 | 0.842 | Telangana |
| 0.88 | 0.623 | 0.93 | 0.052 | 0.269 | 0.179 | 0.94 | 0.003 | 0.011 | 0.002 | 0.034 | 0.271 | 0.18 | 0.94 | Weighted Avg. |
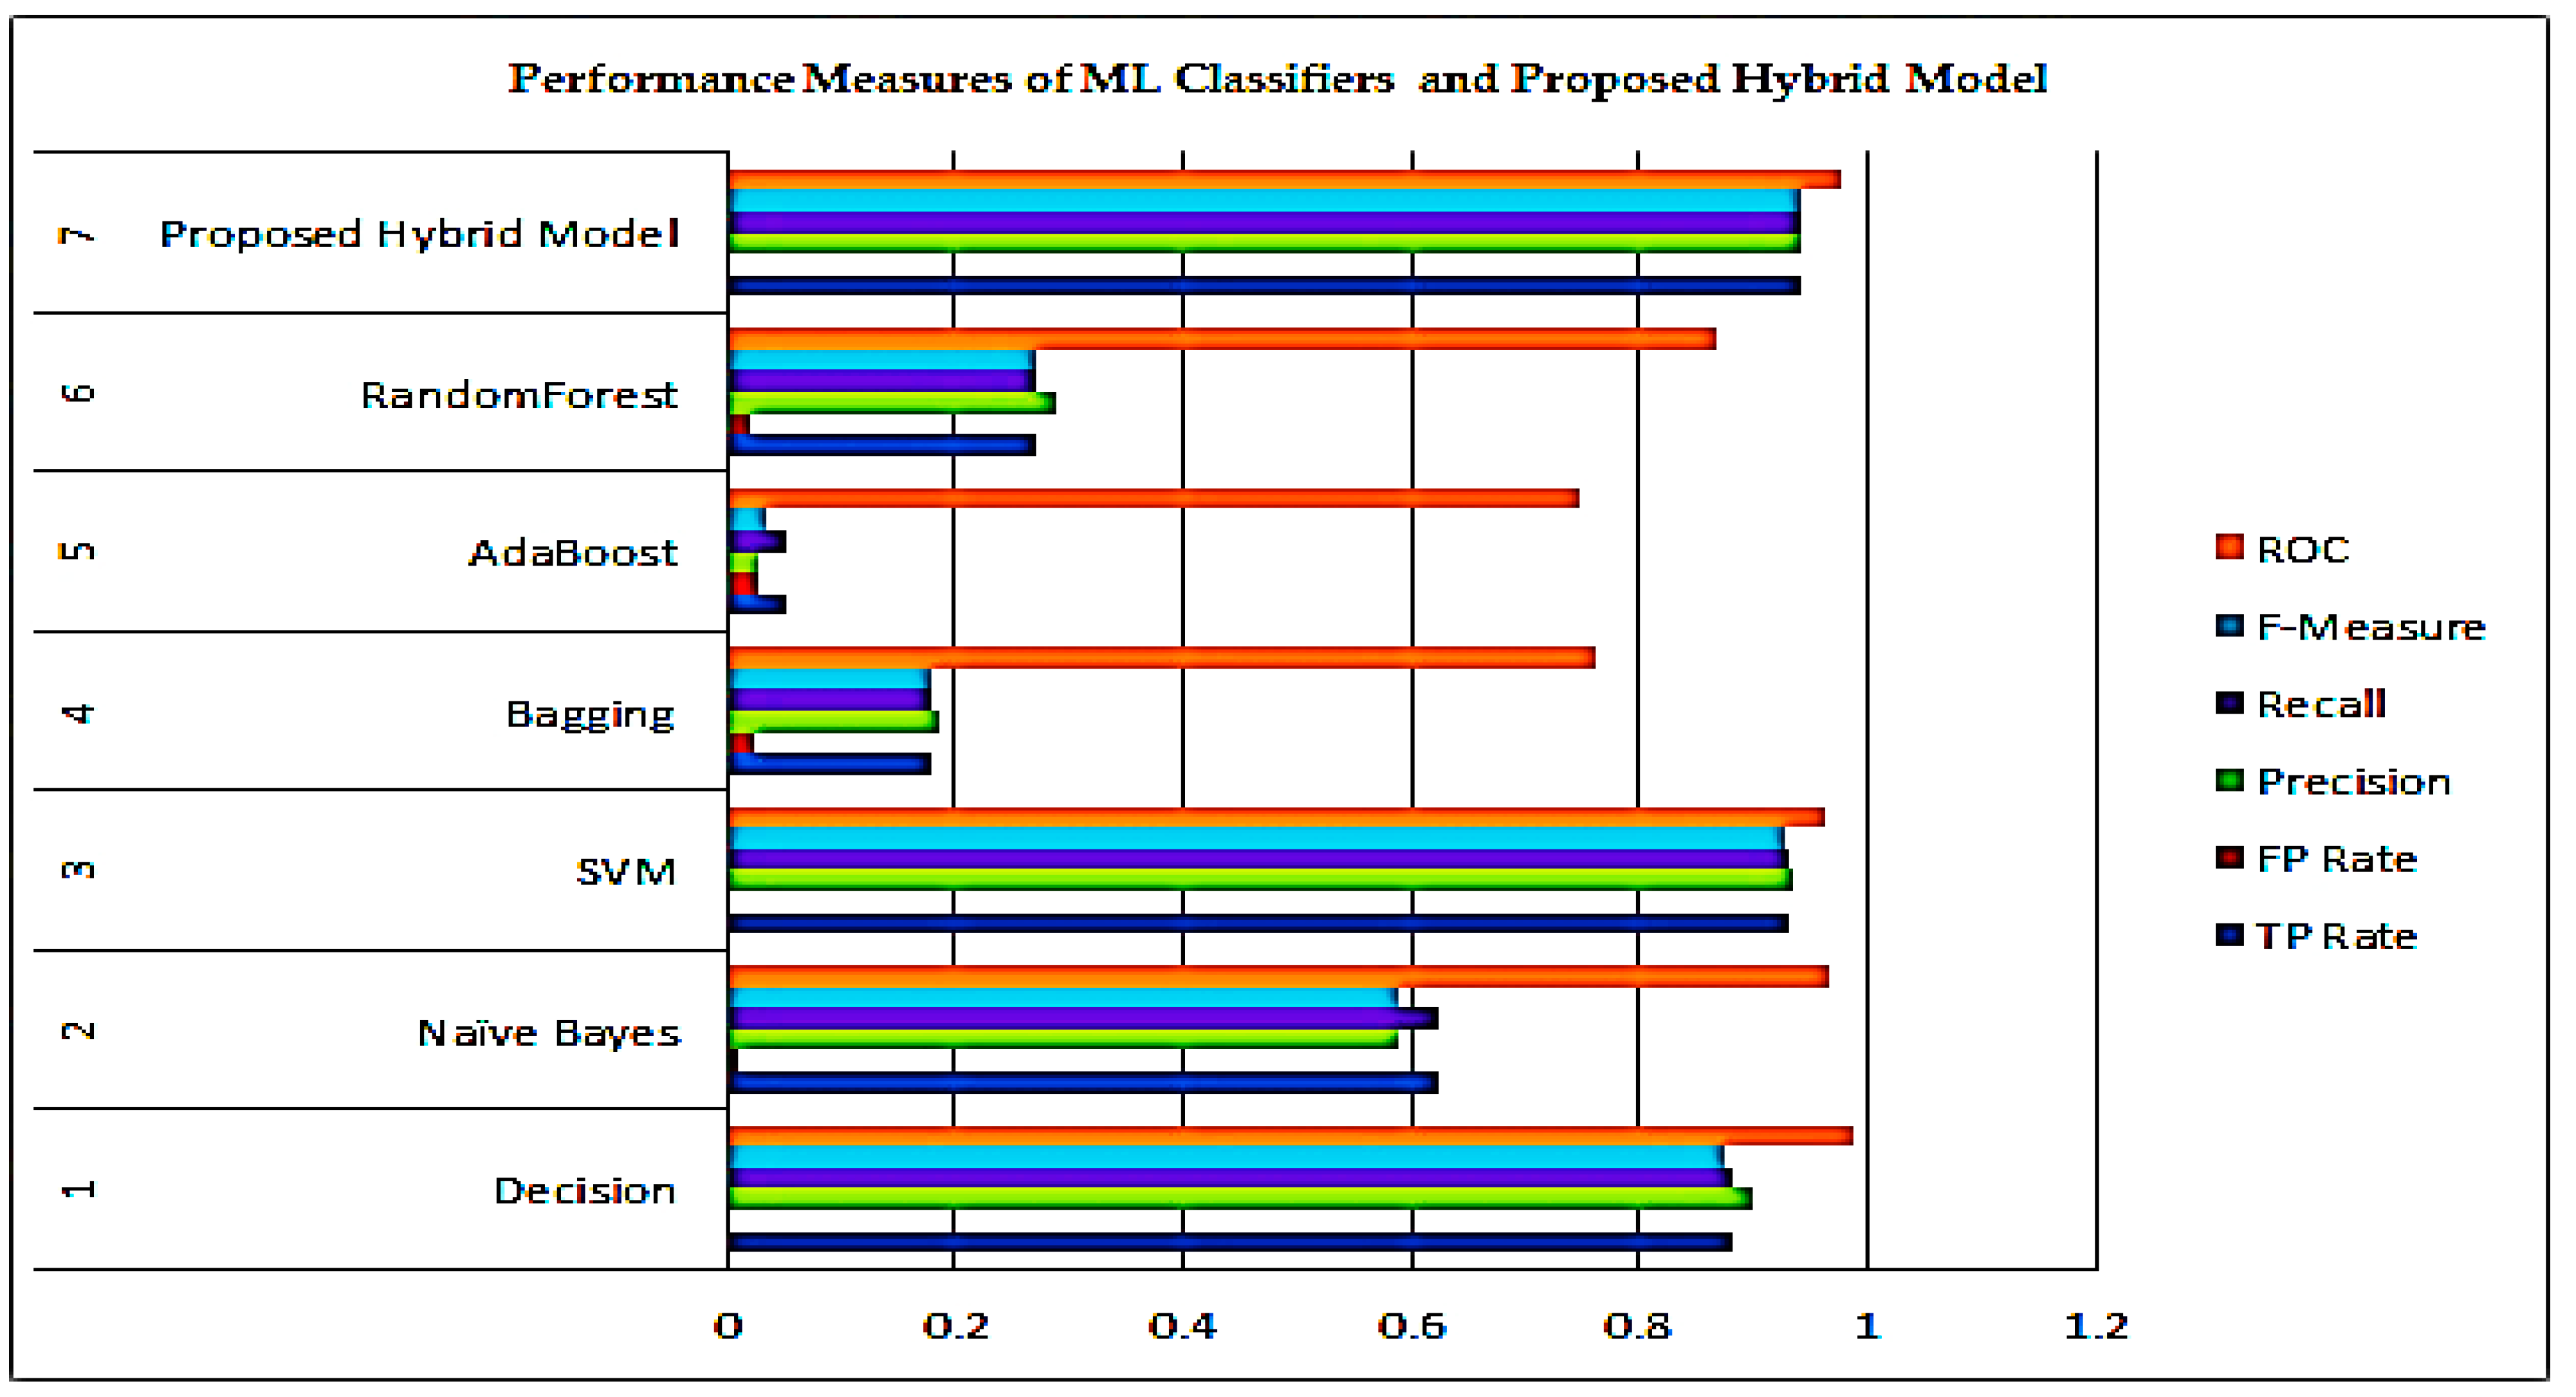
| ML Classifier | TP Rate | FP Rate | Precision | Recall | F-Measure | ROC |
|---|---|---|---|---|---|---|
| Decision | 0.88 | 0.003 | 0.899 | 0.88 | 0.876 | 0.989 |
| Naïve Bayes | 0.623 | 0.011 | 0.588 | 0.623 | 0.587 | 0.968 |
| SVM | 0.93 | 0.002 | 0.934 | 0.93 | 0.929 | 0.964 |
| Bagging | 0.179 | 0.023 | 0.187 | 0.179 | 0.180 | 0.761 |
| AdaBoost | 0.052 | 0.027 | 0.026 | 0.052 | 0.034 | 0.747 |
| RandomForest | 0.269 | 0.021 | 0.290 | 0.269 | 0.271 | 0.866 |
| Proposed Model | 0.940 | 0.002 | 0.941 | 0.940 | 0.940 | 0.978 |
Publisher’s Note: MDPI stays neutral with regard to jurisdictional claims in published maps and institutional affiliations. |
© 2022 by the authors. Licensee MDPI, Basel, Switzerland. This article is an open access article distributed under the terms and conditions of the Creative Commons Attribution (CC BY) license (https://creativecommons.org/licenses/by/4.0/).
Share and Cite
Guleria, P.; Ahmed, S.; Alhumam, A.; Srinivasu, P.N. Empirical Study on Classifiers for Earlier Prediction of COVID-19 Infection Cure and Death Rate in the Indian States. Healthcare 2022, 10, 85. https://doi.org/10.3390/healthcare10010085
Guleria P, Ahmed S, Alhumam A, Srinivasu PN. Empirical Study on Classifiers for Earlier Prediction of COVID-19 Infection Cure and Death Rate in the Indian States. Healthcare. 2022; 10(1):85. https://doi.org/10.3390/healthcare10010085
Chicago/Turabian StyleGuleria, Pratiyush, Shakeel Ahmed, Abdulaziz Alhumam, and Parvathaneni Naga Srinivasu. 2022. "Empirical Study on Classifiers for Earlier Prediction of COVID-19 Infection Cure and Death Rate in the Indian States" Healthcare 10, no. 1: 85. https://doi.org/10.3390/healthcare10010085