I. Introduction
This paper investigates the effects of the COVID-19 pandemic on the Chinese energy stock market. The unexpected COVID-19 pandemic not only has been disrupting the world and threatening human lives, but also has significant social and economic consequences (Narayan, 2021). The pandemic has led to financial market overreaction (Narayan et al., 2020) and reduced oil demand and oil prices (Narayan, 2020). However, a reduction in confirmed coronavirus cases can improve liquidity in financial markets (Haroon & Rizvi, 2020). Although previous studies have explored the consequences of the pandemic, research from the uncertainty viewpoint is limited.
Indeed, the COVID-19 health emergency has led to widespread uncertainty in health and economic recovery (Szczygielski et al., 2021). To study how uncertainty affects economic activities, studies have proposed numerous indicators, such as policy uncertainty, monetary policy uncertainty, and trade policy uncertainty (Gu et al., 2021). Despite this, macroeconomic uncertainty is believed to be an essential source of business cycle fluctuations (Shi & Shen, 2021), and the literature that studies the uncertainty resulting from public health concerns is scarce. The sense of uncertainty can even be an underlying mechanism through which the pandemic undermines economic activities. We thus use the uncertainty index constructed by Narayan et al. (2021) to analyze how sentiment about COVID-19 uncertainty impacts the economy.
In studying the influence of uncertainty on economic activities, we focus on the energy industry, due to its crucial role in the global economy. More precisely, we explore the reaction of the Chinese energy market to pandemic-related uncertainty. The rationale is that stock prices should reflect all information at a given time, consistent with Fama’s (1970) efficient market hypothesis. In addition, the volatility in the stock market should reflect investors’ expectations in terms of future profitability (Breinlich et al., 2018). In this regard, the financial market would have responded promptly to the outbreak of the pandemic as it incorporated new information emanating from the shock. Therefore, we hypothesize that the sentiment captured by COVID-19 uncertainty reduces Chinese energy stock prices.
To verify our hypothesis, we examine the relation between the uncertainty index (Uncertainty), the Chinese stock market index (CSI 300), and the Chinse energy stock market index (SZESI). Specifically, we use a structural vector autoregressive (SVAR) model to analyze the dynamic interactions between these variables. Our results show that uncertainty during the pandemic has negatively impacted energy stock prices, and the impulse response suggests that the Chinese energy market is more vulnerable than the Chinese stock market. To establish the robustness of our findings, we use the CSI 1000 as an alternative proxy for the Chinese stock market and find consistent results.
The contributions of our findings are twofold. First, we add to the literature that studies the influences of the COVID-19 pandemic on the financial market from an energy market perspective (for a survey of this literature, see Narayan (2020)). Second, we use a novel index and study the influence of the pandemic from the perspective of uncertainty. Because no other studies have utilized this COVID-19 uncertainty index recently developed by Narayan et al. (2021), it allows us to draw fresh insights into the role of uncertainty in influencing energy prices.
The remainder of the paper proceeds as follows. Section II presents the data and methodology. Section III discusses the results. The concluding remarks are provided in the final section.
II. Data and Methodology
A. Data
This study uses the China Shanghai–Shenzhen 300 index (CSI300), which consists of the 300 largest and most liquid A-share stocks, to proxy for the Chinese stock market. To depict the fluctuations in the energy market, we retrieve the energy index reported by Shenzhen Stock Exchange (SZESI), an index that represents the Chinese energy market. For the COVID-19 uncertainty measure, we use the uncertainty index compiled by Narayan et al. (2021). Specifically, their indicator is constructed based on counts of words related to uncertainty and risk as reported in 45 global newspapers. Our final sample comprises of time-series data from December 31, 2019, to April 28, 2021, as shown in Panel A of Table 1.
B. SVAR
To examine the relation between COVID-19 uncertainty and the energy stock market, we adopt the SVAR model, which has been widely used in energy research (Chen et al., 2016). Specifically, we define a vector of three variables, denoted as Then the SVAR model is established as follows:
Yt=p∑i=1AiYt−i+Aut
AUt=Bԑt
where denotes the percentage change in the uncertainty index, the Chinese A-share stock index, and the energy stock index, respectively; is the unknown coefficient matrix to be estimated; and and are forecast errors and structural shocks for respectively. Therefore, the structural model with imposed restrictions in the A and B matrices are written as
[100a2110a31a321][UncertaintyCSI300SZESI]=[b11000b22000b33][ԐUncertaintyԐCSI300ԐSZESI]
Uncertainty=b11ԐUncertainty
CSI300=−a21Uncertainty+b22ԐCSI300
SZESI=−a31Uncertainty−a32CSI300+b33ԐSZESI
In this case, and reflect the influence of uncertainty and CSI 300 on SZESI, respectively, whereas reveals the effect of uncertainty on CSI 300. Considering that the variable Uncertainty is not stationary and does not meet the requirements for using the SVAR model, we conduct first differences on it. The descriptive statistics of all the variables are reported in Panel A of Table 1.
III. Results and Discussion
A. Coefficients of the A and B matrices
Panel B of Table 1 presents the results of our estimation. It is worth mentioning that we use information criteria to determine the optimal lag order, which is presented in Part I of Table 1, Panel B. The coefficients indicate that uncertainty in the COVID-19 pandemic exerts a negative shock on both the A-share market and the energy stock market, and the fluctuations in energy market are positively related to those of the A-share market. Specifically, a one standard deviation in the uncertainty shock induces a 1.07% reduction in the energy stock price.
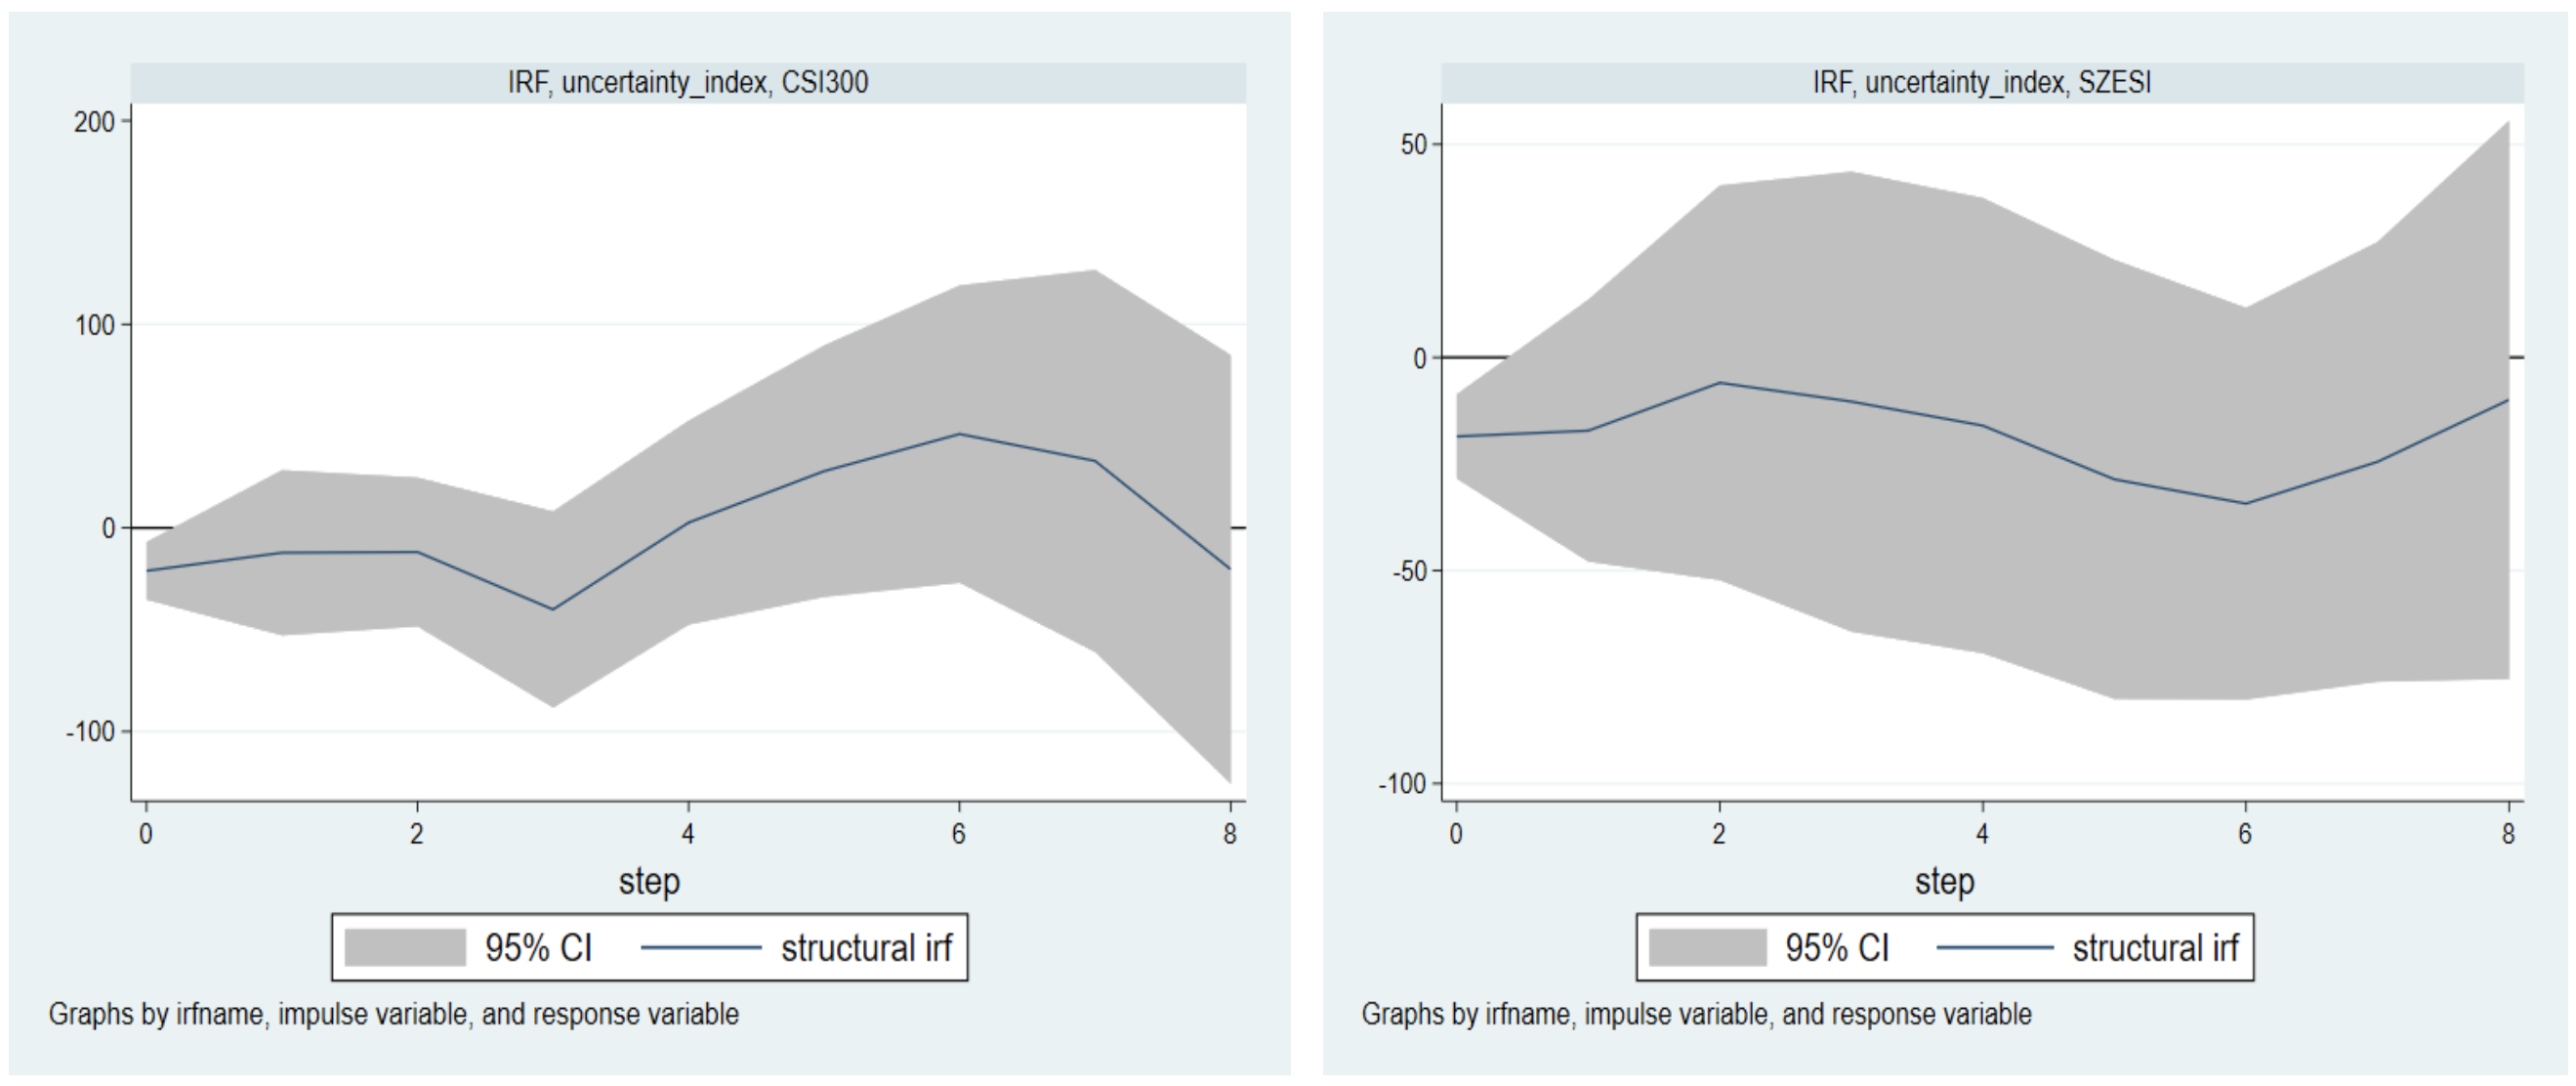
B. Impulse Response Function
Furthermore, we analyze the impulse responses of COVID-19 uncertainty on the energy stock market and the Chinese A-share market. Figure 1 presents the impulse response results from standard deviation shocks to uncertainty. The stock prices of both markets react negatively to the unexpected shock, and we note that the A-share stock market seems to be more resilient to the uncertainty than its energy counterpart, which takes longer to recover from the adverse impacts.

C. Robustness Checks
In this section, we conduct a robustness test to ensure that our results are credible. Specifically, we replace the CSI 300 index with the CSI 1000, an alternative proxy for Chinese stock prices. This analysis yields results similar to those presented in Table 2. In other words, the negative effects of COVID-19 uncertainty on the energy market and the A-share market continue to hold, strengthening our confidence that our baseline results are robust.
IV. Conclusion
This study investigates the relation between the uncertainty due to COVID-19 and the Chinese stock and energy markets during the COVID-19 pandemic. The empirical analysis is based on an SVAR framework. Our findings suggest that uncertainty leads to a significant drop in the prices of both the energy and stock markets. The impulse response analysis reveals that the adverse effect of uncertainty is more persistent in the energy market. The implication is that the massive spike in uncertainty during the pandemic has potentially triggered volatility in the financial market, and the energy stock market seem to be more vulnerable. This claim should be further verified using different approaches. We leave this for future studies.