A Novel Approach to the Bioluminescent Detection of the SARS-CoV-2 ORF1ab Gene by Coupling Isothermal RNA Reverse Transcription Amplification with a Digital PCR Approach


Abstract
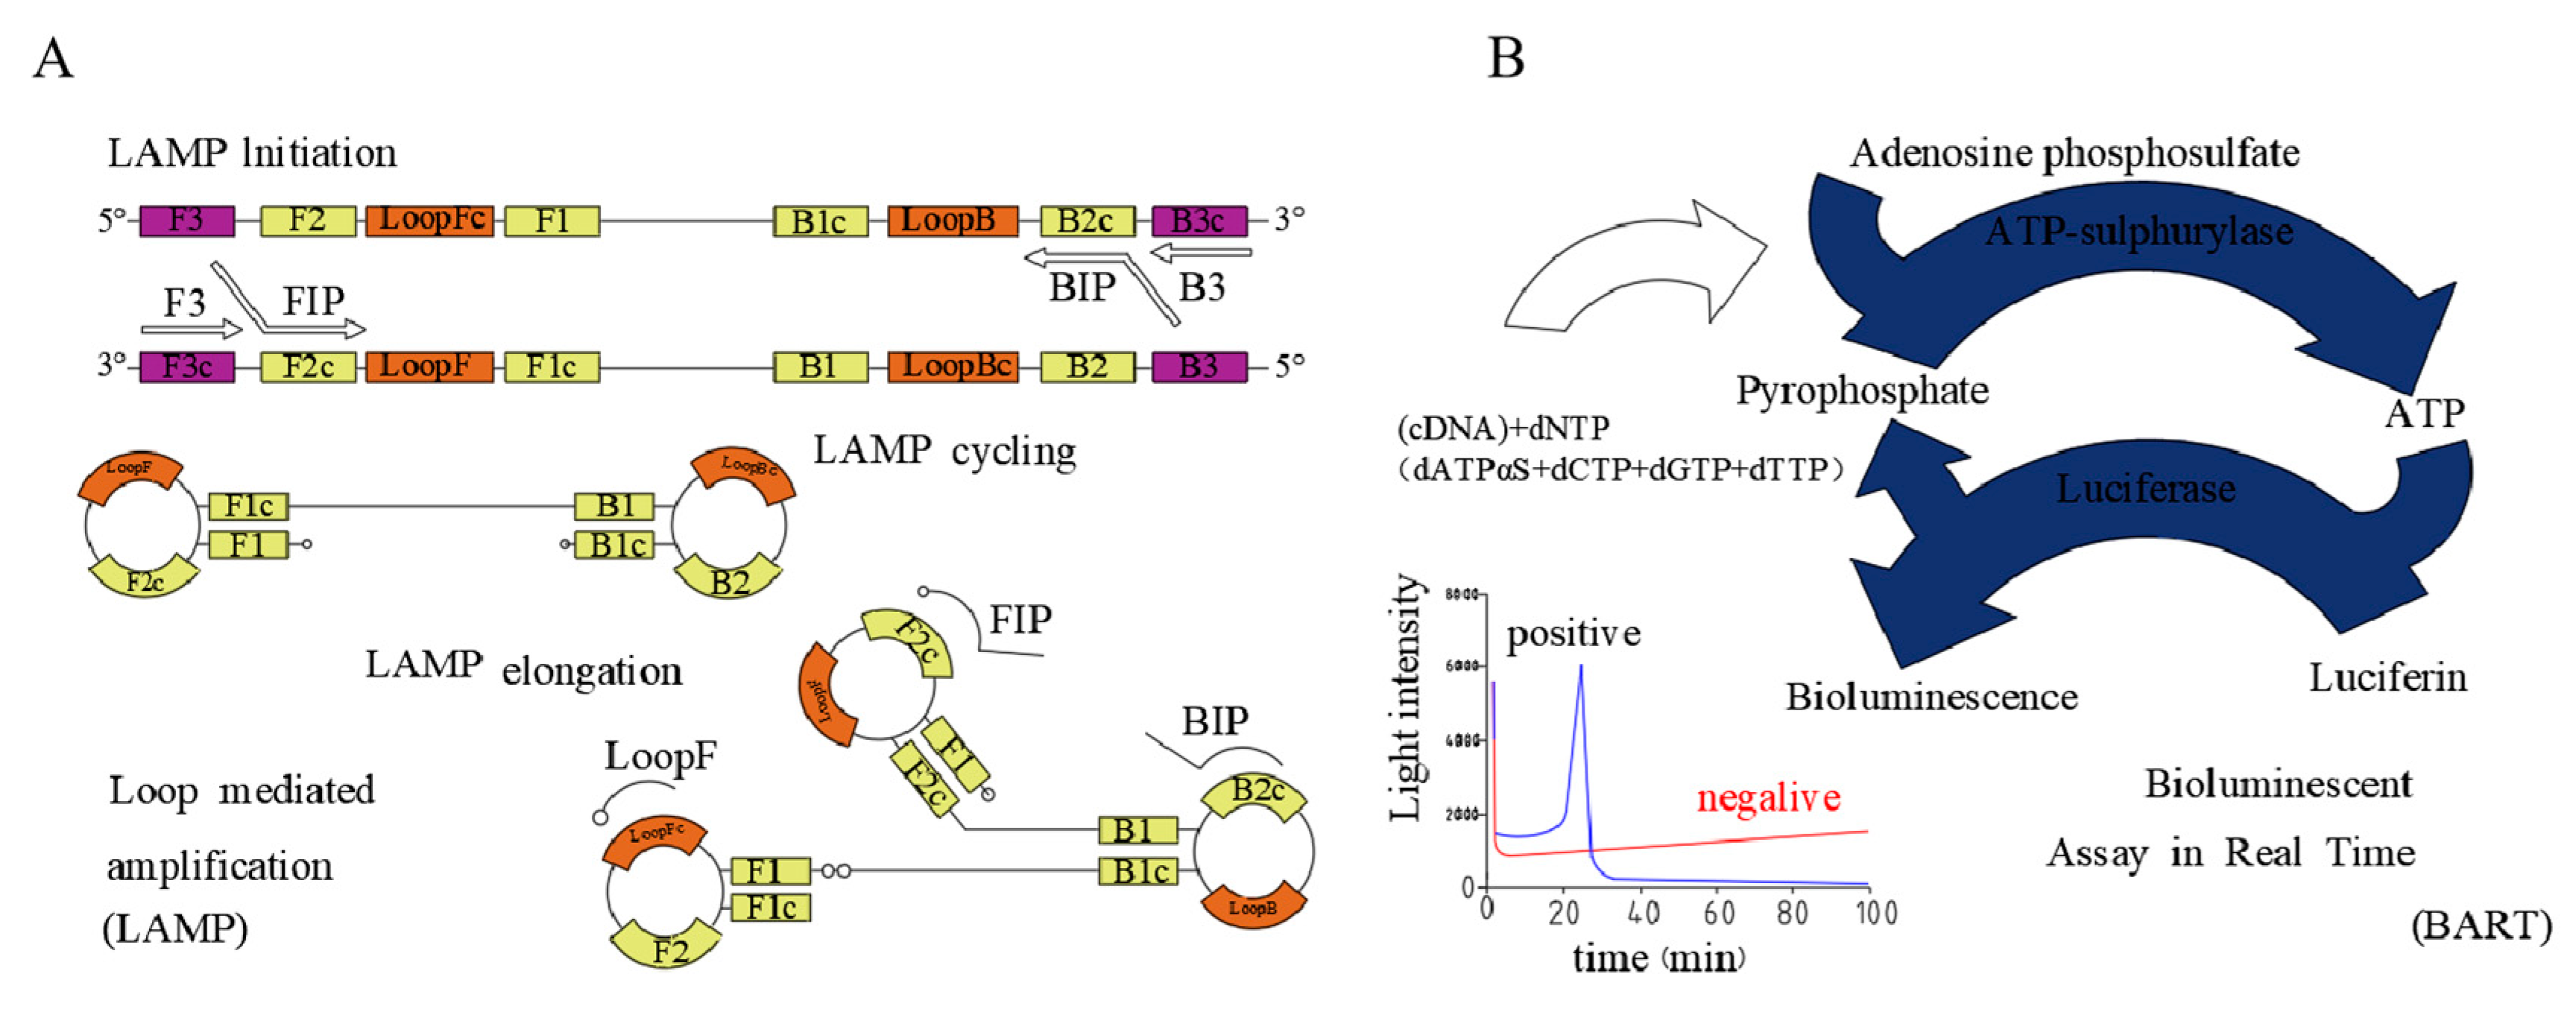
:1. Introduction
2. Results and Discussion
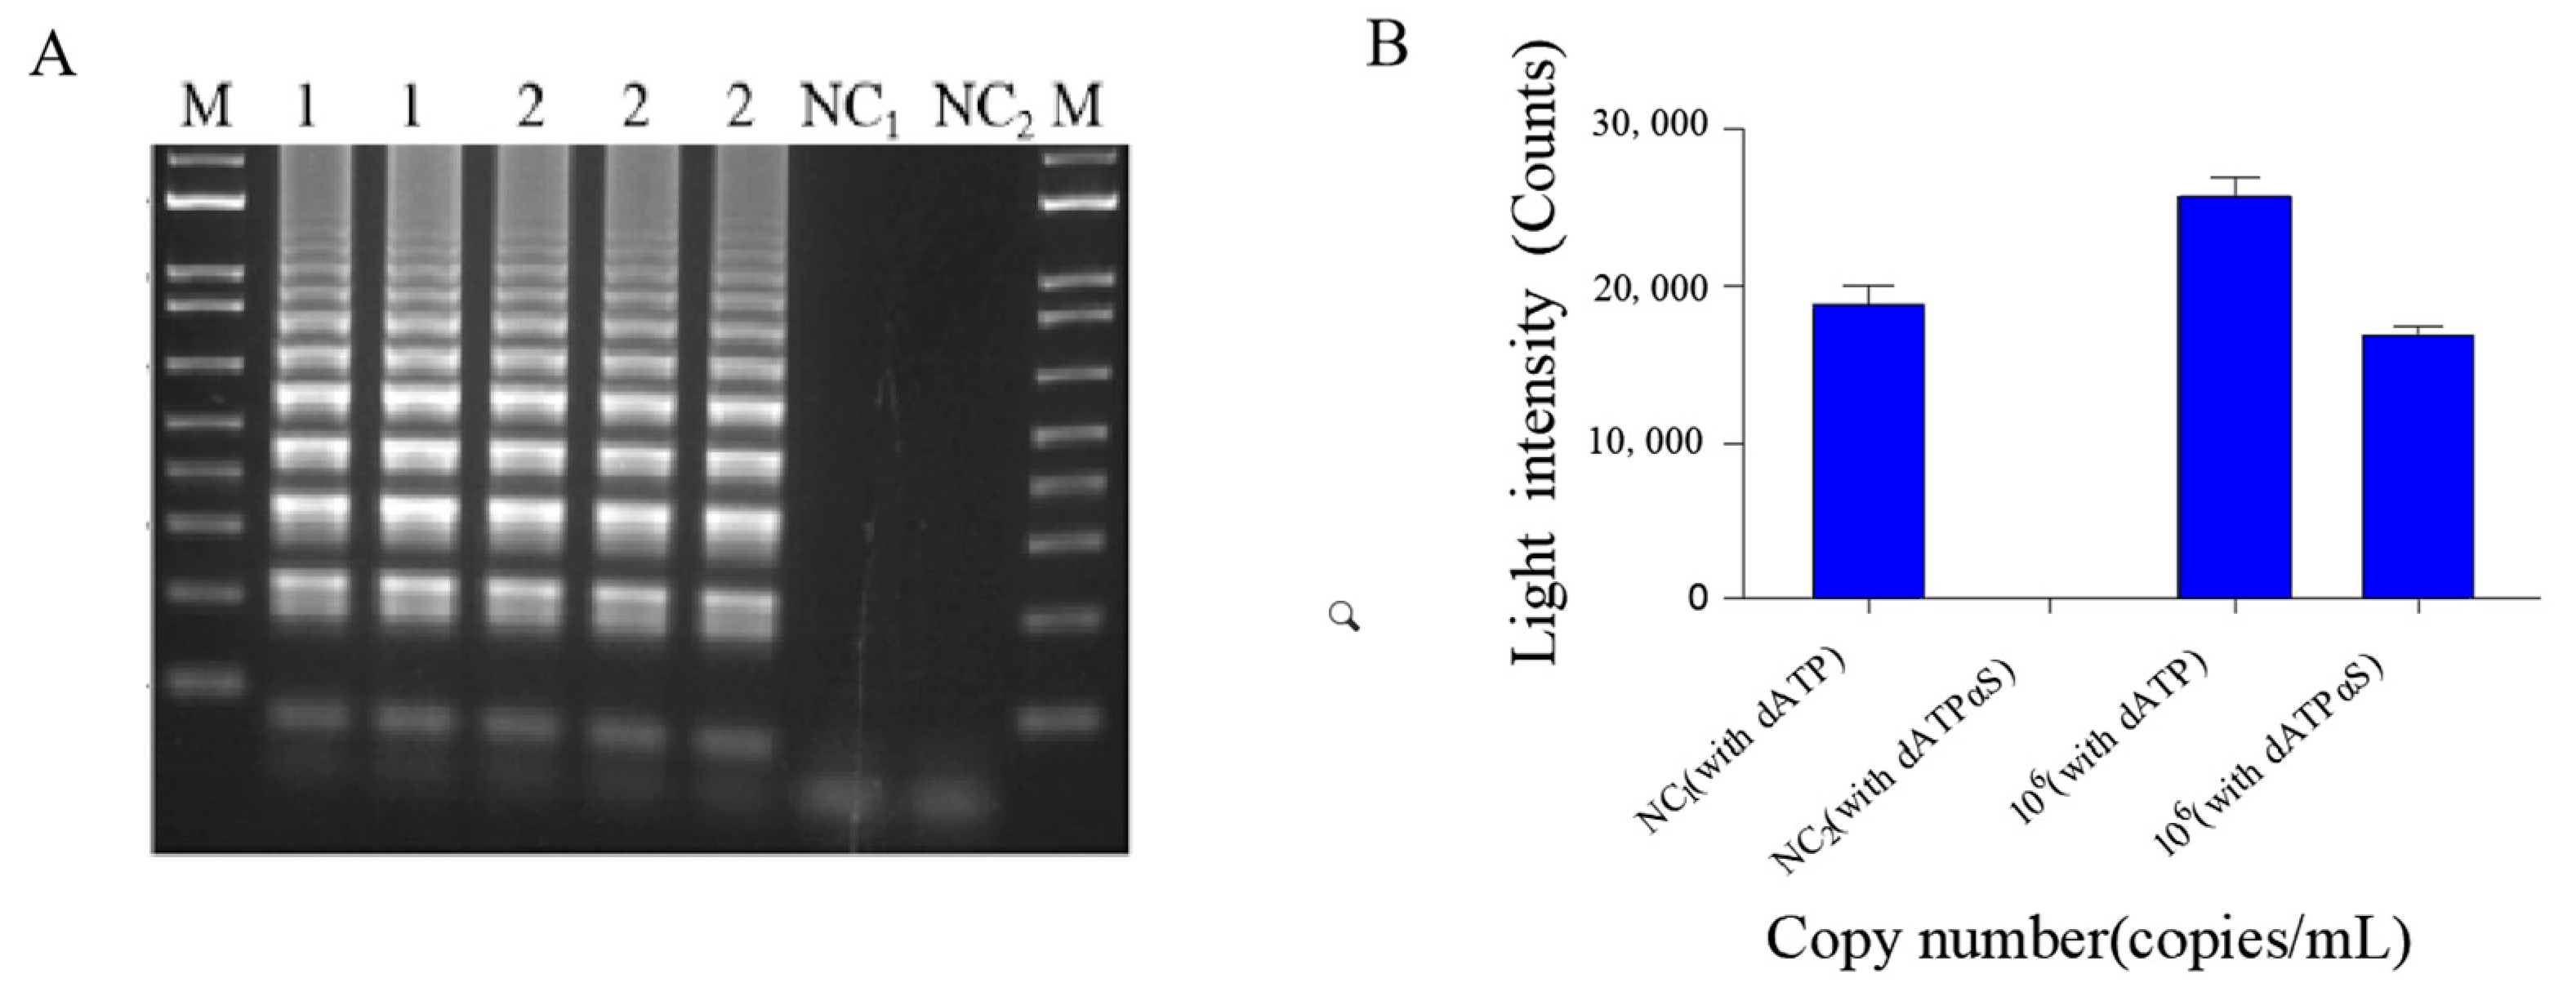
2.1. The Relative Feasibility of Using dATPαS Instead of dATP in RT-LAMP Reactions
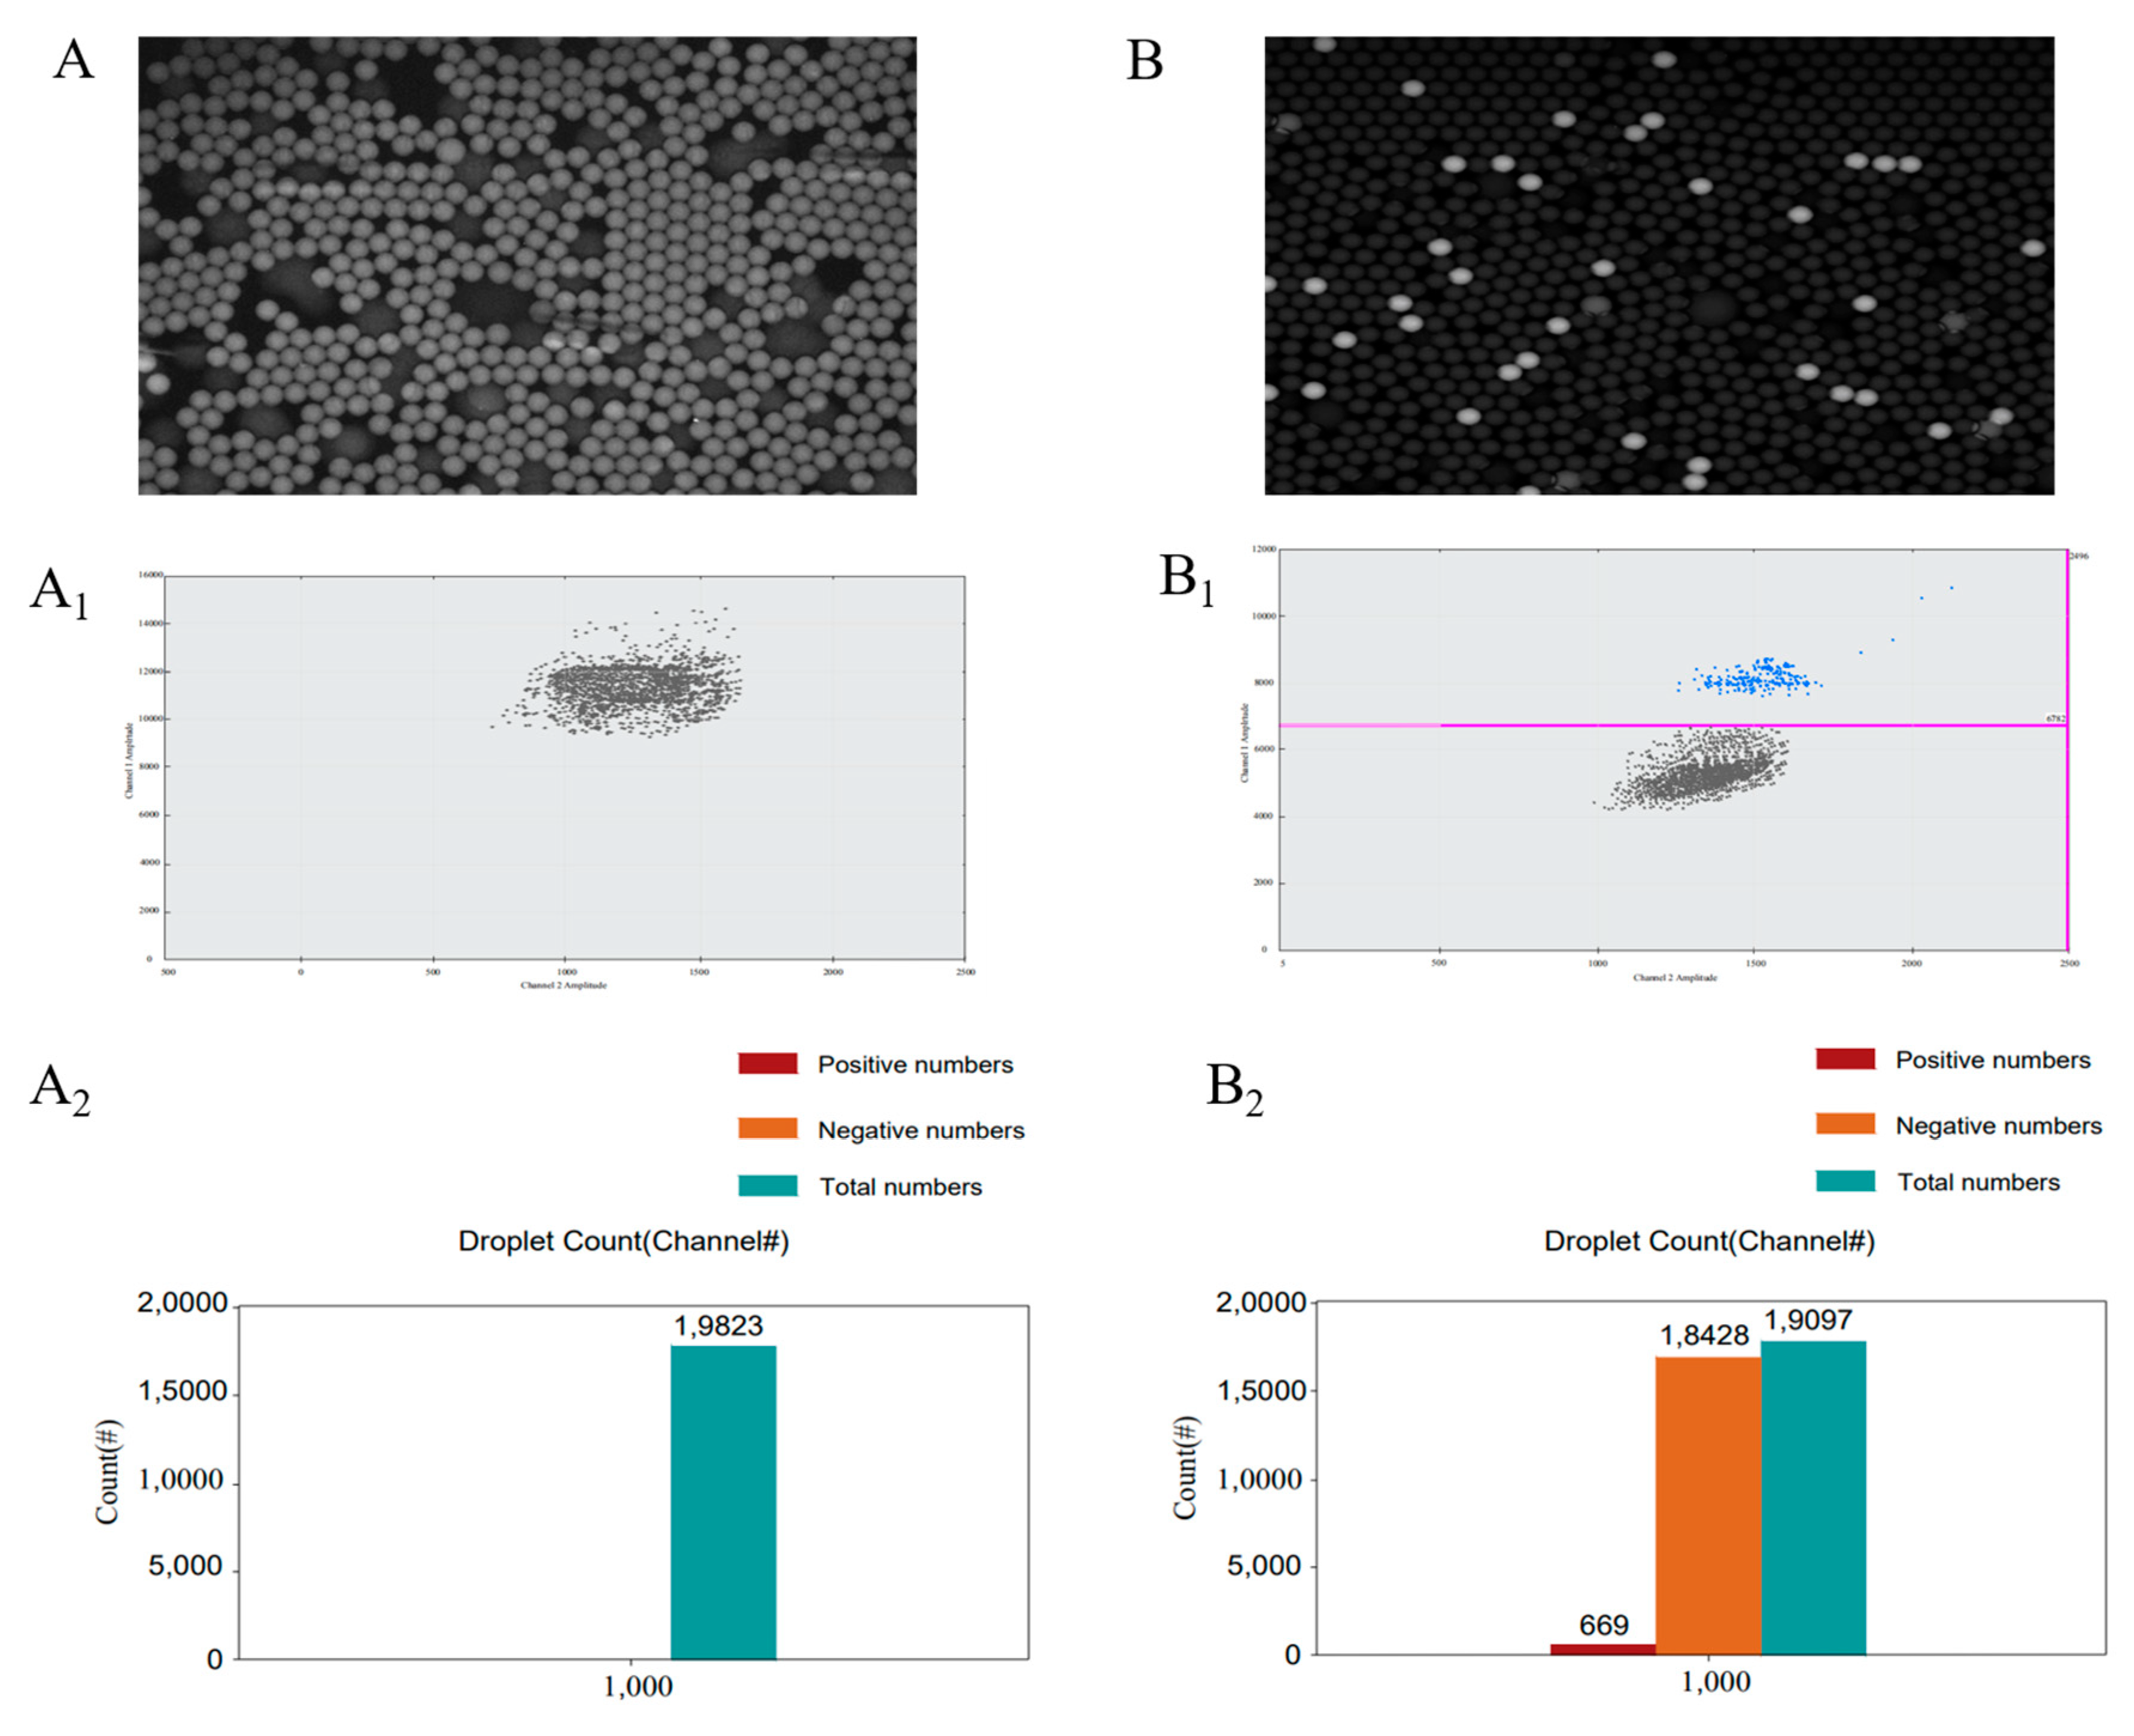
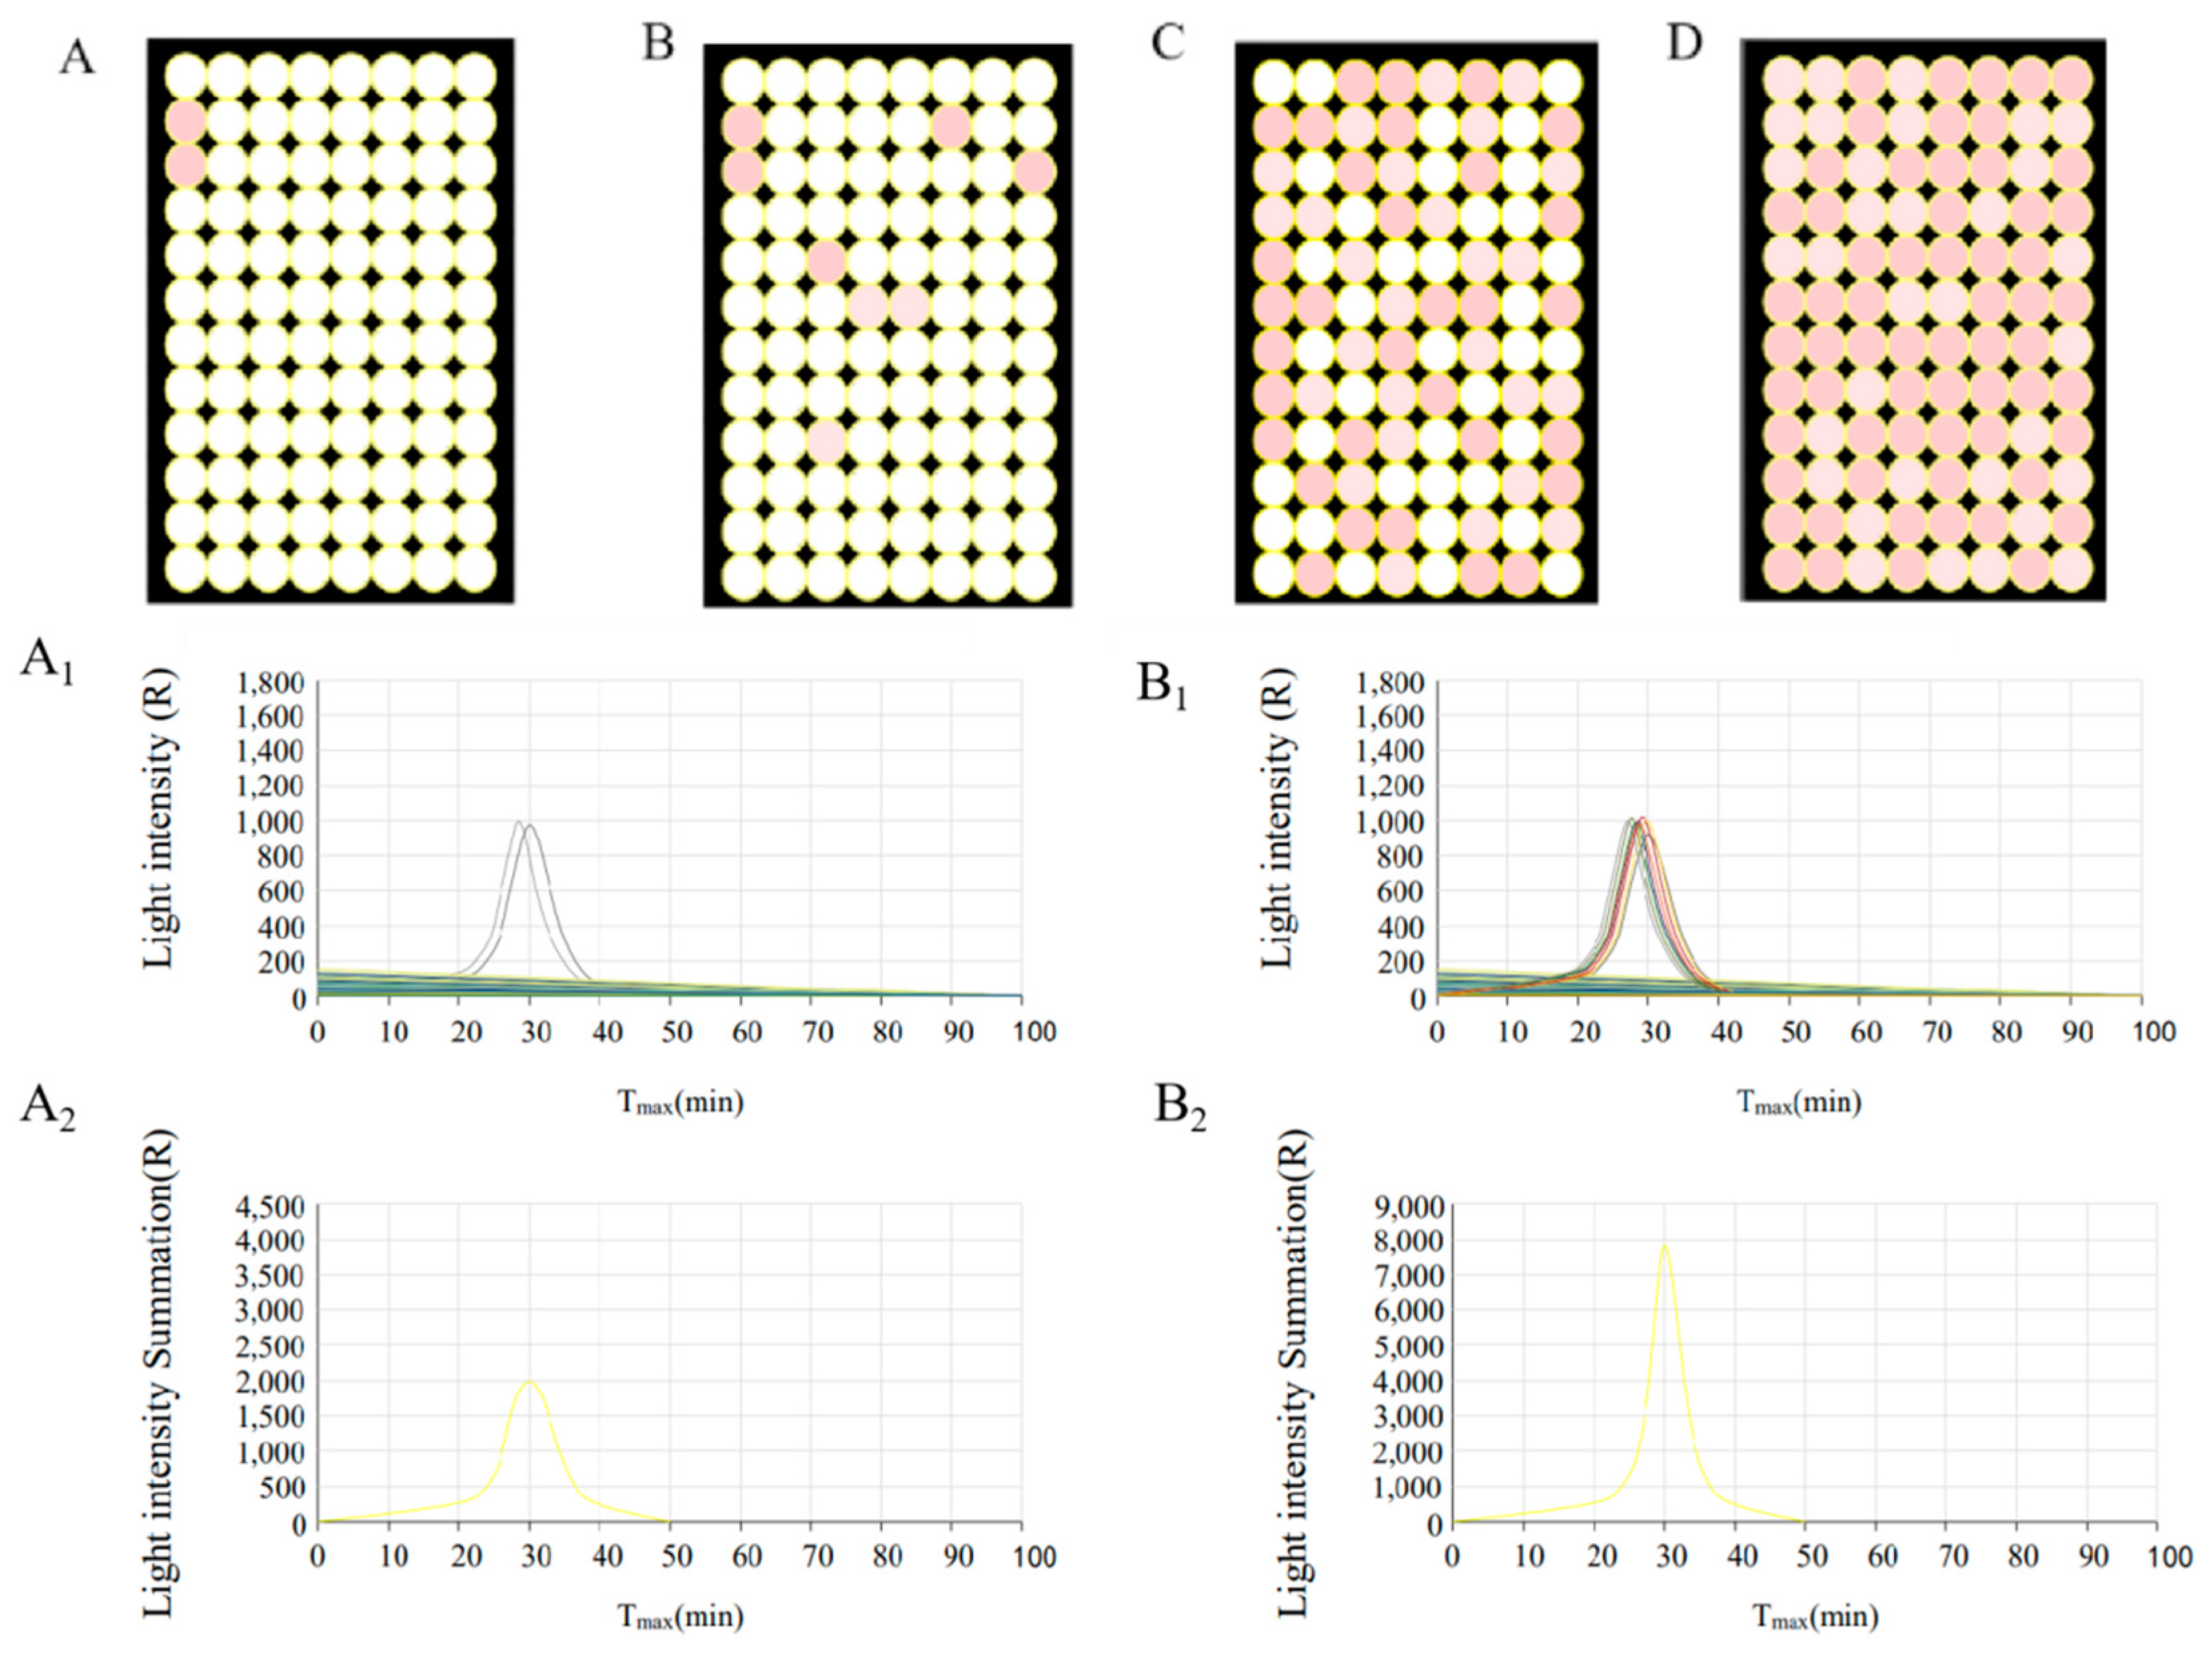
2.2. Assessment of a Digital RT-LAMP-BART Assay Approach
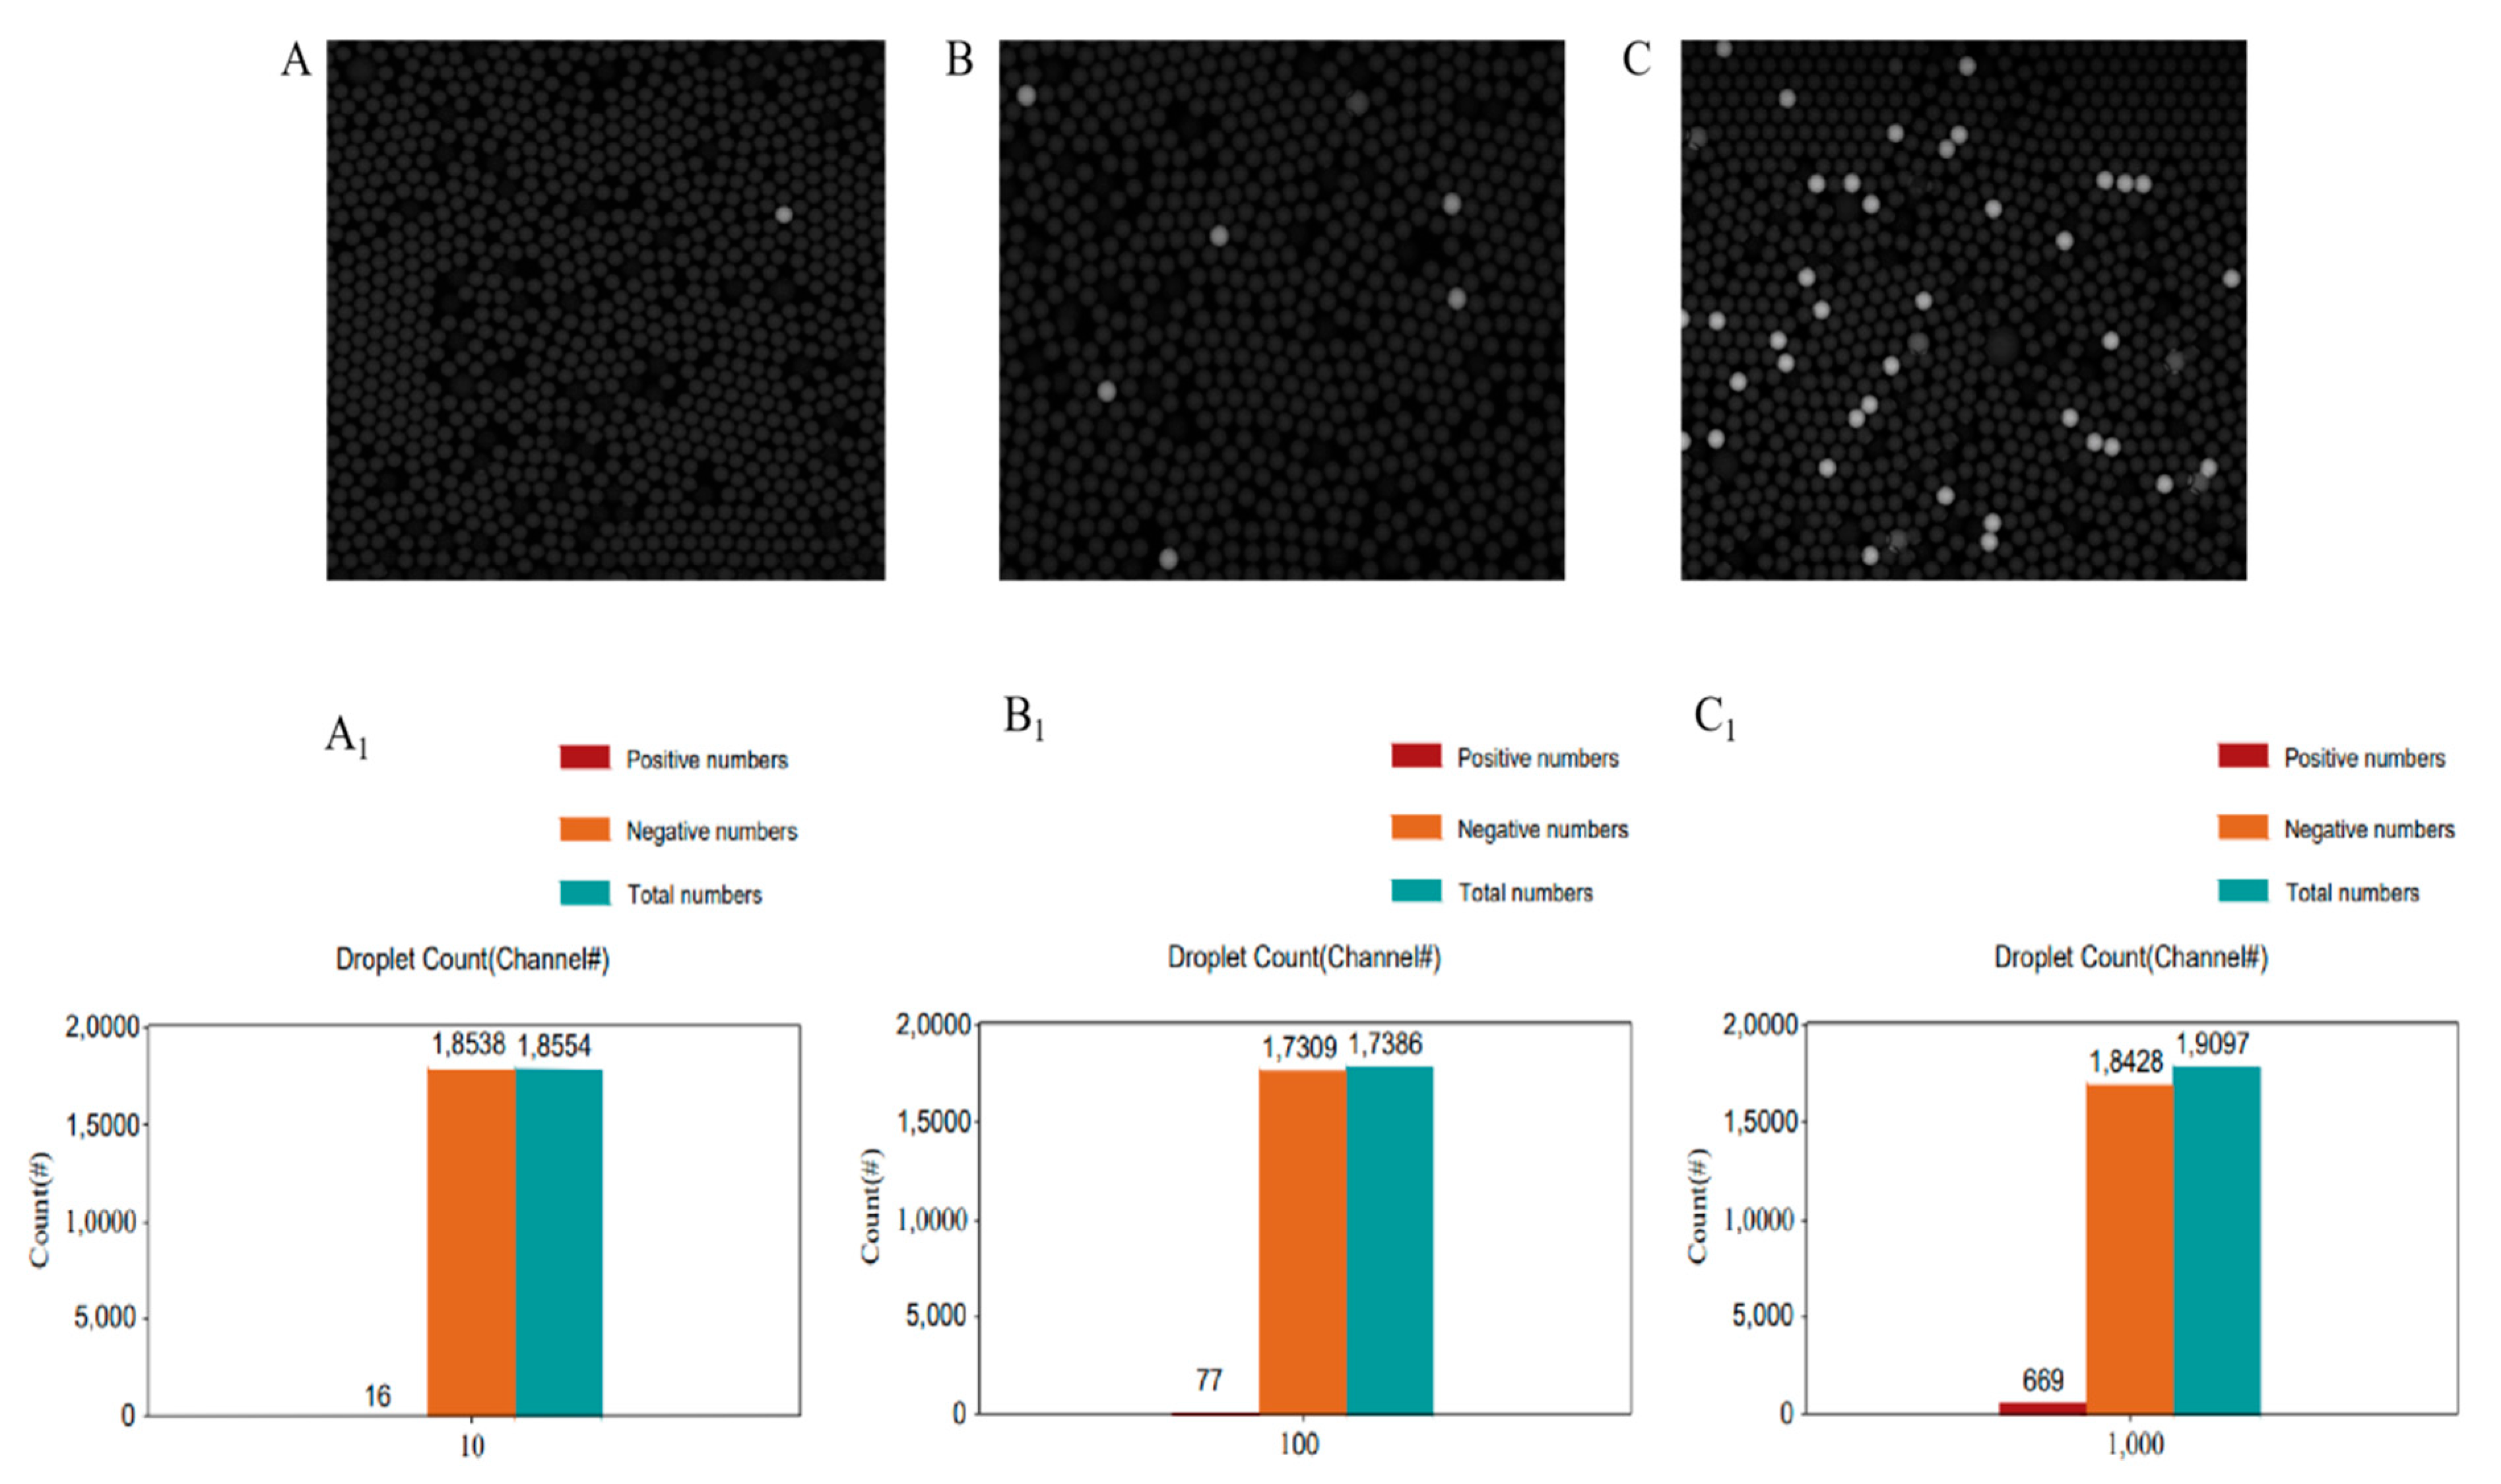
2.3. Assessment of Bioluminescent Signal-Based Quantification in a Simulated Digital RT-LAMP Assay
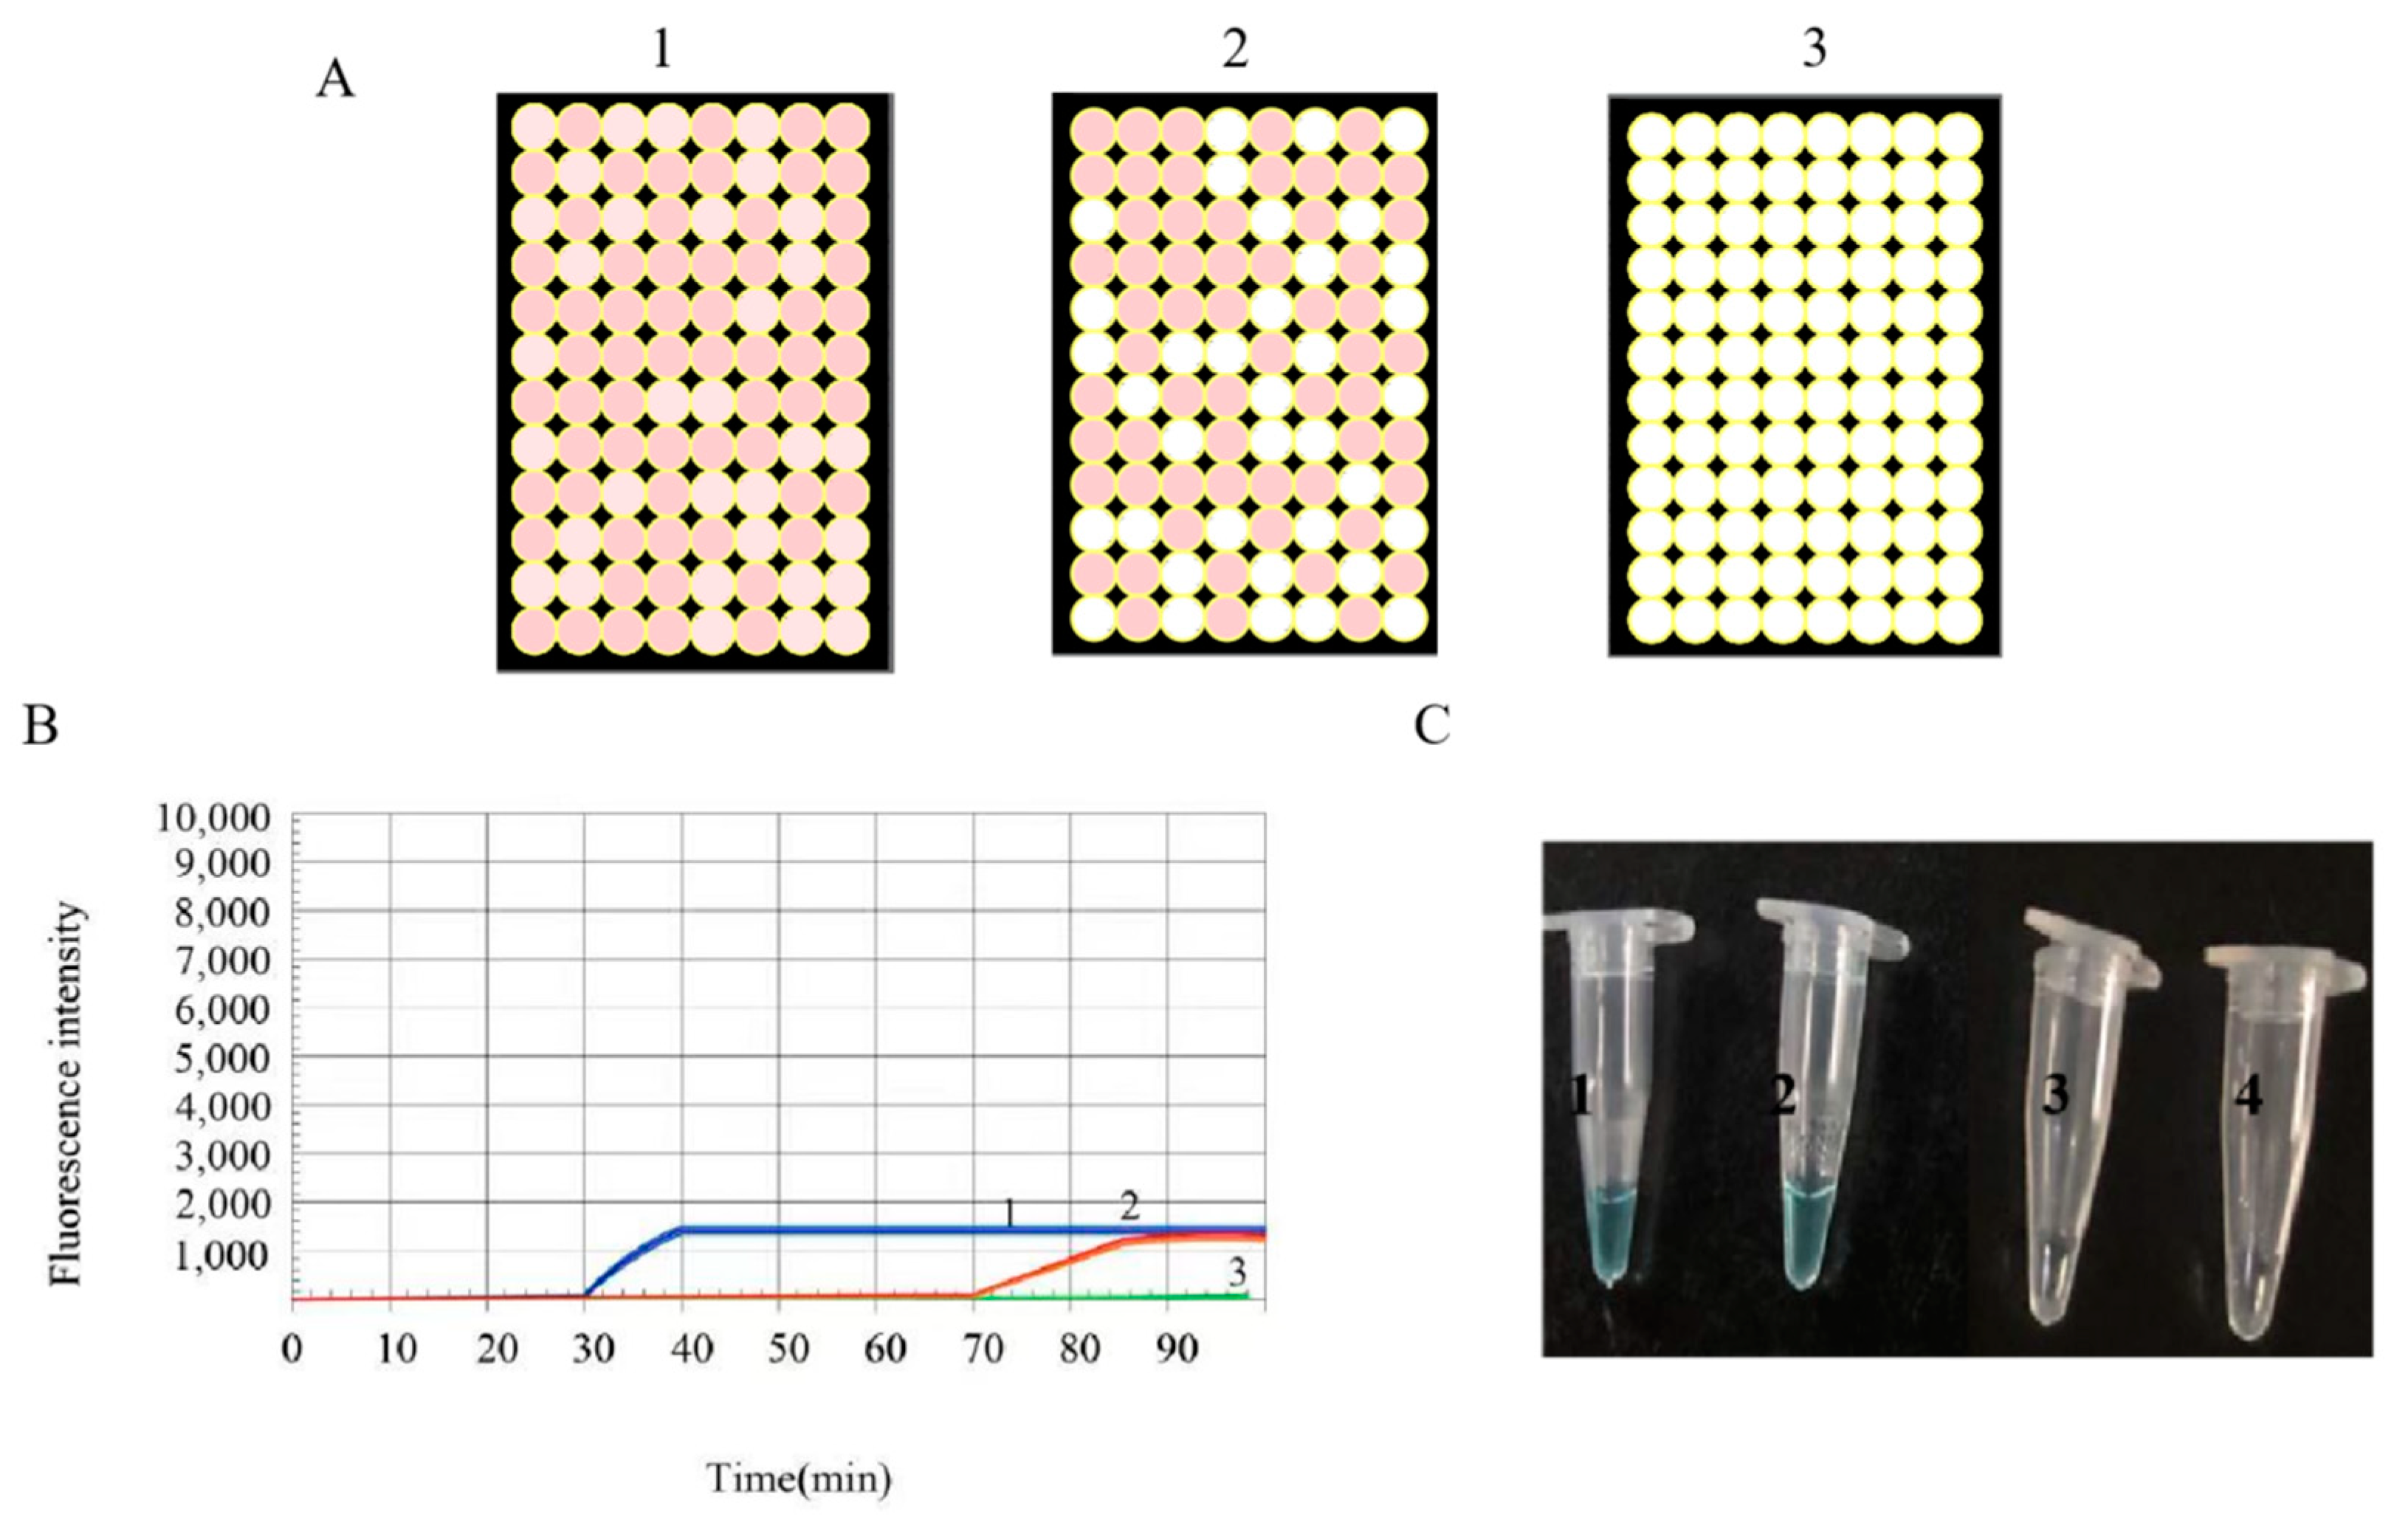
2.4. Assessment of Bioluminescent Signal-Based Quantification in a Simulated Digital RT-LAMP Assay as Verified with a SARS-CoV-2 Orf1ab Visual RT-LAMP Kit
2.5. The Specificity and Assessments of Bioluminescent Signal-Based Quantification in a Simulated Digital RT-LAMP Assay as Verified with RT-qPCR
3. Materials and Methods
3.1. Reagents
3.2. Template and RNA Gradient Preparation
3.3. Primer Design
3.4. The Feasibility of RT-LAMP Assay
3.5. RT-LAMP Bioluminescent Reagent Preparation
3.6. SARS-CoV-2 ORF1ab Gene Detection
3.6.1. Bioluminescent Signal-Based Digital LAMP
3.6.2. Bioluminescent Signal-Based Simulated Digital LAMP
3.7. Simulated Digital LAMP Validation Using SARS-CoV-2 Orf1ab Visual RT-LAMP Kits
3.8. The Specificity and Assessments of the Simulated Digital LAMP
4. Conclusions
Author Contributions
Funding
Institutional Review Board Statement
Informed Consent Statement
Data Availability Statement
Acknowledgments
Conflicts of Interest
References
- Hui, D.S.; Azhar, E.I.; Madani, T.A.; Ntoumi, F.; Kock, R.; Dar, O.; Ippolito, G.; Mchugh, T.D.; Memish, Z.A.; Drosten, C.; et al. The continuing 2019-nCoV epidemic threat of novel coronaviruses to global health-The latest 2019 novel coronavirus outbreak in Wuhan, China. Int. J. Infect. Dis. 2020, 91, 264–266. [Google Scholar] [CrossRef] [PubMed] [Green Version]
- Malik, Y.S.; Sircar, S.; Bhat, S.; Sharun, K.; Dhama, K.; Dadar, M.; Tiwari, R.; Chaicumpa, W. Emerging novel coronavirus (2019-nCoV)-Current scenario, evolutionary perspective based on genome analysis and recent developments. Vet. Q. 2020, 40, 68–76. [Google Scholar] [CrossRef] [PubMed]
- Zhang, N.; Wang, L.; Deng, X.; Liang, R.; Su, M.; He, C.; Hu, L.; Su, Y.; Ren, J.; Yu, F.; et al. Recent advances in the detection of respiratory virus infection in humans. J. Med. Virol. 2020, 92, 408–417. [Google Scholar] [CrossRef] [PubMed]
- Esbin, M.N.; Whitney, O.N.; Chong, S.; Maurer, A.; Darzacq, X.; Tjian, R. Overcoming the bottleneck to widespread testing: A rapid review of nucleic acid testing approaches for COVID-19 detection. RNA 2020, 26, 771–783. [Google Scholar] [CrossRef]
- Service, R.F. Fast, cheap tests could enable safer reopening. Science 2020, 369, 608–609. [Google Scholar] [CrossRef]
- Obande, G.A.; Singh, K.K.B. Current and future per-spectives on isothermal nucleic acid amplification technologies for diagnosing infections. Infect. Drug Resist. 2020, 13, 455–483. [Google Scholar] [CrossRef] [Green Version]
- Metsky, H.C.; Freije, C.A.; Kosoko-Thoroddsen, T.S.F.; Sabeti, P.C.; Myhrvold, C. CRISPR-based COVID-19 surveillance using a genomically-comprehensive machine learning approach. BioRxiv 2020. [Google Scholar] [CrossRef] [Green Version]
- Lucia, C.; Federico, P.B.; Alejandra, G.C. An ultrasensitive, rapid, and portable coronavirus SARS-CoV-2 sequence detection method based on CRISPR-Cas12. BioRxiv 2020. [Google Scholar] [CrossRef] [Green Version]
- Broughton, J.P.; Deng, X.; Yu, G.; Fasching, C.L.; Servellita, V.; Singh, J.; Miao, X.; Streithorst, J.A.; Granados, A.; Sotomayor-Gonzalez, A.; et al. CRISPR-Cas12-based detection of SARS-CoV-2. Nat. Biotechnol. 2020, 38, 870–874. [Google Scholar] [CrossRef] [Green Version]
- Teng, F.; Guo, L.; Cui, T.; Wang, X.G.; Xu, K.; Gao, Q.; Zhou, Q.; Li, W.C. Detection: CRISPR-Cas12b-based DNA detection with sub-attomolar sensitivity and single-base specificity. Genome Biol. 2019, 20, 132. [Google Scholar] [CrossRef]
- Schermer, B.; Fabretti, F.; Damagnez, M.; Di Cristanziano, V.; Heger, E.; Arjune, S.; Tanner, N.A.; Imhof, T.; Koch, M.; Ladha, A.; et al. Rapid SARS-CoV-2 testing in primary material based on a novel multiplex LAMP assay. MedRxiv 2020. [Google Scholar] [CrossRef] [PubMed]
- Notomi, T.; Okayama, H.; Masubuchi, H.; Yonekawa, T.; Watanabe, K.; Amino, N.; Hase, T. Loop-mediated isothermal amplification of DNA. Nucleic Acids Res. 2000, 28, e63. [Google Scholar] [CrossRef] [PubMed] [Green Version]
- Hardinge, P.; Murray, J.A.H. Reduced false positives and improved reporting of loop-mediated isothermal amplification using quenched fluorescent primers. Sci. Rep. 2019, 9, 7400. [Google Scholar] [CrossRef] [PubMed]
- Hardinge, P.; Kiddle, G.; Tisi, L.; Murray, J.A. Optimised LAMP allows single copy detection of 35Sp and NOSt in transgenic maize using bioluminescent assay in real time (BART). Sci. Rep. 2018, 8, 17590. [Google Scholar] [CrossRef] [PubMed]
- Kaneko, H.; Kawana, T.; Fukushima, E.; Suzutani, T. Tolerance of loop-mediated isothermal amplification to a culture medium and biological substances. J. Biochem. Biophys. Methods 2007, 70, 499–501. [Google Scholar] [CrossRef]
- Tani, H.; Teramura, T.; Adachi, K.; Tsuneda, S.; Kurata, S.; Nakamura, K.; Kanagawa, T.; Noda, N. Technique for quantitative detection of specific DNA sequences using alternately binding quenching probe competitive assay combined with loop-mediated isothermal amplification. Anal. Chem. 2007, 79, 5608–5613. [Google Scholar] [CrossRef]
- Kiddle, G.; Hardinge, P.; Buttigieg, N.; Gandelman, O.; Pereira, C.; McElgunn, C.J.; Rizzoli, M.; Jackson, R.; Appleton, N.; Moore, C.; et al. GMO detection using a bioluminescent real time reporter (BART) of loop mediated isothermal amplification (LAMP) suitable for field use. BMC Biotechnol. 2012, 12, 15. [Google Scholar] [CrossRef] [Green Version]
- Nagamine, K.; Watanabe, K.; Ohtsuka, K.; Hase, T.; Notomi, T. Loop-mediated isothermal amplification reaction using a nondena-tured template. Clin. Chem. 2001, 47, 1742–1743. [Google Scholar] [CrossRef] [Green Version]
- Nzelu, C.O.; Cáceres, A.G.; Guerrero-Quincho, S.; Tineo-Villafuerte, E.; Rodriquez-Delfin, L.; Mimori, T.; Uezato, H.; Katakura, K.; Gomez, E.A.; Guevara, A.G.; et al. A rapid molecular diagnosis of cutaneous leishmaniasis by colorimetric malachite green-loop-mediated isothermal amplification (LAMP) combined with an FTA card as a direct sampling tool. Acta Trop. 2016, 153, 116–119. [Google Scholar] [CrossRef]
- Asiello, P.J.; Baeumner, A.J. Miniaturized isothermal nucleic acid amplification, A review. Lab Chip 2011, 11, 1420–1430. [Google Scholar] [CrossRef]
- Fei, Z.; Zhou, D.; Li, N.; Xiao, P. New bioluminescence pyrophosphate assay for high-sensitivity detection of food-borne pathogens. Luminescence 2020, 35, 355–364. [Google Scholar] [CrossRef] [PubMed]
- Gandelman, O.A.; Church, V.L.; Moore, C.A.; Kiddle, G.; Carne, C.A.; Parmar, S.; Jalal, H.; Tisi, L.C.; Murray, J.A. Novel bioluminescent quantitative detection of nucleic acid amplification in real-time. PLoS ONE 2010, 5, e14155. [Google Scholar] [CrossRef] [PubMed]
- Fushimi, T.; Miura, N.; Shintani, H.; Tsunoda, H.; Kuroda, K.; Ueda, M. Mutant firefly luciferases with improved specific activity and dATP discrimination constructed by yeast cell surface engineering. Appl. Microbiol. Biotechnol. 2013, 97, 4003–4011. [Google Scholar] [CrossRef] [PubMed]
- Ronaghi, M.; Karamohamed, S.; Pettersson, B.; Uhlén, M.; Nyrén, P. Real-time DNA sequencing using detection of pyrophosphate release. Anal. Biochem. 1996, 242, 84–89. [Google Scholar] [CrossRef] [PubMed]
- Kajiyama, T.; Kuwahara, M.; Goto, M.; Kambara, H. Optimization of pyrosequencing reads by superior successive incorporation efficiency of improved 2′-deoxyadenosine-5′-triphosphate analogs. Anal. Biochem. 2011, 416, 8–17. [Google Scholar] [CrossRef] [PubMed]
- Rothberg, J.M.; Leamon, J.H. The development and impact of 454 sequencing. Nat. Biotechnol. 2008, 26, 1117–1124. [Google Scholar] [CrossRef] [PubMed]
- Yang, Q.; Domesle, K.J.; Wang, F.; Ge, B. Rapid detection of Salmonella in food and feed by coupling loop-mediated isothermal amplification with bioluminescent assay in real-time. BMC Microbiol. 2016, 16, 112. [Google Scholar] [CrossRef] [Green Version]
- Taylor, S.C.; Laperriere, G.; Germain, H. Droplet digital PCR versus qPCR for gene expression analysis with low abundant targets: From variable nonsense to publication quality data. Sci. Rep. 2017, 7, 2409. [Google Scholar] [CrossRef] [Green Version]
- Zhong, Q.; Bhattacharya, S.; Kotsopoulos, S.; Olson, J.; Taly, V.; Griffiths, A.D.; Link, D.R.; Larson, J.W. Multiplex digital PCR: Breaking the one target per color barrier of quantitative PCR. Lab Chip 2011, 11, 2167–2174. [Google Scholar] [CrossRef] [Green Version]
- Hindson, B.J.; Ness, K.D.; Masquelier, D.A.; Belgrader, P.; Heredia, N.J.; Makarewicz, A.J.; Bright, I.J.; Lucero, M.Y.; Hiddessen, A.L.; Legler, T.C.; et al. High-throughput droplet digital PCR system for absolute quantitation of DNA copy number. Anal. Chem. 2011, 83, 8604–8610. [Google Scholar] [CrossRef]
- Hatch, A.C.; Fisher, J.S.; Tovar, A.R.; Hsieh, A.T.; Lin, R.; Pentoney, S.L.; Yang, D.L.; Lee, A.P. 1-Million droplet array with wide-field fluorescence imaging for digital PCR. Lab Chip 2011, 11, 3838–3845. [Google Scholar] [CrossRef] [PubMed]
- Lv, D.F.; Ying, Q.M.; Weng, Y.S.; Shen, C.B.; Chu, J.G.; Kong, J.P.; Sun, D.H.; Gao, X.; Weng, X.B.; Chen, X.Q. Dynamic change process of target genes by RT-PCR testing of SARS-Cov-2 during the course of a coronavirus disease 2019 patient. Clin. Chim. Acta 2020, 506, 172–175. [Google Scholar] [CrossRef] [PubMed]
- Fei, Z.; Zhou, D.; Dai, W.; Xiao, P. Rapid and highly sensitive detection of Escherichia coli O157: H7 in food with loop-mediated isothermal amplification coupled to a new bioluminescent assay. Electrophoresis 2020, 41, 1793–1803. [Google Scholar] [CrossRef] [PubMed]
- Zhu, W.; Li, L.; Zhou, Z.; Yang, X.; Hao, N.; Guo, Y.; Wang, K. A colorimetric biosensor for simultaneous ochratoxin A and aflatoxins B1 detection in agricultural products. Food Chem. 2020, 319, 126544. [Google Scholar] [CrossRef] [PubMed]
- Gadkar, V.J.; Goldfarb, D.M.; Gantt, S.; Tilley, P.A. Real-time detection and monitoring of loop mediated amplification (LAMP) reaction using self-quenching and de-quenching fluorogenic probes. Sci. Rep. 2018, 8, 5548. [Google Scholar] [CrossRef] [Green Version]


| Target RNA Concentrations (Copies/mL) | Target RNA Concentrations in Reaction Mix (Copies/μL) (10 μL Reaction Mixtures) | Theoretical Calculation (N = 20,000) | Actual Results | |||||
|---|---|---|---|---|---|---|---|---|
| λ | Np | Nn/N | Np | N | λ | C (Copies/μL) | ||
| 104 | 1 | 0.0005 | 10 | 0.9995 | 9 | 18,554 | 0.00049 | 0.98 |
| 105 | 10 | 0.0050 | 99 | 0.9950 | 77 | 17,386 | 0.00443 | 8.89 |
| 106 | 100 | 0.0500 | 969 | 0.9516 | 669 | 19,097 | 0.03503 | 70.06 |
| Target RNA Concentrations (Copies/mL) | Target RNA Concentrations in Reaction (Copies/μL) (1000 μL Reaction Mixtures) | Theoretical Calculation (N = 96) | Actual Results | |||||
|---|---|---|---|---|---|---|---|---|
| λ | Np | Nn/N | Np | N | λ | C (Copies/μL) | ||
| 10 | 0.001 | 0.0104 | 1 | 0.9896 | 2 | 96 | 0.0208 | 0.0019 |
| 102 | 0.01 | 0.1040 | 10 | 0.9019 | 8 | 96 | 0.0870 | 0.0084 |
| 103 | 0.1 | 1.0416 | 62 | 0.3535 | 58 | 96 | 0.9268 | 0.0885 |
| 104 | 1 | 10.4167 | 96 | 0 | 96 | 96 | ≥9.6 | ≥0.96 |
| Target RNA Concentrations (Copies/mL) | Target RNA Concentrations in Reaction (Copies/μL) (1000 μL Reaction Mixtures) | Theoretical Calculation (N = 96) | Actual Results | |||||
|---|---|---|---|---|---|---|---|---|
| λ | Np | Nn/N | Np | N | λ | C (Copies/μL) | ||
| 0 | 0 | 0 | 0 | 1 | 0 | 96 | 0 | 0 |
| 103 | 0.1 | 1.0416 | 62 | 0.3535 | 60 | 96 | 0.9808 | 0.0943 |
| 104 | 1 | 10.4166 | 96 | 0 | 96 | 96 | ≥9.6 | ≥9.6 |
| Methods | Results | ||
|---|---|---|---|
| Positive | Negative | Minutes for Positive Call | |
| qPCR | 9 | 11 | 48 min |
| simulated digital PCR | 9 | 11 | 30 min |
| Primer | Primer Sequence (5′-3′) | Target Gene |
|---|---|---|
| FIP | CACAACTACCACCCACTTTTGCCATGCAAGTTGAATC | ORF1ab |
| BIP | CGGACACAATCTTGCTAATAAGAAGTTGAATGTCTTCACC | |
| F3 | AACATGGAGGAGGTGTTG | |
| B3 | CAAGTAGAACTTCGTGCTG | |
| LoopF | GTGGTCCATTAGTAGCTATGT | |
| LoopB | CACTGTCTTCATGTTGTCG |
Publisher’s Note: MDPI stays neutral with regard to jurisdictional claims in published maps and institutional affiliations. |
© 2021 by the authors. Licensee MDPI, Basel, Switzerland. This article is an open access article distributed under the terms and conditions of the Creative Commons Attribution (CC BY) license (http://creativecommons.org/licenses/by/4.0/).
Share and Cite
Fei, Z.; Wei, R.; Cheng, C.; Xiao, P. A Novel Approach to the Bioluminescent Detection of the SARS-CoV-2 ORF1ab Gene by Coupling Isothermal RNA Reverse Transcription Amplification with a Digital PCR Approach. Int. J. Mol. Sci. 2021, 22, 1017. https://doi.org/10.3390/ijms22031017
Fei Z, Wei R, Cheng C, Xiao P. A Novel Approach to the Bioluminescent Detection of the SARS-CoV-2 ORF1ab Gene by Coupling Isothermal RNA Reverse Transcription Amplification with a Digital PCR Approach. International Journal of Molecular Sciences. 2021; 22(3):1017. https://doi.org/10.3390/ijms22031017
Chicago/Turabian StyleFei, Zhongjie, Rongbin Wei, Chu Cheng, and Pengfeng Xiao. 2021. "A Novel Approach to the Bioluminescent Detection of the SARS-CoV-2 ORF1ab Gene by Coupling Isothermal RNA Reverse Transcription Amplification with a Digital PCR Approach" International Journal of Molecular Sciences 22, no. 3: 1017. https://doi.org/10.3390/ijms22031017