
SARS-CoV-2: Ultrastructural Characterization of Morphogenesis in an In Vitro System

 , , , , , , , and
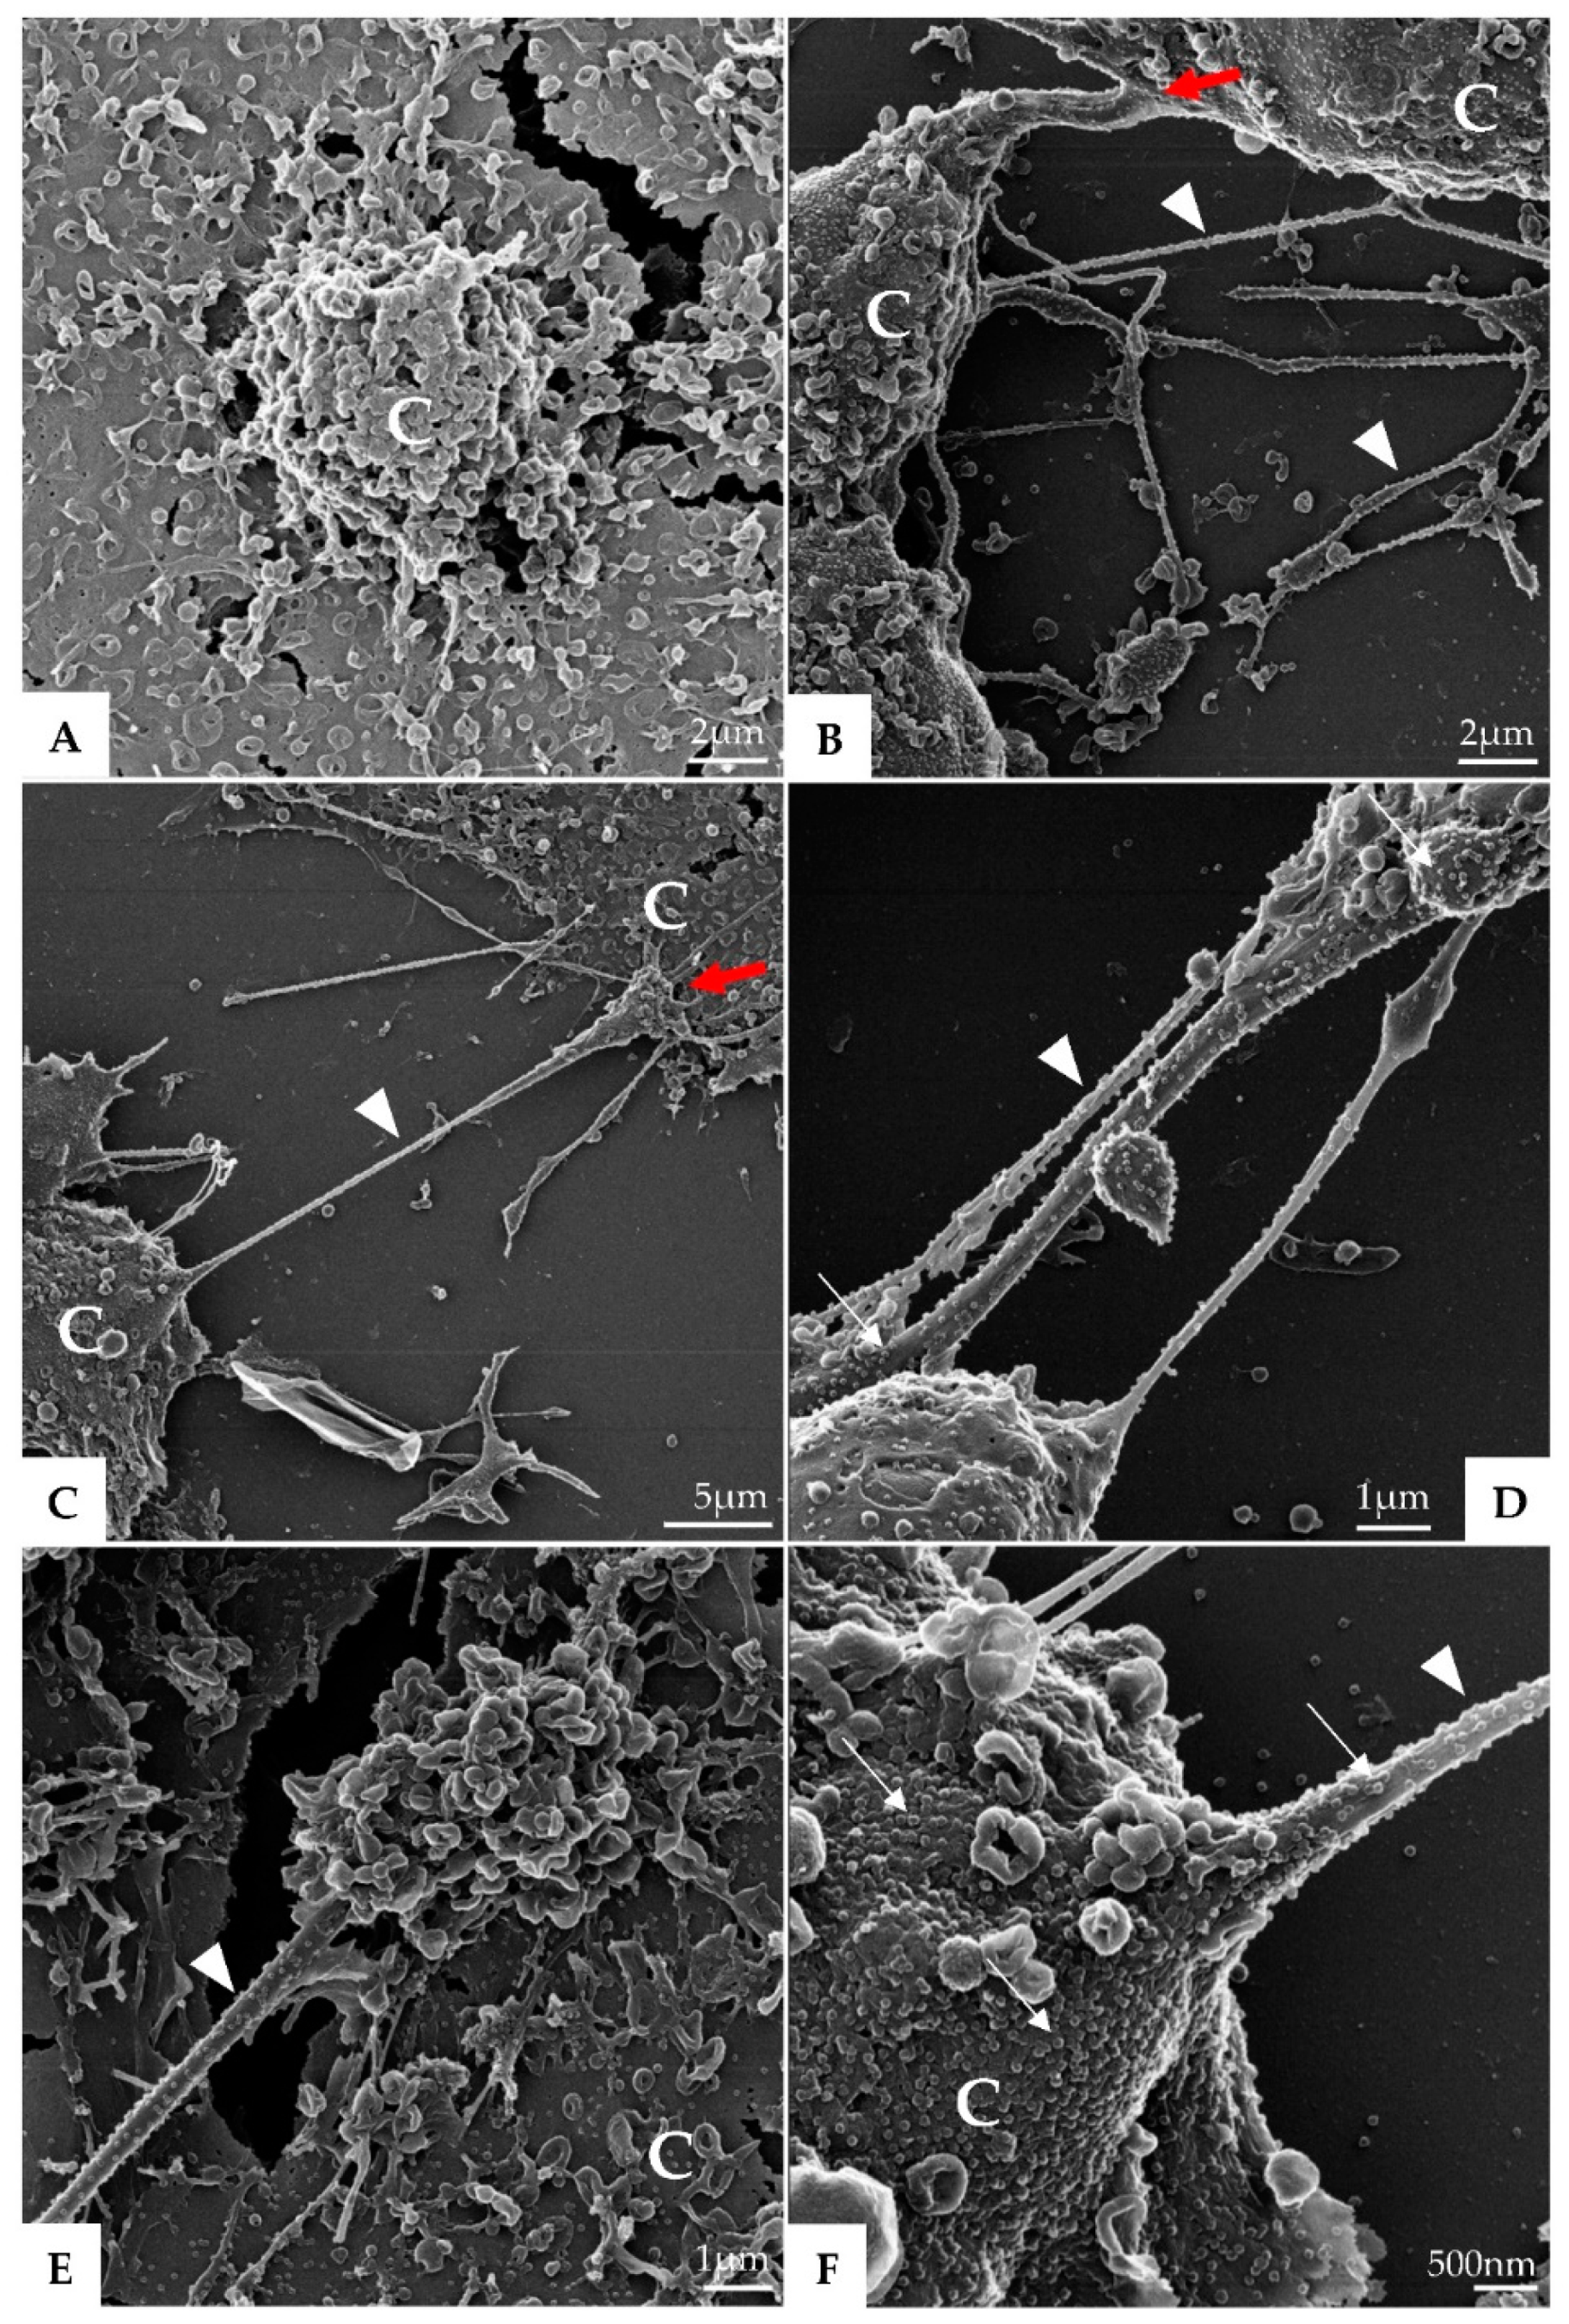
Abstract
:1. Introduction
2. Materials and Methods
2.1. Virus Sample
2.2. Cells and Virus Infection
2.3. Transmission Electron Microscopy (TEM) and Helium Ion Microscopy (HIM)
2.4. Focused Ion Beam Scanning Electron Microscopy (FIB-SEM) and 3D Modeling
2.5. Measurement of Virus Particle Size
2.6. Immunofluorescence Staining
3. Results
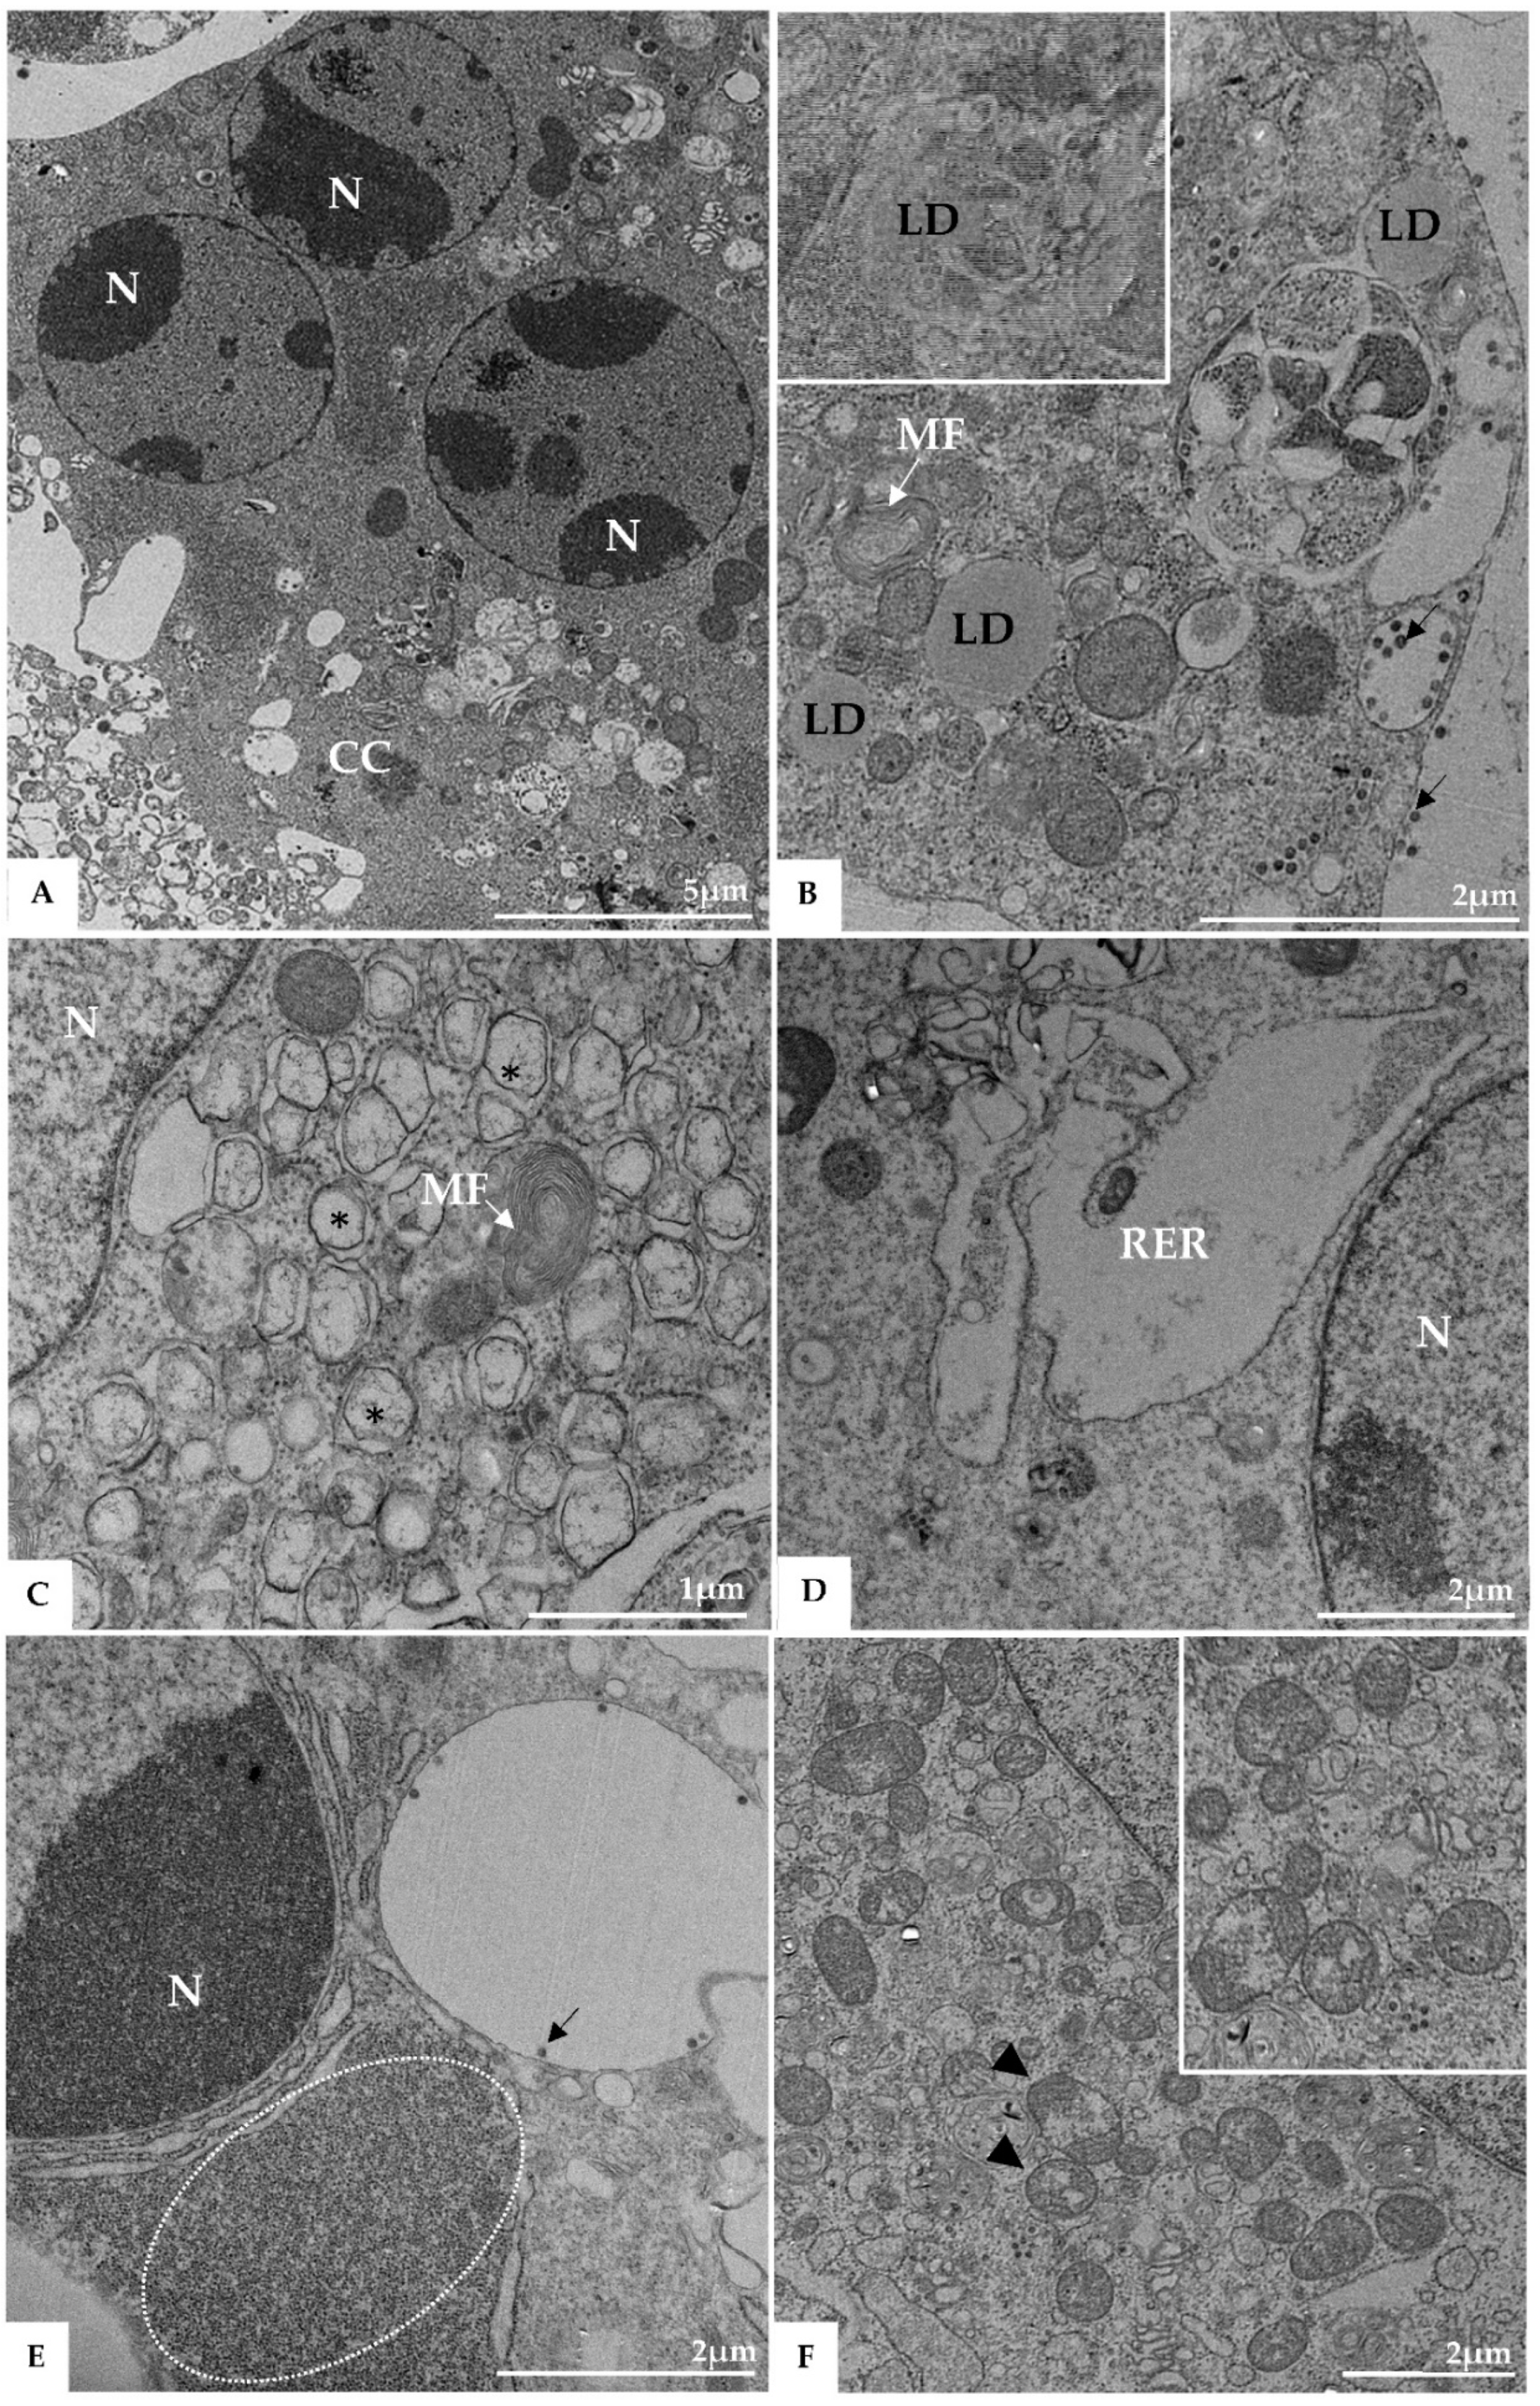
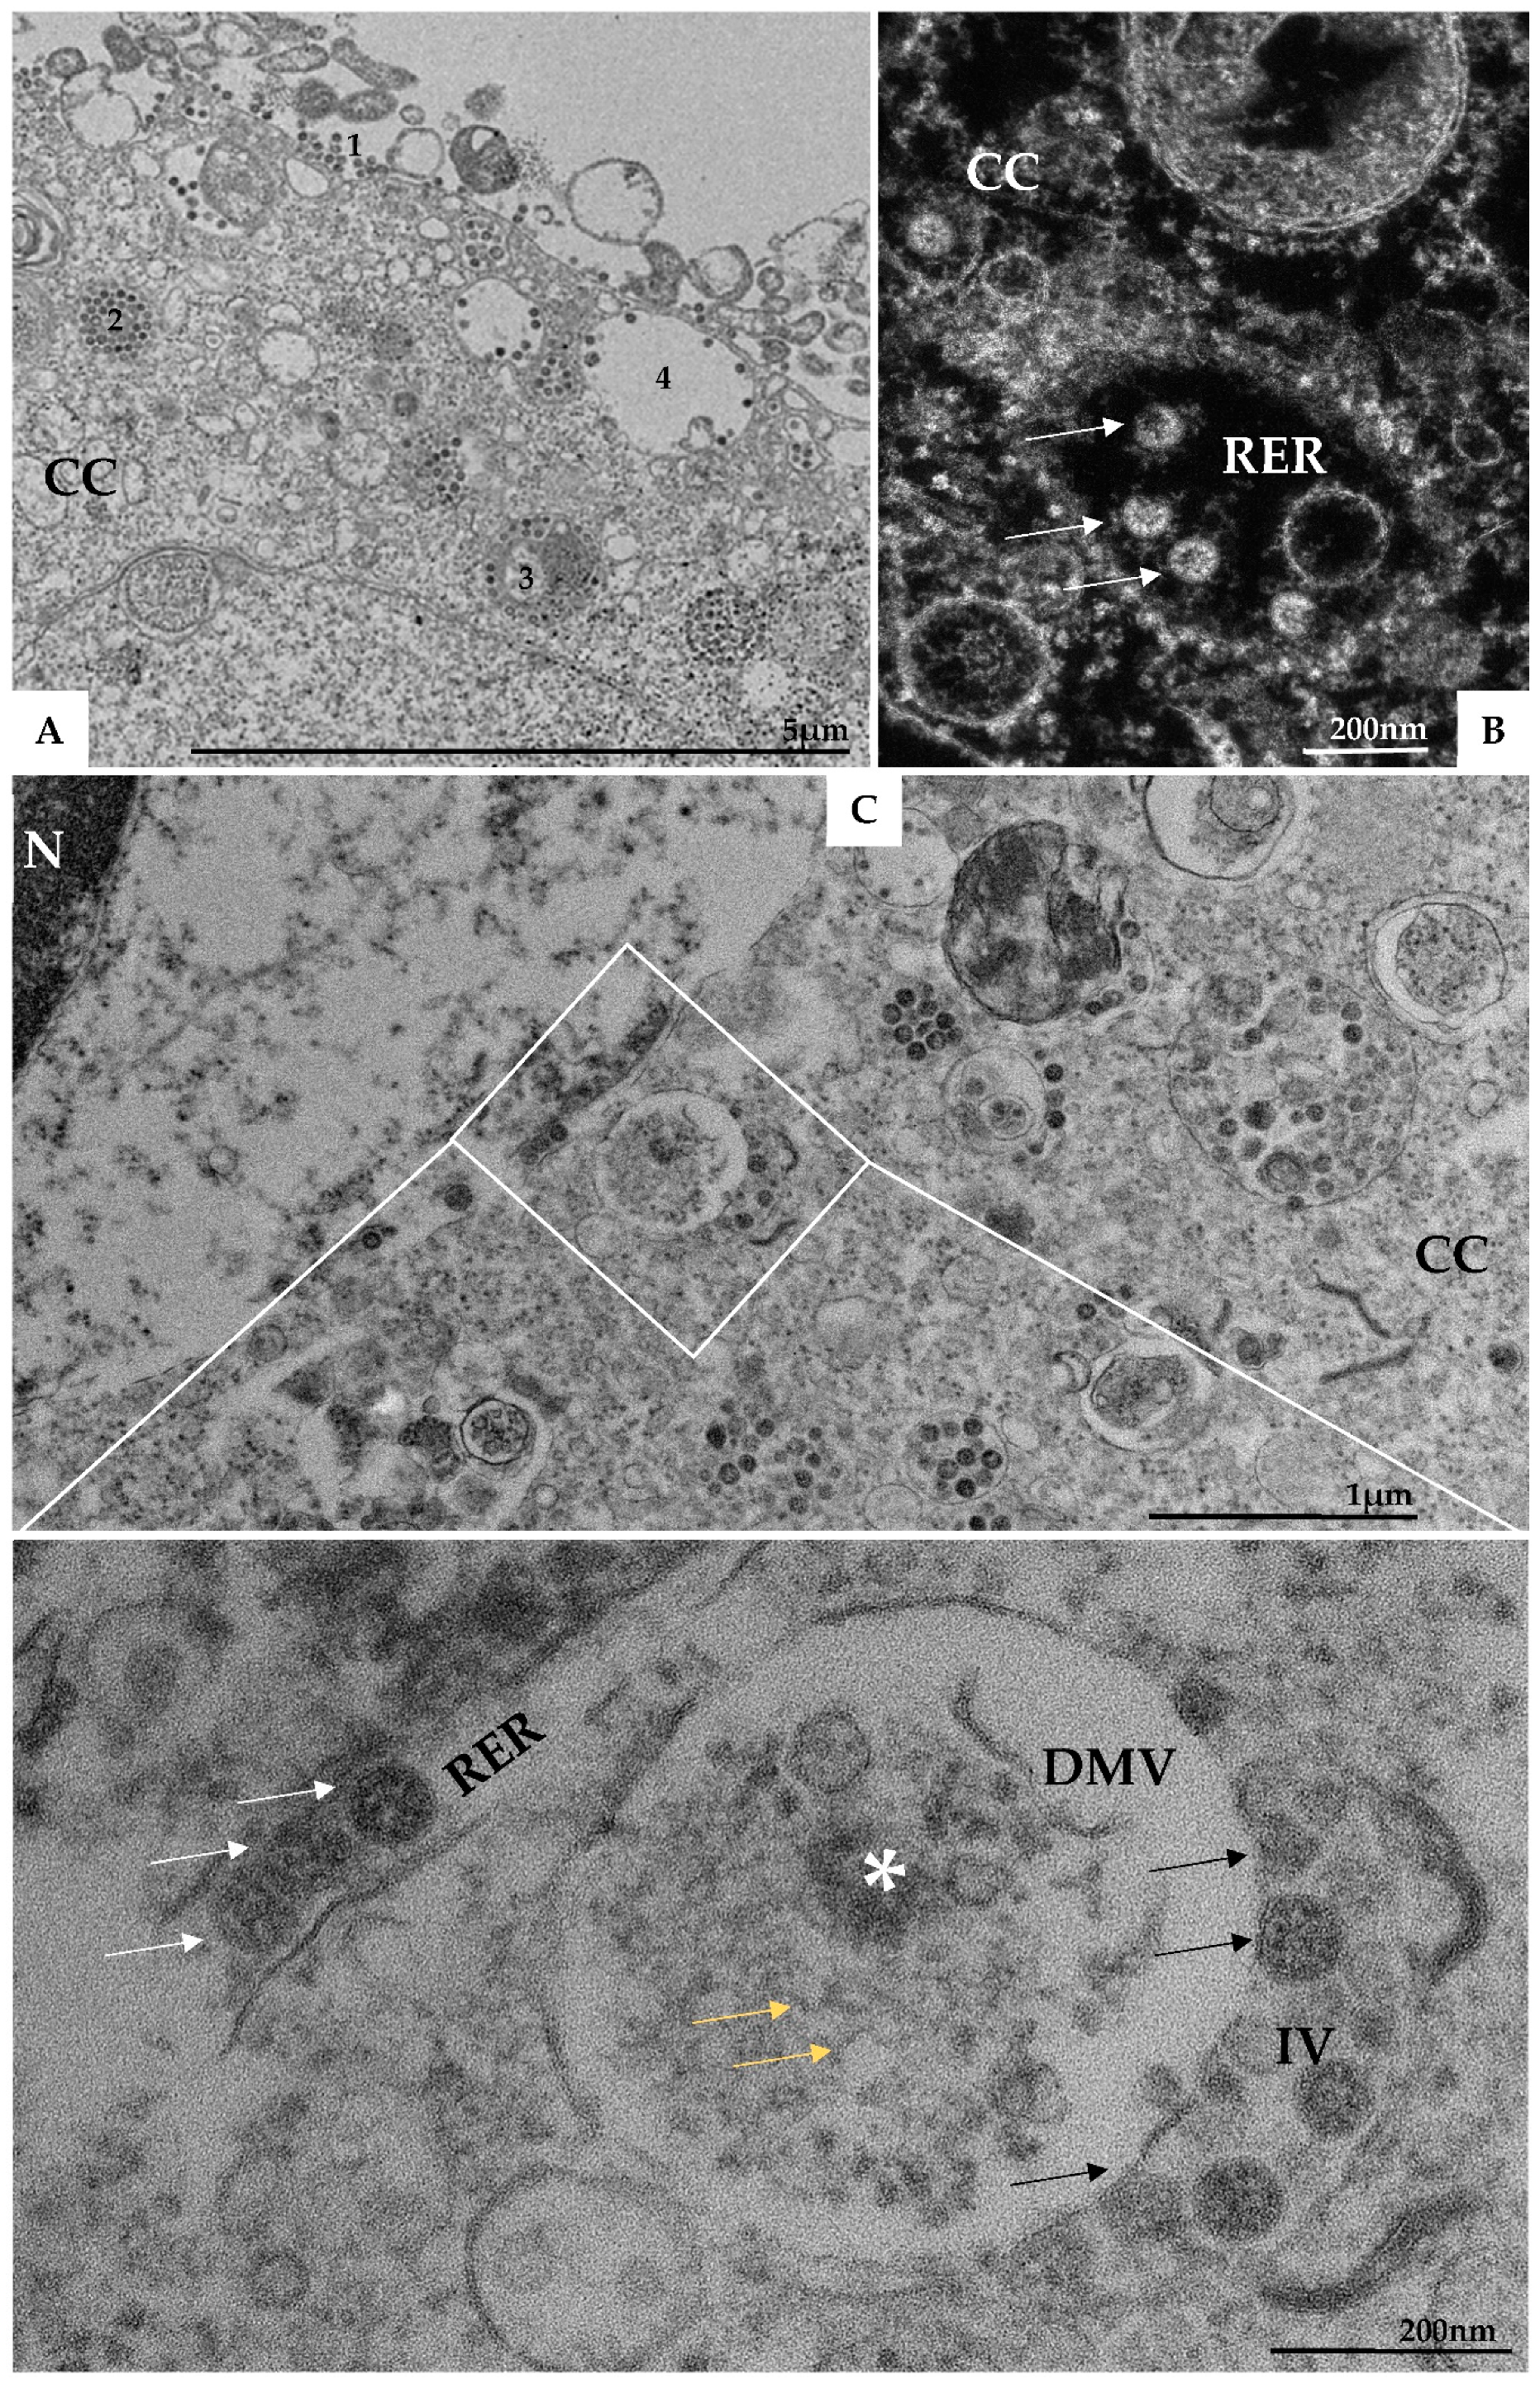
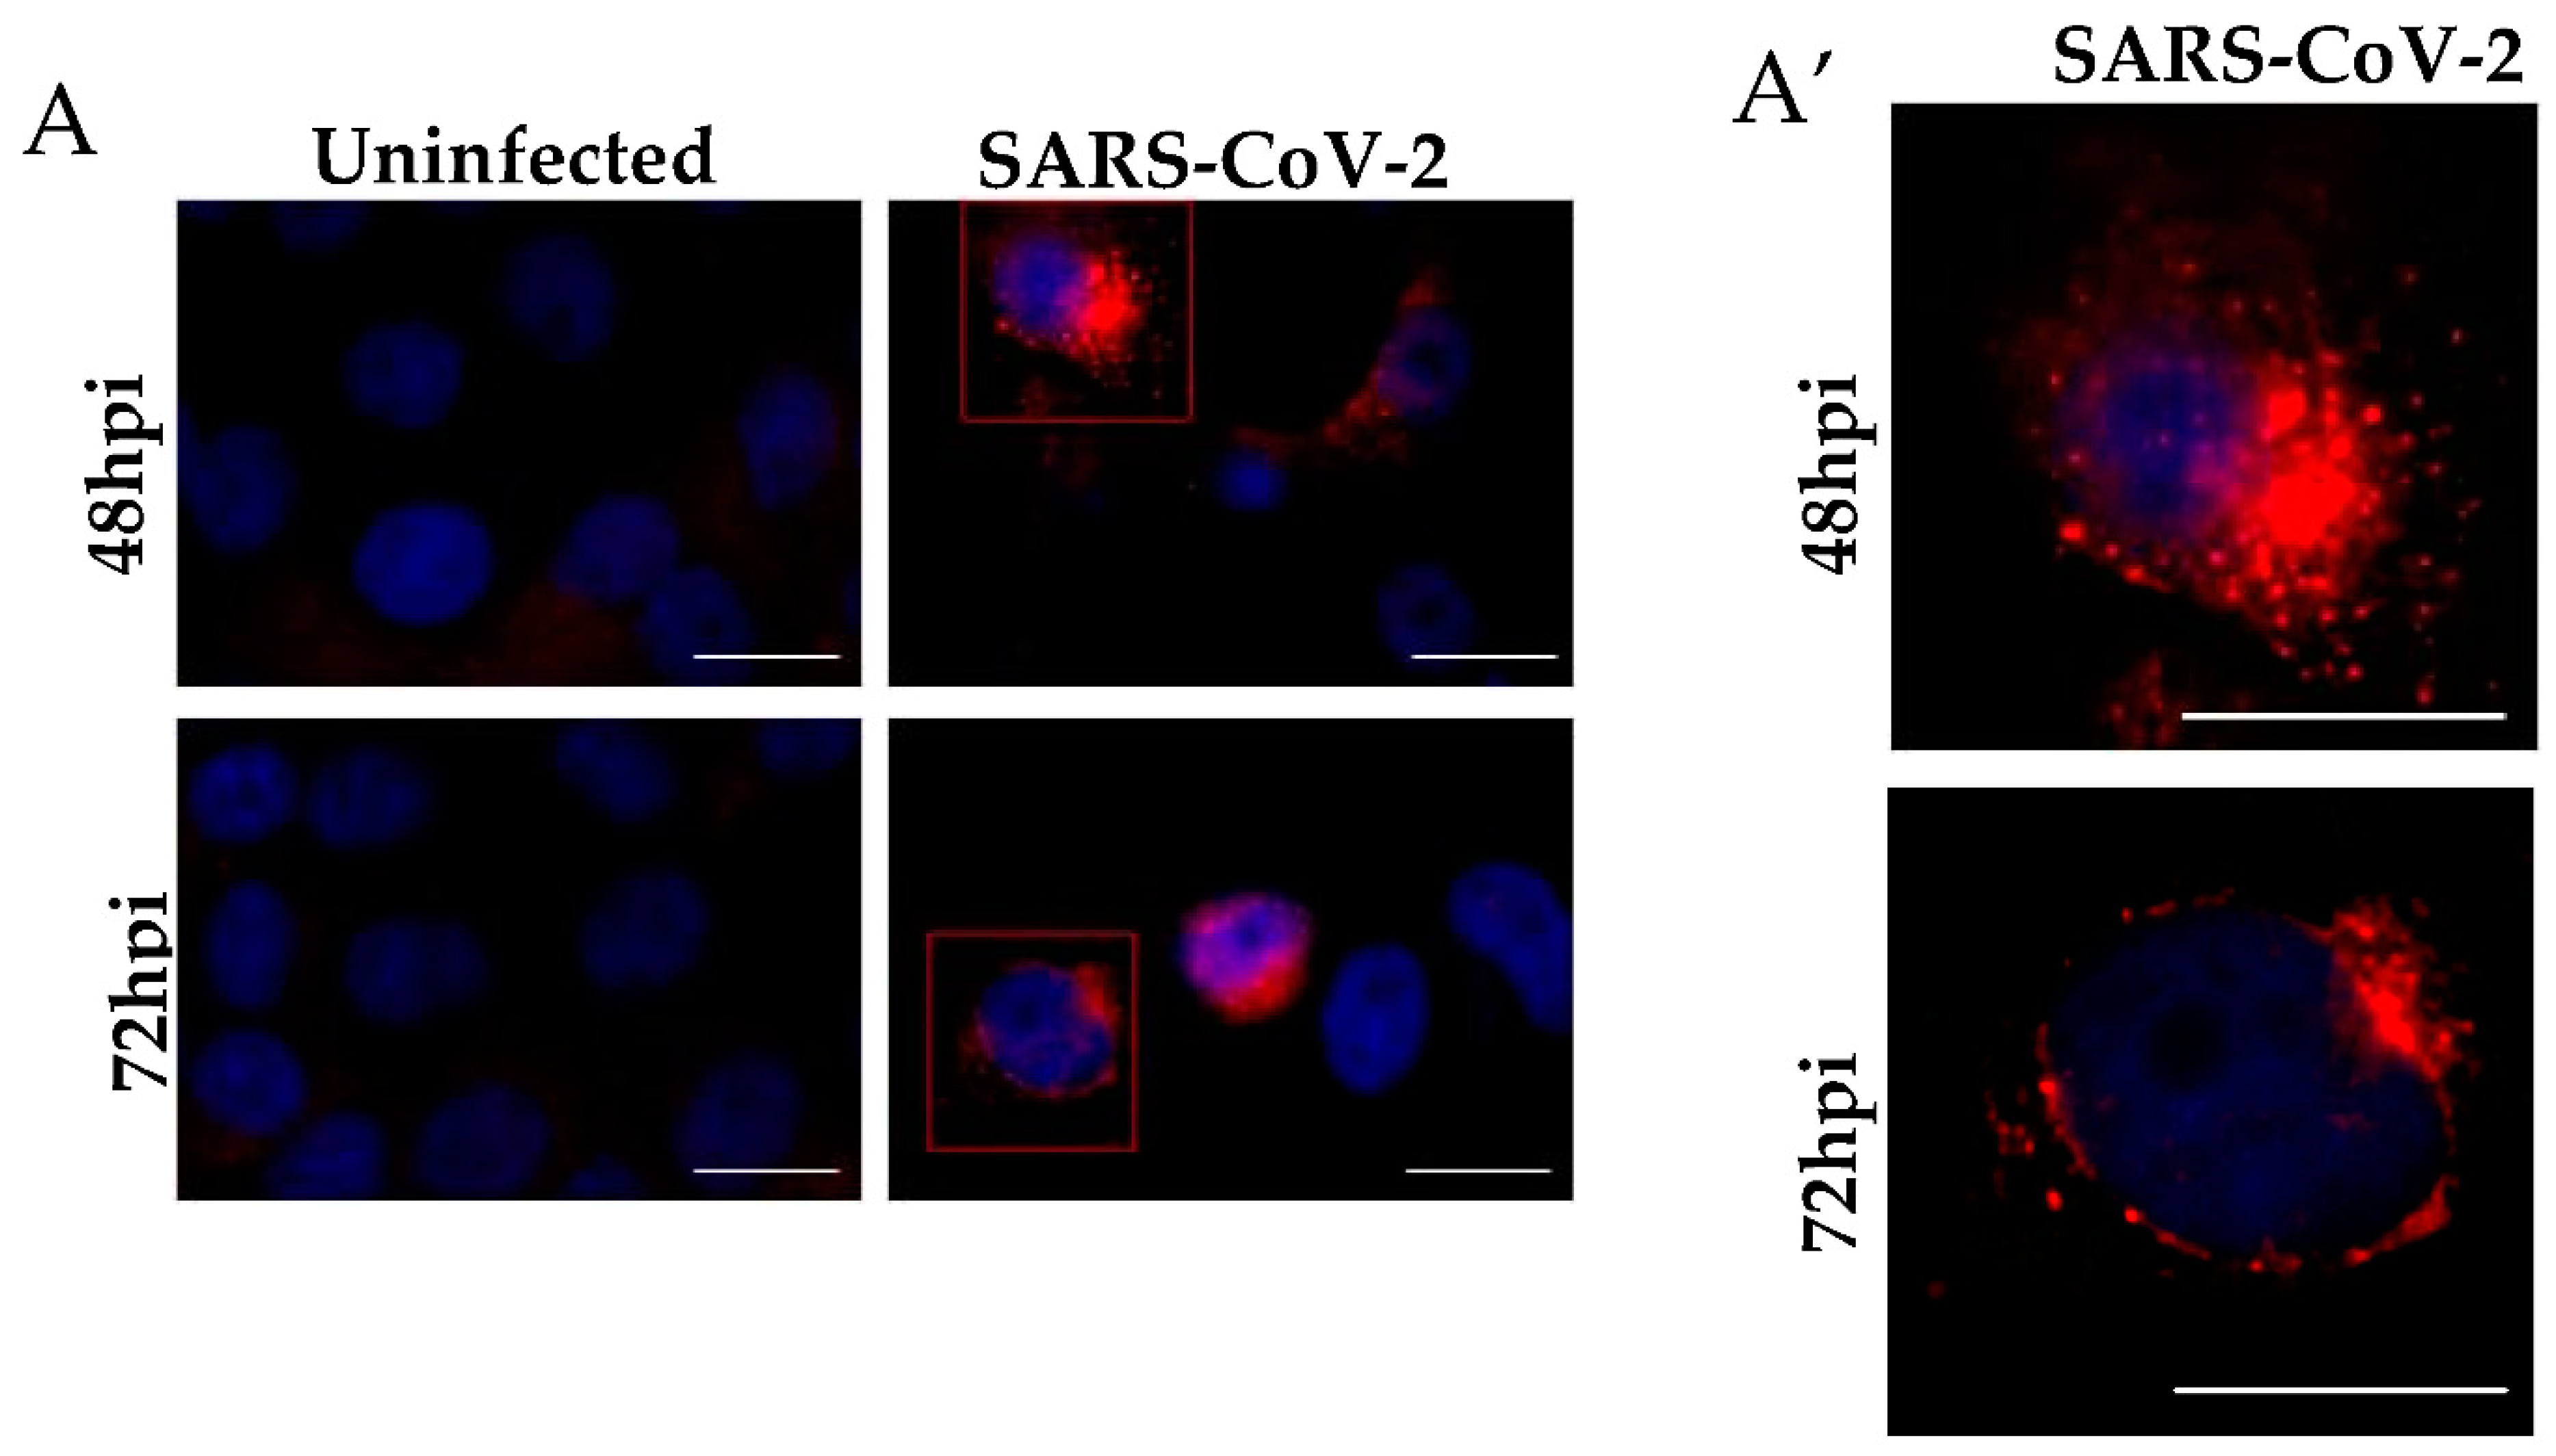
3.1. Ultrastructural Cellular Change Caused by SARS-CoV-2 Infection
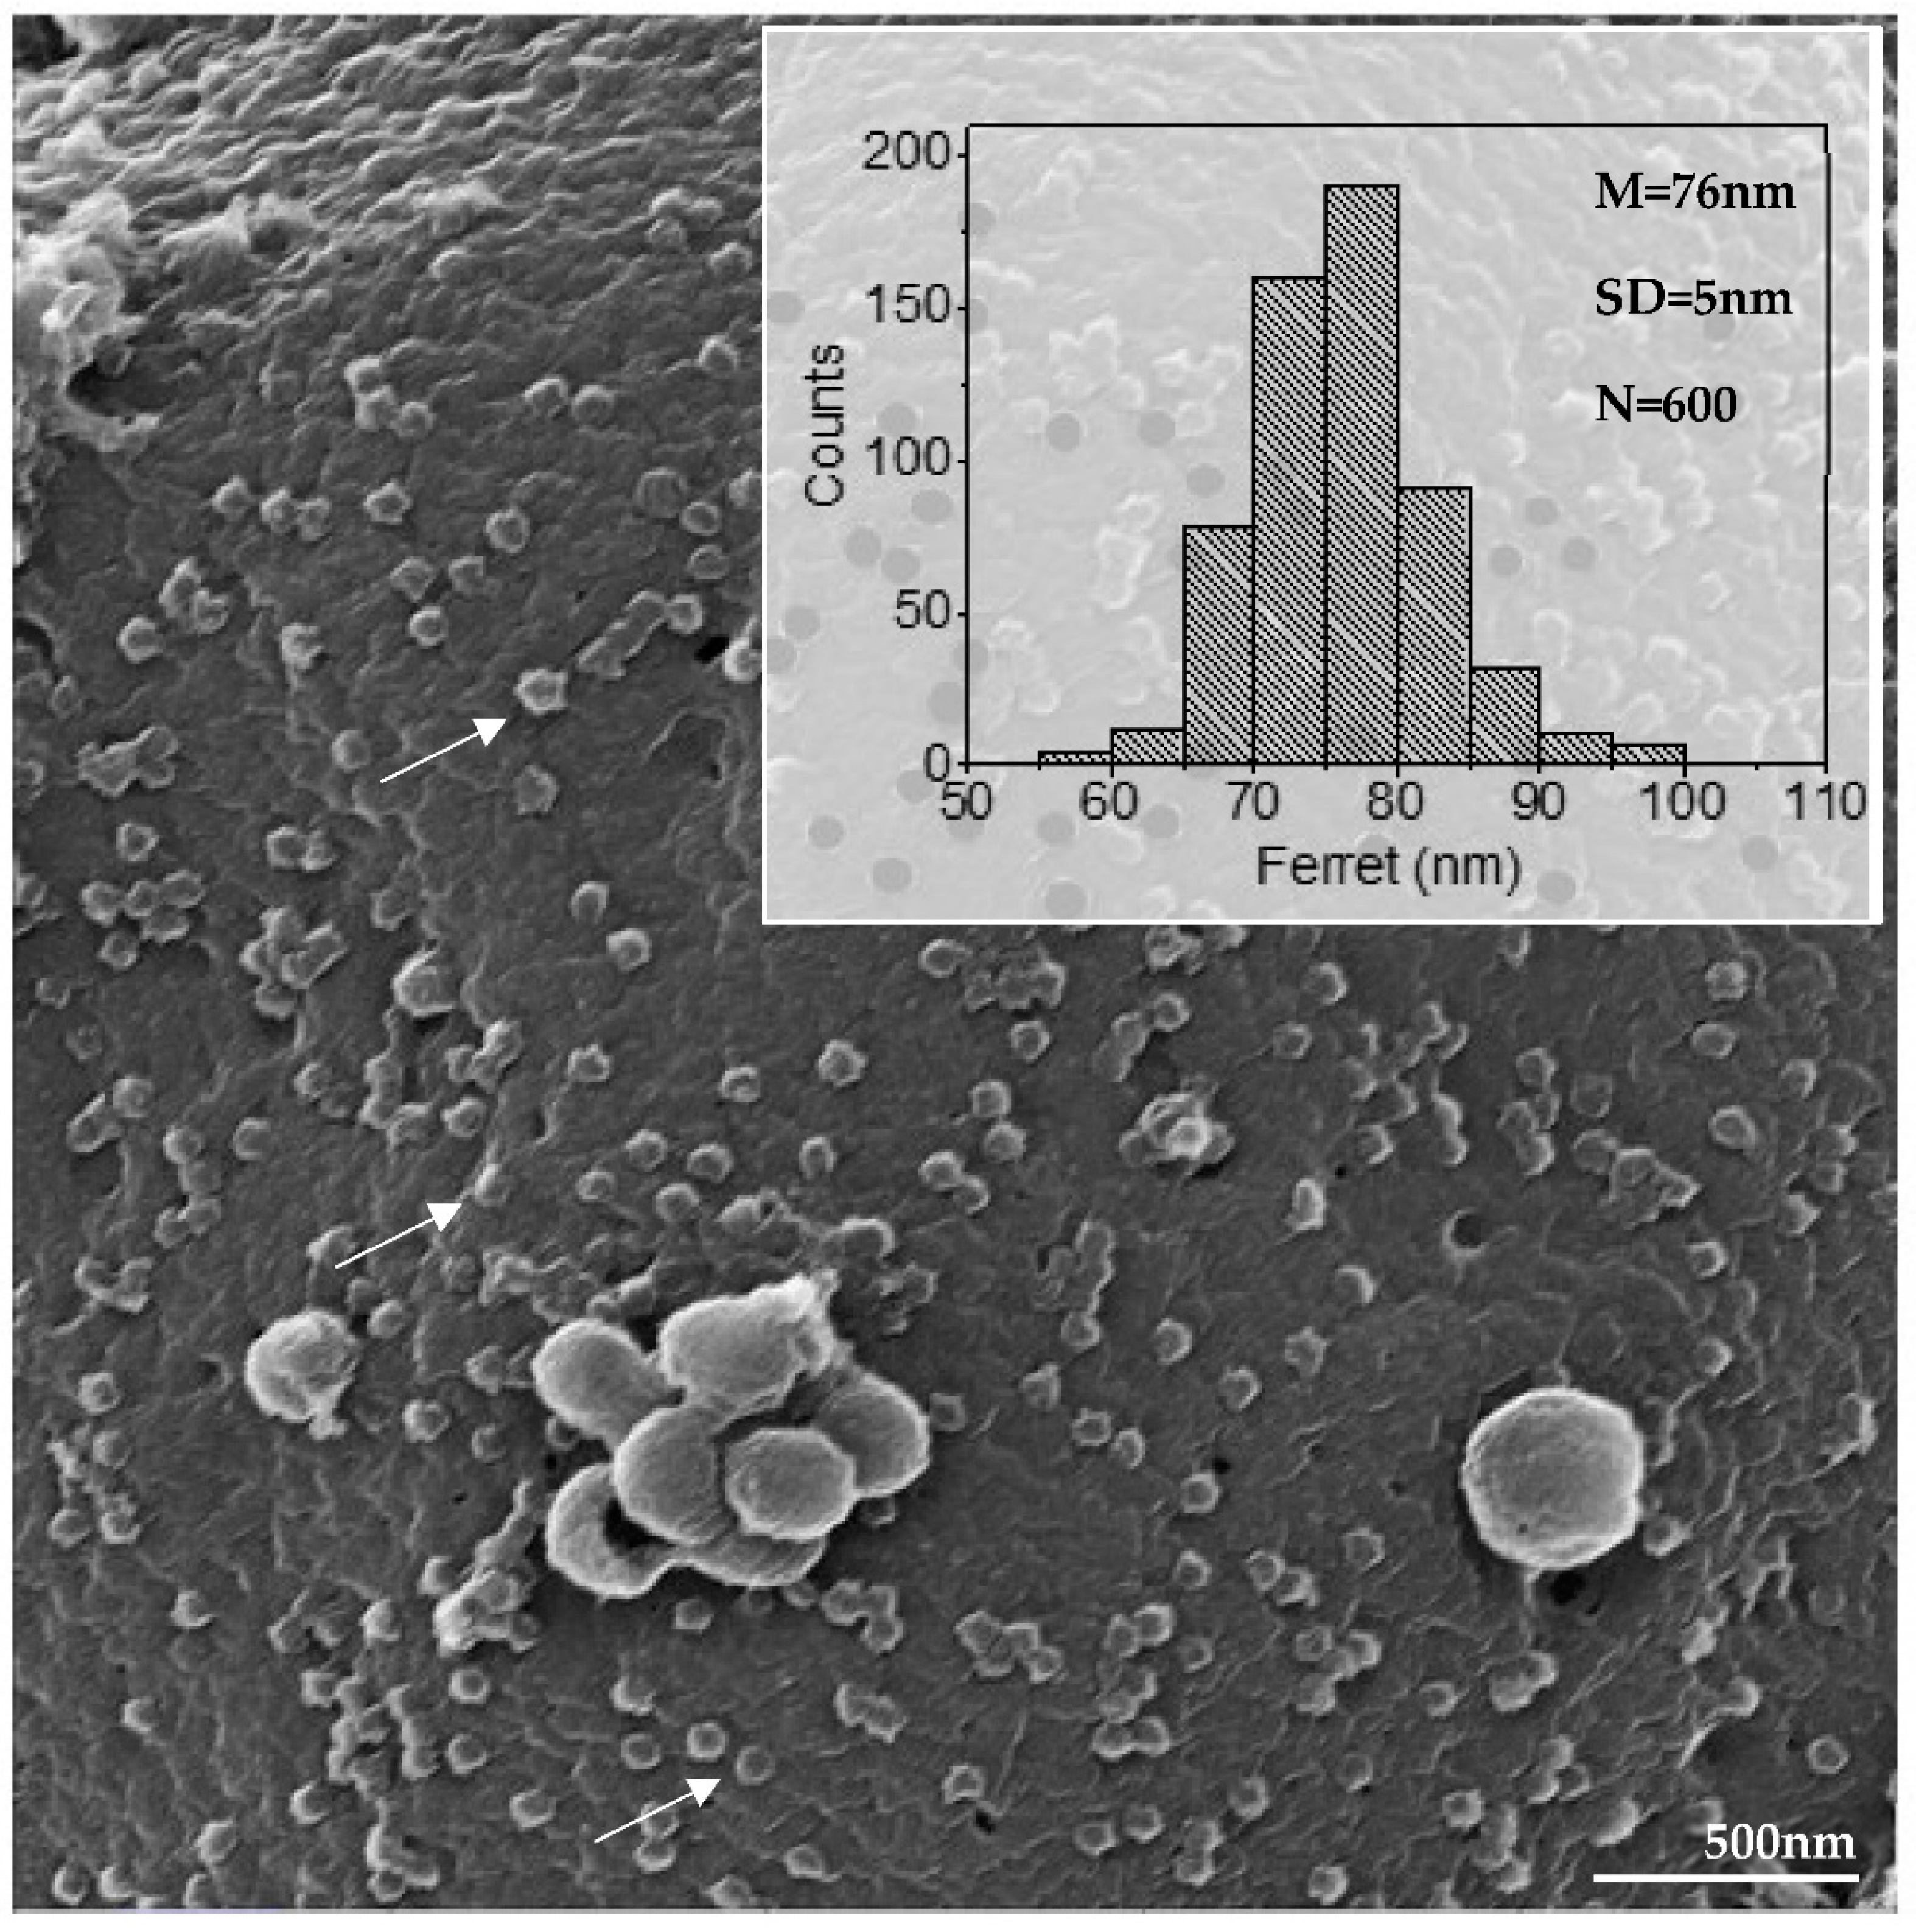
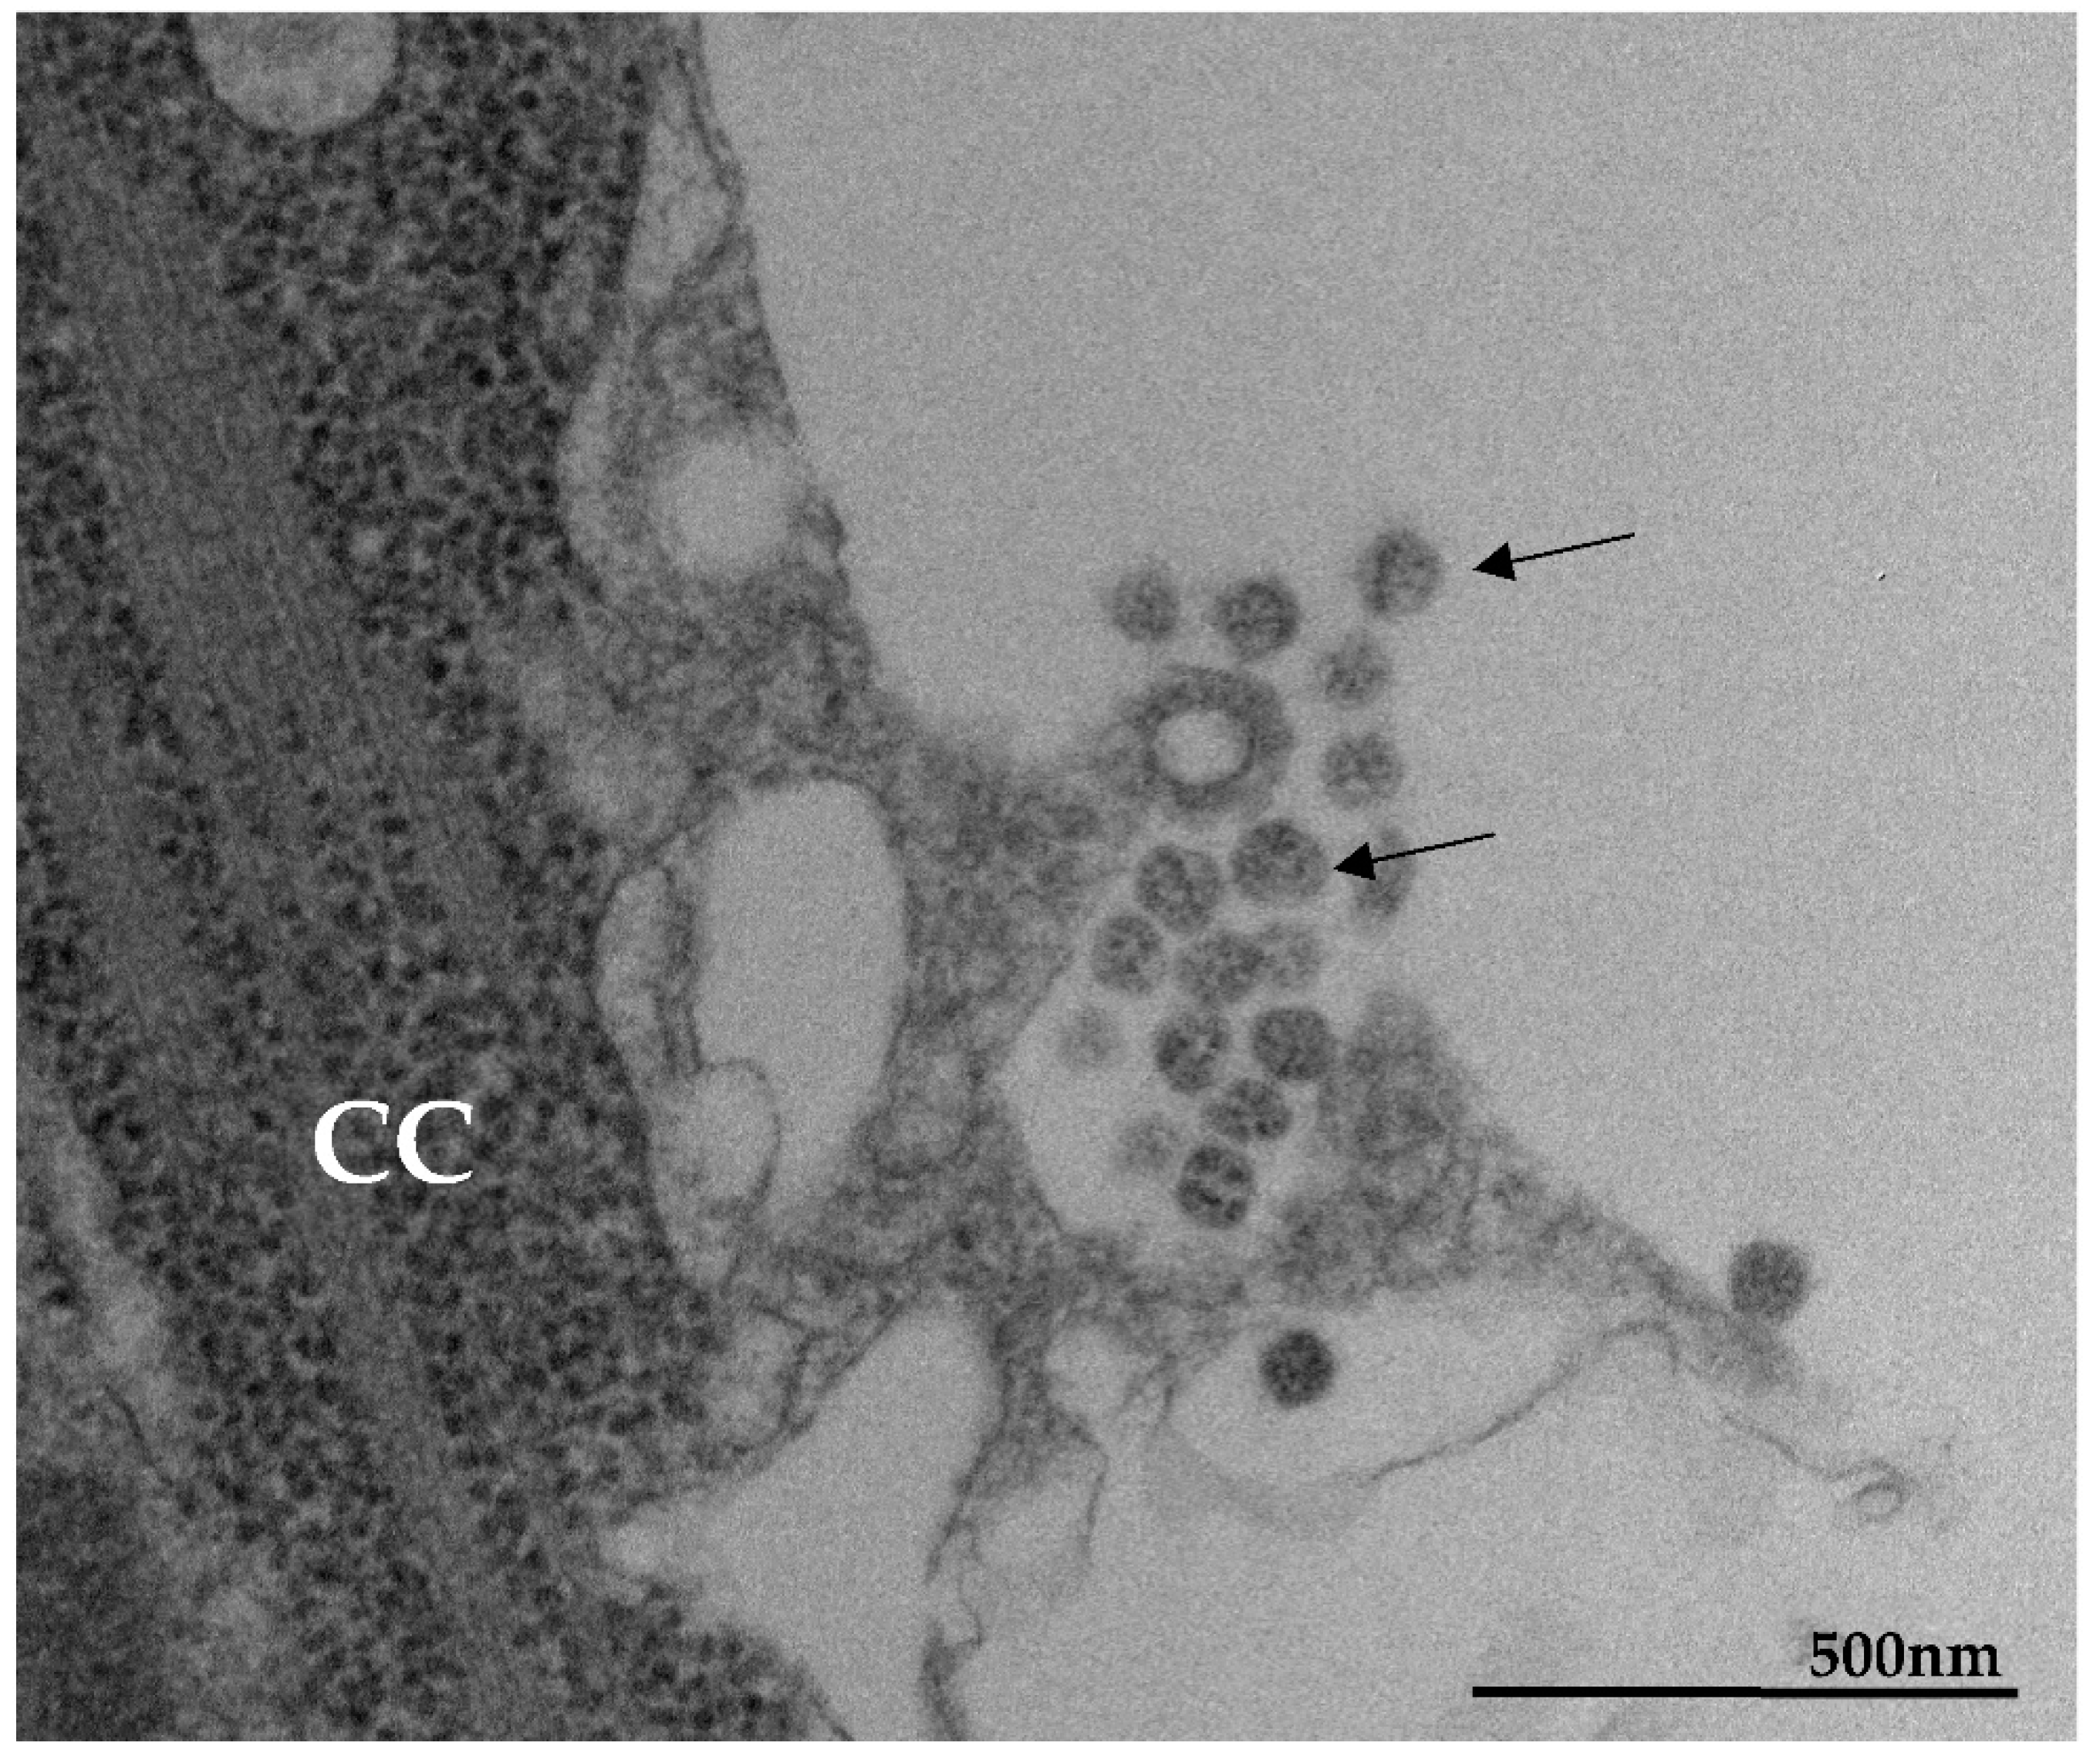
3.2. SARS-CoV-2 Particles Diameter and Morphology
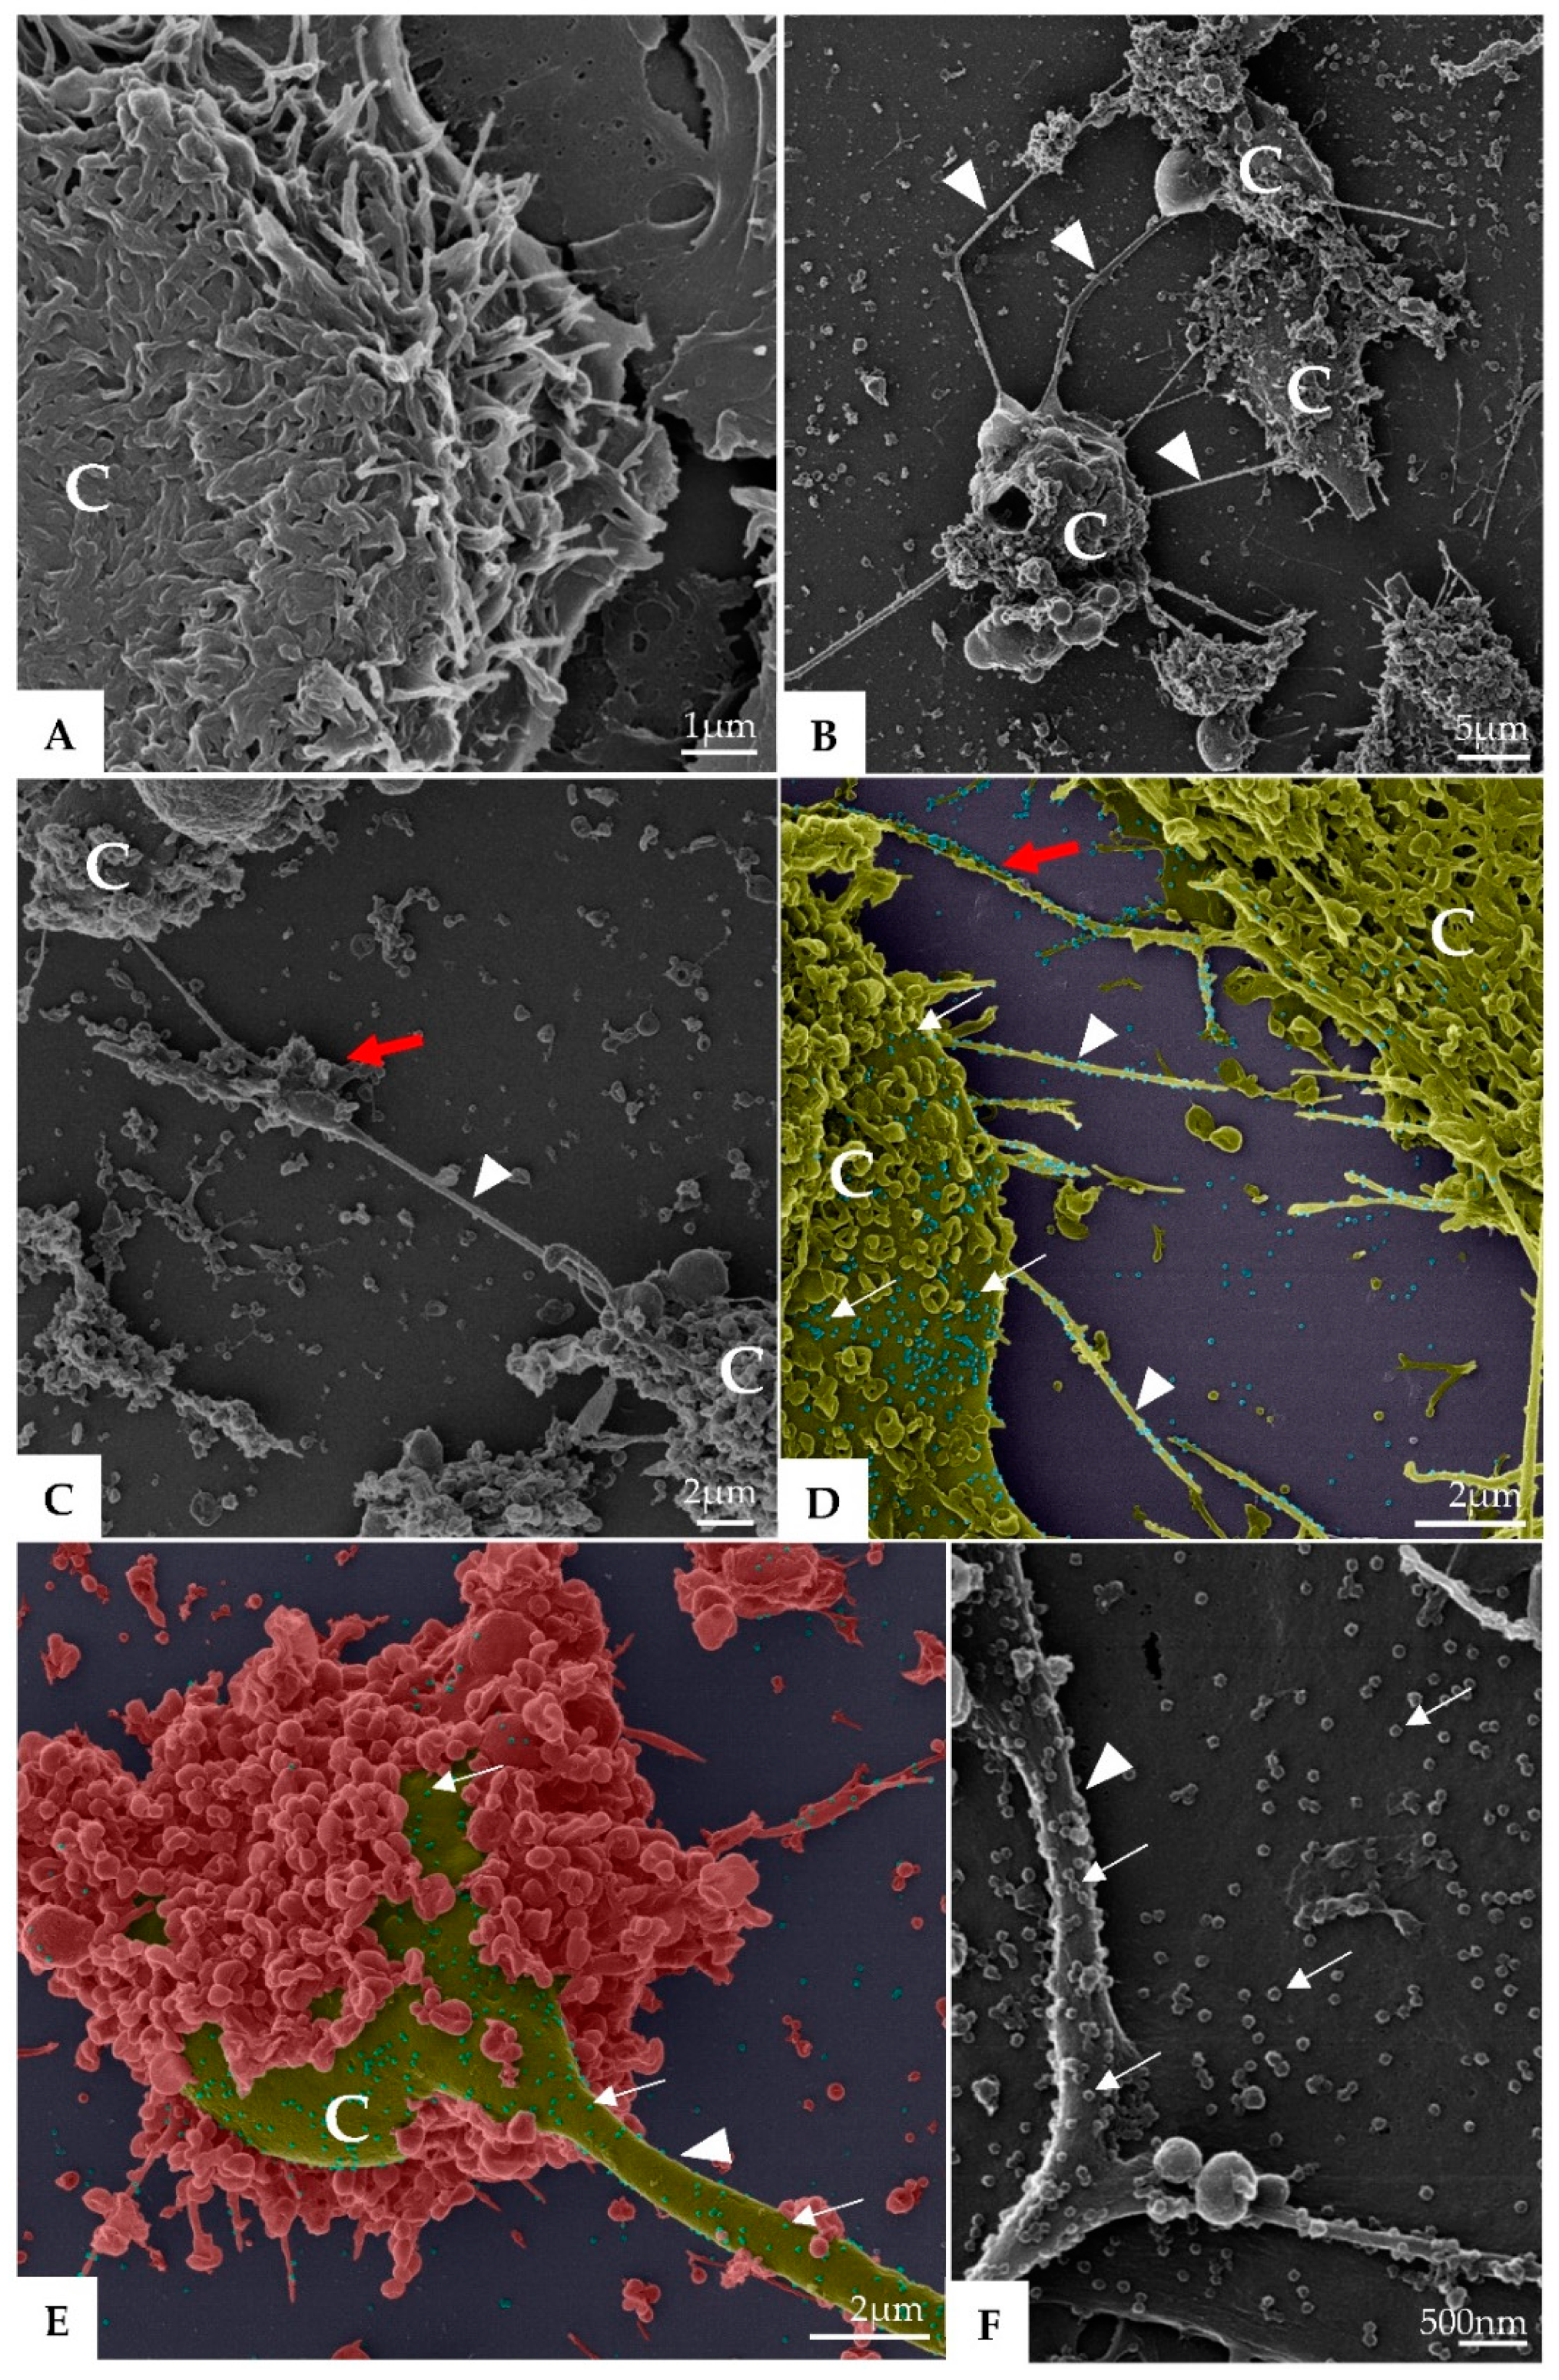
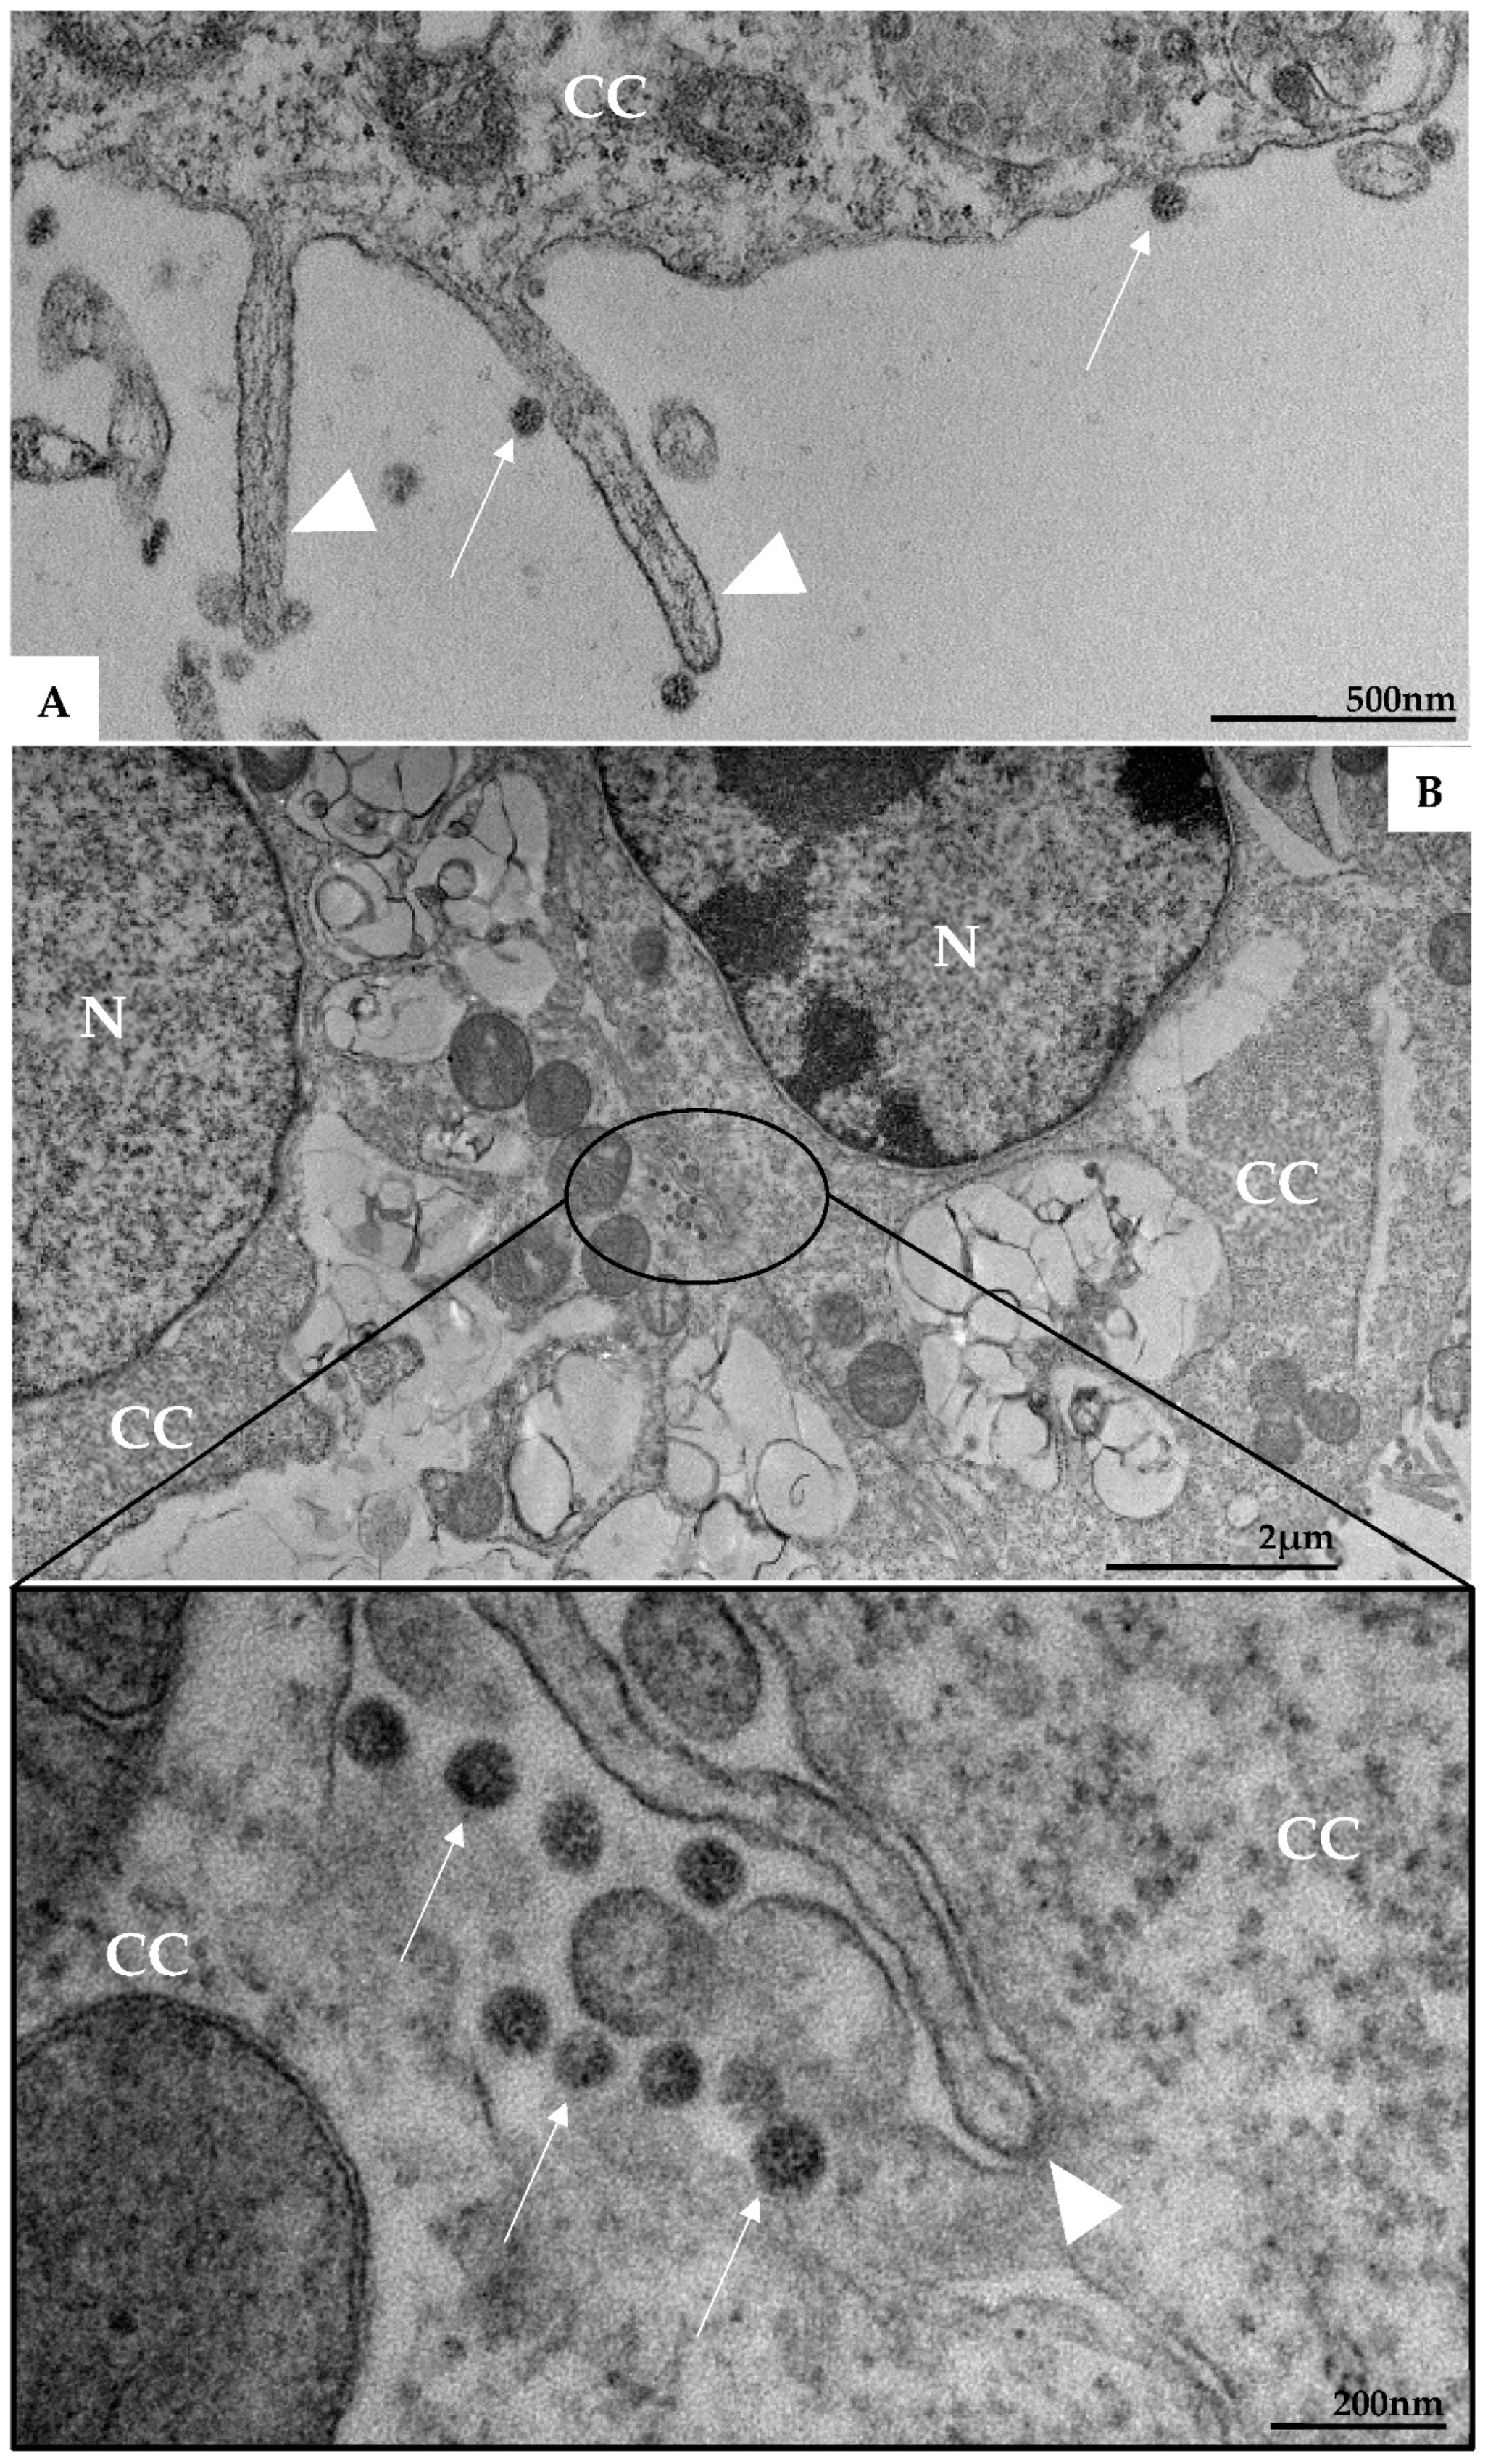
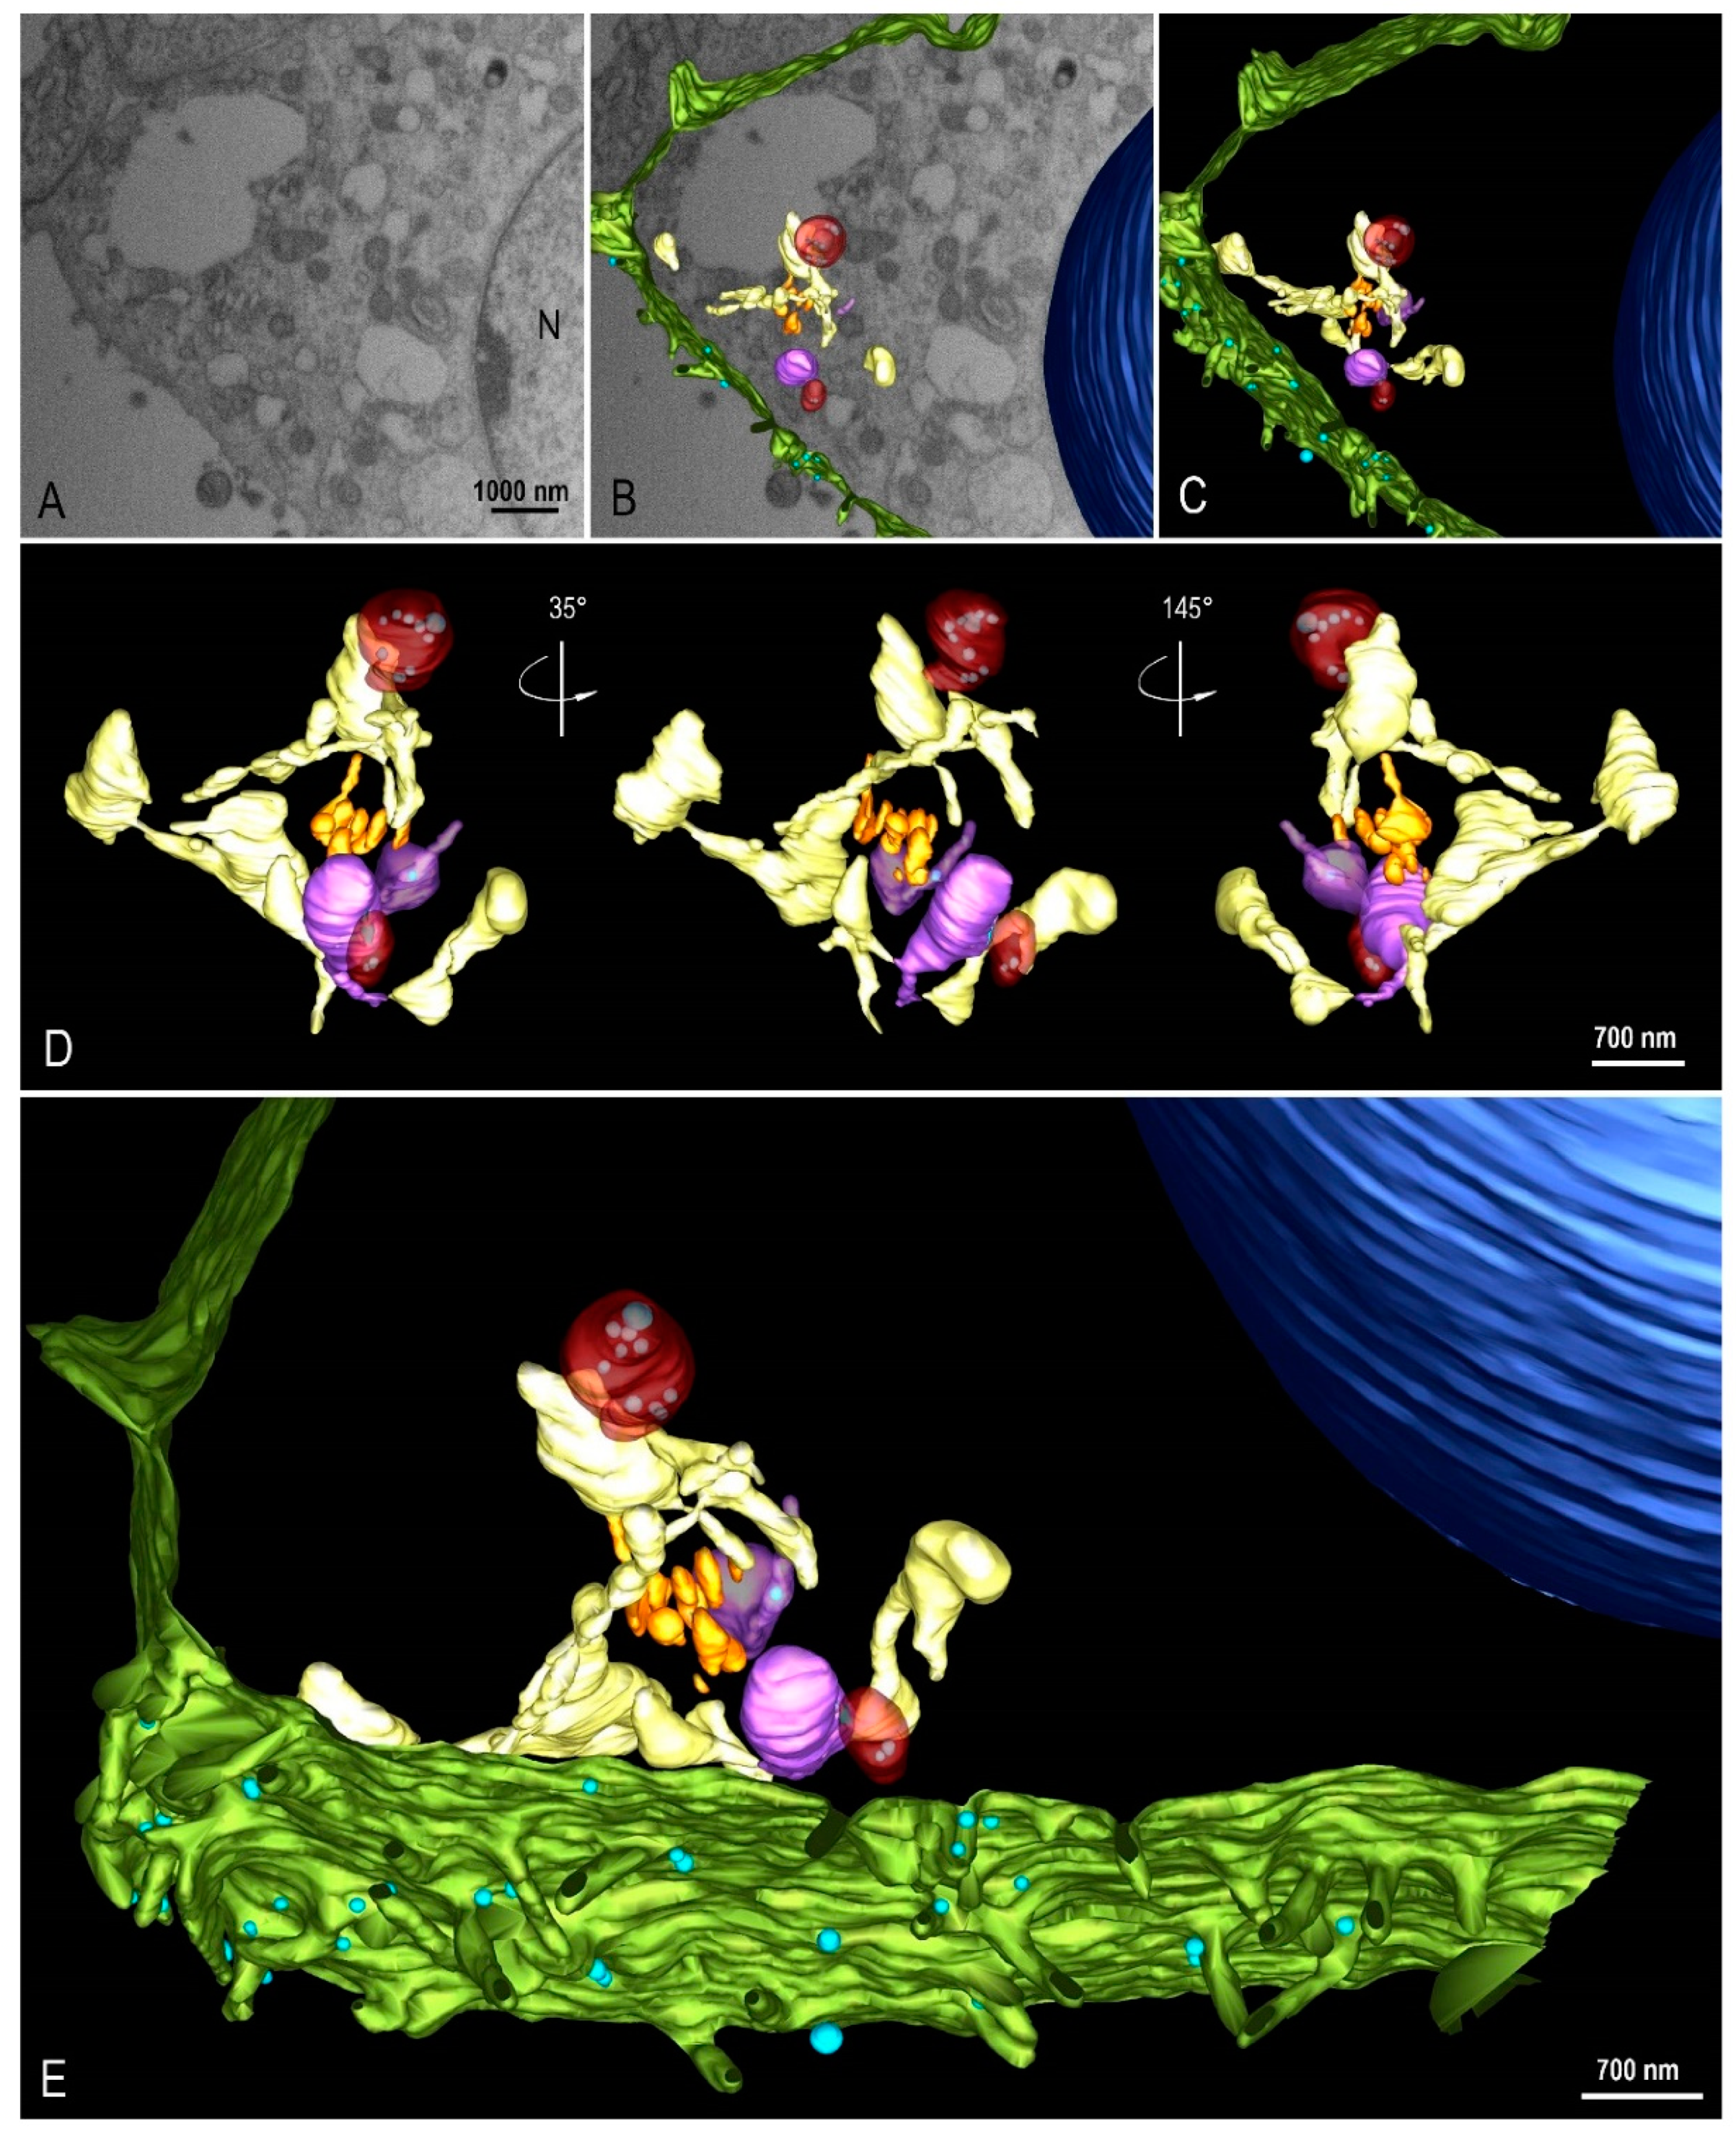
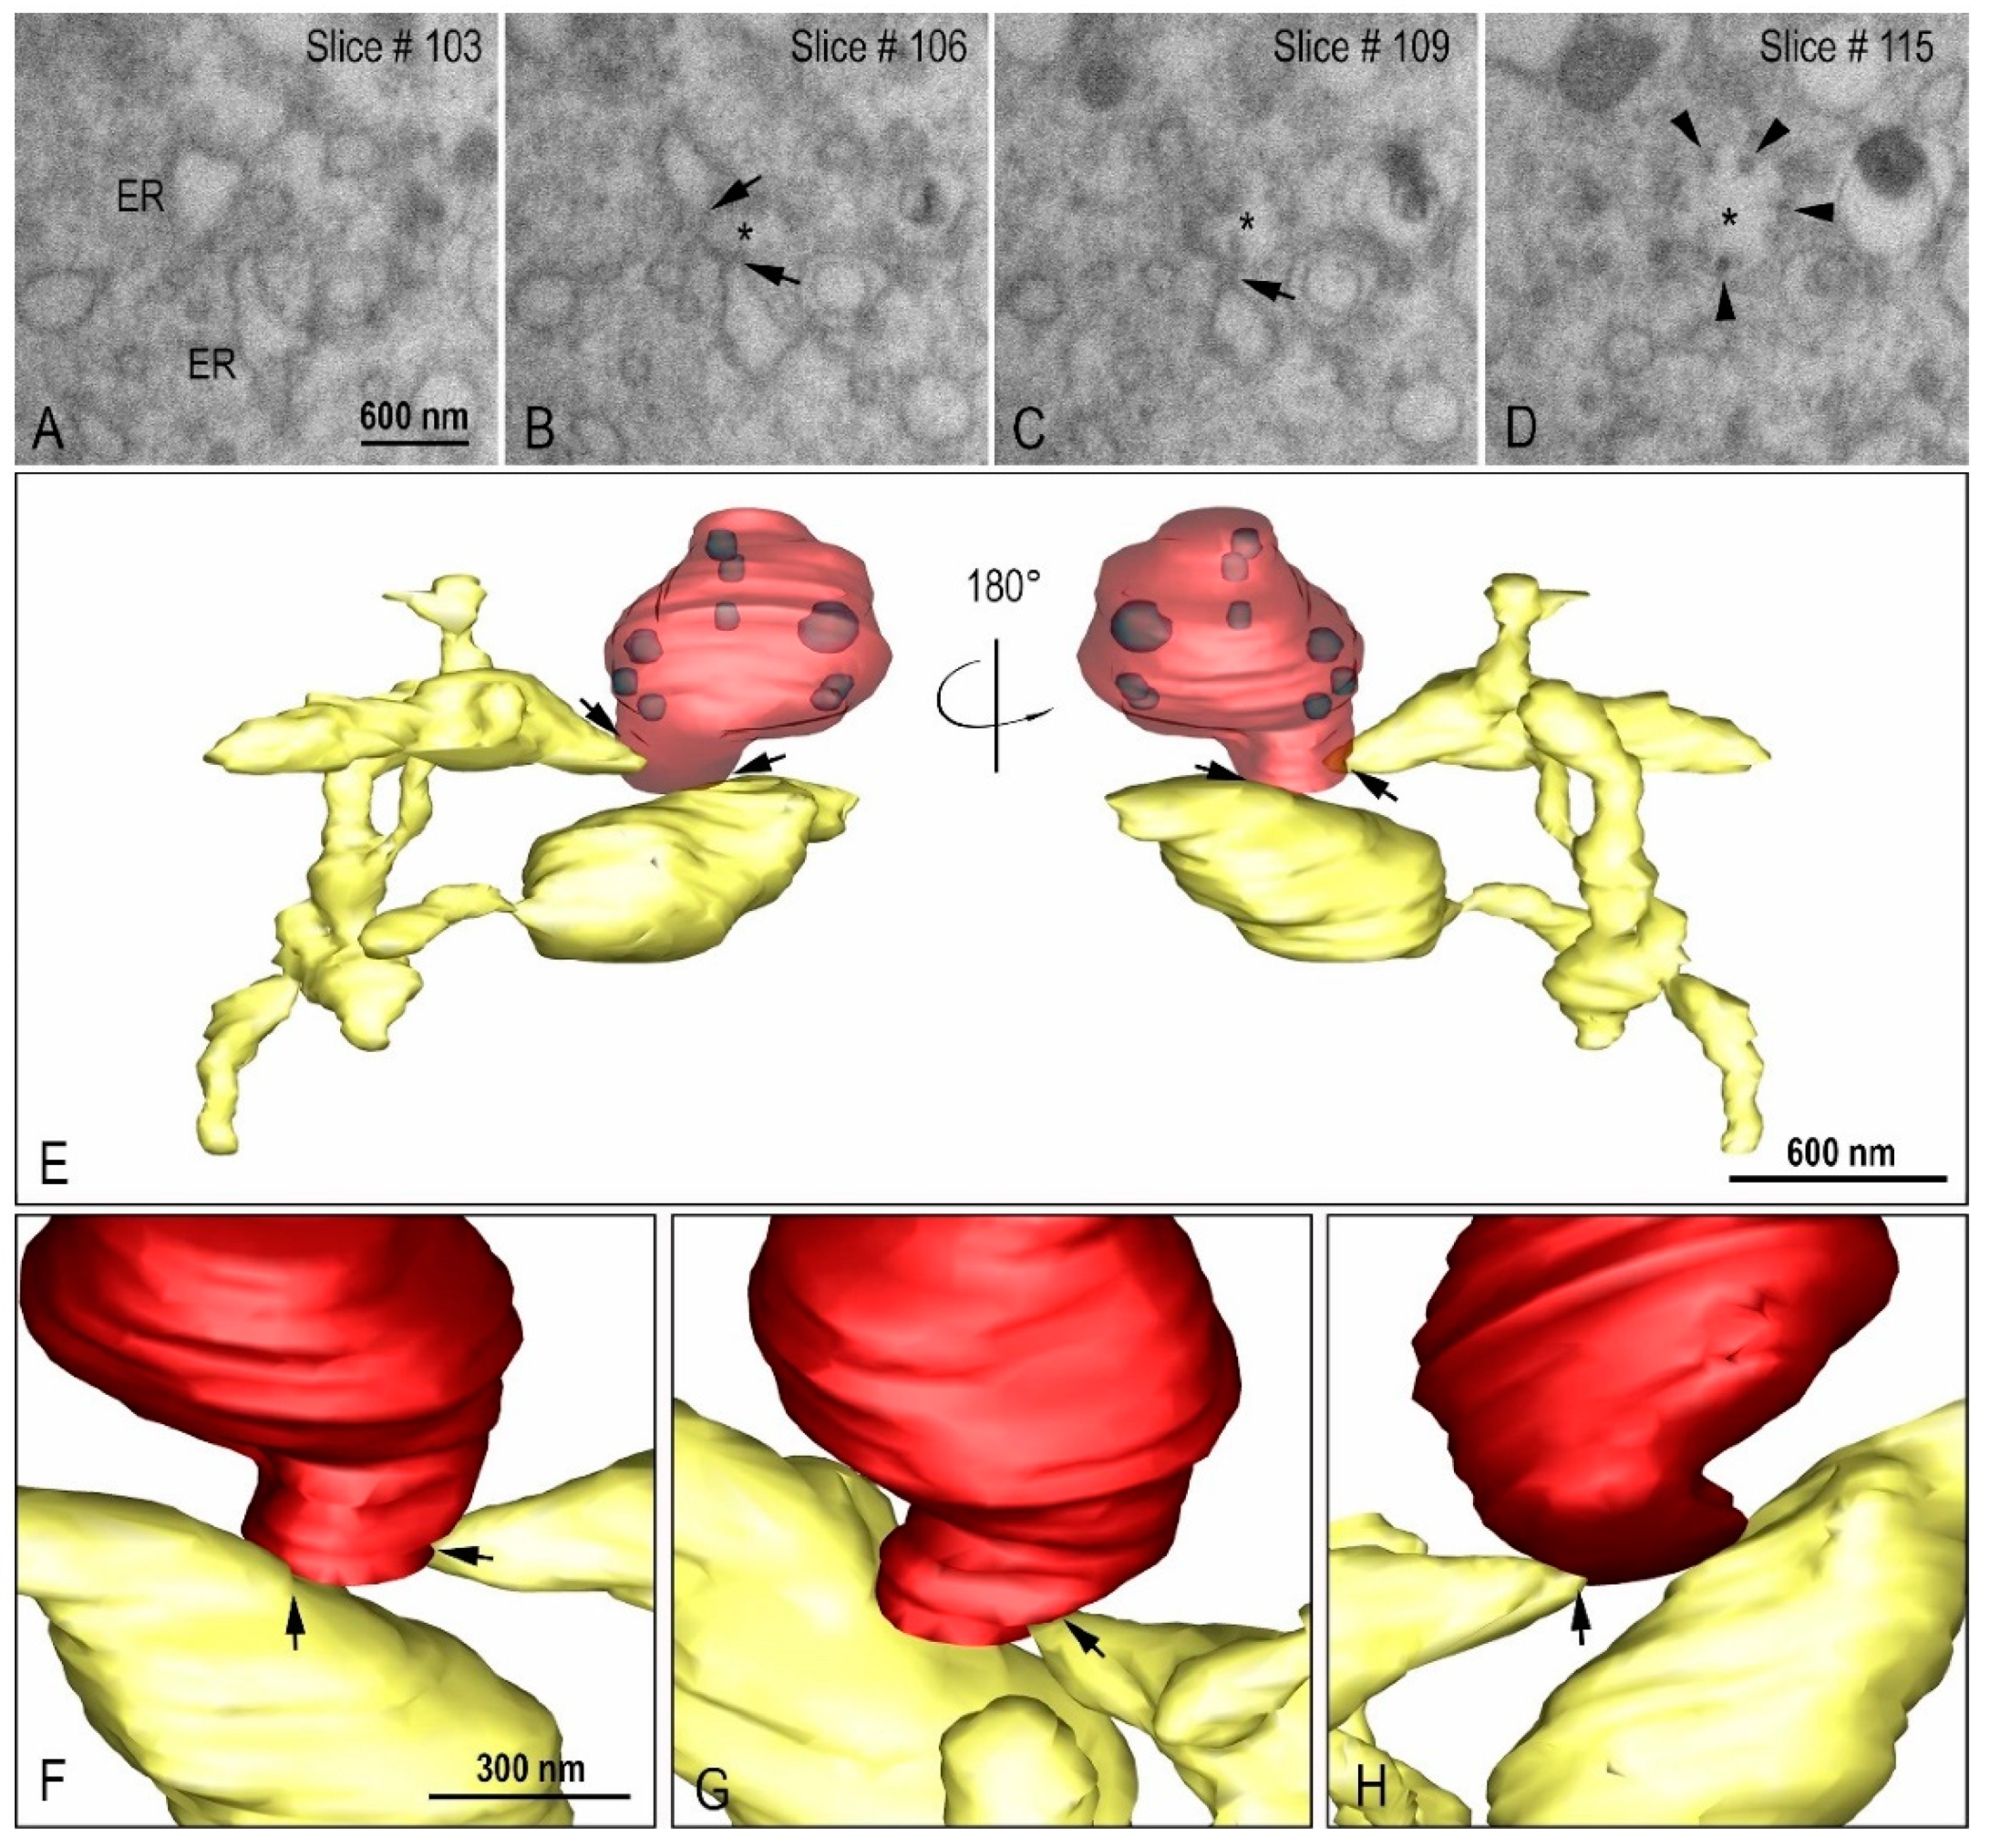
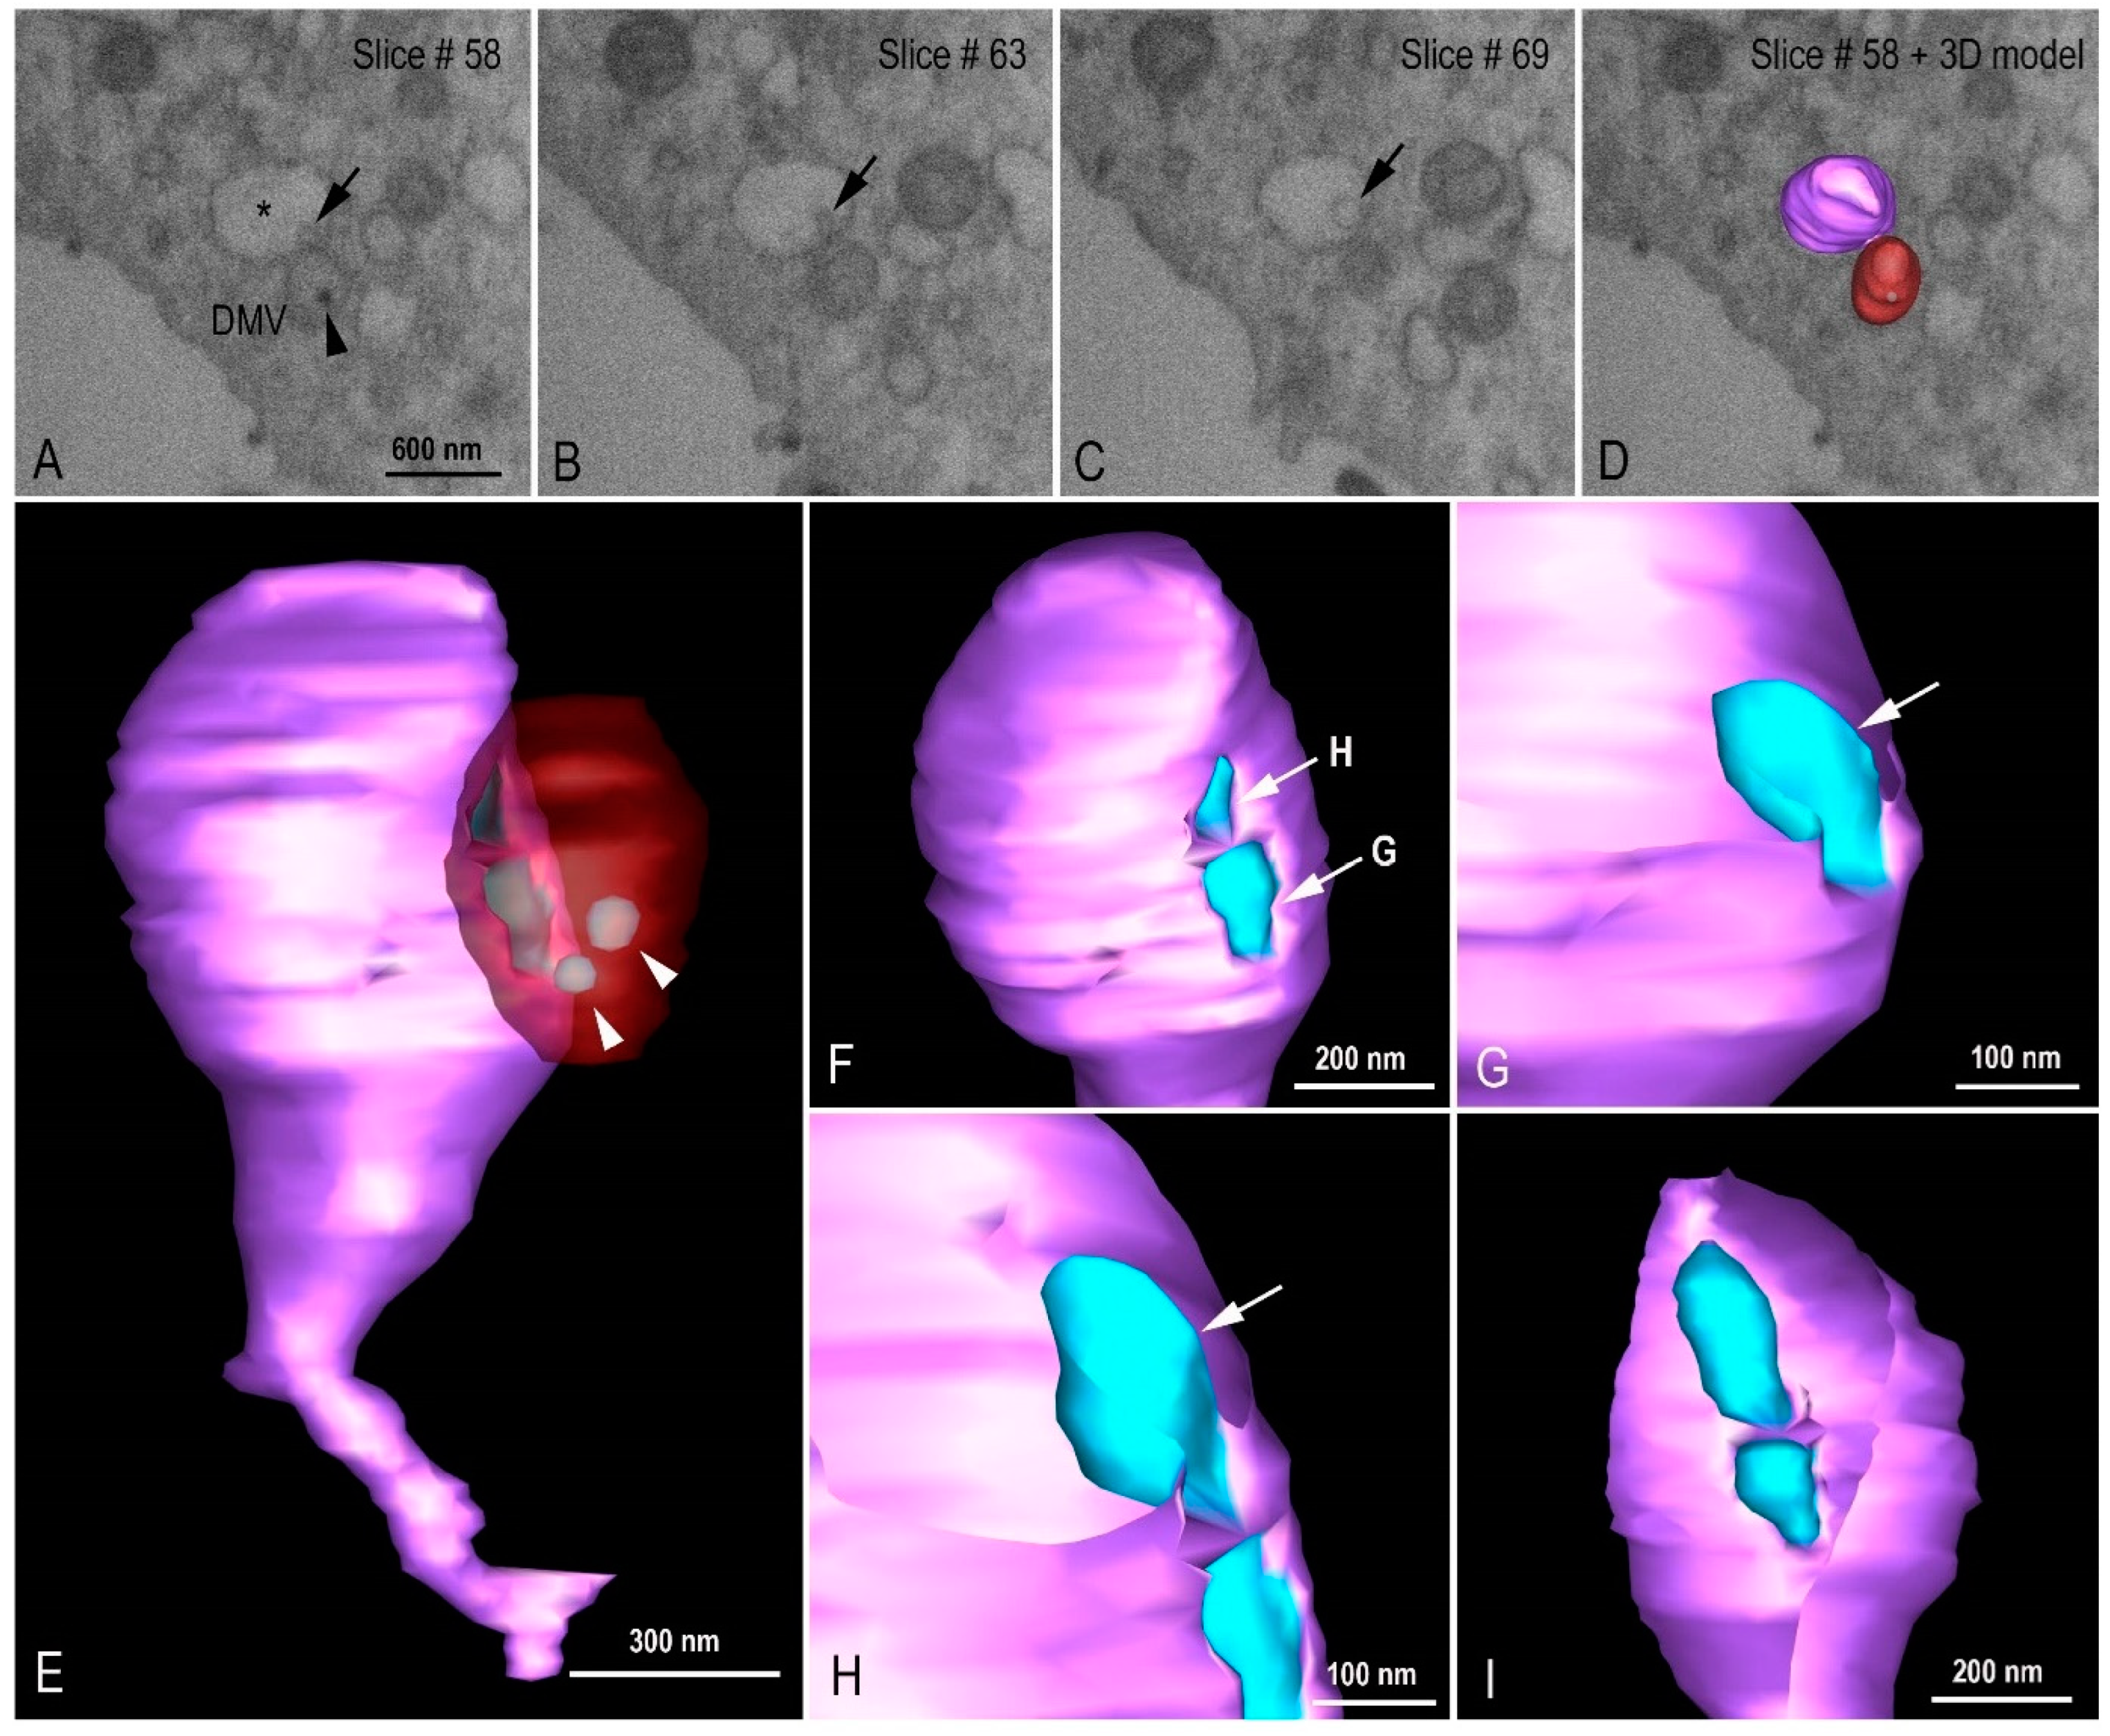
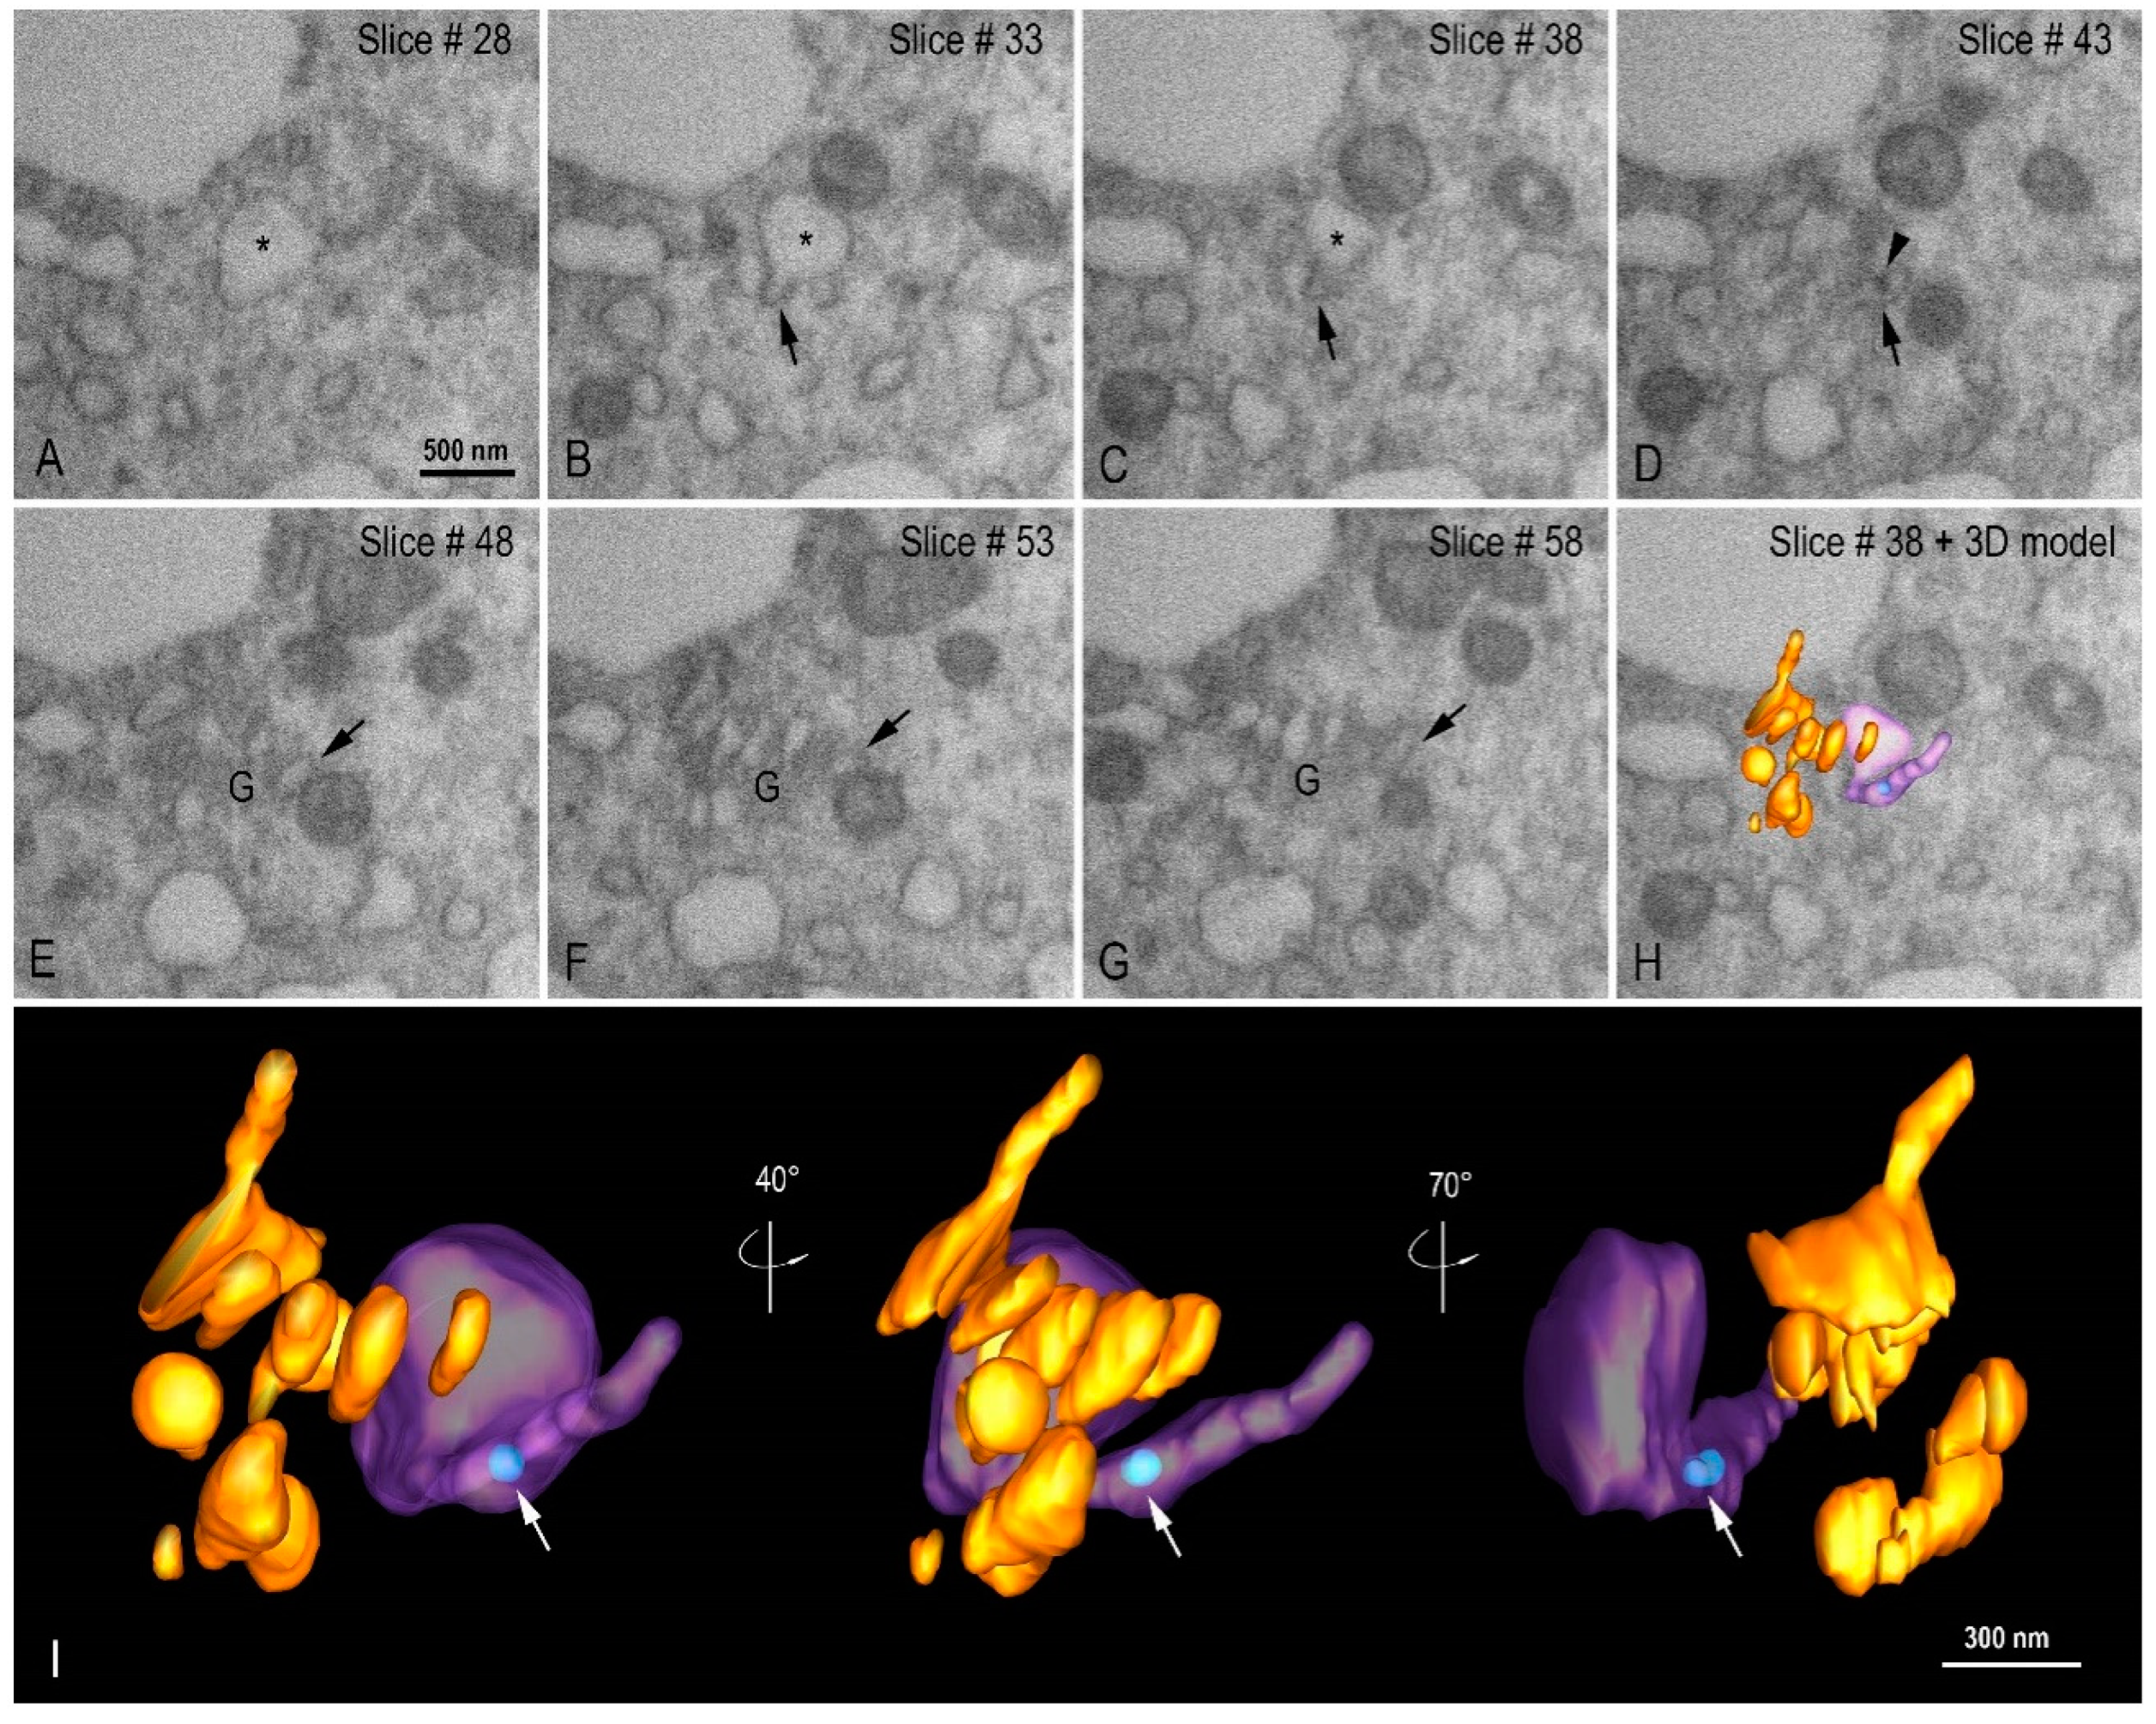
3.3. Morphogenesis of SARS-CoV-2 in Vero-E6 Cell
4. Discussion
Supplementary Materials
Author Contributions
Funding
Institutional Review Board Statement
Informed Consent Statement
Data Availability Statement
Acknowledgments
Conflicts of Interest
References
- Gorbalenya, A.E.; Baker, S.C.; Baric, R.S.; Groot, R.J.; Drosten, C.; Gulyaeva, A.A.; Haagmans, B.L.; Lauber, C.; Leontovich, A.M.; Neuman, B.W.; et al. The species severe acute respiratory syndrome-related coronavirus: Classifying 2019-nCoV and naming it SARS-CoV-2. Nat. Microbiol. 2020, 5, 536–544. [Google Scholar]
- Corman, V.M.; Landt, O.; Kaiser, M.; Molenkamp, R.; Meijer, A.; Chu, D.K.W.; Bleicker, T.; Brünink, S.; Schneider, J.; Schmidt, M.L.; et al. Detection of 2019 novel coronavirus (2019-nCoV) by real-time RT-PCR. Eurosurveillance 2020, 25, 2000045. [Google Scholar] [CrossRef] [Green Version]
- Jiang, S.; Du, L.; Shi, Z. An emerging coronavirus causing pneumonia outbreak in Wuhan, China: Calling for developing therapeutic and prophylactic strategies. Emerg. Microbes Infect. 2020, 9, 275–277. [Google Scholar] [CrossRef] [PubMed]
- Lu, H.; Stratton, C.W.; Tang, Y.W. Outbreak of pneumonia of unknown etiology in Wuhan China: The mystery and the miracle. J. Med. Virol. 2020, 92, 401–402. [Google Scholar] [CrossRef] [Green Version]
- Ren, L.-L.; Wang, Y.-M.; Wu, Z.-Q.; Xiang, Z.-C.; Guo, L.; Xu, T.; Jiang, Y.-Z.; Xiong, Y.; Li, Y.-J.; Li, X.-W.; et al. Identification of a novel coronavirus causing severe pneumonia in human: A descriptive study. Chin. Med. J. 2020, 133, 1015–1024. [Google Scholar] [CrossRef]
- Letko, M.; Marzi, A.; Munster, V. Functional assessment of cell entry and receptor usage for SARS- CoV-2 and other lineage B betacoronaviruses. First functional assessment of the interaction of the SARS-CoV-2 Spike protein receptor binding domain with the cellular receptor ACE2. Nat. Microbiol. 2020, 5, 562–569. [Google Scholar] [CrossRef] [Green Version]
- Knoops, K.; Kikkert, M.; Worm, S.H.E.V.D.; Zevenhoven-Dobbe, J.C.; Van Der Meer, Y.; Koster, A.J.; Mommaas, A.M.; Snijder, E.J. SARS-Coronavirus Replication Is Supported by a Reticulovesicular Network of Modified Endoplasmic Reticulum. PLoS Biol. 2008, 6, e226. [Google Scholar] [CrossRef] [PubMed]
- Walls, A.C.; Park, Y.J.; Tortorici, M.A.; Wall, A.; McGuire, A.T.; Veesler, D. Structure, function, and antigenicity of the SARS-CoV-2 spike glycoprotein. Recommended resource describing key aspects of SARS-CoV-2 Spike features. Cell 2020, 181, 281–292.e6. [Google Scholar] [CrossRef]
- Zhang, Q.; Cui, J.; Huang, X.; Zheng, H.; Huang, J.; Fang, L.; Li, K.; Zhang, J. The life cycle of SARS coronavirus in Vero E6 cells. J. Med. Virol. 2004, 73, 332–337. [Google Scholar]
- Goldsmith, C.S.; Tatti, K.M.; Ksiazek, T.G.; Rollin, P.; Comer, J.A.; Lee, W.W.; Rota, P.A.; Bankamp, B.; Bellini, W.J.; Zaki, S.R. Ultrastructural Characterization of SARS Coronavirus. Emerg. Infect. Dis. 2004, 10, 320–326. [Google Scholar] [CrossRef]
- Snijder, E.J.; van der Meer, Y.; Zevenhoven-Dobbe, J.; Onderwater, J.J.; van der Meulen, J.; Koerten, H.K.; Mommaas, A.M. Ultrastructure and origin of membrane vesicles associated with the severe acute respiratory syndrome coronavirus replication complex. J. Virol. 2006, 80, 5927–5940. [Google Scholar] [CrossRef] [Green Version]
- Netherton, C.L.; Wileman, T. Virus factories, double membrane vesicles and viroplasm generated in animal cells. Curr. Opin. Virol. 2011, 1, 381–387. [Google Scholar] [CrossRef]
- Blanchard, E.; Roingeard, P. Virus-induced double-membrane vesicles. Cell. Microbiol. 2015, 17, 45–50. [Google Scholar] [CrossRef]
- Klein, S.; Cortese, M.; Winter, S.L.; Wachsmuth-Melm, M.; Neufeldt, C.J.; Cerikan, B.; Stanifer, M.L.; Boulant, S.; Barten-schlager, R.; Chlanda, P. SARS-CoV-2 structure and replication characterized by in situ cryo-electron tomography. Nat. Commun. 2020, 11, 5885. [Google Scholar] [CrossRef] [PubMed]
- Harak, C.; Lohmann, V. Ultrastructure of the replication sites of positive-strand RNA viruses. Virology 2015, 479, 418–433. [Google Scholar] [CrossRef] [Green Version]
- V’kovski, P.; Kratzel, A.; Steiner, S.; Stalder, H.; Thiel, T. Coronavirus biology and replication: Implications for SARS-CoV-2. Nat. Rev. Microbiol. 2021, 19, 155–170. [Google Scholar] [CrossRef]
- Matsuyama, S.; Nao, N.; Shirato, K.; Kawase, M.; Saito, S.; Takayama, I.; Nagata, N.; Sekizuka, T.; Katoh, H.; Kato, F. Enhanced isolation of SARS-CoV-2 by TMPRSS2-expressing cells. Proc. Natl. Acad. Sci. USA 2020, 117, 7001–7003. [Google Scholar] [CrossRef] [Green Version]
- Banerjee, A.; Nasir, J.A.; Budylowski, P.; Yip, L.; Aftanas, P.; Christie, N.; Ghalami, A.; Baid, K.; Raphenya, A.R.; Hirota, J.A. Isolation, sequence, infectivity and replication kinetics of SARS-CoV-2. Emerg. Infect. Dis. 2020, 26, 2054–2063. [Google Scholar] [CrossRef]
- Tseng, C.-T.K.; Tseng, J.; Perrone, L.; Worthy, M.; Popov, V.; Peters, C.J. Apical Entry and Release of Severe Acute Respiratory Syndrome-Associated Coronavirus in Polarized Calu-3 Lung Epithelial Cells. J. Virol. 2005, 79, 9470–9479. [Google Scholar] [CrossRef] [Green Version]
- Mossel, E.C.; Huang, C.; Narayanan, K.; Makino, S.; Tesh, R.B.; Peters, C.J. Exogenous ACE2 Expression Allows Refractory Cell Lines to Support Severe Acute Respiratory Syndrome Coronavirus Replication. J. Virol. 2005, 79, 3846–3850. [Google Scholar] [CrossRef] [Green Version]
- Kaye, M.; Druce, J.; Tran, T.; Kostecki, R.; Chibo, D.; Morris, J.; Catton, M.; Birch, C. SARS–associated Coronavirus Replication in Cell Lines. Emerg. Infect. Dis. 2006, 12, 128–133. [Google Scholar] [CrossRef] [Green Version]
- Ogando, N.S.; Dalebout, T.J.; Zevenhoven-Dobbe, J.C.; Limpens, R.W.; van der Meer, Y.; Caly, L.; Druce, J.; de Vries, J.J.C.; Kikkert, M.; Bárcena, M.; et al. SARS-coronavirus-2 replication in Vero E6 cells: Replication kinetics, rapid adaptation and cytopathology. J. Gen. Virol. 2020, 101, 925–940. [Google Scholar] [CrossRef] [PubMed]
- Barreto-Vieira, D.F.; da Silva, M.A.N.; Garcia, C.C.; Miranda, M.D.; Matos, A.D.R.; Caetano, B.C.; Resende, P.C.; Motta, F.C.; Siqueira, M.M.; Wendell Girard, D.; et al. Morphology and morphogenesis of SARS-CoV-2 in Vero-E6 cells. Mem. Inst. Oswaldo Cruz 2021, 116, e200443. [Google Scholar] [CrossRef] [PubMed]
- Matos, A.D.R.; Motta, F.C.; Caetano, B.C.; Ogrzewalska, M.; Garcia, C.C.; Lopes, J.C.O.; Miranda, M.; Livorati, M.T.F.P.; Abreu, A.; Brown, D.; et al. Identification of SARS-CoV-2 and additional respiratory pathogens cases under the investigation of COVID-19 initial phase in a Brazilian reference laboratory. Mem. Inst. Oswaldo Cruz 2020, 115, e200232. [Google Scholar] [CrossRef] [PubMed]
- Szretter, K.J.; Balish, A.L.; Katz, J.M. Influenza: Propagation, quantification, and storage. Curr. Protoc. Microbiol. 2006, 3, 15G.1. [Google Scholar] [CrossRef] [PubMed]
- Barreto-Vieira, D.F.; Barth-Schatzmayr, O.M.; Schatzmayr, H.G. Modelo animal experimental para o estudo da patogênese dos vírus dengue sorotipos 1 e 2. In Manual de Técnicas; Interciência: Rio de Janeiro, Brasil, 2010. [Google Scholar]
- Barth, O.M.; da Silva, M.A.N.; Barreto-Vieira, D.F. Low impact to fixed cell processing aiming transmission electron microscopy. Mem. Inst. Oswaldo Cruz 2016, 111, 411–413. [Google Scholar] [CrossRef] [PubMed] [Green Version]
- Kremer, J.R.; Mastronarde, D.N.; McIntosh, J.R. Computer Visualization of Three-Dimensional Image Data Using IMOD. J. Struct. Biol. 1996, 116, 71–76. [Google Scholar] [CrossRef] [Green Version]
- Dias, S.S.G.; Soares, V.C.; Ferreira, A.C.; Sacramento, C.Q.; Fintelman-Rodrigues, N.; Temerozo, J.R.; Teixeira, L.; Nunes da Silva, M.A.; Barreto, E.; Mattos, M.; et al. Lipid droplets fuel SARS-CoV-2 replication and production of inflammatory mediators. PLoS Pathog. 2020, 16, e1009127. [Google Scholar] [CrossRef]
- Souza-Moreira, L.; Soares, V.C.; Dias, S.D.S.G.; Bozza, P.T. Adipose-derived Mesenchymal Stromal Cells Modulate Lipid Metabolism and Lipid Droplet Biogenesis via AKT/mTOR –PPARγ Signalling in Macrophages. Sci. Rep. 2019, 9, 1–11. [Google Scholar] [CrossRef] [Green Version]
- Ng, M.L.; Lee, J.W.M.; Leong, M.L.N.; Ling, A.E.; Tan, H.C.; Ooi, E.E. Topographic changes in SARS coronavirus-infected cells at late stages of infection. Emerg. Infect. Dis. 2004, 10, 1907–1914. [Google Scholar] [CrossRef] [Green Version]
- Caldas, L.A.; Carneiro, F.A.; Higa, L.M.; Monteiro, F.L.; da Silva, G.P.; da Costa, L.J.; Durigon, E.L.; Tanuri, A.; de Souza, W. Ultrastructural analysis of SARS-CoV-2 interactions with the host cell via high resolution scanning electron microscopy. Sci. Rep. 2020, 10, 16099. [Google Scholar] [CrossRef]
- Sherer, N.M.; Lehmann, M.J.; Jimenez-Soto, L.F.; Horensavitz, C.; Pypaert, M.; Mothers, W. Retroviruses can establish filopodial bridges for efficient cell-to-cell transmission. Nat. Cell Biol. 2007, 9, 310–315. [Google Scholar] [CrossRef] [Green Version]
- Mothes, W.; Sherer, N.M.; Jin, J.; Zhong, P. Virus Cell-to-Cell Transmission. J. Virol. 2010, 84, 8360–8368. [Google Scholar] [CrossRef] [Green Version]
- Chang, K.; Baginski, J.; Hassan, S.F.; Volin, M.; Shukla, D.; Tiwari, V. Filopodia and Viruses: An Analysis of Membrane Processes in Entry Mechanisms. Front. Microbiol. 2016, 7, 300. [Google Scholar] [CrossRef] [Green Version]
- Tiwari, V.; Tarbutton, M.S.; Shukla, D. Diversity of heparan sulfate and HSV entry: Basic understanding and treatment strategies. Molecules 2015, 20, 2707–2727. [Google Scholar] [CrossRef] [Green Version]
- Braga, L.; Ali, H.; Secco, I.; Chiavacci, E.; Neves, G.; Goldhill, D.; Penn, R.; Jimenez-Guardeño, J.M.; Ortega-Prieto, A.M.; Bussani, R.; et al. Drugs that inhibit TMEM16 proteins block SARS-CoV-2 spike-induced syncytia. Nature 2021, 594, 88–93. [Google Scholar] [CrossRef]
- Zhu, N.; Dingyu, Z.; Wenling, W.; Xingwang, L.; Bo, Y.; Song, J.; Zhao, X.; Huang, B.; Shi, W.; Lu, R.; et al. A novel coronavirus from patients with pneumonia in China, 2019. N. Engl. J. Med. 2020, 382, 723–733. [Google Scholar] [CrossRef]
- Nardacci, R.; Colavita, F.; Castilletti, C.; Lapa, D.; Matusali, G.; Meschi, S.; Del Nonno, F.; Colombo, D.; Capobianchi, M.R.; Zumla, A.; et al. Evidences for lipid involvement in SARS-CoV-2 cytopathogenesis. Cell Death Dis. 2021, 12, 1–12. [Google Scholar] [CrossRef]
- Laue, M.; Kauter, A.; Hoffmann, T.; Möller, L.; Michel, J.; Nitsche, A. Morphometry of SARS-CoV and SARS-CoV-2 particles in ultrathin plastic sections of infected Vero cell cultures. Sci. Rep. 2021, 11, 3515. [Google Scholar] [CrossRef]
- Werion, A.; Belkhir, L.; Perrot, M.; Schmit, G.; Aydin, S.; Chen, Z.; Penaloza, A.; De Greef, J.; Yildiz, H.; Pothen, L.; et al. SARS-CoV-2 causes a specific dysfunction of the kidney proximal tubule. Kidney Int. 2020, 98, 1296–1307. [Google Scholar] [CrossRef]
- Park, W.B.; Kwon, N.J.; Choi, S.J.; Kang, C.K.; Choe, P.G.; Kim, J.Y.; Yun, J.; Lee, G.W.; Seong, M.W.; Kim, N.J.; et al. Virus isolation from the first patient with SARS-CoV-2 in Korea. J. Korean Med. Sci. 2020, 35, e84. [Google Scholar] [CrossRef] [PubMed]
- Song, Z.; Xu, Y.; Bao, L.; Zhang, L.; Yu, P.; Qu, Y.; Zhu, H.; Zhao, W.; Han, Y.; Qin, C. From SARS to MERS, thrusting coronaviruses into the spotlight. Viruses 2019, 11, 59. [Google Scholar] [CrossRef] [Green Version]
- Ng, M.; Tan, S.; See, E.; Ooi, E.; Ling, A. Early events of SARS coronavirus infection in Vero cells. J. Med Virol. 2003, 71, 323–331. [Google Scholar] [CrossRef] [PubMed]
- Paul, D.; Hoppe, S.; Saher, G.; Krijnse-Locker, J.; Bartenschlager, R. Morphological and Biochemical Characterization of the Membranous Hepatitis C Virus Replication Compartment. J. Virol. 2013, 87, 10612–10627. [Google Scholar] [CrossRef] [PubMed] [Green Version]
- De Wilde, A.H.; Raj, V.S.; Oudshoorn, D.; Bestebroer, T.M.; Van Nieuwkoop, S.; Limpens, R.W.A.L.; Posthuma, C.C.; Van Der Meer, Y.; Barcena, M.; Haagmans, B.L.; et al. MERS-coronavirus replication induces severe in vitro cytopathology and is strongly inhibited by cyclosporin A or interferon-α treatment. J. Gen. Virol. 2013, 94, 1749–1760. [Google Scholar] [CrossRef]
- Wolff, G.; Melia, C.E.; Snijder, E.J.; Bárcena, M. Double-Membrane Vesicles as Platforms for Viral Replication. Trends Microbiol. 2020, 28, 1022–1033. [Google Scholar] [CrossRef]
- Zhou, X.; Cong, Y.; Veenendaal, T.; Klumperman, J.; Shi, D.; Mari, M.; Reggiori, F. Ultrastructural Characterization of Membrane Rearrangements Induced by Porcine Epidemic Diarrhea Virus Infection. Viruses 2017, 9, 251. [Google Scholar] [CrossRef]
- Snijder, E.J.; Limpens, R.W.A.L.; de Wilde, A.H.; de Jong, A.W.M.; Zevenhoven-Dobbe, J.C.; Maier, H.J.; Faas, F.F.G.A.; Koster, A.J.; Bárcena, M. A unifying structural and functional model of the coronavirus replication organelle: Tracking down RNA synthesis. PLOS Biol. 2020, 18, e3000715. [Google Scholar] [CrossRef]
- Oudshoorn, D.; Rijs, K.; Limpens, R.W.A.L.; Groen, K.; Koster, A.J.; Snijder, E.R.; Kikkert, M.; Bárcena, M. Expression and cleavage of middle east respiratory syndrome coronavirus nsp3-4 polyprotein induce the formation of double-membrane vesicles that mimic those associated with coronaviral RNA replication. mBio 2017, 8, e01658-17. [Google Scholar] [CrossRef] [Green Version]
- Mendonça, L.; Howe, A.; Gilchrist, J.B.; Sun, D.; Knight, M.L.; Zanetti-Domingues, L.C.; Bateman, B.; Krebs, A.S.; Chen, L.; Radecke, J.; et al. SARS-CoV-2 assembly and egress pathway revealed by correlative multi-modal multi-scale cryo-imaging. Nat Commun. 2021, 30, 4629. [Google Scholar] [CrossRef] [PubMed]
- Cortese, M.; Lee, J.Y.; Cerikan, B.; Neufeldt, C.J.; Oorschot, V.M.J.; Köhrer, S.; Hennies, J.; Schieber, N.L.; Ronchi, P.; Mizzon, G.; et al. Integrative imaging reveals SARS-CoV-2-induced reshaping of subcellular morphologies. Cell Host Microbe 2020, 28, 853–866.e5. [Google Scholar] [CrossRef] [PubMed]
- Siu, Y.L.; Teoh, K.T.; Chan, C.M.; Kien, F.; Escriou, N.; Tsao, S.W.; Nicholls, J.M.; Altmeyer, R.; Peiris, J.S.M.; Bruzzone, R.; et al. The M, E, and N structural proteins of the severe acute respiratory syndrome coronavirus are required for efficient assembly, trafficking, and release of virus-like particles. J. Virol. 2008, 82, 11318–11330. [Google Scholar] [CrossRef] [Green Version]
- David-Ferreira, J.F.; Manaker, R.A. An electron microscope study of the development of a mouse hepatitis virus in tissue culture cells. J. Cell Biol. 1965, 24, 57–78. [Google Scholar] [CrossRef] [Green Version]
- Krijnse-Locker, J.; Ericsson, M.; Rottier, P.J.M.; Griffiths, G. Characterization of the budding compartment of mouse hepatitis virus: Evidence that transport from the RER to the Golgi complex requires only one vesicular transport step. J. Cell Biol. 1994, 124, 55–70. [Google Scholar] [CrossRef] [Green Version]
- Perlman, S.; Masters, P.S. Coronaviridae: The Viruses and Their Replication, 7th ed.; LWW: New York, NY, USA, 2020; Volume 1. [Google Scholar]
- Qian, Z.; Travanty, E.A.; Oko, L.; Edeen, K.; Berglund, A.; Wang, J.; Ito, Y.; Holmes, K.V.; Mason, R.J. Innate immune response of human alveolar type II cells infected with severe acute respiratory syndrome-coronavirus. Am. J. Respir. Cell Mol. Biol. 2013, 48, 742–748. [Google Scholar] [CrossRef] [PubMed] [Green Version]
- Ksiazek, T.G.; Erdman, D.; Goldsmith, C.S.; Zaki, S.R.; Peret, T.; Emery, S.; Tong, S.; Urbani, C.; Comer, J.A.; Lim, W.; et al. A Novel Coronavirus Associated with Severe Acute Respiratory Syndrome. N. Engl. J. Med. 2003, 348, 1953–1966. [Google Scholar] [CrossRef]
- Johnson, K.M.; Lange, J.V.; Webb, P.A.; Murphy, F.A. Isolation and partial characterization of a new virus causing acute hæmorrhagic fever in zaire. Lancet 1977, 309, 569–571. [Google Scholar] [CrossRef]
- Bowen, E.T.; Lloyd, G.; Harris, W.J.; Platt, G.S.; Baskerville, A.; Vella, E.E. Viral haemorrhagic fever in southern Sudan and northern Zaire. Preliminary studies on the etiological agent. Lancet 1977, 1, 571–573. [Google Scholar] [CrossRef]
- Pattyn, S.; Groen, G.; Jacob, W.; Piot, P.; Courteille, G. Isolation of marburg-like virus from a case of hæmorrhagic fever in zaire. Lancet 1977, 309, 573–574. [Google Scholar] [CrossRef]
- Murray, K.; Selleck, P.; Hooper, P.; Hyatt, A.; Gould, A.; Gleeson, L.; Westbury, H.; Hiley, L.; Selvey, L.; Rodwell, B. A morbillivirus that caused fatal disease in horses and humans. Science 1995, 268, 94–97. [Google Scholar] [CrossRef]
- Chua, K.B.; Bellini, W.J.; Rota, P.A.; Harcourt, B.H.; Tamin, A.; Lam, S.K.; Ksiazek, T.G.; Rollin, P.E.; Zaki, S.R.; Shieh, W.-J.; et al. Nipah Virus: A Recently Emergent Deadly Paramyxovirus. Science 2000, 288, 1432–1435. [Google Scholar] [CrossRef] [PubMed]
- Centers for Disease Control and Prevention Multistate outbreak of monkeypox—Illinois, Indiana, and Wisconsin, 2003. MMWR Morb. Mortal Wkly. Rep. 2003, 52, 537–540.


Publisher’s Note: MDPI stays neutral with regard to jurisdictional claims in published maps and institutional affiliations. |
© 2022 by the authors. Licensee MDPI, Basel, Switzerland. This article is an open access article distributed under the terms and conditions of the Creative Commons Attribution (CC BY) license (https://creativecommons.org/licenses/by/4.0/).
Share and Cite
Barreto-Vieira, D.F.; da Silva, M.A.N.; de Almeida, A.L.T.; Rasinhas, A.d.C.; Monteiro, M.E.; Miranda, M.D.; Motta, F.C.; Siqueira, M.M.; Girard-Dias, W.; Archanjo, B.S.; et al. SARS-CoV-2: Ultrastructural Characterization of Morphogenesis in an In Vitro System. Viruses 2022, 14, 201. https://doi.org/10.3390/v14020201
Barreto-Vieira DF, da Silva MAN, de Almeida ALT, Rasinhas AdC, Monteiro ME, Miranda MD, Motta FC, Siqueira MM, Girard-Dias W, Archanjo BS, et al. SARS-CoV-2: Ultrastructural Characterization of Morphogenesis in an In Vitro System. Viruses. 2022; 14(2):201. https://doi.org/10.3390/v14020201
Chicago/Turabian StyleBarreto-Vieira, Debora Ferreira, Marcos Alexandre Nunes da Silva, Ana Luisa Teixeira de Almeida, Arthur da Costa Rasinhas, Maria Eduarda Monteiro, Milene Dias Miranda, Fernando Couto Motta, Marilda M. Siqueira, Wendell Girard-Dias, Bráulio Soares Archanjo, and et al. 2022. "SARS-CoV-2: Ultrastructural Characterization of Morphogenesis in an In Vitro System" Viruses 14, no. 2: 201. https://doi.org/10.3390/v14020201