the Creative Commons Attribution 4.0 License.
the Creative Commons Attribution 4.0 License.
 | 16 Jun 2021
The effect of confinement due to COVID-19 on seismic noise in Mexico
Xyoli Pérez-Campos
Víctor H. Espíndola
Daniel González-Ávila
Betty Zanolli Fabila
Víctor H. Márquez-Ramírez
Raphael S. M. De Plaen
Juan Carlos Montalvo-Arrieta
Luis Quintanar
The world experienced the beginning of the COVID-19 pandemic by the end of 2019 to the beginning of 2020. Governments implemented strategies to contain it, most based on lockdowns. Mexico was no exception. The lockdown was initiated in March 2020, and with it, a reduction in the seismic noise level was witnessed by the seismic stations of the national and Valley of Mexico networks. Stations located in municipalities with more than 50 000 people usually experience larger seismic noise levels at frequencies between 1 and 5 Hz, associated with human activity. The largest noise levels are recorded in Mexico City, which has the largest population in the country. The largest drop was observed in Hermosillo, Sonora; however, it was also the city with the fastest return to activities, which seems to correlate with a quick increase in confirmed COVID-19 cases. Mexico initiated a traffic-light system to modulate the re-opening of economic activities for each state. Therefore, since 1 June, noise levels have generally reflected the colour of the state traffic light. Furthermore, the reduction in the noise level at seismic stations has allowed identification of smaller earthquakes without signal processing. Also, people in cities have perceived smaller or more distant quakes.
- Article
(9537 KB) - Full-text XML
- BibTeX
- EndNote


The World Health Organization declared a Public Health Emergency of International Concern to COVID-19, the disease generated by the SARS-Cov2 coronavirus, on 30 January 2020. The emergency was declared after the first case was reported in Wuhan, China, in late 2019 with cases also reported in other Asian and European countries. As a measure to stop the transmission of the virus, governments initiated strategies that involve confinement in our homes and reducing our mobility with the hope of reducing the spread of the virus itself. This implied a decrease in activity in the cities, which seismologists immediately observed in their records (e.g. Lecocq et al., 2020). Specifically, in Mexico, the first case of COVID-19 appeared on 13 January (http://coronavirus.gob.mx/datos/, last access: 11 November 2020). Mexico's government decided to hold a daily press conference starting on 22 January with the Undersecretary of Health as the spokesperson. At the press conference on Friday 13 March, the “Sana Distancia” (Healthy Distance) programme was presented. The strategy included the lockdown programme called #QuédateEnCasa (#StayAtHome). All non-essential activities were supposed to be either suspended or done remotely from home starting 23 March. However, that weekend, the Secretary of Public Education announced that school activities would be suspended as of that date (14 March) and until after Easter week: that is, there would be a probable return for dates after 20 April. Other institutions, both educational and business, also began to outline their strategies to migrate to online and remote operations and activities, inviting the population at risk not to return to their workplaces after 16 March, which was a holiday in Mexico. When the number of confirmed cases per day began to change its behaviour and growth began to accelerate, on 24 March, the Secretary of Health officially declared the beginning of phase 2 of the contingency for SARS-Cov2.
Phase 3, with 8772 confirmed cases, was declared on 21 April. Lockdown was confirmed to last at least until 30 May (https://www.gob.mx/salud/prensa/110-inicia-la-fase-3-por-covid-19, last access: 23 November 2020). On 1 June, a traffic-light system with four levels (red, orange, yellow, green) was implemented at the state level to strategically and gradually open economic activities in each state. Mexico is a large country integrating 32 states (Fig. 1) with very distinct economic and social conditions. Each state analyses its epidemic risk weekly based on 10 indexes (Secretaría de Salud, 2020a). All states started in red. The first state to go orange was Zacatecas on 15 June, and the first one to go yellow on 17 August and green on 28 September was Campeche. Some states lowered their risk level only to increase it again, returning to a colour that represents the increased contamination risk. For example, Chihuahua went from red to orange on 19 October and went back to red on 26 October.
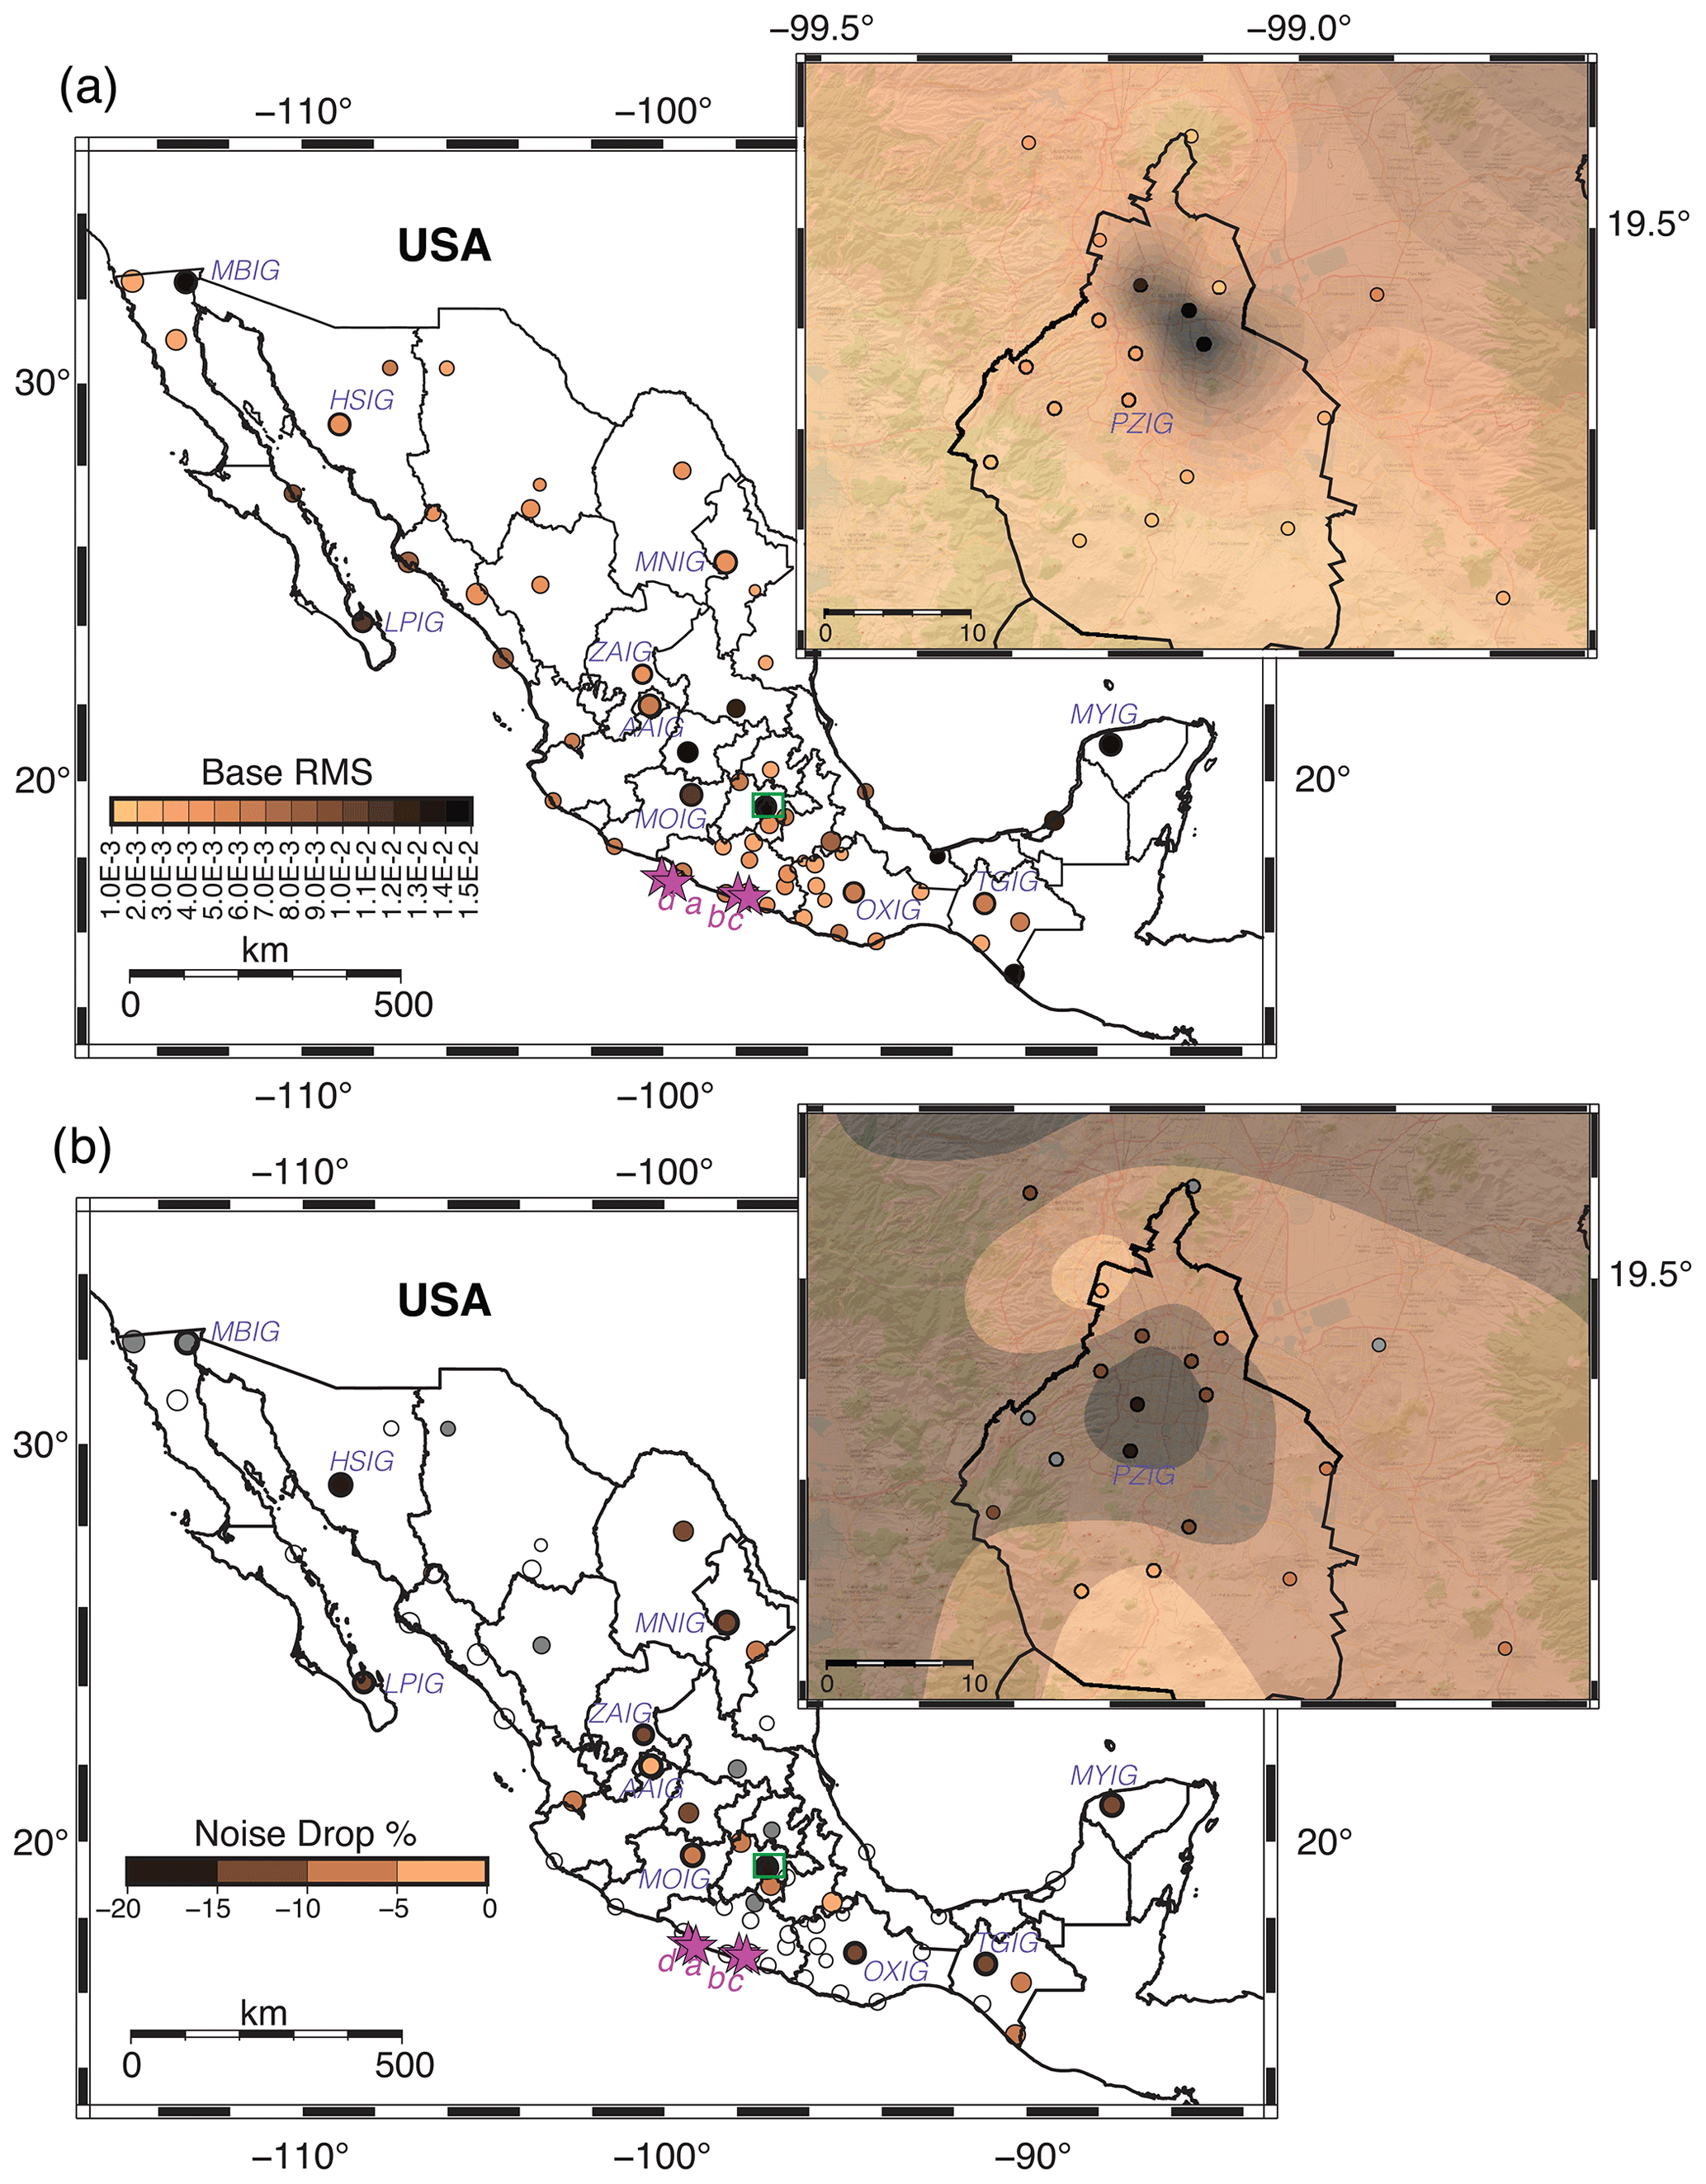
Figure 1(a) Noise rms level and (b) drop at seismic stations in Mexico. The pink stars indicate the location of the (a) 2020 M 5.0, (b) 2019 M 4.9, (c) 2017 M 4.9, and (d) 2016 M 5.0 earthquakes. The green box corresponds to the Valley of Mexico, shown in the inset. Symbol size is proportional to the municipality population (CEDRUS, 2019) where the station is located.
The Servicio Sismológico Nacional (SSN, National Seismological Service of Mexico) operates a national network that consists of 63 broadband stations (Pérez-Campos et al., 2018). There is at least 1 station in 30 out of the 32 states; 12 are located in a state capital. The stations are mostly concentrated in central and southern Mexico (Fig. 1). Of the 63 stations, 29 are situated in municipalities with fewer than 50 000 inhabitants (Fig. 2). The noise level at all stations is mostly within the noise-level model by Peterson (1993) (Pérez-Campos et al., 2018). The exception is a station located within Mexico City, where there is a high noise level at frequencies above 1 Hz (Figs. 1 and 2). The SSN also operates a regional network in the Valley of Mexico, where Mexico City is located. This network consists of 31 broadband stations (Quintanar et al., 2018); 24 are in Mexico City (Fig. 1). The seismic noise level at these stations is high at frequencies above 1 Hz (Quintanar et al., 2018).
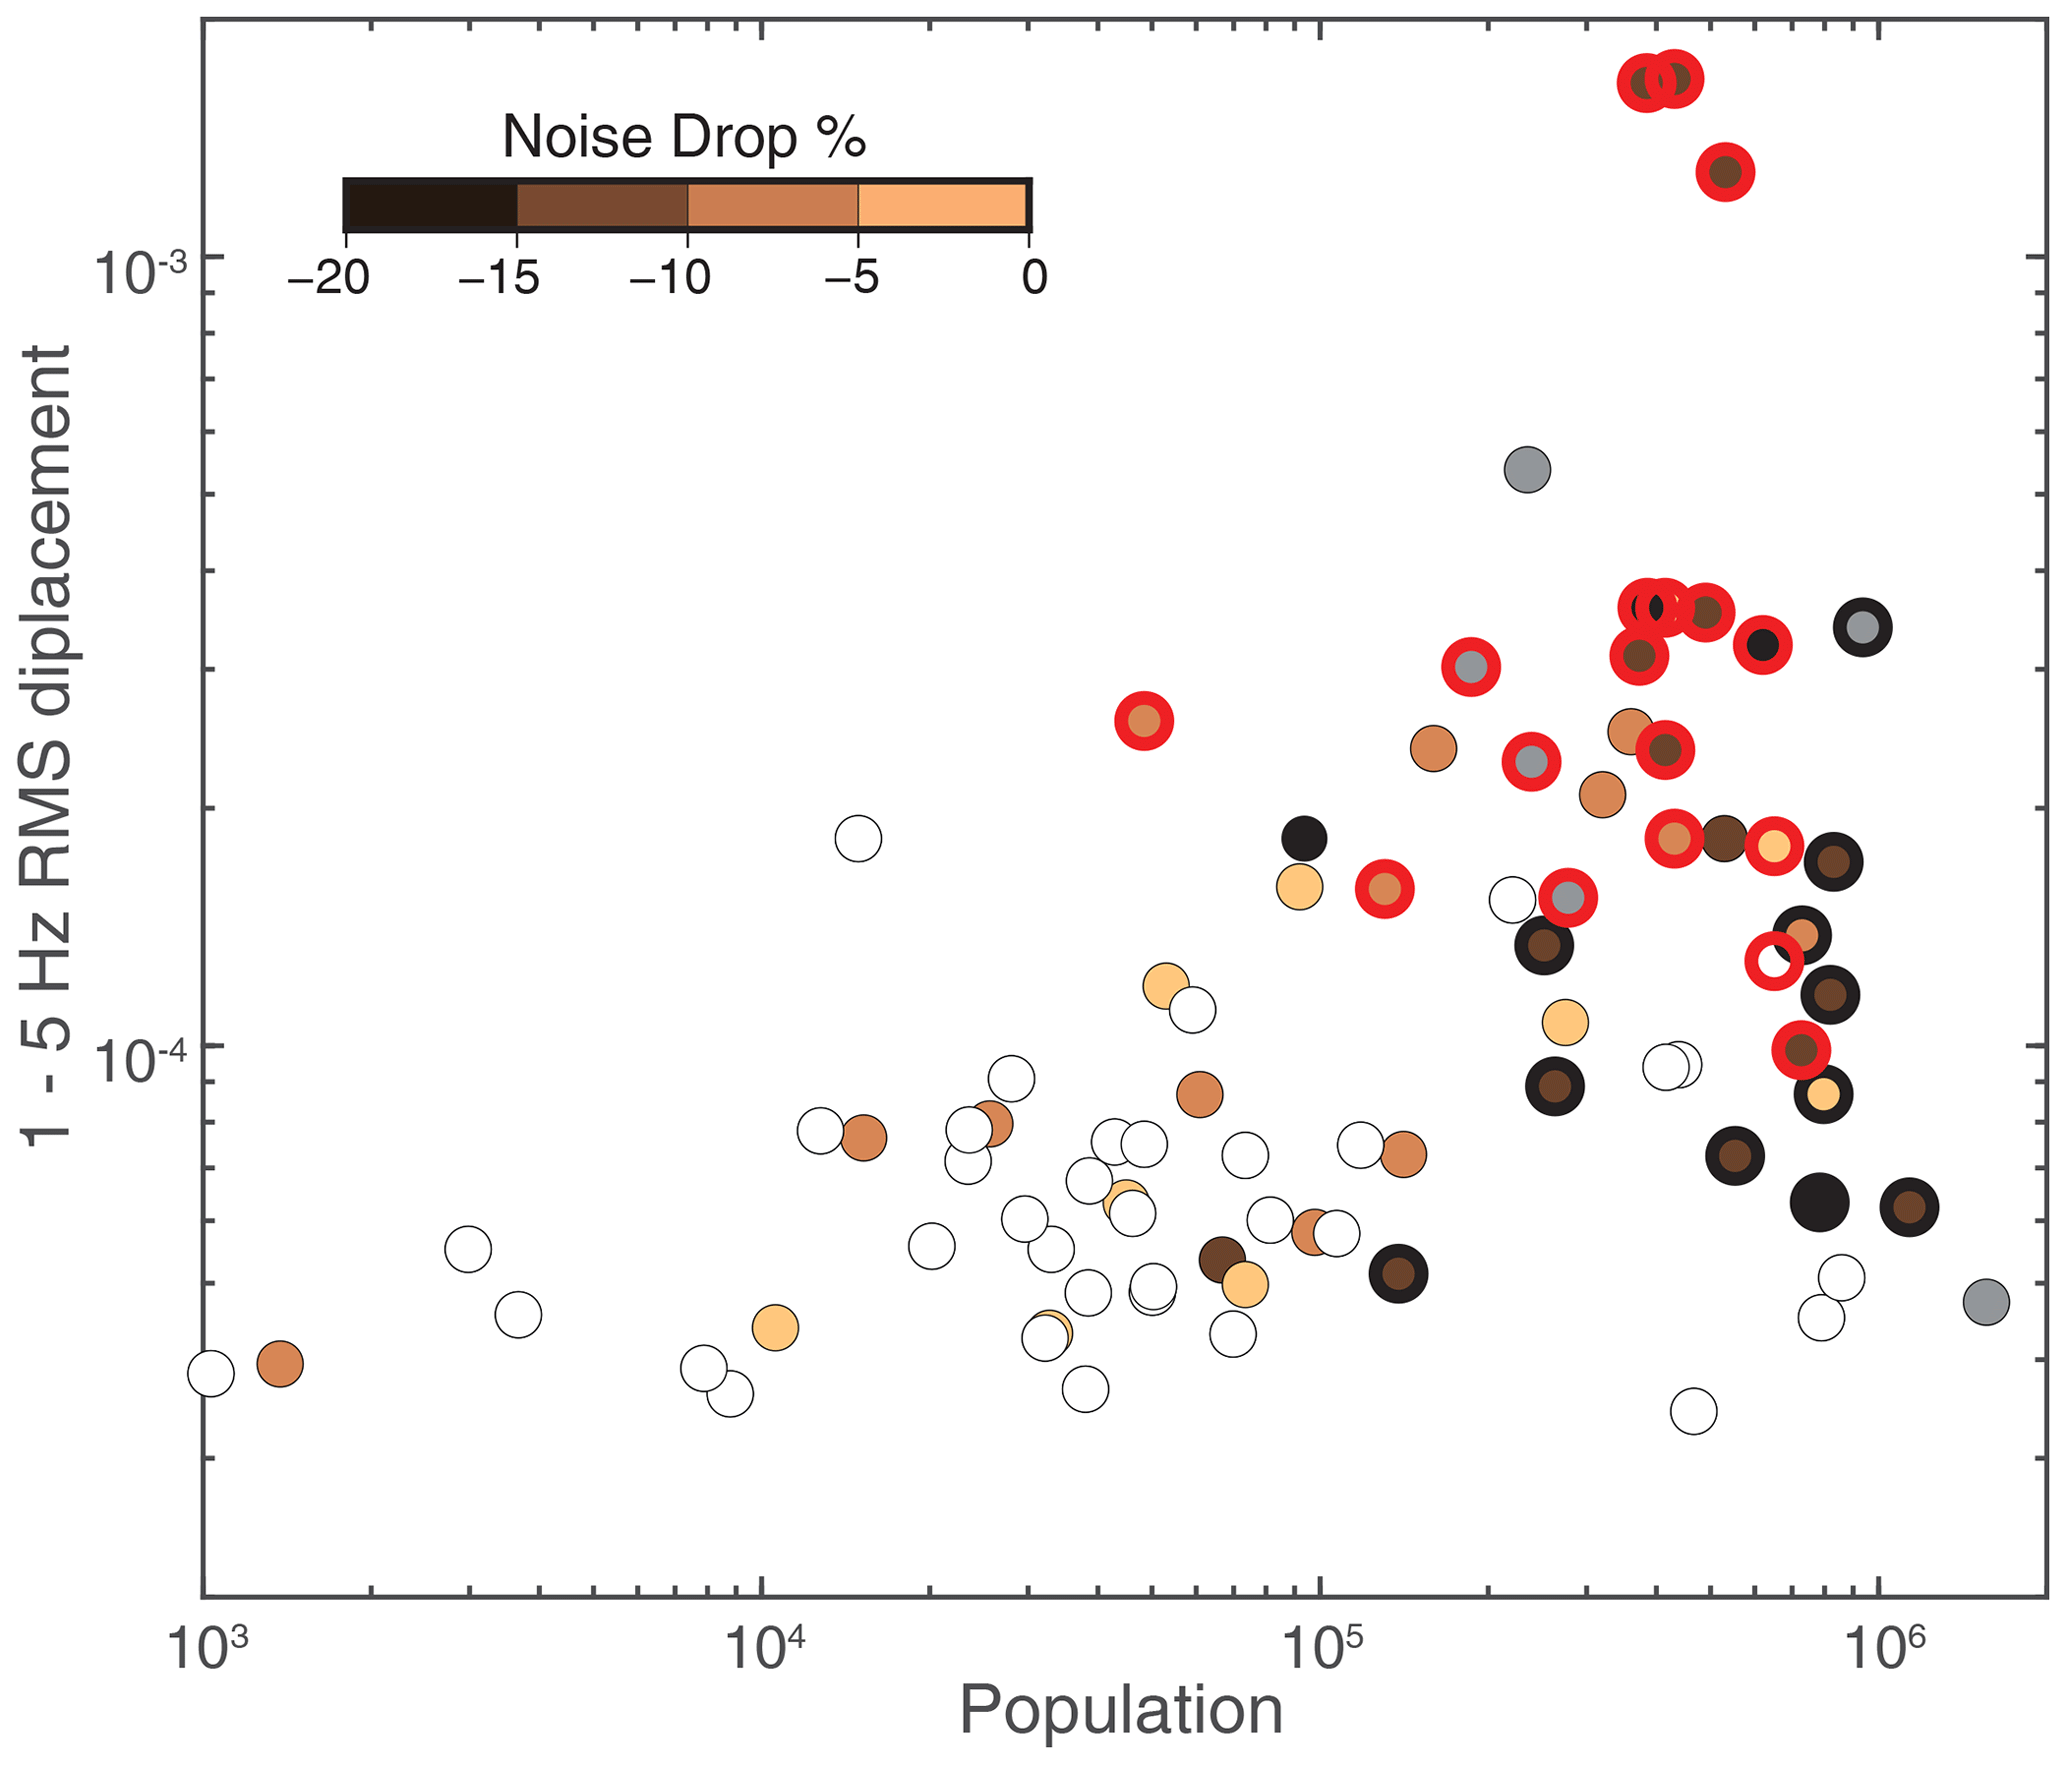
Figure 2Noise rms level and drop with respect to municipality population. The outlined symbols denote stations located in capital cities; the ones in red are in Mexico City. The white circles correspond to stations where no weekly cycle was observed and the grey ones to stations where it was not possible to identify a drop in the noise level.
The effect of lockdown measures on seismic noise recorded by seismic stations in Mexico was immediate. A decrease in levels began to be seen as of 14 March, but on 30 March, the reduction became more significant. This decrease coincided with the urgent call from the Undersecretary of Health to stay home on 29 March. The minimum seismic noise level was reached between 4 and 10 May. After that week, the seismic noise increased progressively, with different behaviours at each station. In this work, we analyse the variations in the seismic noise level as a response to the confinement measures first dictated by the federal government and later by the state governments. As a result of the low levels of seismic noise at some stations, people were also able to perceive smaller earthquakes than usual, and SSN analysts have been able to analyse a seismic sequence close to the station located in the city of Zacatecas.
2.1 Data
We analyse the data received in real time for 60 stations of the national seismic network and 24 of the Valley of Mexico seismic network (Fig. 1). We removed the instrument response for all of them. The national network stations have a 120 s broadband seismometer and an accelerometer, and 42 of the stations also have a GNSS receiver. In the case of the Valley of Mexico seismic network, we use 24 stations, 18 of them located in Mexico City (Fig. 1). They are equipped with a 30 s seismometer, and eight of them also have an accelerometer. We analyse the data for 2019 and 2020 up to 14 November to analyse the variations in the seismic noise as a response to the confinement measurements. Unfortunately, during the lockdown, some seismic stations malfunctioned, and it was not possible to service them (Pérez-Campos et al., 2021), resulting in a loss of real-time data.
2.2 Spectral and amplitude analysis
For each day, we obtain the power spectral density of 60 s windows. Then, we obtain the median of their distribution (McNamara and Buland, 2004). We plotted this daily median for 2019 and 2020. We observed a weekly variation at frequencies higher than 1 Hz at 49 stations, indicating human activity as a possible noise source (e.g. Groos and Ritter, 2009; Boese et al., 2015). These stations are mainly located in municipalities with more than 50 000 inhabitants (Fig. 2). For the rest of the stations, this cycle was not evident. The only station in a municipality with fewer than 10 000 inhabitants and a low root mean square (rms) displacement that shows an evident weekly cycle is within a university campus.
We obtain the rms displacement at four frequency bands (1–5, 5–10, 10–20, and >20 Hz) to select which one better mapped the variation of human activity and the variations associated with the confinement. At most of the stations, the band between 1 and 5 Hz showed a clearer weekly cycle and more evident noise reduction. This band is mostly related to pedestrians (Alyamkin and Eremenko, 2011) and low-speed urban road traffic (Green et al., 2017). Moving vehicles on the freeway can be detected at distances between 5 and 8 km away, but their frequency range is higher at 10–20 Hz (Long, 1971). Most of the national network stations are located far away from freeways. Within Mexico City, the speed limit is 80 km h−1 on the fastest avenues, which is rarely reached due to the constant traffic. Therefore, we base our analysis on this frequency band between 1 and 5 Hz.
Figure 3 shows the process for station PZIG, located on the main university campus in Mexico City at the School of Veterinary, 500 m away from the monitoring centre of the SSN. The station is located only 500 m away from the campus limits and about 1 km from a very busy subway station. At this station, the noise due to human activity is evident. Daily influx through the campus is estimated to be more than 300 000 people including students, teachers, researchers, workers, and the general public. The undergraduate population at UNAM is about 116 000 students (UNAM, 2020). Therefore, it is expected that despite the instruments being installed 20 m below the ground, the noise level at frequencies above 1 Hz is high during the day and on weekdays. Lower levels are observed weekly on Sundays when the university campus is fully closed. Saturdays show a medium level since the campus is open for a half-day of classes. The holiday periods are evident due to the low noise levels. One can also notice the periods of student vacations since the rms displacement is not as high as for a weekday.
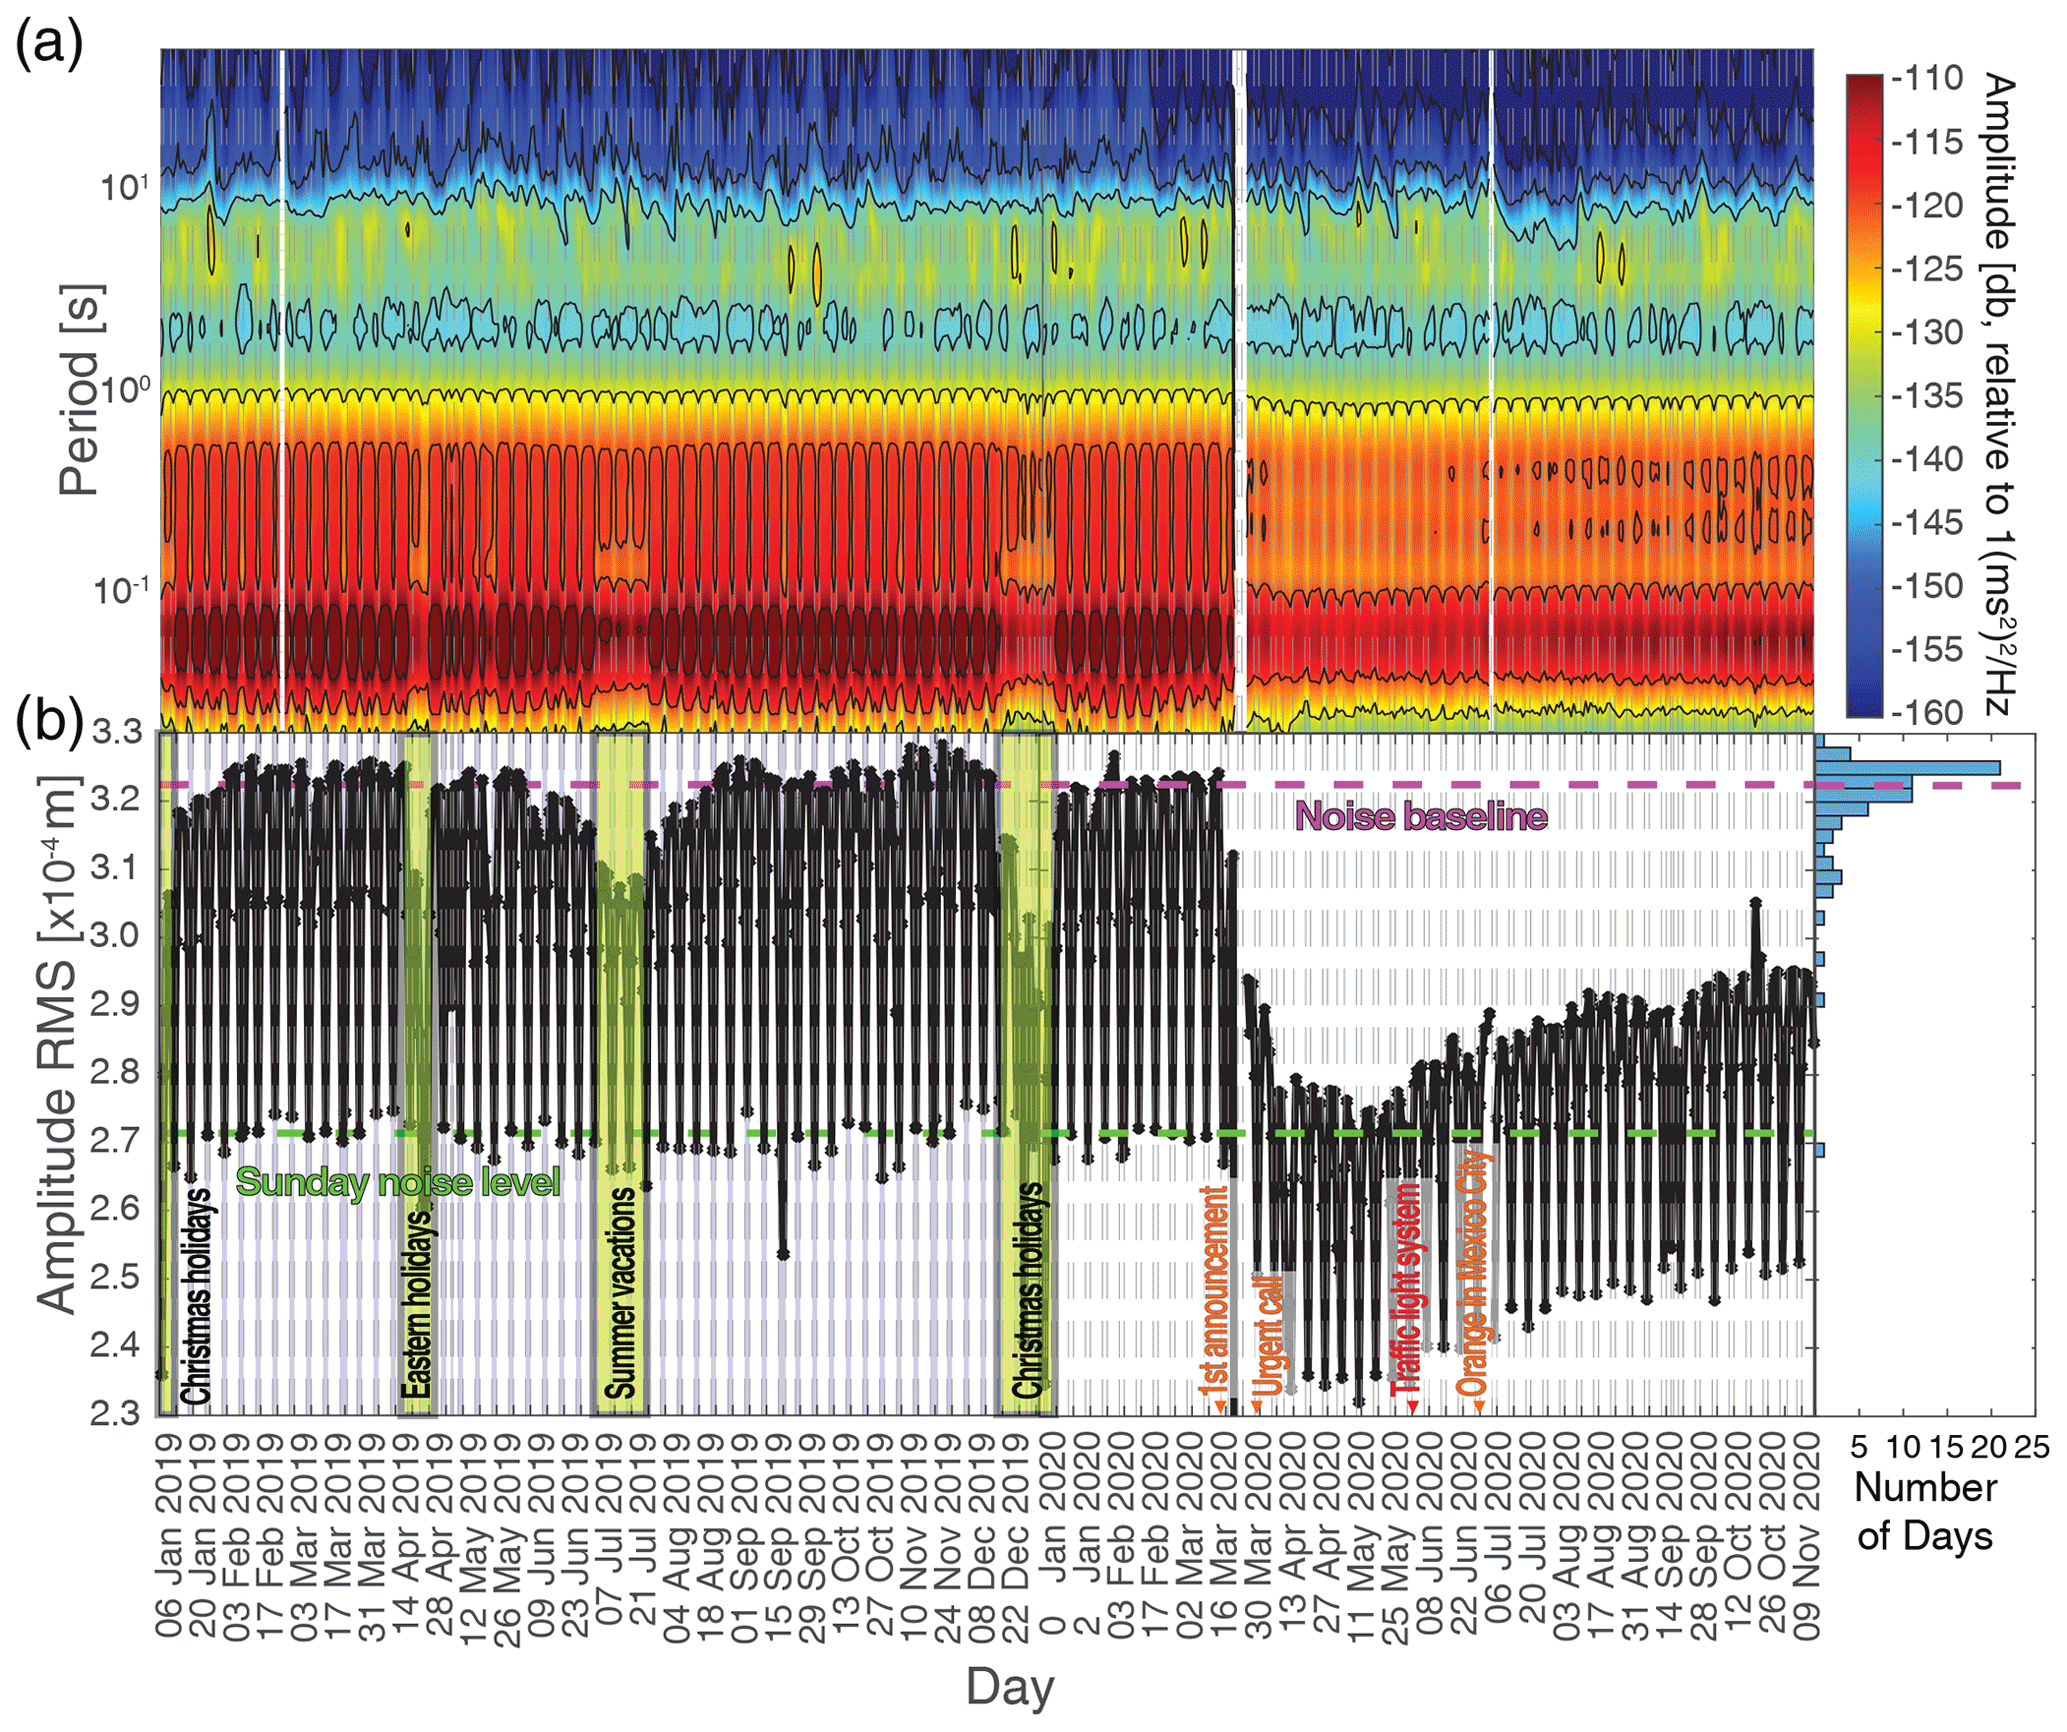
Figure 3(a) Daily median power spectral density for station PZIG. (b) Daily rms noise level for frequencies between 1 and 5 Hz.
As the base noise level, we set the rms displacement median at frequencies 1–5 Hz for all weekdays during 2019 (Fig. 3), including vacations. In general, the larger the municipality population where the station is installed, the larger the noise level (Fig. 2). We set this level as 100 % and compare the rms displacement for each day of 2020 until 15 November to obtain the daily percentage of the noise drop at each station.
3.1 Seismic noise in Mexican cities
Figure 1 shows the noise level for each station of the national and Valley of Mexico seismic networks. In general, the larger the population, the higher the noise level at frequencies between 1 and 5 Hz. Those stations located in a municipality with a large population but with low seismic noise are installed in remote places within the cities. The highest seismic noise levels are observed in Mexico City, which is the capital and the most populated city in the country. Unfortunately, only one-third of the capital cities have a national network station.
By analysing the daily rms displacement for frequencies between 1 and 5 Hz, we selected only 49 stations where the weekly cyclic behaviour is evident and chosen as a proxy for human activity. We then divided this set into two groups: (1) clear seismic noise reduction with the beginning of the national lockdown and (2) no evidence of seismic noise reduction.
For the first set (Fig. 4), we can observe that despite the official beginning of the lockdown being on 23 March, the reduction in seismic noise started on 17 March, since many educational institutions and companies started their transition to home office as a response to the announcement by the federal government on 13 March. A steady decrease in the noise level continues for 7 weeks, reaching its minimum in the week of 4 May. The reduction in noise level was not as strong as in other countries (e.g. Cannata et al., 2021); the maximum reduction was observed at station HSIG, located in Hermosillo, the capital of Sonora, a state in the northwest of Mexico. The minimum noise level coincides with the dates announced by the Undersecretary of Health as the period when the maximum of the pandemic was going to be reached in Mexico. After that week, the seismic noise level started increasing. The rate of increase varies significantly in different cities. In some, such as Hermosillo (station HSIG) and La Paz (station LPIG), the capital of Baja California Sur, the noise level quickly went back to the baseline level by 1 June, despite the traffic light for these states remaining red. In some countries, seismic noise levels have been strongly correlated with the lockdown phases (e.g. Díaz et al., 2021; Ojeda and Ruiz, 2021); however, in Mexico the lockdown is not imposed, and a weak correlation is observed between the noise variation and the lockdown phases. This suggests that in some cities people did not fully follow the recommendations for lockdown.
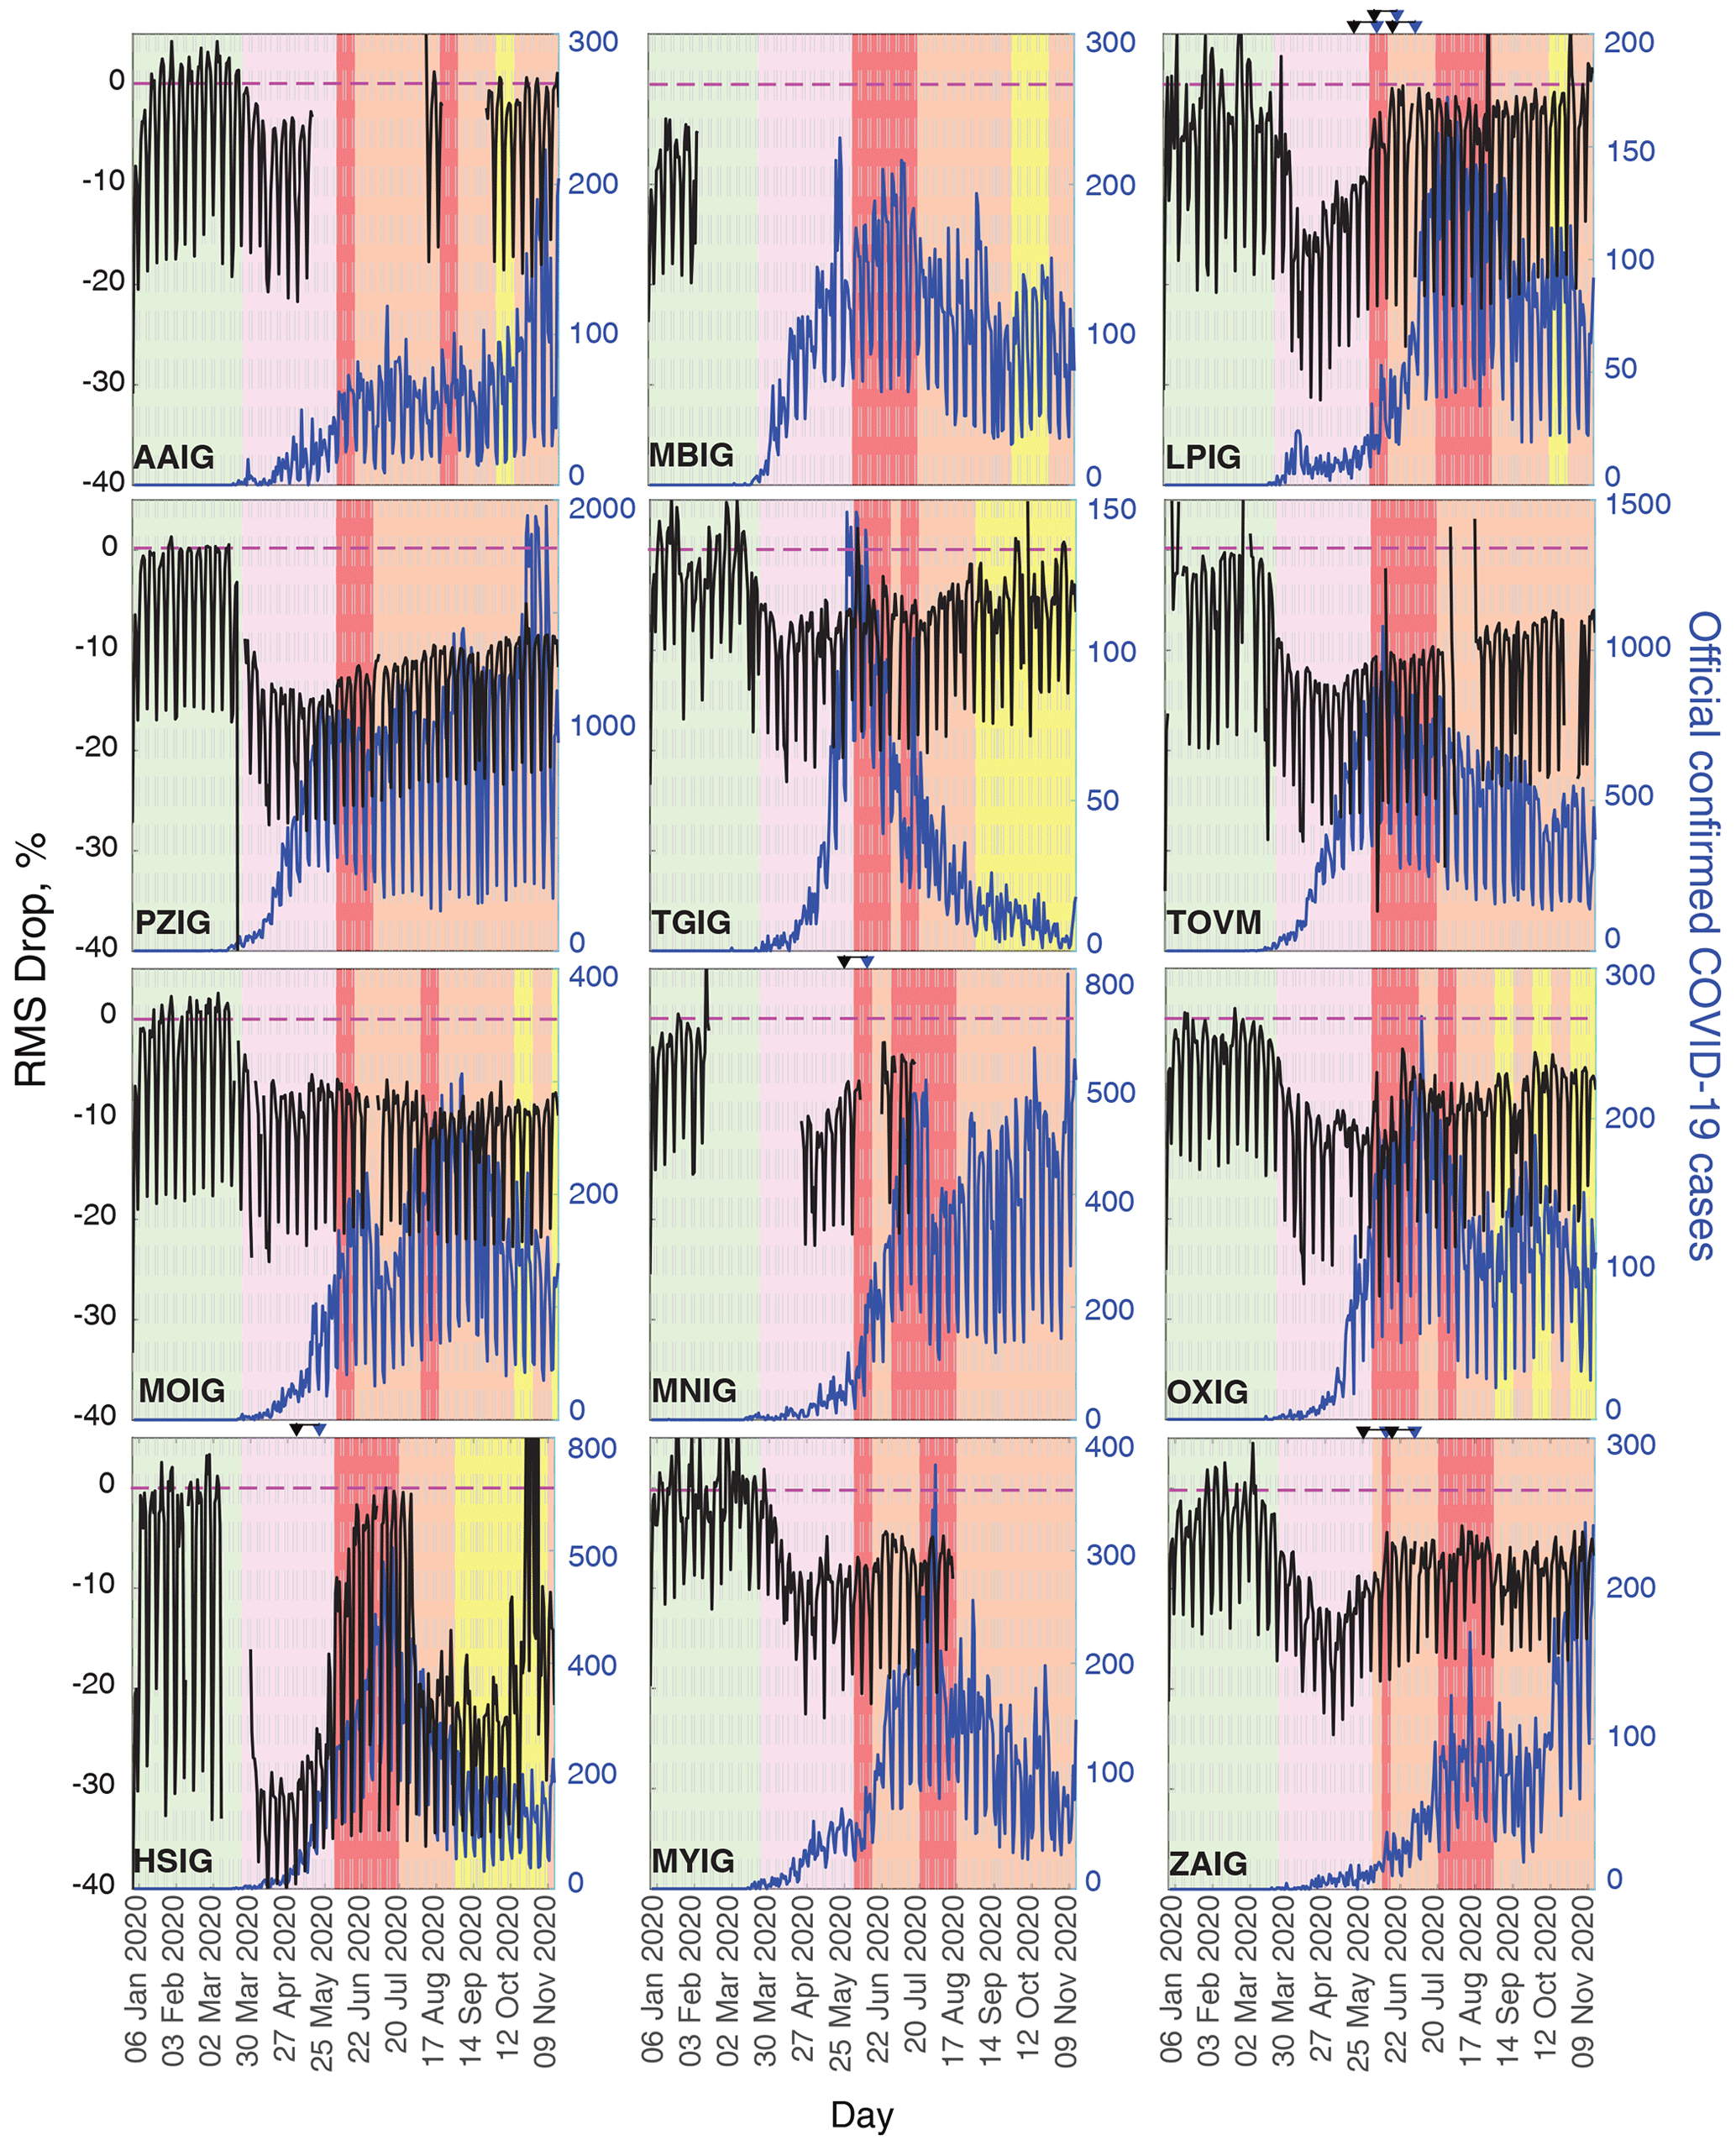
Figure 4The rms noise for frequencies 1 to 5 Hz (left axis, black lines) at stations located in capital cities. The right axis (blue line) indicates the number of officially confirmed COVID-19 cases. Triangles on top of selected stations indicate when the rms noise starts an increase tendency (black triangle) and when the COVID-19 cases start to increase quickly (blue triangle). The lag between these triangles is 2 weeks.
In contrast to the analysis by Ojeda and Ruiz (2021) for Santiago, Chile, only a few studied Mexican cities show a strong correlation of seismic noise variations and epidemiological factors (Fig. 4). For example, Sonora had only 2561 confirmed COVID-19 cases by 1 June, but the daily confirmed cases had a rapid increase until the first week of August when the rate decreased (Fig. 4). The decrease in COVID-19 confirmed cases correlates with a drop in the seismic noise level in the first week of August. In the case of La Paz, the seismic noise-level increase also coincides with a quick rise in COVID-19 confirmed cases. Later, the seismic noise level had a small decrease that has not dropped down again (Fig. 4).
Stations that belong to the second set are installed in municipalities with fewer than 100 000 inhabitants or located at remote places within cities. In general, the base rms displacement is below 1.1×10⁻⁴ m s−1 (Fig. 1).
3.2 Seismicity detection and perception
As a result of the seismic noise reduction, we observe two notable effects: (1) perception by people of vibrations due to earthquakes and (2) easier identification of earthquakes. At the SSN, automatic earthquake detection is done using SeisComP3 (Pérez-Campos et al., 2021); however, it is configured for the detection of earthquakes with a magnitude, M, larger than 4.0. Analysts routinely identify smaller earthquakes. Reports of perceptions are received through two channels: social networks (mainly Twitter) and the survey ?`Sintió un sismo? (Did you feel an earthquake? – Montalvo-Arrieta et al., 2017, 2019).
On 6 April 2020, an M 5.0 earthquake hit the coast of Guerrero (Fig. 1). Earthquakes like this one are frequent. In the last 4 years, three other earthquakes have happened nearby with similar magnitudes (Fig. 1; Table 1): 4 June 2019, M 4.9; 13 February 2017, M 5.0; 2 December 2016, M 4.9. For the 2020 quake, 114 surveys were received compared 29, 84, and 49 received for the other three earthquakes, respectively, despite having similar magnitudes. During the four events, obtained macroseismic intensities vary from II to V on the Mercalli modified intensity (MMI) scale; only for the 13 February 2017 earthquake were two values of VI on the MMI reported. The distribution of the macroseismic intensity values shows that during the 6 April 2020 earthquake, user reports were considerably more numerous in central Mexico, located approximately 250 km from the epicentre, compared to other earthquakes that occurred prior to the COVID-19 lockdown. The ground shaking experienced by citizens was mainly weak (values of II–III on the MMI); however, the number of felt reports of intensity values of II and III were approximately 2.5 and 2.9 times greater, respectively, during the lockdown than for previous events. We conclude that the increase in the surveys received for ?`Sintió un Sismo? is the result of the seismic noise reduction mainly in urban centres. These events were recorded at stations including Mexico City. The 2020 event, as mentioned by Lecocq et al. (2020), was visible without any signal processing at local seismic stations in Querétaro, north of Mexico City, since the noise at these stations was lower than usual.
Table 1Earthquakes at the Guerrero coast from 2016–2020 at similar distances from Mexico City and similar magnitudes.

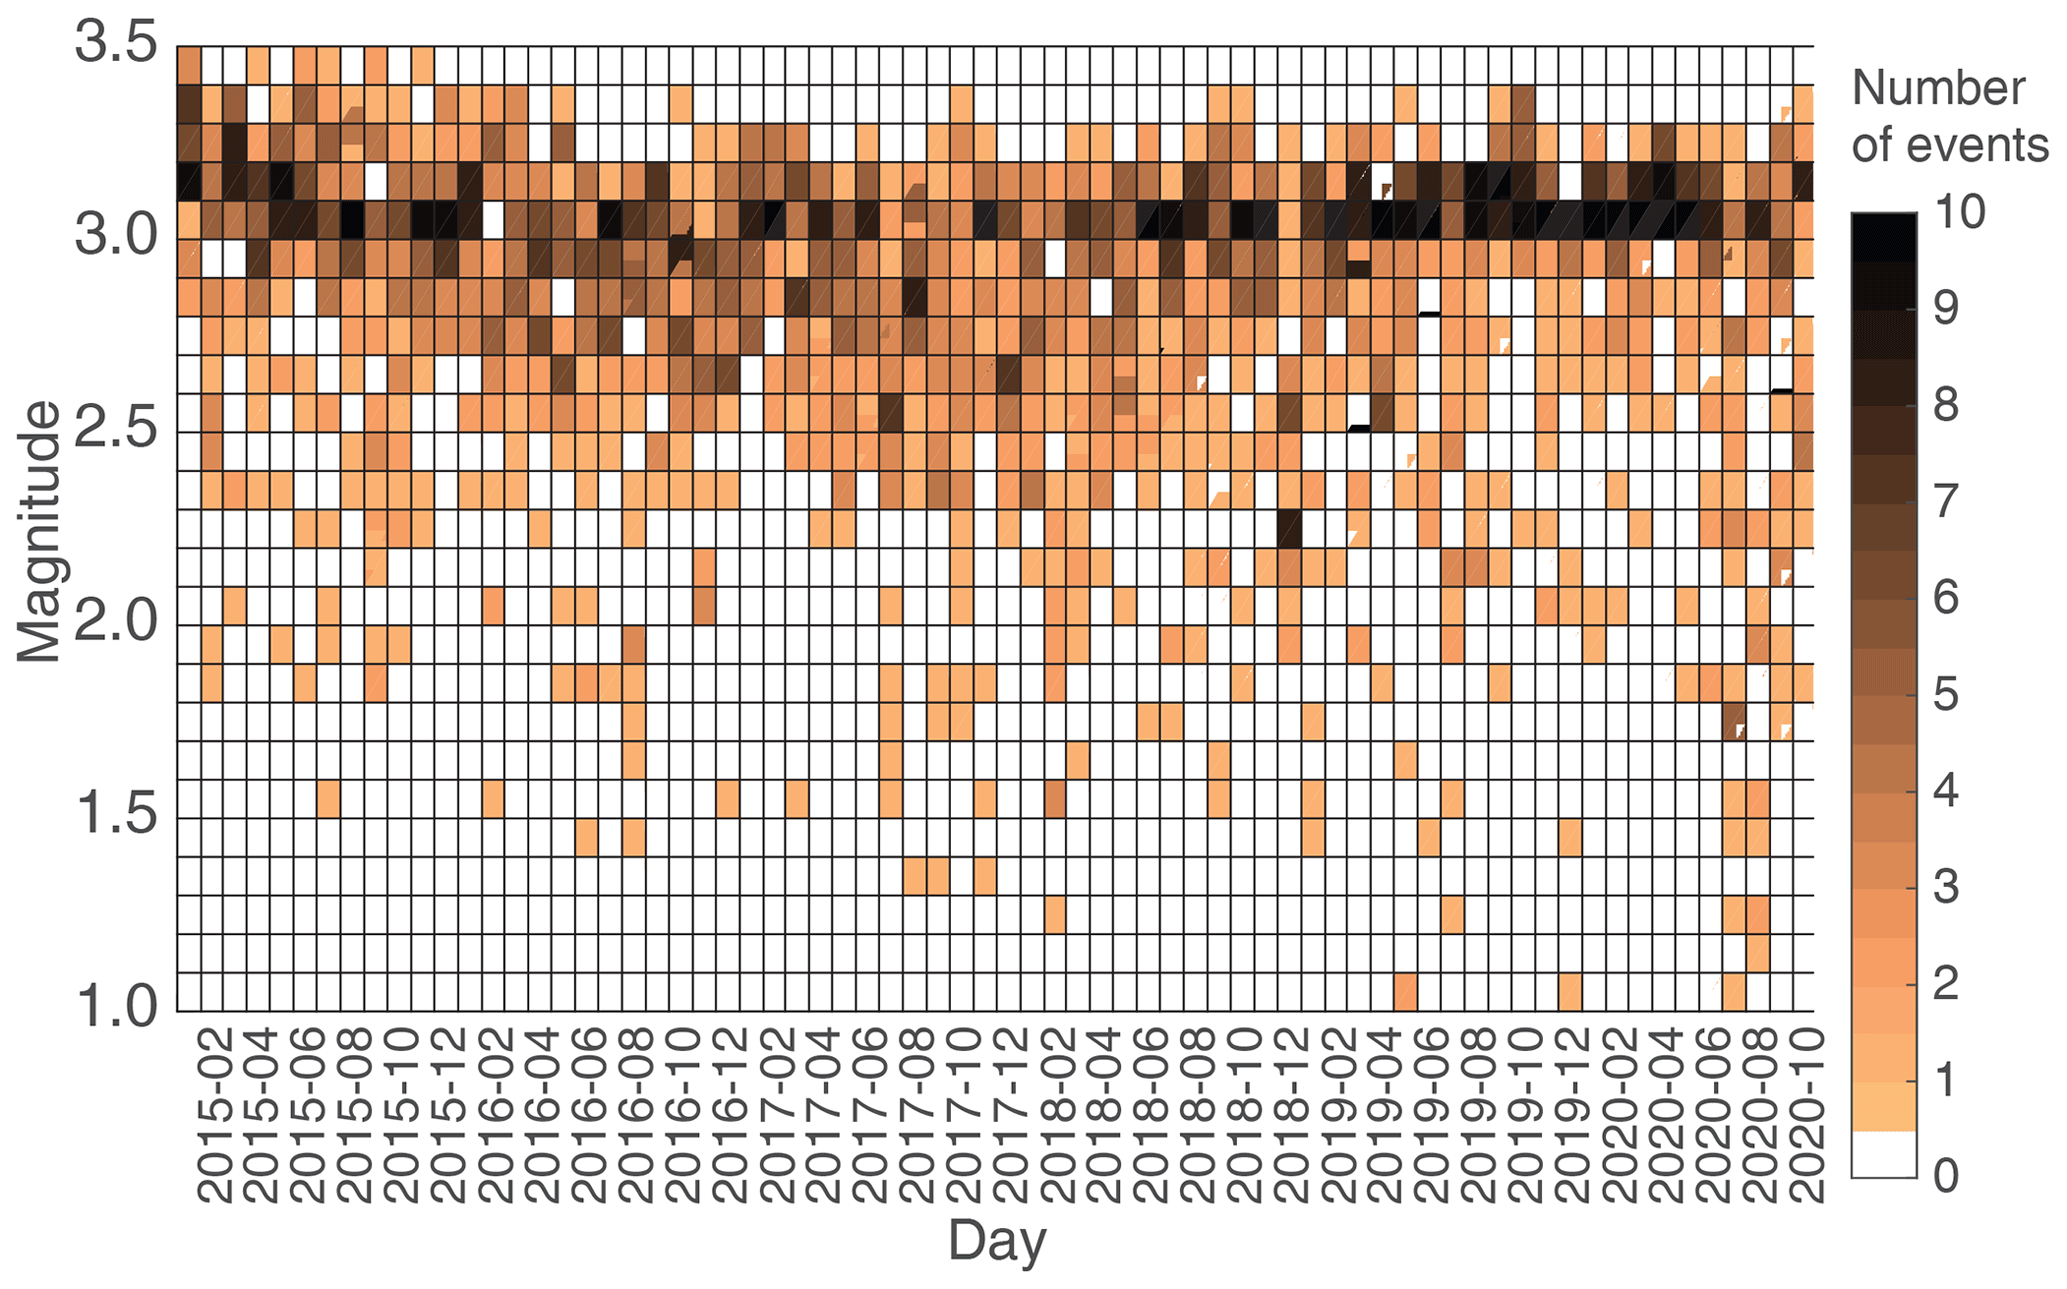
We analyse the SSN catalogue (SSN, 2020a) for the last 5 years to identify variations in the minimum reported magnitude (Fig. 5). We chose this period since the network grew considerably from 2006 to 2015 (Pérez-Campos et al., 2018); the last station of the national network was installed in 2015. Also, the Valley of Mexico seismic network increased the number of stations between 2010 and 2015 (Quintanar et al., 2018). Pérez-Campos et al. (2019) present a spatial distribution of the minimum magnitude reported in the SSN catalogue able to be detected by the 2019 network configuration. From this analysis, it is evident that the detection level, and therefore the completeness magnitude, is heterogenous at the national level. The minimum reported magnitude for 2015–2020 is 1.0, which was reported in Mexico City. Three seismic swarms can be identified: (1) 2019 in Mexico City, (2) 2020 in Uruapan, and (3) 2020 in Zacatecas. The first one has been studied by Singh et al. (2020), the second one was reported by the SSN (SSN, 2020b), and the third one occurred during the lockdown with a low level of seismic noise at station ZAIG, located within the city of Zacatecas. People from Zacatecas reported feeling some of the events, which led the SSN analysts to study the data from this station carefully. Similar to van Wijk et al. (2021), due to the reduced noise levels, we were able to identify a template. With it, we have analysed the data for earlier months, and 120 events have been identified using a cross-correlation algorithm (Yoon et al., 2015). A total of 87 of these events can be visually identified but were not previously reported since in the daily analysis they were discarded due the large noise level. Figure 6 shows the signals for two days: the first one on 27 January (Sunday, 19:11:59 local time) with M 1.4 and the second one on 21 June (Sunday, 18:08:59 local time) with M 1.2. The signal is clearly less contaminated with high frequencies for the record in June 2020.
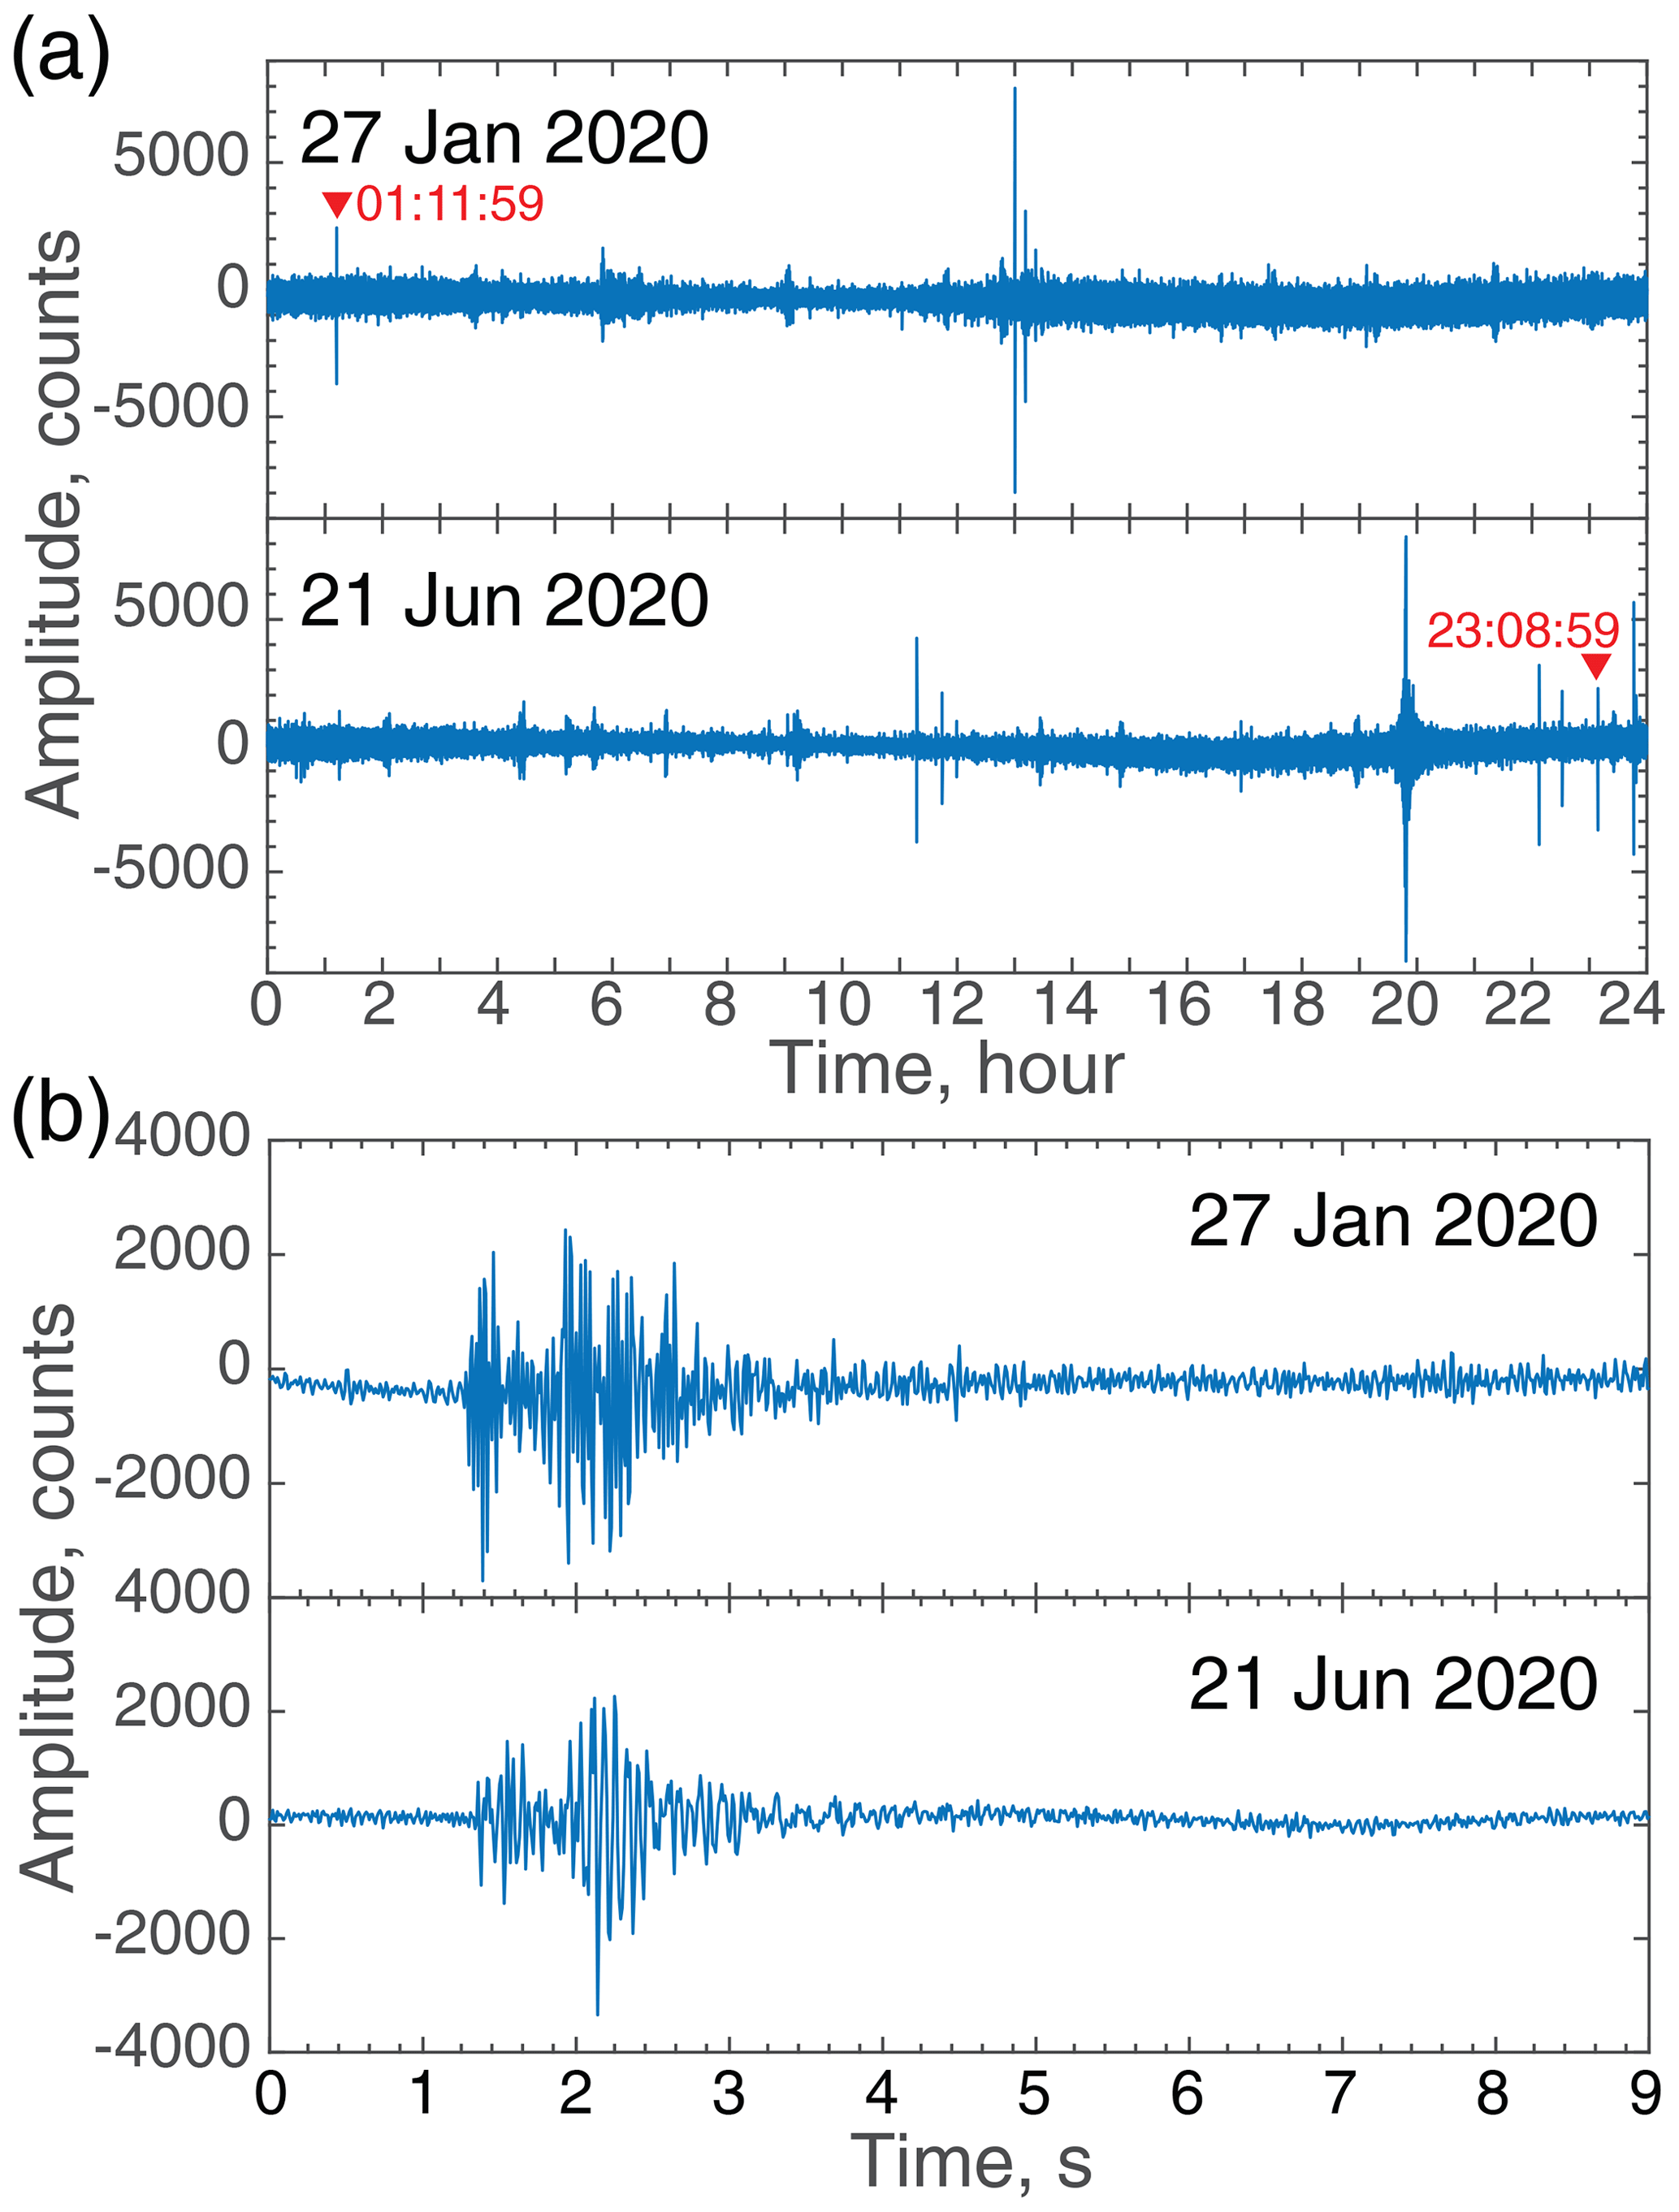
Figure 6Record comparison for a day with the usual (top panels, 27 January 2020) and reduced (lower panel, 21 June 2020) seismic noise at station ZAIG. (a) 24 h record. (b) Event window. Both events are M 1.2.
Seismic noise has been correlated with mobility data published by Google, Apple, and social networks such as Twitter and Facebook. In some countries, this correlation seems high (Lecocq et al., 2020; Cannata et al., 2021). Tracking mobility this way might represent a challenge in countries like Mexico, where there is heterogeneous use of the internet and smartphones nationally and within cities. In general, usage can reach up to 71.2 % and 77.7 % in urban areas, respectively, whereas for rural areas, it can be as low as 39.2 % and 53.8 %, respectively (Martínez-Domínguez and Mora-Rivera, 2019). Mexico is considered 76.83 % urban. Mexico City is 99.5 % urban, while the state of Oaxaca is 47.3 % urban (INEGI, 2014). Also, the distribution of seismic stations, as seen in Fig. 2, is mostly at urban centres (>2500 inhabitants). Unfortunately, in most cities, there is only one seismic station rather than a network. Therefore, seismic noise is only representative of a ∼ 5 km radius from the seismic station. Mexico City is an exception since the station distance there is ∼ 5 km. Therefore, the seismic noise of the network can be representative of the city activity. This is also the case for the city of Querétaro, where a low-cost Raspberry Shake network has been recently installed. The effect of the lockdown on seismic noise in this city has been analysed by De Plaen et al. (2021). They also analysed the correlation of the median seismic rms with community mobility reported by Google. They analysed six categories, obtaining the minimum correlation for residential areas. Unlike some European and American cities, Mexican cities are not spatially distributed in a business district or residential neighbourhood. Most of the cities are a mix of economic activities and residences. Furthermore, non-formal commerce represents 56.1 % of the Mexican economy (Secretaría del Trabajo and Previsión Social, 2020). This activity does not take place in establishments but rather in the city streets. This is the scenario for Mexico City. As suggested by Díaz et al. (2021) for Barcelona (Spain), Cannata et al. (2021) for Sicily (Italy), and Ojeda and Ruiz (2021) for Santiago (Chile), seismic noise can be used to monitor urban mobility. However, the seismic noise levels for Mexican cities seem to be weakly modulated by the state traffic-light system.
More than 50 % of the state population is concentrated in some state capitals. Such is the case for Aguascalientes (station AAIG) and Toluca (TOVM), whereas others barely reach 30 %, such as Mexicali (MBIG), Tuxtla Gutiérrez (TGIG), Morelia (MOIG), Oaxaca (OXIG), and Zacatecas (ZAIG). The daily confirmed COVID-19 cases presented in Fig. 4 correspond to the state total; however, in most cases, despite the low percentage of the state population, it is in the capital city where most cases have been confirmed. Comparing the daily COVID-19 confirmed cases with the daily rms noise at frequencies from 1 to 5 Hz (Fig. 4), a rapid increase in seismic noise (i.e. a quick return to city activities) has coincided, with a 2-week lag, with a rapid increase in daily confirmed cases. This is the case, for example, in La Paz (LPIG), Monterrey (MNIG), Hermosillo (HSIG), and Zacatecas (ZAIG). On the other hand, state strategies for a progressive return to economic activities, such as in Mexico City (PZIG), have resulted in a slow increase in the rate of daily confirmed cases.
In general, we can confirm that Mexican citizens responded to the government call for lockdown without any coercive measures. The lockdown resulted in effective control at the beginning of the pandemic in Mexico. However, in a country where poverty prevails and 56.1 % of the economy is not formal, a very restrictive lockdown might have created serious problems. Therefore, state-level strategies for re-opening economic activities have been modulating the contagion rate, and the seismic noise allowed us to observe the response of the cities where the seismic stations are located. The evolution of the confirmed cases might eventually not correspond to the seismic noise behaviour since other measures can be implemented, such as the generalized use of a mask or, ultimately, vaccination.
Data preparation was done using the Seismic Analysis Code (SAC; Goldstein et al., 2003). Data processing and analysis have been done using codes written in MATLAB by the first author. Codes are available upon request (xyoli@igeofisica.unam.mx). Figure 1 was made using the Generic Mapping Tools (GMT) software version 6.0.0 (Wessel et al., 2013). Figures 2 through 6 were made in MATLAB through an academic licence of the Universidad Nacional Autónoma de México.
Data for the national network are available and can be obtained upon request, following the instructions at http://www.ssn.unam.mx/doi/networks/mx/ (https://doi.org/10.21766/SSNMX/SN/MX, SSN, 2020b). Data for the Valley of Mexico seismic network can be obtained upon email request to Luis Quintanar (luisq@igeofisica.unam.mx). Catalogue data can be downloaded at http://www2.ssn.unam.mx:8080/catalogo/ (https://doi.org/10.21766/SSNMX/EC/MX, SSN, 2020a).
Data regarding COVID-19 in Mexico can be downloaded at https://datos.covid-19.conacyt.mx/#DOView (Secretaría de Salud, 2020b).
XPC, VHMR, and RSMDP designed the study. XPC analysed the seismic data and wrote the paper. VHE and DGA analysed the Zacatecas seismic sequence and the minimum reported magnitude data. BZF analysed the population and COVID-19 data and generated some maps. JCMA analysed the ?`Sintió un sismo? survey data. LQ analysed the Valley of Mexico data. All authors revised the article.
The authors declare that they have no conflict of interest.
This article is part of the special issue “Social seismology – the effect of COVID-19 lockdown measures on seismology”. It is not associated with a conference.
The data used in this work were kindly provided by the Red Sísmica del Valle de México (RSVM; Quintanar et al., 2018) and Red de banda ancha, belonging to the Servicio Sismológico Nacional (SSN, Mexican National Seismological Service). Station maintenance, data acquisition, and distribution are thanks to its personnel. Financial support for RSVM is provided by the Consejo Nacional de Ciencia y Tecnología (CONACYT, National Council for Science and Technology), Universidad Nacional Autónoma de México (UNAM, National Autonomous University of Mexico), and Gobierno de la Ciudad de México (Government of Ciudad de México). Funds for maintenance and operation of SSN come from UNAM. We thank Kasper van Wijk and Thomas Lecocq for comments that helped improve this paper.
This research has been supported by the Instituto de Geofísica, Universidad Nacional Autónoma de México (grant no. S113), and the government authorities of Mexico City through their Secretaría de Educación, Ciencia, Tecnología e Innovación for acquisition of seismological equipment and its deployment through funding agreement SECTEI/194/2019.
This paper was edited by Thomas Lecocq and reviewed by Kasper van Wijk and Thomas Lecocq.
Alyamkin, S. A. and Eremenko, S. I.: Pedestrian Detection Algorithms Based on an Analysis of the Autocorrelation Function of a Seismic Signal, Optoelectr. Instrum. Data Process, 47, 124–129, https://doi.org/10.3103/S8756699011020038, 2011.
Boese, C. M., Wotherspoon, L., Alvarez, M., and Malin, P.: Analysis of anthropogenic and natural noise from multilevel borehole seismometers in an urban environment, Auckland, New Zealand, Bull. Seismol. Soc. Am., 105, 285–299, 2015.
Cannata, A., Cannavò, F., Di Grazia, G., Aliotta, M., Cassisi, C., De Plaen, R. S. M., Gresta, S., Lecocq, T., Montalto, P., and Sciotto, M.: Seismic evidence of the COVID-19 lockdown measures: a case study from eastern Sicily (Italy), Solid Earth, 12, 299–317, https://doi.org/10.5194/se-12-299-2021, 2021.
CEDRUS (Centro de Estudios de Desarrollo Regional y Urbano), con base en INEGI: Censo General de Población y Vivienda 2010, Encuesta Intercensal 2015 y Marco Geoestadístico Nacional 2017, 2019.
De Plaen, R. S. M., Márquez-Ramírez, V. H., Pérez-Campos, X., Zuñiga, F. R., Rodríguez-Pérez, Q., Gómez González, J. M., and Capra, L.: Seismic signature of the COVID-19 lockdown at the city scale: a case study with low-cost seismometers in the city of Querétaro, Mexico, Solid Earth, 12, 713–724, https://doi.org/10.5194/se-12-713-2021, 2021.
Diaz, J., Ruiz, M., and Jara, J.-A.: Seismic monitoring of urban activity in Barcelona during the COVID-19 lockdown, Solid Earth, 12, 725–739, https://doi.org/10.5194/se-12-725-2021, 2021.
Goldstein, P., Dodge, D., Firpo, M., and Minner, L.: SAC2000: Signal processing and analysis tools for seismologists and engineers, Invited contribution to “The IASPEI International Handbook of Earthquake and Engineering Seismology”, edited by: Lee, W. H. K., Kanamori, H., Jennings, P. C., and Kisslinger, C., Academic Press, London, 2003.
Green, D. N., Bastow, I. D., Dashwood, B., and Nippress, S. E.: Characterizing Broadband Seismic Noise in Central London, Seismol. Res. Lett., 88, 113–124, https://doi.org/10.1785/0220160128, 2017.
Groos, J. C. and Ritter, J. R. R.: Time domain classification and quantification of seismic noise in an urban environment, Geophys. J. Int., 179, 1213–1231, 2009.
INEGI: Encuesta Nacional de la Dinámica Demográfica, available at: https://www.inegi.org.mx/programas/enadid/2014/ (last access: 14 November 2020), 2014.
Lecocq, T., Hicks, S. P., Van Noten, K., van Wijk, K., Koelemeijer, P., De Plaen, R. S., Massin, F., Hillers, G., Anthony, R. E., Apoloner, M. T., and Arroyo-Solórzano, M.: Global quieting of high-frequency seismic noise due to COVID-19 pandemic lockdown measures, Science, 369, 1338–1343, https://doi.org/10.1126/science.abd2438, 2020.
Long, L. T.: Investigation of seismic road noise, Georgia Institute of Technology, Final report, Project No. A-1357, 1971.
McNamara, D. E. and Buland, R. P.: Ambient noise levels in the continental United States, Bull. Seismol. Soc. Am., 94, 1517–1527, 2004.
Martínez-Domínguez, M. and Mora-Rivera, J.: Internet adoption and usage patterns in rural Mexico, Technol. Soc., 60, 101226, https://doi.org/10.1016/j.techsoc.2019.101226, 2019.
Montalvo-Arrieta, J. C., Sosa-Ramírez, R. L., and Pérez-Campos, X.: Evaluation of macroseismic intensities in Mexico from recent earthquakes using ?`Sintió un sismo? (Did You Feel It?), Geofísica Int., 56, 27–36, https://doi.org/10.22201/igeof.00167169p.2017.56.1.1732, 2017.
Montalvo-Arrieta, J. C., Pérez-Campos, X., Ramirez-Guzman, L., Sosa-Ramírez, R. L., Contreras Ruiz-Esparza, M., and Leonardo-Suárez, M.: Macroseismic Intensities from the 19 September 2017 MW 7.1 Puebla–Morelos Earthquake, Seismol. Res. Lett., 90, 2142–2153, https://doi.org/10.1785/0220190145, 2019.
Ojeda, J. and Ruiz, S.: Seismic noise variability as an indicator of urban mobility during the COVID-19 pandemic in the Santiago metropolitan region, Chile, Solid Earth, 12, 1075–1085, https://doi.org/10.5194/se-12-1075-2021, 2021.
Pérez-Campos, X., Espíndola, V. H., Pérez, J., Estrada, J. A., Cárdenas Monroy, C., Bello, D., González-López, A., González Ávila, D., Contreras Ruiz Esparza, M. G., Maldonado, R., Tan, Y., Rodríguez Rasilla, I., Vela Rosas, M. A., Cruz, J. L., Cárdenas, A., Navarro Estrada, F., Hurtado, A., Mendoza Carvajal, A. J., Montoya-Quintanar, E., and Pérez-Velázquez, M. A.: The Mexican National Seismological Service: An overview, Seismol. Res. Lett., 89, 318–323, https://doi.org/10.1785/0220170186, 2018.
Pérez‐Campos, X., Espíndola, V. H., Pérez, J., Estrada, J. A., Cárdenas Monroy, C., Zanolli, B. Fabila, Bello, D., González‐López, A., González Ávila, D., Maldonado, R., Montoya‐Quintanar, E., Vite, R., Martínez, L. D., Tan, Y., Rodríguez Rasilla, I., Vela Rosas, M. Á., Cruz, J. L., Cárdenas, A., Navarro Estrada, F., Hurtado, A., and Mendoza Carvajal, A. J.: Servicio Sismológico Nacional, México, Summary of the Bulletin of the International Sesimological Centre, 53, 29–40, https://doi.org/10.31905/SZ7RYBTM, 2019.
Pérez-Campos, X., Espíndola, V. H., Pérez, J., Estrada, A., Cárdenas Monroy, C., Bello, D., González-López, A., González Ávila, D., Maldonado, R., Montoya-Quintanar, E., Ramírez Ruiz, J. E., Rodríguez Rasilla, I., Tan, Y., Vela Rosas, M. A., Sosa, M.Á., Cruz, J. L., Cárdenas, A., Navarro Estrada, F., Hurtado, A., Mendoza Carvajal, A. J., Zanolli Fabila, B., Hurtado Meléndez, H. M., Valdés-González, C. M., Ramirez-Guzman, L., and Montalvo-Arrieta, J. C.: Response of the Mexican National Seismological Service to significant earthquakes, under normal and COVID-19 pandemic circumstances, Seismol. Res. Lett., 92, 93–101, https://doi.org/10.1785/0220200301, 2021.
Peterson, J. R.: Observations and modeling of seismic background noise (No. 93-322), US Geological Survey, 1993.
Quintanar, L., Cárdenas-Ramírez, A., Bello-Segura, D. I., Espíndola, V. H., Pérez-Santana, J. A., Cárdenas-Monroy, C., Carmona‐Gallegos, A. L., and Rodríguez‐Rasilla, I.: A seismic network for the Valley of Mexico: Present status and perspectives, Seismol. Res. Lett., 89, 356–362, 2018.
Secretaría del Trabajo y Previsión Social: México, Información Laboral, available at: http://www.stps.gob.mx/gobmx/estadisticas/pdf/perfiles/perfil nacional.pdf (last access: 14 November 2020), October 2020.
Secretaría de Salud: Lineamiento para la estimación de riesgo del semáforo por regiones COVID-19, versión 5.1, 14 August 2020, available at: https://coronavirus.gob.mx/wp-content/uploads/2020/10/SemaforoCOVID_Metodo.pdf, last access: 25 November 2020a.
Secretaría de Salud: Dirección General de Epidemiología, Base de datos abiertos COVID-19, available at: https://datos.covid-19.conacyt.mx/#DOView, last access: 14 November 2020b.
Singh, S. K., Quintanar-Robles, L., Arroyo, D., Cruz-Atienza, V. M., Espíndola, V. H., Bello-Segura, D. I., and Ordaz, M.: Lessons from a small local earthquake (Mw 3.2) that produced the highest acceleration ever recorded in Mexico City, Seismol. Res. Lett., 91, 3391–3406, https://doi.org/10.1785/0220200123, 2020.
SSN (Servicio Sismológico Nacional): Instituto de Geofísica, Universidad Nacional Autónoma de México, México: Catálogo de sismos, available at: http://www2.ssn.unam.mx:8080/catalogo/ (last access: 25 November 2020) and https://doi.org/10.21766/SSNMX/EC/MX, 2020a.
SSN (Servicio Sismológico Nacional): Instituto de Geofísica, Universidad Nacional Autónoma de México, México: Secuencia sísmica del 5 de enero al 10 de marzo de 2020, Michoacán (M 4.1), available at: http://www.ssn.unam.mx (last access: 25 November 2020) and https://doi.org/10.21766/SSNMX/SN/MX, 2020b.
UNAM: Agenda Estadística, available at: https://www.planeacion.unam.mx/Agenda/2020/disco/ (last access: 25 November 2020), 2020.
van Wijk, K., Chamberlain, C. J., Lecocq, T., and Van Noten, K.: Seismic monitoring of the Auckland Volcanic Field during New Zealand's COVID-19 lockdown, Solid Earth, 12, 363–373, https://doi.org/10.5194/se-12-363-2021, 2021.
Wessel, P., Smith, W. H., Scharroo, R., Luis, J., and Wobbe, F.: Generic mapping tools: improved version released, Eos, Transactions American Geophysical Union, 94, 409–410, 2013.
Yoon, C. E., O'Reilly, O., Bergen, K. J., and Beroza, G. C.: Earthquake detection through computationally efficient similarity search, Sci. Adv., 1, e1501057, https://doi.org/10.1126/sciadv.1501057, 2015.