
Electric Shared Mobility Services during the Pandemic: Modeling Aspects of Transportation


1
Department of Road Transport, Faculty of Transport and Aviation Engineering, Silesian University of Technology, 8 Krasińskiego Street, 40-019 Katowice, Poland
2
Sino-US Global Logistics Institute, Shanghai Jiao Tong University, Shanghai 200240, China
*
Authors to whom correspondence should be addressed.
Energies 2021, 14(9), 2622; https://doi.org/10.3390/en14092622
Submission received: 2 February 2021
/
Revised: 21 April 2021
/
Accepted: 30 April 2021
/
Published: 3 May 2021
(This article belongs to the Special Issue Prospects for Electric Mobility: Systemic, Economic and Environmental Issues)
Abstract
:The global spread of the COVID-19 virus has led to difficulties in many branches of the economy, including significant effects on the urban transport industry. Thus, countries around the world have introduced different mobility policies during the pandemic. Due to government restrictions and the changed behaviors of transport users, companies providing modern urban mobility solutions were forced to introduce new business practices to their services. These practices are also apparent in the context of the electric shared mobility industry. Although many aspects and problems of electric shared mobility have been addressed in scientific research, pandemic scenarios have not been taken into account. Noticing this research gap, we aimed to update a previously developed model of factors that influence the operation of electric shared mobility by incorporating aspects related to the COVID-19 pandemic and its impact on this industry. This article aims to identify the main factors influencing the electric shared mobility industry during the COVID-19 and post-lockdown periods, together with their operation areas and the involved stakeholders. The research was carried out on the basis of expert interviews, social network analysis (SNA), and the use of the R environment. The article also presents sustainable transport management recommendations for cities and transport service operators, which can be implemented after a lockdown caused by an epidemic. The results in this paper can be used to support transport modeling and the creation of new policies, business models, and sustainable development recommendations. The contents will also be helpful to researchers worldwide in preparing literature reviews for articles related to sustainable management in the COVID-19 pandemic reality.
1. Introduction
The spread of the SARS-CoV-2 virus has significantly influenced users of transport services. With the threat posed by the pandemic, the number of trips has decreased significantly, which has reduced the demand for transport. Data published by Apple showed that fewer individuals requested travel options and directions to a given place between the end of March and May 2020 compared with January, with the following average decreases [1]:
- 54% in Italy,
- 51% in the United Kingdom,
- 8% in Germany,
- 14% in the United States of America.
The implementation of restrictions on public transport has significantly reduced its use around the world. For example, in Poland, the number of available buses, trams, and trains decreased by 50% [2]. In the United States of America and Germany, it decreased by 34% and 42%, respectively [2]. These restrictions and fear of contracting the virus from public transport have meant that society is much more inclined to choose a car for everyday travel. Simultaneously, however, problems arose for service providers of vehicles for shared transport, i.e., all forms of so-called shared mobility solutions (rental offices that provide short-term rentals of different kinds of vehicles) and ride-sharing solutions (such as Uber or Grab).
On the one hand, many residents who did not have private vehicles wanted to use shared transport services; on the other hand, they were afraid to do so because of sanitary and safety issues. There were also issues related to the approaches taken by local and government authorities with respect to shared mobility vehicles. New mobility service providers were forced to adapt their business practices to the new market situation. Furthermore, these circumstances also had a strong impact on the shared electro-mobility market. Some forecasts even indicated that the pandemic would end the development of electric mobility and destroy practices in the field of sustainable urban mobility created over the years [3,4]. As a result, there was considerable chaos worldwide in the electric and traditional shared mobility industries.
The changing needs of society have led to the emergence of new or improved services offered in electric shared mobility systems. All of these changes were the result of improved business models. We identified a gap in the current research related to changes in services offered during a pandemic. From a scientific point of view, we identified a need to update the model describing factors that influence the development of shared mobility services because many aspects, problems, and challenges defined before the pandemic have now changed. This article aims to identify the main factors influencing the electric shared mobility industry during the COVID-19 and post-lockdown periods, as well as their operation areas and involved stakeholders. The research was carried out on the basis of expert interviews, social network analysis (SNA), and the use of the R environment. The article also presents sustainable transport management recommendations for cities and transport service operators, which can be implemented after a lockdown caused by an epidemic. The results in this paper can be used to support transport modeling and the creation of new policies, business models, and sustainable development recommendations. The contents will also be helpful to researchers worldwide in preparing their literature reviews for articles about sustainable management in the COVID-19 pandemic reality.
2. Theoretical Background
Electric shared mobility services can be analyzed from many different perspectives. This type of analysis is often used to model new services or optimize services currently offered in urban transport systems [5,6,7,8,9,10,11]. These factors describe elements that are taken into account at different stages of the electric shared mobility service life cycle [12,13,14]. These stages include the planning, implementation, operation, and maintenance of the service. This type of approach is used for a variety of electric shared mobility services available on the market, such as e-bike-sharing, e-scooter-sharing, and e-car-sharing services. A literature analysis shows that the main factors related to electric shared mobility services are fees, parking, fleets, costs, types of systems, and electric vehicle power supply. However, there are more detailed subfactors depending on the kind of system [9,10,11,12,13,14,15,16,17,18,19,20,21,22,23,24,25,26,27,28,29,30]. Following a literature review, a summary of previous research is presented in Table 1.
From the perspective of sustainable transport development, the best services rely on electric vehicles or encourage drivers to transition from owning a vehicle to using a shared car. Until the coronavirus pandemic outbreak, services relied heavily on the demand for mobility and the provision of transport alternatives within urban areas. Most improvements to sustainable transport services focused on aspects such as replenishing fleets and introducing an appropriate environmental management policy (recycling and storage of batteries from electric vehicles, recycling of unused vehicles) or on social issues in terms of eliminating transport barriers and social discrimination resulting from a lack of available vehicles or lack of funds for their purchase or maintenance [31,32]. Such changes are usually derived from appropriate transport modeling for locating or relocating vehicles, optimizing their routes, or optimizing fleets [33,34,35,36], as these factors have emerged as the main aspects of planning transport systems based on shared mobility services. However, the outbreak of the epidemic led to significant and unexpected changes in the city logistics market. For example, in [37], the authors reviewed articles on the COVID-19 epidemic and found that issues related to rethinking and redesigning business models for sustainability are still under-researched. Other authors [38,39,40,41] emphasized that an appropriate multicriteria analysis of implemented policies (including those related to corporate social responsibility [32]) for sustainable development is key when designing new services for the public and ensuring appropriate resilience. In turn, transport analyses in the context of COVID-19 have mainly focused on issues related to the social approach and the changing transport behaviors of passengers [40,41], unprecedented changes in travel habits [42], and technical issues related to passenger flows [42]. However, there has been a lack of focus on holistic approaches to studying aspects associated with modeling electric shared mobility after COVID-19; for this reason, comprehensive analyses were performed in this study.
3. Materials and Methods
The steps of this study included conducting qualitative research (expert interviews), performing social network analysis (to produce a network of factors analyzed in the context of the COVID-19 pandemic), analyzing results, and providing proposals and recommendations.
The first step was to refer to a list of aspects that affect the development of electric shared mobility services, as previously proposed by the authors in [43]. The list of factors influencing shared mobility services resulted from an international workshop on electric shared mobility, and it was used to develop a mathematical model for e-shared mobility services. The list of factors that influence electric shared mobility systems is presented in Table 2.
The list presented in Table 2 was developed as a holistic set of factors for modeling transport systems. These factors were taken into account prior to the outbreak of the COVID-19 pandemic. The list of factors was used as an element of the questionnaire used during expert interviews. Forty-six representatives of co-mobility service providers were invited to participate in the research project “New mobility and the COVID-19 pandemic”. The project included 20 meetings with representative stakeholders of the shared mobility industry. The meetings were organized and moderated by scientists from the Faculty of Transport and Aviation Engineering of the Silesian University of Technology. Meetings were held in December 2020 via the Internet. Of the 46 invited guests, 20 respondents accepted the invitation. The 20 shared mobility operators represented five e-bike suppliers, three e-scooter suppliers, four e-moped suppliers, and eight e-car-sharing providers. The operators who participated in the survey offer their services in the largest Polish urban centers, i.e., in Warsaw, Katowice, Kraków, and Gdańsk.
This research was carried out using deliberate sampling. The use of a nonrandom selection of respondents for the study was based on the desire to learn the opinions of enterprises representing the shared mobility industry.
The qualitative component of the study was conducted through individual in-depth interviews (IDIs). Interviews were conducted in face-to-face meetings with scientists acting as moderators and interviewers, and meetings were taped. Following the research technique, an interview scenario was developed to gain in-depth knowledge of the impact of COVID-19 on various aspects of shared mobility services. The purpose of conducting in-depth interviews was to eliminate the influence of group members and obtain information that was unaffected by interactions with other people, especially because they performed the same industry activity.
Moreover, the use of individual interviews was motivated by the significant possibility that respondents had formed personal views on the COVID-19 pandemic. Furthermore, individual interviews allowed for the relatively free expression of controversial issues, especially for such a personal issue as the impact of the pandemic on the company’s suitability and profitability. The study aimed to elicit answers regarding the specific operation areas of shared mobility systems during the pandemic. The goal was not to extract creative solutions or concepts from participants but to obtain answers to update the mathematical model.
The research sample size was confirmed to be statistically representative. The minimum number of respondents Rmin necessary to perform expert-based research was determined using Equation (1) [44].
The interviews were structured according to a specific scenario with the goal of answering questions about the impact of the COVID-19 pandemic on the electric shared mobility industry. The qualitative research in this study used the method of field reconnaissance, which allowed the main aspects of the process to be selected, and the quantitative part was based on the assignment of relevant aspects to the areas of system and stakeholder operations. During the research, the LearningApps computer application was used, which is a program for designing games. The application of supporting and projection techniques using visual materials through games allowed for a thorough interpretation of the respondent’s statements. Furthermore, the techniques enabled respondents to answer questions in a more accessible and pleasant way and prevented their fatigue.
The steps of the in-depth interview process and the interview scenario are presented below.
Steps of in-depth interviews:
- Definition of the study group (operators of electric shared mobility services);
- Planning of the research setting (online meetings using the widely available Zoom platform);
- Development of an in-depth interview scenario;
- Recruitment of participants by sending e-mails, including reminders, about the meeting;
- Performance of interviews;
- Transcription, transfer of notes, and information digitization;
- Analysis of the obtained data.
The in-depth interview scenario was divided into three parts: introduction, main questions, and summary. A detailed interview scenario is included in Appendix A.
On the basis of the respondents’ answers, a list of factors influenced by the COVID-19 pandemic was compiled. Interestingly, the indicated factors were the same for all types of electric shared mobility services. A summary of responses is presented in Table 3.
The next step was to identify and describe new services that have been implemented in the represented companies in response to the COVID-19 pandemic. The identified practices were assigned to relevant factors (designated P1–P19). The responses are summarized in Table 4.
After collecting all of the respondents’ answers, the social network analysis (SNA) method, which describes an individual’s behavior at the micro and macro levels and the interactions between them, was used [45,46,47]. This method enables the comprehensive analysis of interactions by assessing the relationship between different entities. This method was invented and used by Moreno as early as the 1930s [45,46,47]. SNA is used in many research disciplines (e.g., social sciences, computer science, technology forecasting, production) [48,49,50,51,52]. SNA characterizes network structures in terms of nodes with connections and indicates the direction of each relationship by arrows between nodes [47]. Relationships between nodes in SNA may show linkages and indicate the influence of individual elements or a combination thereof [48,49,50,51,52]. The features of network structure elements are described by the power of the interaction between elements and the frequency and nature of the relationship [47]. The main determinant is the place occupied by an element in the network structure, as it reflects the status of individual units [52,53,54,55]. The strength of the SNA method is its ability to visualize complex dependencies in the phenomenon under consideration. SNA can be used to determine the influence of particular groups of elements on processes taking place in the analyzed network [56]. Detailed stages of the analysis are presented in the next chapter of the article.
According to the principles of SNA, we identified the main groups of stakeholders who represent the electric shared mobility market. Three groups of stakeholders were taken into account [57,58,59]:
- Electric shared mobility users, “U”: a group that includes all individual users of shared mobility services, both active participants of the journey and passive participants registered in the service provider’s data systems;
- Decision-makers, “G”: a group that includes local, regional, central, and international authorities who have an impact on decisions made regarding the development or recession of shared mobility services;
- Electric shared mobility service providers, “O”: a group that includes all providers of electric shared mobility services, including operators of e-bike-sharing, e-scooter-sharing, e-moped-sharing, and e-car-sharing services.
The three defined stakeholder groups have the greatest impact on electric shared mobility [57,58,59]. Identifying the interactions between the selected stakeholder groups can improve the current situation of the electric shared mobility market. Furthermore, they may also have a substantial impact on the development of electro-mobility and sustainable urban mobility plans or the development of regulations to create new mobility services [57,58,59].
Following the SNA method, the next step was to define key areas that are directly related to the electric shared mobility market, from the service development stage to their operations on the market. According to the interview responses of experts, the following four areas were defined [43]:
- Area 1: Development of electric shared mobility services;
- Area 2: Market introduction of electric shared mobility services;
- Area 3: Operation of the electric shared mobility services market;
- Area 4: Administration and management of electric shared mobility services.
The indicated areas are related to the life cycle of electric shared mobility services on the market, from the concept of its planning to its operation with appropriate management and administration or marketing of the services offered. These areas are always considered when developing business plans or performing risk analyses for the operation of shared mobility services.
On the basis of the list of problems that occur in electric shared mobility presented in [43], the respondent’s task in the expert interview was to define the relationship between problems and the stakeholders and areas under consideration. After determining the factors influenced by the COVID-19 pandemic (Table 2 and Table 3), they were summarized, as presented in Table 5.
4. Results
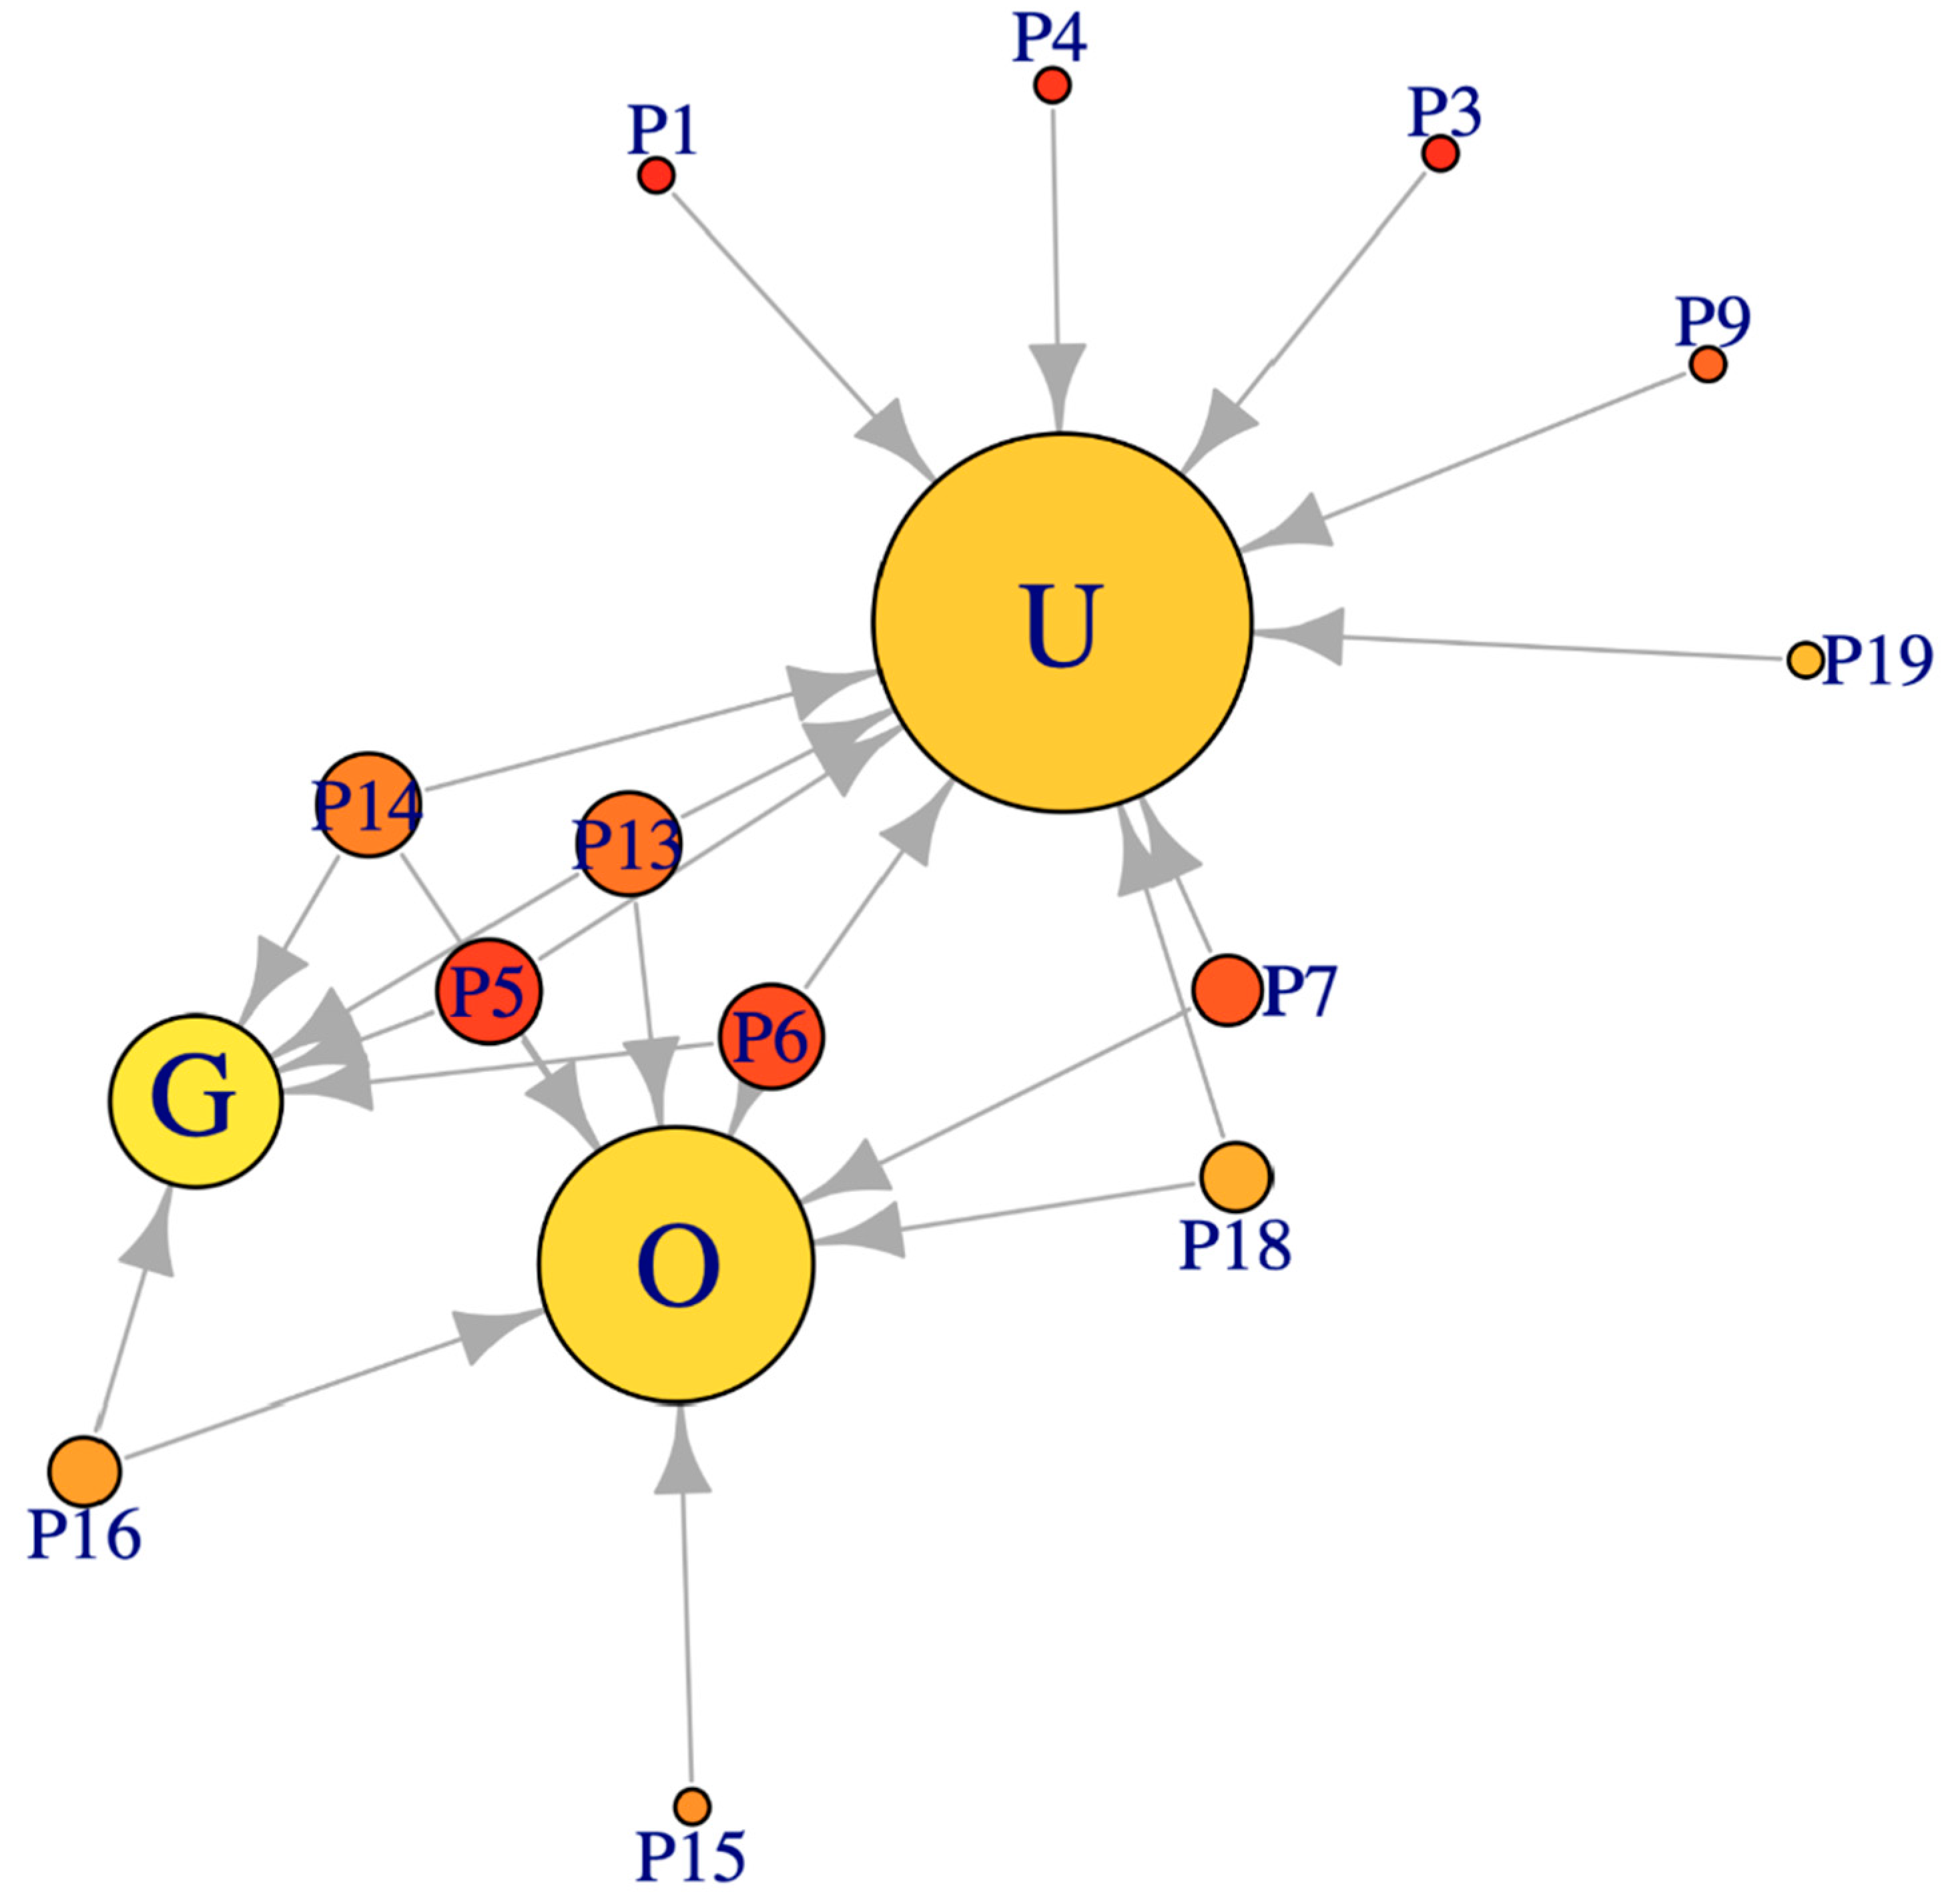
The results were analyzed using the R software and the igraph library. The generated network of connections was made up of 22 nodes with 56 connections. The topography of the created network is shown in Figure 1. The objects labeled “U”, “O”, and “G” represent categories of stakeholders, and those marked “P” represent problems. The arrows that connect the individual nodes indicate a relationship between a pair of stakeholders and aspects. The direction of the arrow characterizes the relationship between a pair of nodes. The aspects that affect a greater number of links are situated in the center of the network under consideration. Conversely, nodes with fewer links are near the edge of the network.
The network overview allows for identifying relationships between stakeholders and problems in the network under study and selecting the main problems in the network topography. Problems that have many connections (Figure 1) reflect their multifactorial nature and the multiple stakeholders that are affected by these relationships. Changing one aspect changes the rest of the network structure, as well as stakeholder relationships. Table 6 summarizes the number of output connections for each aspect.
The proximity centrality values of the individual network elements were successively calculated. Centrality is a measure of the importance of nodes in the network and identifies the most closely related nodes.
The centrality value can be used for the following purposes:
- -
- Assessment of a node’s impact on other nodes in the network;
- -
- Identification of the nodes that are most influenced by other nodes;
- -
- Observation of the flow or spread of something in the network (information, objects, phenomena);
- -
- Analysis of the effectiveness with which phenomena spread in the network via individual nodes;
- -
- Identification of nodes that block or prevent the spread of phenomena.
The values for each aspect are shown in Table 7. Values greater than the calculated value of C(x) highlight the aspects that have the greatest impact on the network under investigation. An aspect whose value is lower than C(x) is of less significance and will not affect the operation of the entire network. The calculated values highlight the network’s complexity and the aspects that need to be considered first to ensure the network’s effective operation during the COVID-19 pandemic. Aspects whose nodes are located in the center of the network need to be considered simultaneously.
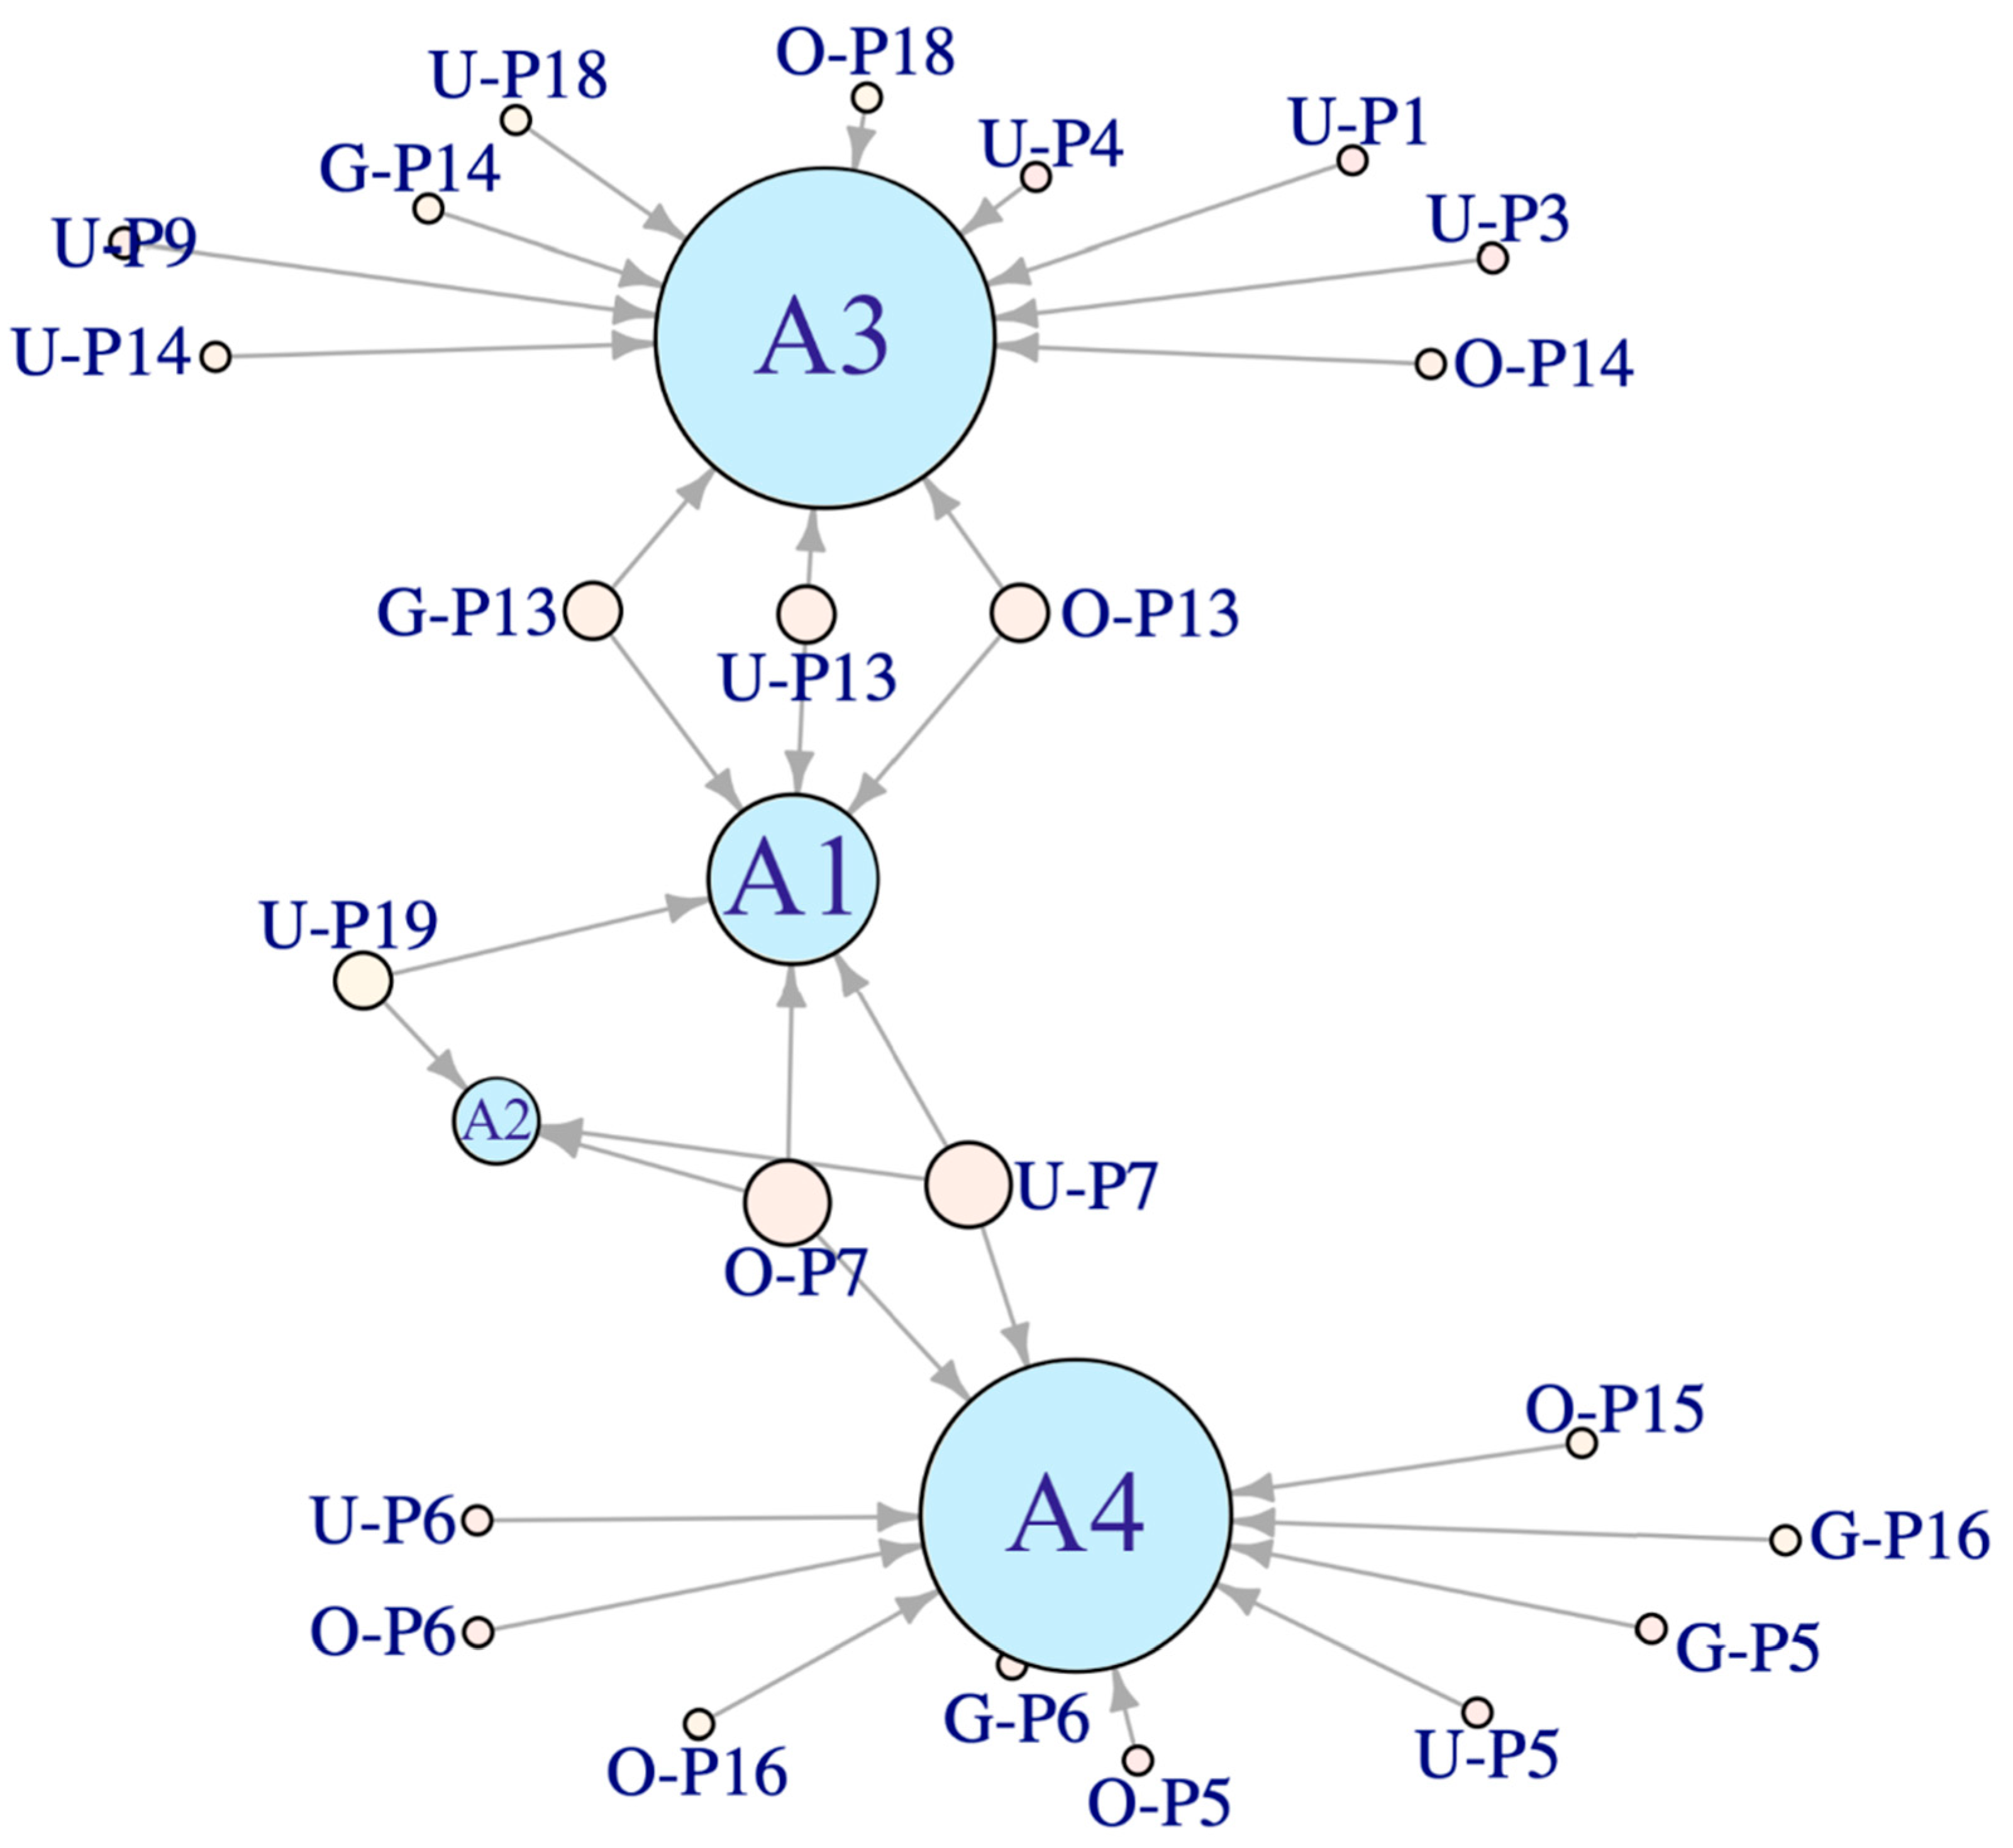
The values of individual aspects (see Table 7) indicate that the most important problem is aspect 13, followed by aspects 7, 14, and 19, which obtained the next highest values. These results identify aspects that are of particular importance when modeling an electric shared mobility system. Problems P18, P5, and P6 obtained similar values, and they should be considered a common group of factors that influence the network. All other issues, the values of which are less than C(x) = 0.339, are of very little statistical importance; thus, they can be omitted during modeling. On the basis of these research results, a new network structure was developed, which indicates links between areas and stakeholder problems during the SARS-CoV-2 pandemic. The network structure is shown in Figure 2.
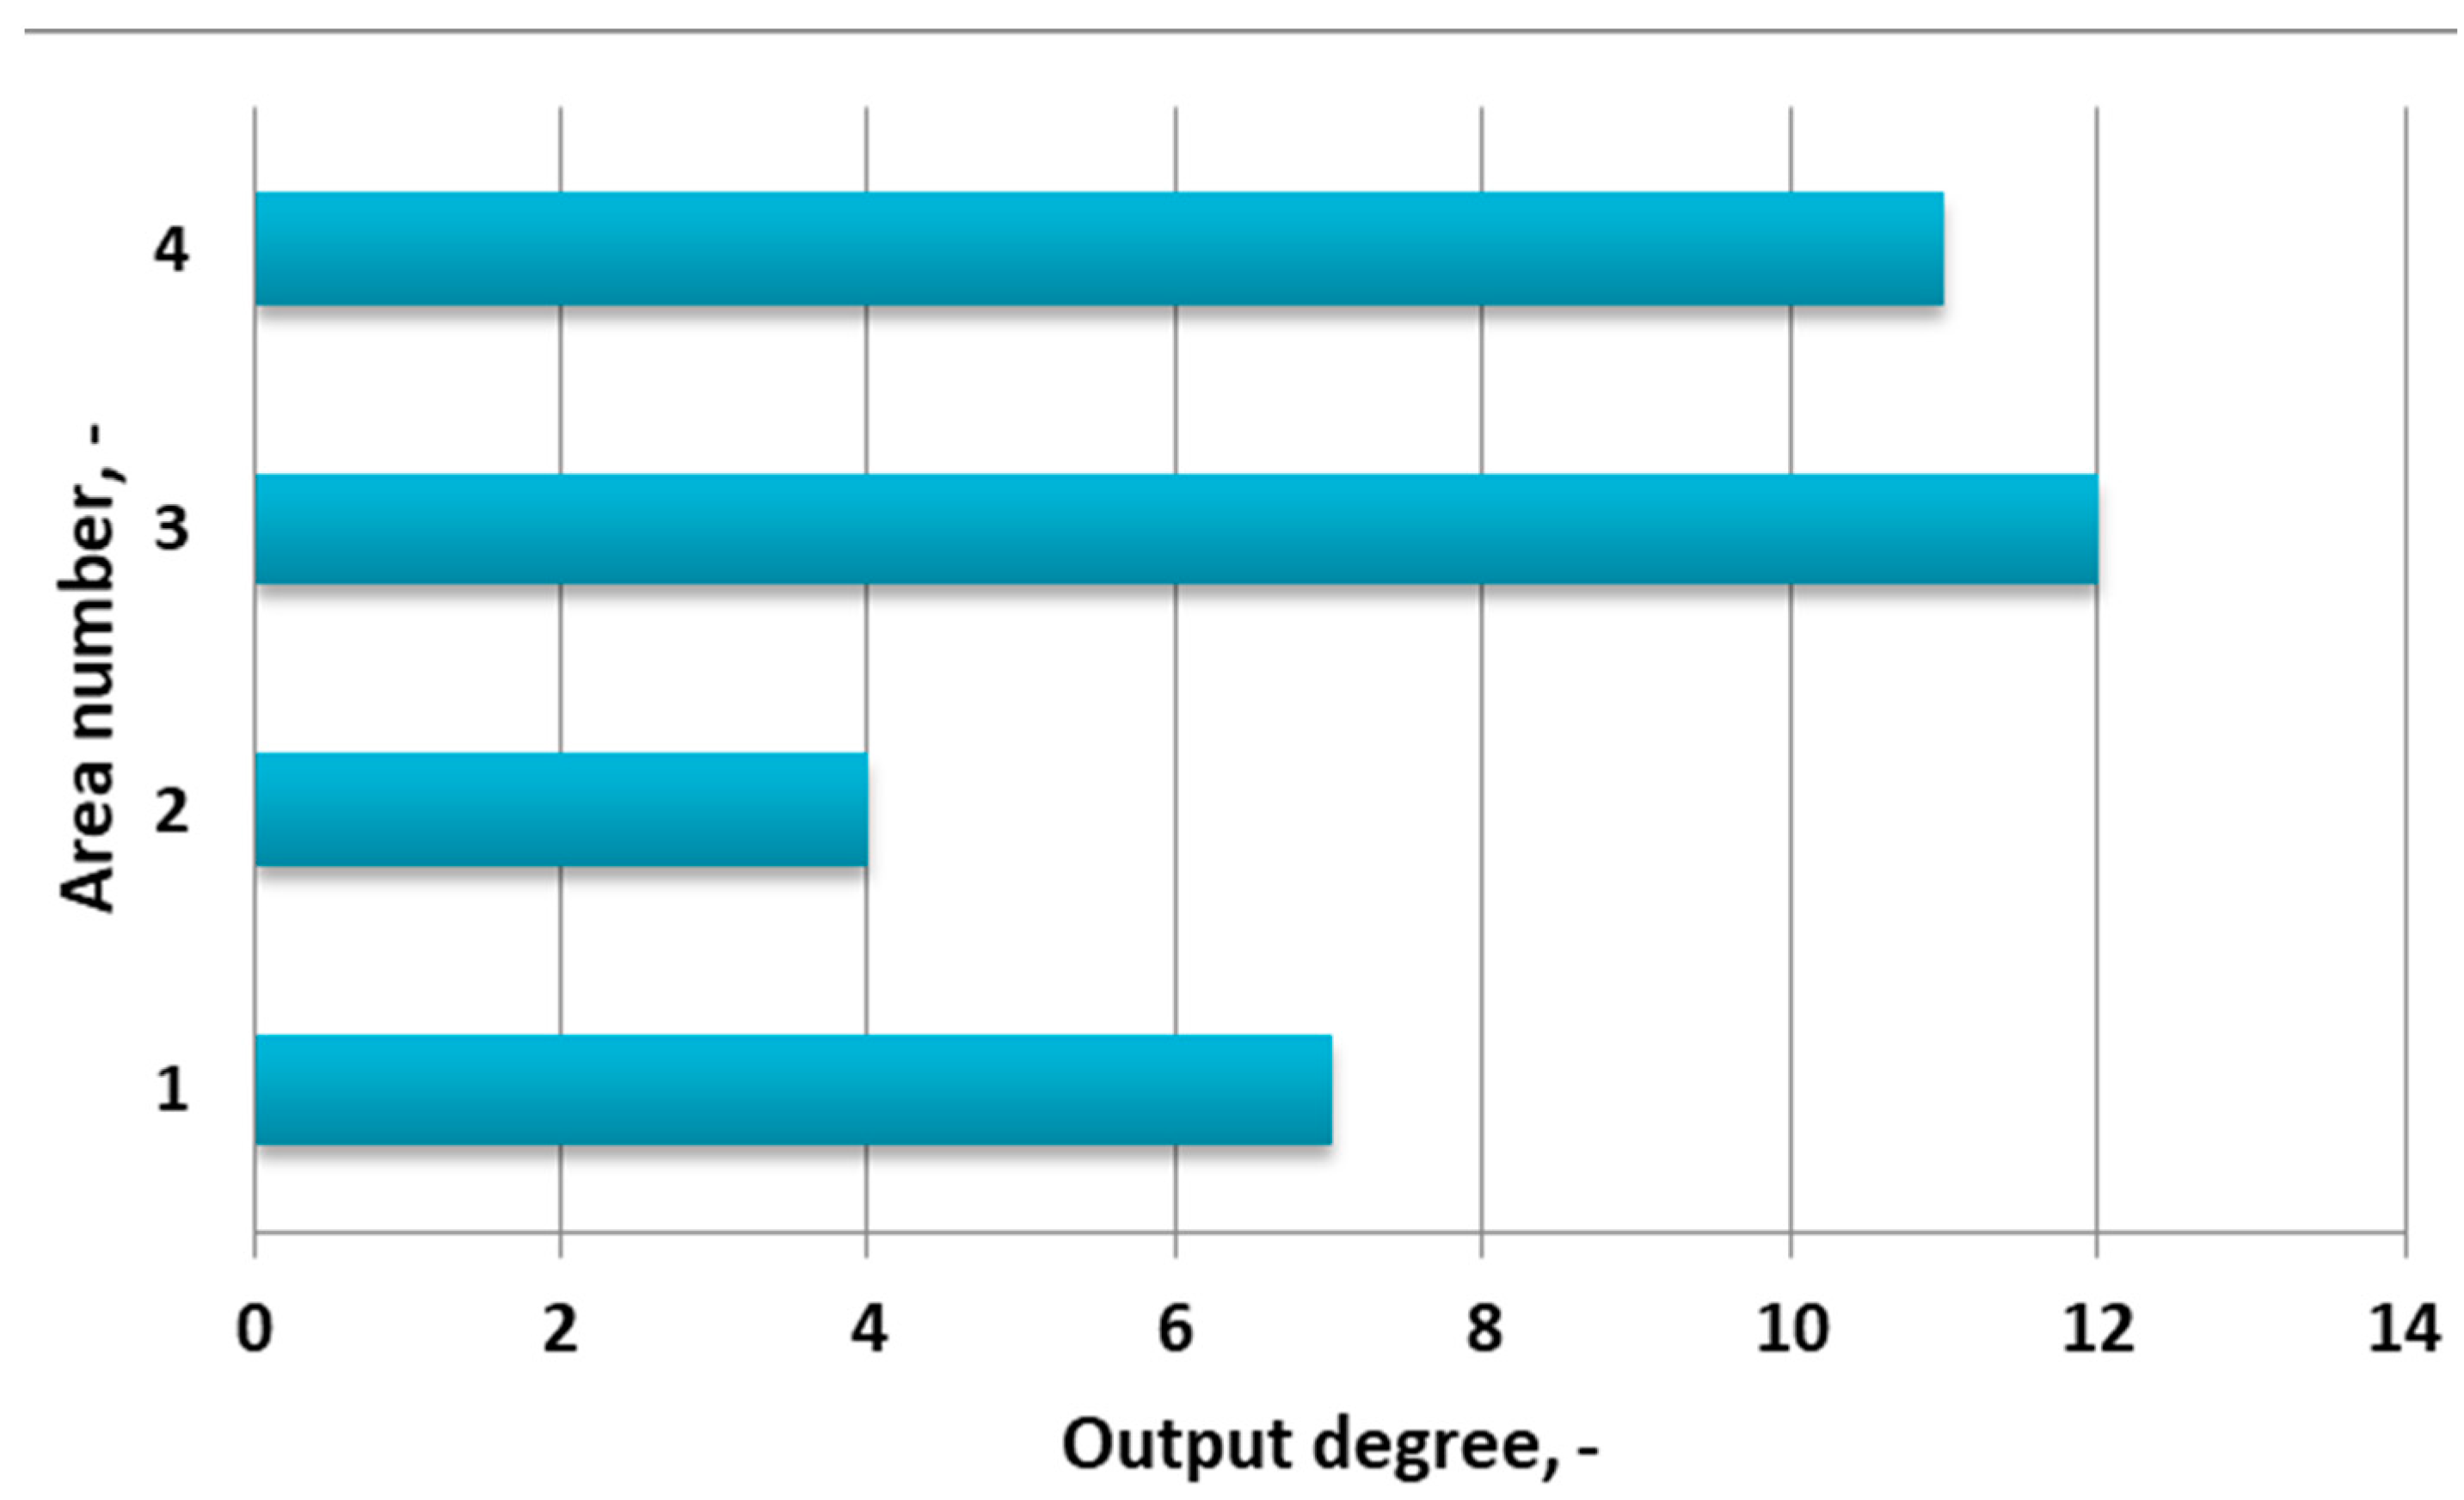
Knowledge of the network topography allows for much more effective management of individual elements in the network during the COVID-19 pandemic. The size of the circle of an individual aspect in SNA indicates the scope of the problem associated with it (Figure 2). Areas 3 (operation) and 4 (governance) have the greatest impact on the whole network. Nevertheless, without area A1 (planning), areas 3 and 4 cannot appropriately manage their activities, which is shown directly in the structure nodes. Area 2 (implementation) has a small impact on the network’s structure. An essential observation is that only aspects 19 and 7 directly affect area 2. Figure 3 shows the number of connections of each area.
Knowing how specific aspects are linked to areas will allow for appropriate and effective management of the electric shared mobility system during the COVID-19 pandemic.
5. Discussion
The analyses performed using the SNA method made it possible to identify the most important aspects affecting the operation of the electric shared mobility network during the COVID-19 pandemic. Additionally, the areas that need to be given the most attention for the system to function optimally were determined. Table 6 details the most important aspects, such as prices, vehicle replacement, operation area, legal requirements, location of parking spaces, and serviceability safety.
The results obtained on the basis of the SNA method are applicable to the entire electric shared mobility market. According to the performed analysis, it can be concluded that, despite the use of various types of vehicles in electric shared mobility systems, aspects related to management and functionality obtain similar values. It should be emphasized that the research carried out was representative of the business practices used by the entire electric shared mobility industry. The use of the R language enabled a graphical representation of the network structure (SNA) and the visualization of the final results.
As can be seen from the results, the aspect that has the greatest impact is aspect 13, i.e., price. The importance of this factor is widely understood in the market reality. The business practices of service providers of electric shared mobility indicate that operators focused on developing new pricing schemes during the pandemic [60]. First, they started to offer more packaged services, for example, long-term packages (weekly or monthly). Importantly, the ability to rent a vehicle for a longer period of time has also become available for scooter rental services. The added scooters were only available at “per minute” rates. During the pandemic, a 24 h or, for example, 3–5-day rental system was introduced [61]. In addition, the price of using the “stop” function was reduced. Special discounts were also introduced for people delivering food with shared mobility vehicles, as well as special rates for doctors and social assistance for people infected with COVID-19 [60,61]. Interestingly, in the service model developed before the COVID-19 pandemic [43], pricing issues were not the decisive factor that needed to be taken into account. It is also worth noting that the price factor in the P13 problem (price) has a much higher C(x) value relative to the others. Therefore, there is a need to conduct research on the economic aspects of transport changes in electromobility during the COVID-19 pandemic.
Aspect 7, which describes the technical condition of the fleet, is also important. This aspect is particularly important given that, in the transport models presented in the literature thus far, only the number of vehicles, not their technical condition, was taken into account. The fleet’s technical condition is also of particular significance for protecting against the pandemic and other viruses. Of particular importance are all actions taken to disinfect strategic places in vehicles, such as the protection of the steering wheel, gearshift lever, and door handles by wrapping them [60,61].
The other two aspects are P14 (vehicle replacement) and P19 (rental area). These aspects are closely related not only thematically but also in terms of the value of the analysis. From a practical point of view, it is worth mentioning that, during the COVID-19 pandemic, the business models of electric shared mobility systems have changed. Many service providers have incorporated new business concepts into their services, e.g., the ability to prebook a vehicle, additional relocation, replacement of the vehicle in the door-to-door system, and changes in system operations [60,61]. Interestingly, many service providers have also expanded their zones of operation to include additional cities or districts that were previously excluded from these systems. Such solutions have enabled it to become an alternative to public transport, as well as allowed increasing social distance in the vehicle. Notably, in the previous transport model, which does not take the pandemic into account [43], these were not the primary determinants of the efficient operation of the system.
In further analysis of the results, it is worth focusing on aspects that should be regularly updated, such as local policy (aspect 5), parking spaces (aspect 6), and the technical safety of vehicles (aspect 18). Due to their similar values, these aspects should be considered together. During the pandemic, many local legal restrictions had a strong impact on the development of electromobility. After analyzing the recommendations of city authorities regarding mobility during and after the COVID-19 pandemic, it can be concluded that all suggestions are focused on cycling and walking [62,63]. Recommendations for bicycles include ensuring the ability of individual users and users of shared bicycles to navigate bicycle paths. Local authorities do not place great emphasis on car-sharing services, and very little attention is paid to shared mobility and electromobility services in their decisions [64,65].
Other transport services with negligible effects are taxis; however, they are strictly a substitute for traveling in individual vehicles. In our opinion, the practices introduced by electric shared mobility providers constitute the most comprehensive solutions implemented during the pandemic in urban transport. By excluding new mobility services from health and safety recommendations, society is losing a network of improvements that has been built over the years in furtherance of urban resilience and sustainable transport mobility. Moreover, strategies for the development of electromobility in different types of urban areas are not reflected in the current mobility recommendations; such actions may lead to a recession in the market position established by electromobility in recent years.
Aspects 1 (location of vehicles), 3 (registration process), 4 (rental process), 9 (safety of users), 15 (privileges for operators), and 16 (surcharges for operators) identify problems that slightly disrupt the system network, and they can be taken into account at a later stage of further analysis. It should be noted that no studies were found that specifically dealt with the subject of modeling transport services during a pandemic, which would be based on a similar type of research and network analysis. The analyzed articles on transport during the pandemic focused on various topics related to shared mobility services; for example, in [58], the authors analyzed the movement patterns of a population in Sicily. The results showed that the surveyed part of the population traveled via shared mobility much more often than walking or cycling. Respondents positively assessed the operation of electric shared mobility during the COVID-19 pandemic [66].
Hungary is another example where shared mobility was further developed during the pandemic. Research carried out in Budapest clearly showed that bike sharing increased significantly [67]. The author stated that this development was influenced by the fact that users were looking for a safe means of transport to avoid the COVID-19 virus.
The results of another study indicated that bike sharing is now more likely to become the preferred mobility option for people who have previously commuted in private cars as passengers and those who were already registered users of bike sharing [68]. The research results highlighted how important it is for the system to function during the COVID pandemic to raise public awareness and promote alternative transport, such as e-bikes and e-scooters [68].
From the transport administration perspective, during the pandemic, approaches to restrictions varied greatly from country to country. For example, [69] showed that there is no clear-cut approach to leadership. Many transport issues have been treated very generally by placing limitations on all individuals and their daily lives. There is also an ill-considered approach to energy issues, including electromobility, and disregard for specific stakeholder groups [69]. As emphasized in [70], the shared economy sector has been left most exposed to the COVID-19 pandemic. The author further emphasized that the constraints on the sharing economy may be deliberate, and cities affected by the pandemic may impose new regulations and taxes on shared mobility services to protect public transport [70]. In turn, in [71], the authors suggested that governments gain a better understanding of transport behavior and effective transport planning, as this would allow for better organization of both public transport and shared mobility services. Moreover, as discussed in [72], changes in business models after the COVID-19 crisis will be directed toward digital, automatic, and contactless activities. All activities in the field of shared mobility fit perfectly into this context.
Our research had some limitations, and the results presented in this article suggest directions for further analyses. The materials that we collected were sourced from different electric car-sharing service providers. Their number and opinions are statistically representative; however, it should be emphasized that the obtained results came from companies operating in Poland. Although these companies maintain standards in line with foreign trends, there may be slight differences related to the operation of the system and, for example, local legal requirements in the field of electromobility.
6. Conclusions
In summary, this article identified aspects and areas that should be considered in the context of a pandemic when modeling and optimizing energy services for shared mobility. The authors aimed to show differences between the classical transport models developed before the pandemic and the situation after its occurrence. The approach proposed in the article fills the research gap resulting from missing guidelines for electromobility transport models during a pandemic. The article highlights the possibilities of using the SNA method as an essential tool in the process of designing and operating an electric shared mobility system during the COVID-19 pandemic. The SNA method is used to determine the importance of individual nodes making up a network. As shown in Table 6, mean node distances greater than the value of C(x) indicate problems outside the area of proximity centrality. Aspects with values greater than the calculated range disturb the effective operation of the network. These values indicate that the network is extensive and that the factors are closely related. This method is a simple approach to creating and presenting the topography of an analyzed network. The results presented in this article show that this technique can perfectly complement the conducted research and can significantly facilitate a multi-aspect analysis of the considered phenomenon.
The analyses showed that the most important factors in the operation of the electric shared mobility market are prices, the condition of the fleet, the replacement of vehicles, rental area, legal requirements, the location of parking spaces, and operational safety. The results presented in this article can support both transport modeling and the creation of new policies or restrictions related to the pandemic. The developed approach can also be used by electric shared mobility service providers to update their business models and develop new practices.
The added value of using the SNA method to model transport processes is that the results can be taken into account during the transformation of electric shared mobility systems.
These results can be used to support scientists who need clearly defined factors as input values when building models and conducting analyses from a scientific point of view. The results of this article can, therefore, contribute to any sustainable transport plan.
In future research, we plan to conduct detailed analyses of electrical shared mobility service business models following the second wave of COVID-19. The obtained data can be compared with the implications indicated in this study. The next phase of research and further SNA analyses will update the proposed model for the transport of electric shared mobility services in the post-pandemic period.
Author Contributions
Conceptualization, K.T.; methodology, K.T. and A.K.; validation, F.C.; resources, K.T., A.K., and F.C. data curation, K.T. and A.K.; writing—original draft preparation, K.T., and A.K.; writing—review and editing, K.T. and A.K.; supervision, F.C.; project administration, K.T.; funding acquisition, K.T. All authors have read and agreed to the published version of the manuscript.
Funding
The research and analyzes performed for this article were funded by the Silesian University of Technology grant for support to start activities in a new research topic, as part of the Initiative-Excellence program Research University 12/010/SDU/10-22-01. The APC was funded by Silesian University of Technology.
Institutional Review Board Statement
Not applicable.
Informed Consent Statement
Not applicable.
Data Availability Statement
The data presented in this study are available on request from the corresponding author.
Conflicts of Interest
The authors declare no conflict of interest.
Appendix A
Appendix A.1. Introduction
- Self-introduction of the researcher.
- Open conversation (goal: relaxation of the respondent).
- Thank you for finding time (goal: positive emotions).
- Informing what we want to find out.
- Information that the answers are anonymous.
- The question of whether we can record an interview for our scientific needs.
- Asking if the participant has additional questions about the study.
Appendix A.2. Main Part
- Warming up: What electric shared mobility services does your company provide? How long has your company been operating on the Polish market?
- Opening up: How has the COVID-19 pandemic overall affected your company’s market situation?
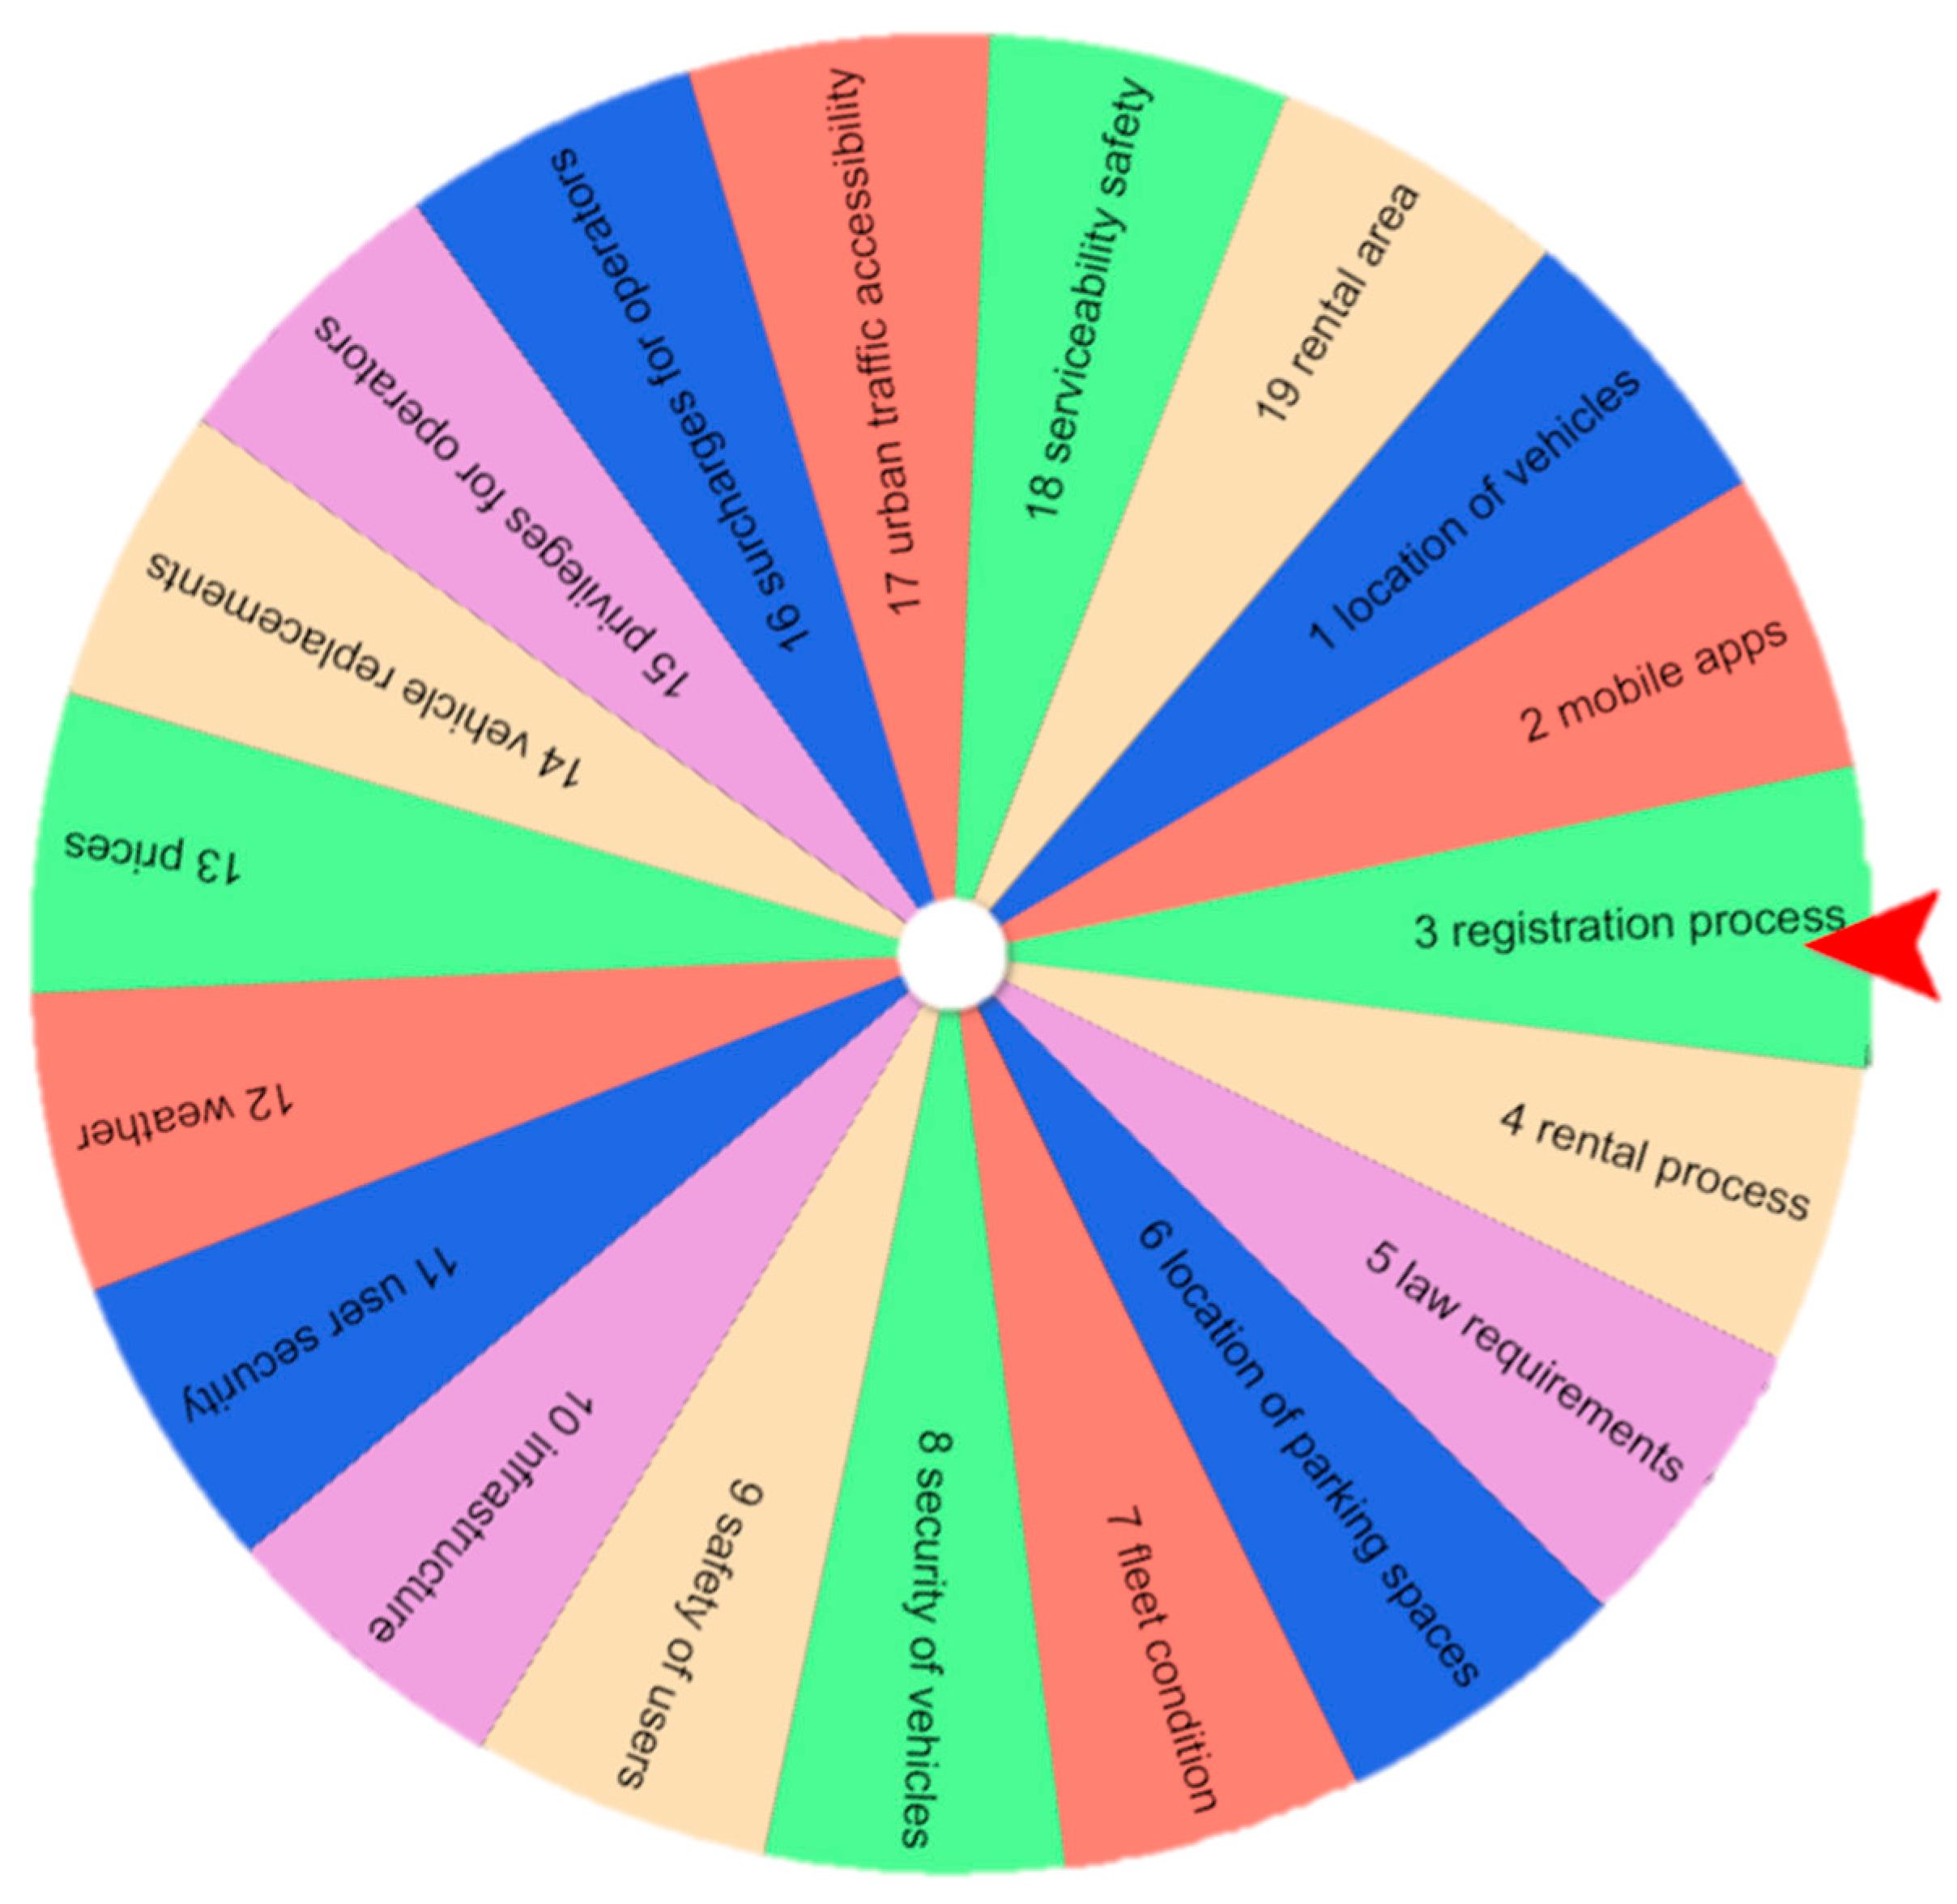
- Development (from general to detail): Has the pandemic affected the following 19 aspects (presented in the Table 2)? In order to get to know the aspects better, each of them was discussed with the respondent. Then, the element of the wheel of fortune was used. All 19 aspects were randomly selected, and the respondent’s task was to answer whether a given aspect of his company’s operation was affected by the COVID-19 pandemic. After determining which aspects were affected by the pandemic, the following questions were asked: How? What has been limited? What was minimized, and what was maximized? A fragment of the game during the interviews is presented in Figure A1.
Figure A1.
Fragment of the wheel of fortune game using during the interviews.

- Next, the respondents were asked to indicate which of the 19 aspects presented in Table 2 are considered the most important for the functioning of services in the business arena. For this purpose, the LearningApps application was used, where the respondents sorted the problems from the most important to the least important in their company. An exemplary view of the LearningApps application is shown in Figure A2.
The researchers asked for a list of the most important factors so that, in the next step, it would be easier for respondents to consider what types of electric shared mobility services were implemented due to the COVID-19 pandemic.
- The last step was to assign the practices provided by the respondent to the list of 19 aspects of electric shared mobility systems’ functioning.
Figure A2.
An exemplary view of the LearningApps application.

Appendix A.3. Summary
Emphasize that the researcher has no more questions. Is there anything else you would like to say? Would you like to highlight something before we finish?
Thank you for your time. Your answers will greatly help us when modeling new mobility services during the COVID-19 pandemic.
References
- Apple Incorporation Mobility Report. Available online: https://www.apple.com/covid19/mobility (accessed on 18 November 2020).
- Mobility during COVID-19. Available online: https://www.gstatic.com/covid19/mobility/2020-05-02_PL_Mobility_Report_en.pdf (accessed on 10 May 2020).
- Amblard, M. How will the Covid-19 Crisis Impact the Electrification of Mobility? The Urban Mobility Daily. Available online: https://urbanmobilitydaily.com/how-will-the-covid-19-crisis-impact-the-electrification-of-mobility/ (accessed on 19 January 2021).
- Neil, K. The Effects of COVID-19 on Electro-Mobility. Autvista Group. Available online: https://autovistagroup.com/news-and-insights/effects-covid-19-electromobility (accessed on 19 January 2021).
- Hu, Y.; Zhang, Y.; Lamb, D.; Zhang, M.; Jia, P. Examining and optimizing the BCycle bike-sharing system—A pilot study in Colorado, US. Appl. Energy 2019, 247, 1–12. [Google Scholar] [CrossRef]
- Shaheen, S.; Martin, E.; Totte, H. Zero-emission vehicle exposure within U.S. car-sharing fleets and impacts on sentiment toward electric-drive vehicles. Transp. Policy 2020, 85, 23–32. [Google Scholar] [CrossRef]
- Wang, J.; Lindsey, G. Do new bike share stations increase member use: A quasi-experimental study. Transp. Res. Part A Policy Pract. 2019, 121, 1–11. [Google Scholar] [CrossRef]
- Campbell, A.; Cherry, C.; Ryerson, M.; Yang, X. Factors influencing the choice of shared bicycles and shared electric bikes in Beijing. Transp. Res. Part C Emerg. Technol. 2016, 86, 399–414. [Google Scholar] [CrossRef] [Green Version]
- Pérez, V.C. Simulation of a Public E-Bike Sharing System; Universitat Politechnica Di Catalugna: Barcelona, Spain, 2016. [Google Scholar]
- Wu, L.; Gu, W.; Fan, W.; Cassidy, M. Optimal design of transit networks fed by shared bikes. Transp. Res. Part B Methodol. 2020, 13, 63–83. [Google Scholar] [CrossRef]
- Awad-Núñez, S.; Julio, R.; Gomez, J.; Moya-Gómez, B.; Sastre González, J. Post-COVID-19 travel behaviour patterns: Impact on the willingness to pay of users of public transport and shared mobility services in Spain. Eur. Transp. Res. Rev. 2021, 13, 20. [Google Scholar] [CrossRef]
- Feng, X.; Sun, H.; Wu, J.Z.; Lv, Y. Trip chain based usage patterns analysis of the round-trip car-sharing system: A case study in Beijing. Transp. Res. Part A Policy Pract. 2020, 140, 190–203. [Google Scholar] [CrossRef]
- Weinert, J.; Ma, C.; Yang, X.; Cherry, C. The transition to electric bikes in china: Effect on travel behavior, mode shift, and user safety perceptions in a medium-sized city. Transport. Res. Rec. J. Transport. Res. Board 2007, 1938, 62–68. [Google Scholar] [CrossRef] [Green Version]
- Huang, K.; An, K.; de Almeida Correia, G.H. Planning station capacity and fleet size of one-way electric car-sharing systems with continuous state of charge functions. Eur. J. Oper. Res. 2020, 287, 1075–1091. [Google Scholar] [CrossRef]
- Lee, M.; Chow, J.; Yoon, G.; He, B.Y. Forecasting e-Scooter Competition with Direct and Access Trips by Mode and Distance in New York City. Available online: https://arxiv.org/ftp/arxiv/papers/1908/1908.08127.pdf?fbclid=IwAR0qZkxTDj-8qYeerGpHtqnacR6ylFfgHsmYisQ1hrXxpp1qkTT0XylO5Mw (accessed on 10 September 2020).
- Aguilera-García, A.; Gomez, J.; Sobrino, N. Exploring the adoption of moped scooter-sharing systems in Spanish urban areas. Cities 2020, 96, 102424. [Google Scholar] [CrossRef]
- Moran, M.E.; Laa, B.; Emberger, G. Six scooter operators, six maps: Spatial coverage and regulation of micromobility in Vienna, Austria. Case Stud. Transp. Policy 2020, 8, 658–671. [Google Scholar] [CrossRef]
- Chen, Y.-W.; Cheng, C.-Y.; Li, S.-F.; Yu, C.-H. Location optimization for multiple types of charging stations for electric scooters. Appl. Soft Comput. 2018, 67, 519–528. [Google Scholar] [CrossRef]
- Younes, H.; Zou, Z.; Wu, J.; Baiocchi, G. Comparing the Temporal Determinants of Dockless Scooter-share and Station-based Bike-share in Washington, D.C. Transp. Res. Part A Policy Pract. 2020, 134, 308–320. [Google Scholar] [CrossRef]
- Grüger, F.; Dylewski, L.; Robinius, M.; Stolten, D. Carsharing with fuel cell vehicles: Sizing hydrogen refueling stations based on refueling behavior. Appl. Energy 2018, 228, 1540–1549. [Google Scholar] [CrossRef]
- Bieliński, T.; Dopierała, Ł.; Tarkowski, M.; Ważna, A. Lessons from Implementing a Metropolitan Electric Bike Sharing System. Energies 2020, 13, 6240. [Google Scholar] [CrossRef]
- Carrese, S.; D’Andreagiovanni, F.; Giacchetti, T.; Nardin, A.; Zamberlan, L. An optimization model for renting public parking slots to carsharing services. Transp. Res. Procedia 2020, 45, 499–506. [Google Scholar] [CrossRef]
- Abbasi, S.; Ko, J.; Kim, J. Carsharing station location and demand: Identification of associated factors through Heckman selection models. J. Clean. Prod. 2021, 279, 123846. [Google Scholar] [CrossRef]
- Repoux, M.; Kaspi, M.; Boyacı, B.; Geroliminis, N. Dynamic prediction-based relocation policies in one-way station-based car-sharing systems with complete journey reservations. Transp. Res. Part B Methodol. 2019, 130, 82–104. [Google Scholar] [CrossRef]
- Clemente, M.; Fanti, M.P.; Iacobellis, G.; Ukovich, W. Modeling and simulation of an electric car sharing system. In Proceedings of the 25th European Modeling and Simulation Symposium, Athens, Greece, 23–25 September 2013; pp. 587–592. [Google Scholar]
- Benarbia, T.; Omari, A.; Aour, B.; Labadi, K.; Hamaci, S. Electric cars-sharing systems modeling and analysis. In Proceedings of the International Conference on Control, Automation and Diagnosis (ICCAD), Hammamet, Tunisia, 19–21 January 2017; pp. 30–35. [Google Scholar]
- Boyacı, B.; Zografos, K.G. Modelling user preferences in one-way electric car-sharing systems. In Proceedings of the 60th Annual Conference of the Operational Research Society, Lancaster, UK, 11–13 September 2018. [Google Scholar]
- Hamroun, A.; Labadi, K.; Lazri, M. Modelling and Performance Analysis of Electric Car-Sharing Systems Using Petri Nets. In Proceedings of the E3S Web of Conferences, Constanta, Romania, 26–27 June 2020; p. 03001. [Google Scholar]
- Axsen, J.; Sovacool, B.K. The roles of users in electric, shared and automated mobility transitions. Transp. Res. Part D Transp. Environ. 2019, 71, 1–21. [Google Scholar] [CrossRef]
- Gambella, C.; Malaguti, E.; Masini, F.; Vigo, D. Optimizing relocation operations in electric car-sharing. Omega 2018, 81, 234–245. [Google Scholar] [CrossRef]
- Bieliński, T.; Kwapisz, A.; Ważna, A. Bike-sharing systems in Poland. Sustainability 2019, 11, 2458. [Google Scholar] [CrossRef] [Green Version]
- Wiederkehr, P.; Gilbert, R.; Crist, P.; Caïd, N. Environmentally Sustainable Transport (EST): Concept, Goal, and Strategy—The OECD’s EST Project. Eur. J. Transp. Infrastruct. Res. 2004, 4, 11–25. [Google Scholar]
- Elkington, J. Enter the triple bottom line. In The Triple Bottom Line; Routledge: London, UK, 2013; p. 23. [Google Scholar]
- Bansal, P. The corporate challenges of sustainable development. Acad. Manag. Perspect. 2002, 16, 122–131. [Google Scholar] [CrossRef]
- Nilsson, M.; Griggs, D.; Visbeck, M. Policy: Map the interactions between Sustainable Development Goals. Nat. News 2016, 534, 320–322. [Google Scholar] [CrossRef]
- Okraszewska, R.; Romanowska, A.; Wołek, M.; Oskarbski, J.; Birr, K. Integration of a multilevel transport system model into sustainable urban mobility planning. Sustainability 2018, 10, 479. [Google Scholar] [CrossRef] [Green Version]
- Di Vaio, A.; Boccia, F.; Landriani, L.; Palladino, R. Artificial Intelligence in the Agri-Food System: Rethinking Sustainable Business Models in the COVID-19 Scenario. Sustainability 2020, 12, 4851. [Google Scholar] [CrossRef]
- Molina, J.A.; Giménez-Nadal, J.I.; Velilla, J. Sustainable Commuting: Results from a Social Approach and International Evidence on Carpooling. Sustainability 2020, 12, 9587. [Google Scholar] [CrossRef]
- Song, K.-H.; Choi, S. A Study on the Behavioral Change of Passengers on Sustainable Air Transport after COVID-19. Sustainability 2020, 12, 9207. [Google Scholar]
- Tian, H.; Liu, Y.; Li, Y.; Wu, C.H.; Chen, B.; Kraemer, M.U.; Wang, B. An investigation of transmission control measures during the first 50 days of the COVID-19 epidemic in China. Science 2020, 368, 638–642. [Google Scholar] [CrossRef] [Green Version]
- Sidorchuk, R.; Lukina, A.; Markin, I.; Korobkov, S.; Ivashkova, N.; Mkhitaryan, S.; Skorobogatykh, I. Influence of Passenger Flow at the Station Entrances on Passenger Satisfaction Amid COVID-19. J. Open Innov. Technol. Mark. Complex. 2020, 6, 150. [Google Scholar] [CrossRef]
- Yuan, Z.; Xiao, Z.; Dai, Z.; Huang, J.; Zhang, Z.; Chen, Y. Modelling the effects of Wuhan’s lockdown during COVID-19, China. Bull. World Health Organ. 2020, 98, 484–494. [Google Scholar] [CrossRef] [PubMed]
- Turoń, K.; Kubik, A.; Chen, F.; Wang, H.; Łazarz, B. A Holistic Approach to Electric Shared Mobility Systems Development—Modelling and Optimization Aspects. Energies 2020, 13, 5810. [Google Scholar] [CrossRef]
- Mishin, V.M. Research of Control Systems; Textbook for Universities; Unity-Dana: Moscow, Russia, 2003. [Google Scholar]
- Yu, T.; Shen, G.Q.; Shi, Q.; Lai, X.; Li, C.Z.; Xu, K. Managing social risks at the housing demolition stage of urban redevelopment projects: A stakeholder-oriented study using social network analysis. Int. J. Proj. Manag. 2017, 35, 925–941. [Google Scholar] [CrossRef]
- Hatala, J.P. Social network analysis in human resource development: A new methodology. Hum. Resour. Dev. Rev. 2006, 5, 45–71. [Google Scholar] [CrossRef] [Green Version]
- Caniato, M.; Vaccari, M.; Visvanathan, C.; Zurbrügg, C. Using social network and stakeholder analysis to help evaluate infectious waste management: A step towards a holistic assessment. Waste Manag. 2014, 34, 938–951. [Google Scholar] [CrossRef]
- El-adaway, I. Analyzing Trac Layout Using Dynamic Social Network Analysis; Technical Report; Mississippi State University—National Center for Intermodal Transportation for Economic Competitiveness: Starkville, MS, USA, 2014; pp. 1–39. [Google Scholar]
- Rudikowa, L.; Myslivec, O.; Sobolevsky, S.; Nenko, A.; Savenkov, A. The development of a data collection and analysis system based on social network users’ data. Procedia Comput. Sci. 2019, 156, 194–203. [Google Scholar] [CrossRef]
- Lee, K.; Jung, H. Dynamic semantic network analysis for identifying the concept and scope of social sustainability. J. Clean. Prod. 2019, 233, 1510–1524. [Google Scholar] [CrossRef]
- Yuan, J.; Chen, K.; Li, W.; Ji, C.; Wang, Z.; Skibniewski, M. Social network analysis for social risks of construction projects in high-density urban areas in China. J. Clean. Prod. 2018, 108, 940–961. [Google Scholar] [CrossRef]
- Li, Z.; Sun, Z.; Geng, Y.; Dong, H.; Ren, J.; Liu, Z.; Tian, X.; Yabar, H.; Higano, Y. Examining industrial structure changes and corresponding carbon emission reduction effect by combining input-output analysis and social network analysis: A comparison study of China and Japan. J. Clean. Prod. 2017, 162, 61–70. [Google Scholar] [CrossRef] [Green Version]
- Freeman, L.C. Centrality in social networks conceptual clarification. Soc. Netw. 1979, 1, 215–239. [Google Scholar] [CrossRef] [Green Version]
- Hagen, L.; Neely, S.; Robert-Cooperman, C.; Keller, T.; DePaula, N. Crisis communications in the age of social media: A network analysis of zika-related tweets. Soc. Sci. Comput. Rev. 2018, 36, 523–541. [Google Scholar] [CrossRef]
- Kim, J.; Rasouli, S.; Timmermans, H.J.P. Social networks, social influence and activity-travel behaviour: A review of models and empirical evidence. Transp. Rev. 2017, 38, 499–523. [Google Scholar] [CrossRef] [Green Version]
- Kawa, A. Analiza sieci przedsi˛ebiorstw z wykorzystaniem metody SNA. Przeds. Zarz. 2013, 14, 39–49. [Google Scholar]
- Le Pira, M.; Ignaccolo, M.; Inturri, G.; Pluchino, A.; Rapisarda, A. Modelling stakeholder participation in transport planning. Case Stud. Transp. Policy 2016, 4, 230–238. [Google Scholar] [CrossRef]
- Dörry, S.; Decoville, A. Governance and transportation policy networks in the cross-border metropolitan region of Luxembourg: A social network analysis. Eur. Urban Reg. Stud. 2016, 23, 69–85. [Google Scholar] [CrossRef]
- Le Pira, M.; Marcucci, E.; Gatta, V.; Ignaccolo, M.; Inturri, G.; Pluchino, A. Towards a decision-support procedure to foster stakeholder involvement and acceptability of urban freight transport policies. Eur. Transp. Res. Rev. 2017, 9, 54. [Google Scholar] [CrossRef]
- How Have Shared Mobility Operators Responded to COVID? Available online: https://www.automotiveworld.com/articles/how-have-shared-mobility-operators-responded-to-covid/ (accessed on 19 November 2020).
- Transport Arrangements for the Singapore COVID-19 Circuit Breaker Measures. Available online: https://landtransportguru.net/transport-arrangements-for-the-singapore-covid-19-circuit-breaker-measures/ (accessed on 13 May 2020).
- Paris To Create 650 Kilometers of Post-Lockdown Cycleways, Forbs. Available online: https://www.forbes.com/sites/carltonreid/2020/04/22/paris-to-create-650-kilometers-of-pop-up-corona-cycleways-for-post-lockdown-travel/#1796664854d4 (accessed on 7 May 2020).
- NYC to Close 40 Miles of Streets to Give Walkers More Space. Bloomberg. Available online: https://www.bloomberg.com/news/articles/2020-04-27/nyc-to-hire-1-000-people-to-trace-contacts-of-covid-19-positive (accessed on 7 May 2020).
- COVID-19 Transportation Experiences. Available online: https://www.transformative-mobility.org/news/combating-covid-19-the-shenzhen-bus-groups-experience (accessed on 10 May 2020).
- Chinese Transport after COVID-19. The Paper China. Available online: https://www.thepaper.cn/newsDetail_forward_5914134 (accessed on 9 May 2020).
- Campisi, T.; Basbas, S.; Skoufas, A.; Akgün, N.; Ticali, D.; Tesoriere, G. The Impact of COVID-19 Pandemic on the Resilience of Sustainable Mobility in Sicily. Sustainability 2020, 12, 8829. [Google Scholar] [CrossRef]
- Bucsky, P. Modal share changes due to COVID-19: The case of Budapest. Transp. Res. Interdiscip. Perspect. 2020, 8, 100141. [Google Scholar] [CrossRef]
- Nikiforiadis, A.; Ayfantopoulou, G.; Stamelou, A. Assessing the Impact of COVID-19 on Bike-Sharing Usage: The Case of Thessaloniki, Greece. Sustainability 2020, 12, 8215. [Google Scholar] [CrossRef]
- Chapman, A.; Tsuji, T. Impacts of COVID-19 on a Transitioning Energy System, Society, and International Cooperation. Sustainability 2020, 12, 8232. [Google Scholar] [CrossRef]
- Mokter, H. The effect of the Covid-19 on sharing economy activities. J. Clean. Prod. 2020, 280, 124782. [Google Scholar]
- Love, P.; Ika, L.; Matthews, J.; Fang, W. Shared leadership, value and risks in large scale transport projects: Re-calibrating procurement policy for post COVID-19. Res. Transp. Econ. 2020, 100999. [Google Scholar] [CrossRef]
- Seetharaman, P. Business models shifts: Impact of Covid-19. Int. J. Inf. Manag. 2020, 54, 102173. [Google Scholar] [CrossRef] [PubMed]
Figure 1.
The structure of stakeholder-associated aspects, where P1–P19 are analyzed aspects (see Table 3); “O” denotes electric shared mobility operators, “G” denotes decision-makers, and “U” denotes e-shared mobility users.
Figure 1.
The structure of stakeholder-associated aspects, where P1–P19 are analyzed aspects (see Table 3); “O” denotes electric shared mobility operators, “G” denotes decision-makers, and “U” denotes e-shared mobility users.

Figure 2.
The new network for the four main areas, where O/U/G-P1–P19 are analyzed aspects (see Table 5); “O” denotes electric shared mobility operators, “G” denotes decision-makers, and “U” denotes e-shared mobility users.
Figure 2.
The new network for the four main areas, where O/U/G-P1–P19 are analyzed aspects (see Table 5); “O” denotes electric shared mobility operators, “G” denotes decision-makers, and “U” denotes e-shared mobility users.

Figure 3.
The number of output degrees for the area.


Table 1.
Factors for modeling and optimizing electric shared mobility systems.
| System Type | Aspects | Literature |
|---|---|---|
| Electric bike-sharing system | Basic costs of electric bike-sharing systems (operational, infrastructure) | [9,10] |
| Electric bike parameters (cost of purchase, safety, range) | [9,11] | |
| Location of the station (bike, docking) | [11,13] | |
| Weather conditions | [5] | |
| Electric scooter and moped-sharing system | Basic costs of electric scooter- and moped-sharing systems (operational, infrastructure) | [15,16] |
| Weather conditions | [5] | |
| Electric bike parameters (cost of purchase, safety, range, battery capacity) | [18,19] | |
| Charging and docking station (location, policy, battery charging speed) | [19] | |
| Weather conditions | [5] | |
| Electric car-sharing systems | Basic costs of electric car-sharing systems (operational, infrastructure) | [6,12] |
| Electric bike parameters (cost of purchase, fleet size, safety, range, battery capacity) | [14,20,21] | |
| Charging and parking locations (location, policy, battery charging speed) | [22,23,24,25,26,27,28,29,30] | |
| Models of systems (rental rules, vehicle relocation time) | [29,30] |
Table 2.
Aspects (problems) that affect electric shared mobility.
| Aspects Abb. | Aspect Characteristics |
|---|---|
| P1 | Vehicles in the system operation zone (designation of the system operation area, vehicle fleet size) |
| P2 | Application for system users: availability and possible functions offered to the user |
| P3 | New user data verification process (through traditional customer service and through the application) |
| P4 | Rules for renting vehicles: types of payments for trips made (i.e., subscription, payment after each trip, non-cash payments via the application) |
| P5 | Laws and regulations on the movement of individual types of vehicles available under the shared mobility system |
| P6 | Parking spaces: location, number of dedicated spaces for the electric shared mobility system, possible fees |
| P7 | Technical condition of the fleet (indicators describing the vehicle’s reliability, the process of its wear) |
| P8 | Security and monitoring of vehicles (the type of antitheft security measures used, vehicle monitoring via GPS, vehicle equipment with recorders that enable video and sound recording) |
| P9 | User safety: the safety level of vehicles offered in the system (i.e., according to European New Car Assessment Program (NCAP)), maintenance of the vehicle’s appropriate technical condition by the service operator, eco-driving bonuses |
| P10 | Infrastructure for electric vehicles: number of chargers, number of possible simultaneous vehicles charging via the charger, number of parking spaces under the charger |
| P11 | User data security: user data security, payment data security, mobile application use security |
| P12 | Weather conditions: variability in weather conditions, the possible occurrence of weather anomalies |
| P13 | Cost of use: available subscriptions, account activation, prepayment, available discounts, possible fines (e.g., for traffic offenses), payment method |
| P14 | Maintaining the system’s profitability: relocation of vehicles, number of employees, required education, employee qualifications |
| P15 | Operators: cooperation with a local government entity |
| P16 | Privileges for operators: possible reductions in local taxes and the elimination of some or all local government fees |
| P17 | Integration of electric shared mobility systems with currently available city systems, creation of a unified system (a mobile application for all available services) |
| P18 | Technical safety of vehicles: monitoring drivers’ driving and the control of trips made |
| P19 | Basic data on system operation: the area of system operation, number of available vehicle types, number of possible operation zones for the system |
Source: [43].
Table 3.
Electric shared mobility aspects during the COVID-19 pandemic.
| Aspects | COVID-19 Influence |
|---|---|
| P1. Location of vehicles | ✓ |
| P2. Mobile apps | - |
| P3. Registration process | ✓ |
| P4. Rental process | ✓ |
| P5. Legal requirements | ✓ |
| P6. Location of parking spaces | ✓ |
| P7. Fleet condition | ✓ |
| P8. Security of vehicles | - |
| P9. Safety of users | ✓ |
| P10. Infrastructure | - |
| P11. User security | - |
| P12. Weather | - |
| P13. Prices | ✓ |
| P14. Vehicle replacements | ✓ |
| P15. Privileges for operators | ✓ |
| P16. Surcharges for operators | ✓ |
| P17. Urban traffic accessibility | - |
| P18. Serviceability safety | ✓ |
| P19. Rental area | ✓ |
Table 4.
The list of business practices introduced during the COVID-19 pandemic by electric shared mobility operators.
Table 4.
The list of business practices introduced during the COVID-19 pandemic by electric shared mobility operators.
| System Type | Practice Description | Aspects |
|---|---|---|
| Electric bike-sharing systems | Offered free memberships to essential workers | 13, 15 |
| Replaced docking stations near hospitals | 14, 15, 19 | |
| Implemented antibacterial handlebars and provided additional disinfection of bicycles | 7, 9 | |
| Electric scooter and moped sharing | Offered long-term rentals, for example, daily | 13 |
| Offered new locations where the vehicle can be returned | 14, 19 | |
| Implemented antibacterial grips and handlebars in vehicles, provided additional disinfection of vehicles | 7, 9 | |
| Introduced additional disinfection in the form of vehicle cleaning, ozonation, and foil coating on the steering wheel or seats | 7, 9 | |
| Electric car-sharing systems | Increased the number of cars | 1 |
| Launched services in new cities | 19 | |
| Offered long-term rentals, for example, weekly or monthly, for up to 3 months | 13 | |
| Offered the choice of kilometer or minute-kilometer systems | 13 | |
| Strengthened cooperation with business-to-business partners | 13 |
Table 5.
Electric shared mobility influencing factors (problems) with corresponding stakeholders and areas.
Table 5.
Electric shared mobility influencing factors (problems) with corresponding stakeholders and areas.
| Stakeholder Node-Aspect Number | Area Number |
|---|---|
| U-P1 | A3 |
| U-P3 | A3 |
| U-P4 | A3 |
| O-P5 | A4 |
| U-P5 | A4 |
| G-P5 | A4 |
| O-P6 | A4 |
| U-P6 | A4 |
| G-P6 | A4 |
| O-P7 | A1 |
| U-P7 | A1 |
| O-P7 | A2 |
| U-P7 | A2 |
| O-P7 | A3 |
| U-P7 | A3 |
| U-P9 | A4 |
| O-P13 | A1 |
| U-P13 | A1 |
| G-P13 | A1 |
| O-P13 | A3 |
| U-P13 | A3 |
| G-P13 | A3 |
| O-P14 | A3 |
| U-P14 | A3 |
| G-P14 | A3 |
| O-P15 | A4 |
| O-P16 | A4 |
| G-P16 | A4 |
| O-P18 | A3 |
| U-P16 | A3 |
| U-P19 | A1 |
| U-P19 | A2 |
Table 6.
The number of output connections with related aspects.
| Aspects | The Number of Output Connections |
|---|---|
| “P1” | 1 |
| “P3” | 1 |
| “P4” | 1 |
| “P5” | 3 |
| “P6” | 3 |
| “P7” | 6 |
| “P9” | 1 |
| “P13” | 6 |
| “P14” | 3 |
| “P15” | 1 |
| “P16” | 2 |
| “P18” | 2 |
| “P19” | 4 |
Table 7.
The average node distances between aspects.
| Aspects | Average Node Distances |
|---|---|
| 1 | 0.172 |
| 3 | 0.172 |
| 4 | 0.172 |
| 5 | 0.376 |
| 6 | 0.376 |
| 7 | 0.686 |
| 9 | 0.172 |
| 13 | 0.970 |
| 14 | 0.515 |
| 15 | 0.125 |
| 16 | 0.250 |
| 18 | 0.343 |
| 19 | 0.436 |
Publisher’s Note: MDPI stays neutral with regard to jurisdictional claims in published maps and institutional affiliations. |
© 2021 by the authors. Licensee MDPI, Basel, Switzerland. This article is an open access article distributed under the terms and conditions of the Creative Commons Attribution (CC BY) license (https://creativecommons.org/licenses/by/4.0/).
Share and Cite
MDPI and ACS Style
Turoń, K.; Kubik, A.; Chen, F. Electric Shared Mobility Services during the Pandemic: Modeling Aspects of Transportation. Energies 2021, 14, 2622. https://doi.org/10.3390/en14092622
AMA Style
Turoń K, Kubik A, Chen F. Electric Shared Mobility Services during the Pandemic: Modeling Aspects of Transportation. Energies. 2021; 14(9):2622. https://doi.org/10.3390/en14092622
Chicago/Turabian StyleTuroń, Katarzyna, Andrzej Kubik, and Feng Chen. 2021. "Electric Shared Mobility Services during the Pandemic: Modeling Aspects of Transportation" Energies 14, no. 9: 2622. https://doi.org/10.3390/en14092622
Note that from the first issue of 2016, this journal uses article numbers instead of page numbers. See further details here.