 Haonan Li1,2
 Hui Zhang1,2*
- 1School of Medical Business, Guangdong Pharmaceutical University, Guangzhou, Guangdong, China
- 2Guangdong Health Economics and Health Promotion Research Center, Guangzhou, Guangdong, China
This study aims to optimize the COVID-19 screening strategies under China's dynamic zero-case policy through cost-effectiveness analysis. A total of 9 screening strategies with different screening frequencies and combinations of detection methods were designed. A stochastic agent-based model was used to simulate the progress of the COVID-19 outbreak in scenario I (close contacts were promptly quarantined) and scenario II (close contacts were not promptly quarantined). The primary outcomes included the number of infections, number of close contacts, number of deaths, the duration of the epidemic, and duration of movement restriction. Net monetary benefit (NMB) and the incremental cost-benefit ratio were used to compare the cost-effectiveness of different screening strategies. The results indicated that under China's COVID-19 dynamic zero-case policy, high-frequency screening can help contain the spread of the epidemic, reduce the size and burden of the epidemic, and is cost-effective. Mass antigen testing is not cost-effective compared with mass nucleic acid testing in the same screening frequency. It would be more cost-effective to use AT as a supplemental screening tool when NAT capacity is insufficient or when outbreaks are spreading very rapidly.
1. Introduction
Coronavirus disease 2019 (COVID-19), is an infectious disease that causes fever, cough, shortness of breath, pneumonia, and lung infections. The pandemic poses a threat to the security of all humanity and has a huge negative effect on the economy, stability, and culture of countries around the world. A previous study estimated that the first wave of COVID-19 in China resulted in 2647 billion RMB losses (1). At present, China has effectively prevented large-scale outbreaks through the implementation of the strategy of “external prevention of importation and internal prevention of rebound” and the policy of “dynamic zero-case policy”(2). However, global COVID-19 is still in a pandemic state, Omicron is still sweeping across the world, and the sporadic cases and localized outbreaks in China are a reminder that the risk of large-scale outbreaks remains.
Dynamic Zero-Case Policy is to contain domestic virus flare-ups through timely actions. Once a localized outbreak has occurred, rapid and accurate epidemiological investigations are carried out to identify the source of infection, which is then combined with regional mass screening, contact tracing, quarantine, isolation, and movement restriction to break the chain of transmission and contain the spread of the outbreak (Figure 1).
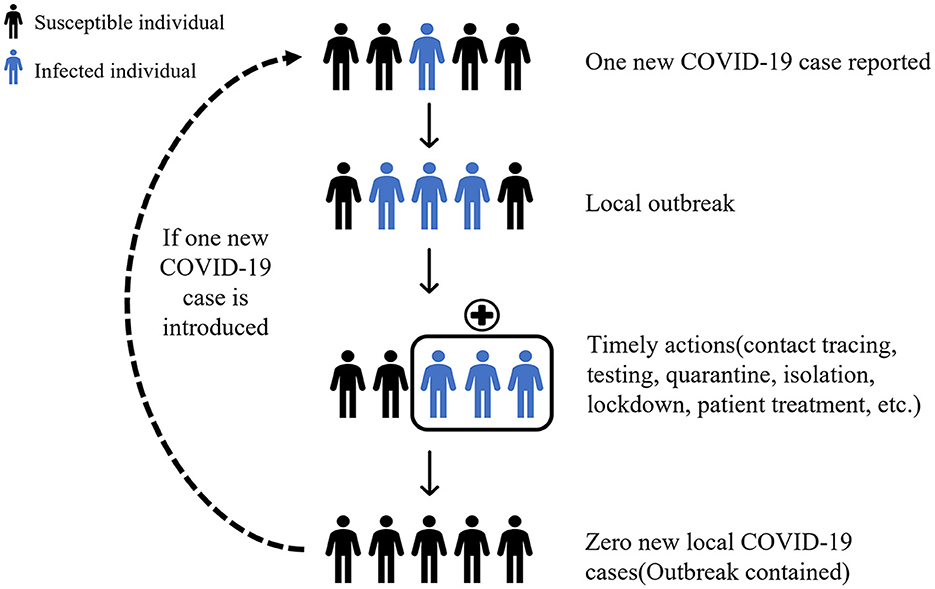
Figure 1. Schematic of dynamic zero-case policy.
Mass screening helps to detect asymptomatic infections promptly and reduces community transmission (3). In addition, it can help decision-makers make more scientific judgments about ongoing community transmission and flexibly adjust prevention and control measures accordingly. Due to the different epidemiological situations and prevention and control policies, there is currently no standardized screening strategy for COVID-19 that fits all countries. Moreover, the cost-effectiveness of different COVID-19 screening strategies under China's dynamic zero-case policy has not been fully explored and demonstrated. Therefore, this study aimed to assess the cost-effectiveness of different screening strategies for COVID-19 in different scenarios to optimize screening strategies and reduce losses from localized outbreaks.
2. Methods
2.1. Comparator strategies
The most commonly used testing methods for COVID-19 are nucleic acid testing (NAT) and antigen testing (AT) in China. Based on the latest COVID-19 disease prevention and control guidelines (2), nine competing strategies consisting of different screening frequencies and testing methods were designed and compared in this study (Table 1). Considering the enormous challenges posed by the highly infectious Omicron variant for outbreak control, and to better simulate the real situation and more comprehensively assess different screening strategies, two scenarios were set for this study: (1) Scenario I: the outbreak spreads slowly, epidemiological investigations were carried out accurately, and close contacts can be traced and isolated promptly; (2) Scenario II: the outbreak develops rapidly, the transmission chain was difficult to sort out, and a proportion of close contacts cannot be traced and isolated promptly.
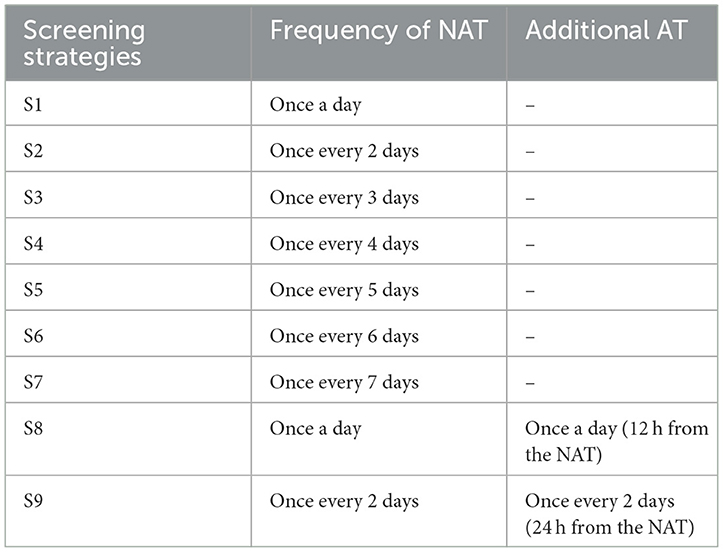
Table 1. COVID-19 community screening strategies.
2.2. Population and time Horizon
Community-based grid governance can be effective in helping to reduce or even stop outbreaks (4), hence the target population for this study was all community residents in China. All imported cases from abroad were excluded. The time horizon of the study was a localized outbreak, starting with the introduction of one infected case and ending with no un-isolated infected cases in the community.
2.3. Model
2.3.1. Model summary
Mathematical models based on the SEIR framework have proven to be excellent tools for simulating and predicting the spread of infectious diseases and for evaluating prevention and control measures (5–7). However, these models do not capture individual differences, individual-to-individual, and individual-to-group effects, and are not flexible enough to fully assess different prevention and control measures. To address the above shortcomings, a stochastic agent-based model (ABM) was used to simulate the COVID-19 outbreak in this study. ABM is a method of simulating the behavior and interactions of autonomous agents in a particular environment across time steps (8). NetLogo software (Wilensky, Northwestern University) was used for modeling and running.
2.3.2. Model description
Agents are generated at random coordinates and move randomly within a virtual community. Initially, all agents are at the state of susceptible (S) except for a preset latent (L) infection. Latent infections become infectious and detectable after progressing to pre-symptomatic (P). Pre-symptomatic agent progress to asymptomatic infection (Ia) or symptomatic infection (Is) in a proportion. Symptomatic infections will be hospitalized (H) as confirmed cases after routine testing. When the number of confirmed cases is >0, regional mass screening and close contact tracking procedures will be initiated. Close contacts will be quarantined (Q) after being tracked. Asymptomatic infections are still infecting other agents unless they are hospitalized after diagnosing by mass screening or recovered (R) after self-healing. When the number of confirmed cases is >50, a community lockdown procedure will be initiated, all agents are not allowed to move or contact other agents. Hospitalized agents will progress to recovered or deceased (D). When there are no unquarantined infected persons in the community means that the outbreak is contained, all intervention procedures such as community lockdown will be stopped and the simulation will be aborted (Figure 2).
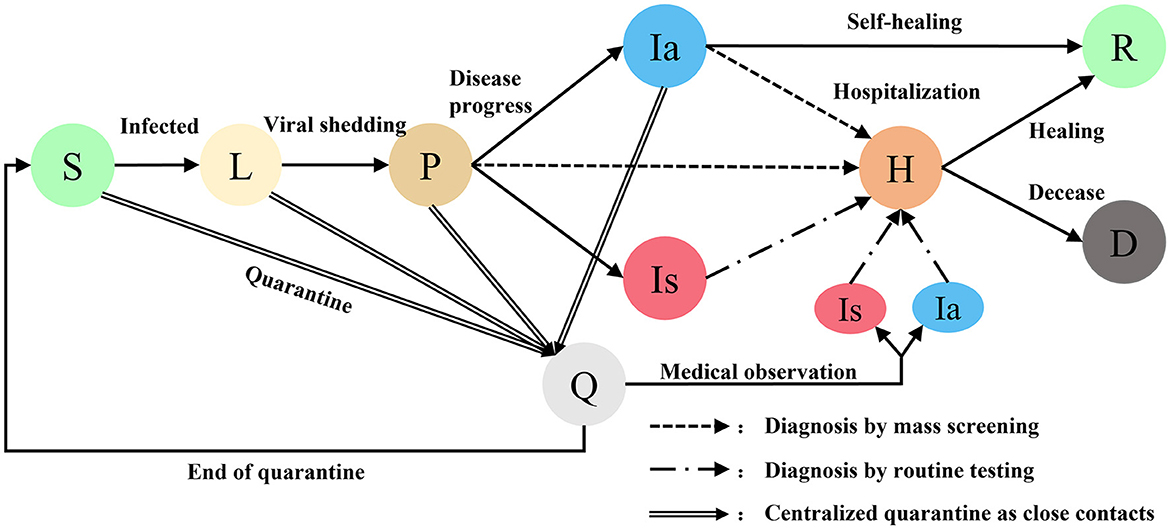
Figure 2. Different states of agents in COVID-19 transmission model. Susceptible S, Latent L, Pre-symptomatic P, Quarantined Q, Asymptomatic Ia, Symptomatic Is, Hospitalized H, Recovered R, Deceased D.
2.3.3. Model parameters
Model parameters were mainly derived from previous studies, expert opinions, and fieldwork (Table 2). Population size was set to 6,000, which is approximately equal to the population of a small-scale community in China. Infectious capability of infections was based on the probability of infection in close contacts in previous studies (22) and adjusted for the basic regeneration number measured in this model. The time required for nucleic acid testing, including sampling, transfer, and laboratory testing, was based on expert opinion (9). Maximum mobility of agents and sizes of simulation space were adjusted for population density reasonably. Baseline values for epidemiological parameters were mainly taken from studies related to Omicron, as it is now the main prevalent strain worldwide (13–16, 18). In scenario I, maximum time needed for tracking close contacts was set to 72 h, and quarantined probability of close contact was set to 100%. In scenario II, these two values were set to 120 h and 75%.
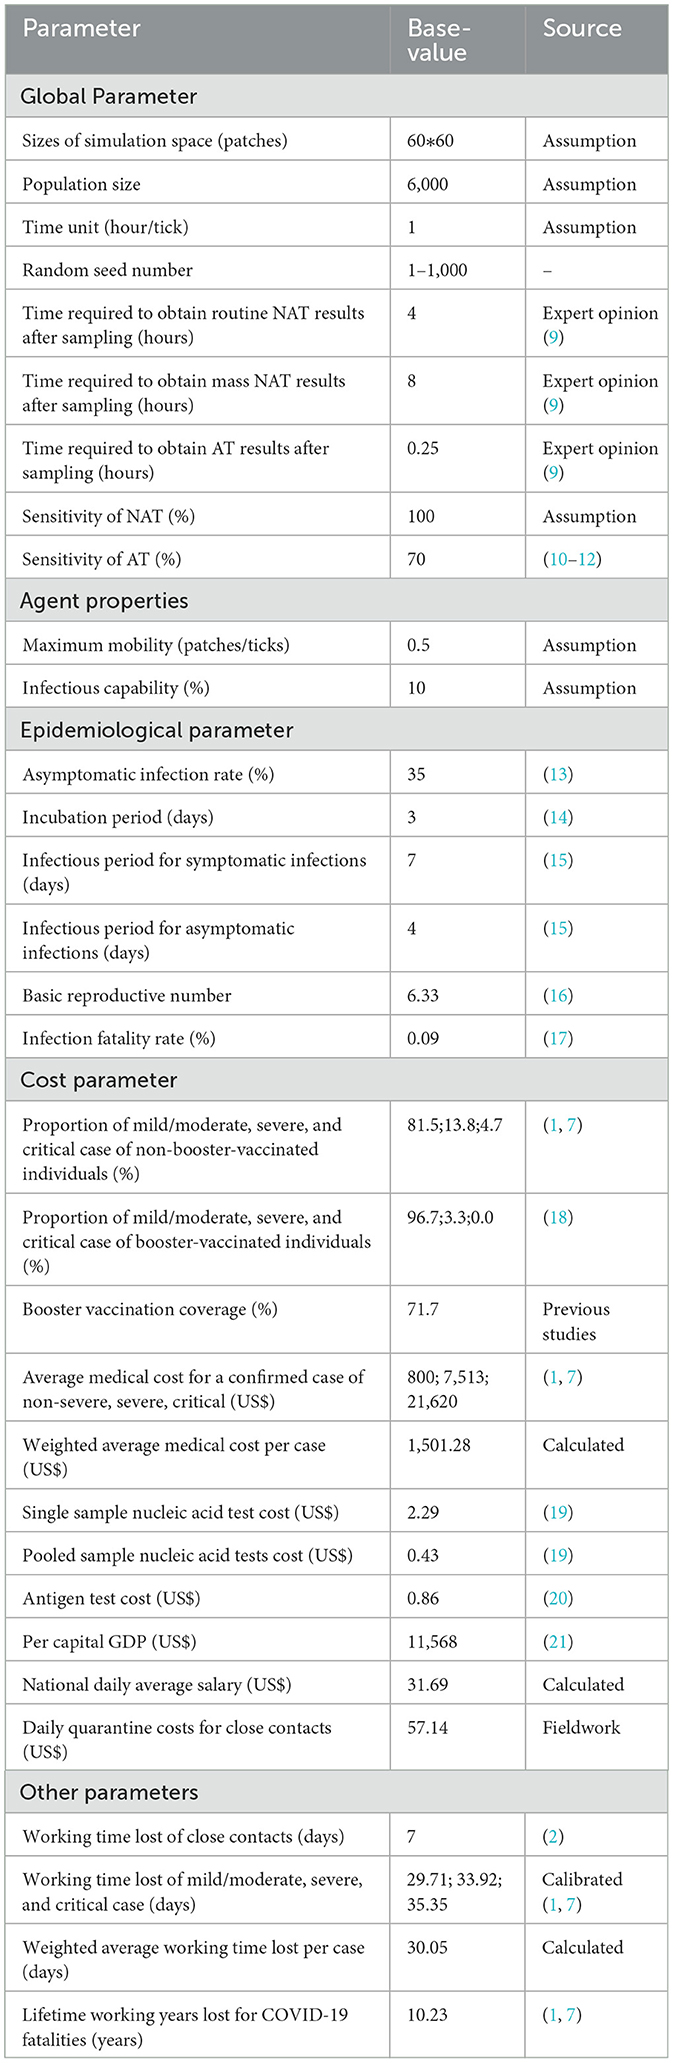
Table 2. Value and source of model parameters.
Considering the huge impact of COVID-19 on productivity, societal perspective was adopted in this study. Both direct and indirect costs are included in the cost measurement. Indirect costs are calculated using the human capital approach (23). Cost parameters came from two studies of the disease burden of the first wave of COVID-19 in China (1, 7), and were calibrated according to the latest data and prevention and control policies (2). For example, the “14 + 14” quarantine policy was replaced by “7 + 3”. The centralized quarantine period for close contacts was shortened to 7 days, followed by 3 days of health monitoring, during which they could go to work with proper personal protective measures. Thus, working time lost of close contacts was calibrated to 7 days. The average medical costs and average work time lost per case were weighted by booster vaccination coverage and the proportion of clinical types. Due to the short time horizon of the study, costs were not discounted. All costs are converted to U.S. dollars (USD) at the exchange rate (1 USD = 7 RMB).
2.3.4. Key assumptions
Limited by the accessibility of some data and for the sake of model streamlining, the key assumptions of this study are mainly as follows:
(1) All infectious individuals have the same infectious capacity, and the infectious capacity does not change over time.
(2) Patients assumed to be non-infectious and not at risk of a second infection.
(3) Infections cannot infect other individuals during isolation.
(4) Individuals receive a NAT on days 1, 2, 3, 5, and 7 during quarantine according to China's COVID-19 disease prevention and control guidance.
(5) The time required for NAT or AT is ignored.
(6) Confirmed cases will be promptly isolated and treated.
(7) Deaths not due to COVID-19 infection (Background mortality) were not simulated.
2.4. Cost-effectiveness analysis
The outcome indicators of the outbreak simulation in this study were mainly the cumulative number of infections, close contacts, quarantined persons, deaths, duration of the outbreak, and length of community lockdown. The economic evaluation indicators for competing strategies were screening cost, total cost, and net monetary benefit (NMB). Based on the outcome indicators, the total cost calculation formula in the formula are as follows:
Costi is the weighted average cost per case and contains both direct and indirect costs. Direct costs were based on costs of cases of different disease severities obtained from previous studies, weighted first by booster vaccination coverage and then by the proportion of cases of different disease severities with or without booster vaccination. After weighting in the same way to obtain the weighted average working time lost per case, the indirect costs were obtained by multiplying by the national daily average salary. AI is accumulative infections. Costcc is the total cost of each close contact including direct and indirect costs. Direct costs include staff allowances, accommodation for quarantine, meals, and NAT, were obtained from fieldwork. Indirect costs were derived by multiplying the number of days of quarantine by the national daily average salary. ACC is accumulative close contacts. Costd is the total cost per death, obtained by multiplying lifetime working years lost for COVID-19 fatalities obtained from previous studies by per capital GDP, and only the labor loss due to death is considered here.AD is accumulative deaths. Costat is the cost per sample for AT. TAT is the total number of antigen tests. Costpnat is the cost per pooled sample NAT. TPNAT is the total number of pooled sample NATs. Costsnat is the cost per single sample NAT. TSNAT is the total number of single sample NATs. Costcl is the cost of community lockdown per day. Due to the short time horizon of this study, only the labor loss due to the community lockdown is considered here. Its calculation formula is as follows:
Where n is the total number of agents who have not been quarantined, hospitalized, or died at the end of the simulation. NDAS is national daily average salary per person. LCL is the length of community lockdown. The detailed cost parameters are shown in Table 2.
To reflect the uncertainty of the outbreak and to reduce randomness, 1,000 simulations were performed for each competing strategy in each scenario. The mean and standard deviation of outcome indicators were reported. A one-way sensitivity analysis was performed to test the robustness of the results and to analyze the impact of variations in parameter values.
3. Results
3.1. Simulation results
In Scenario I, the duration of the outbreak, accumulative infections, accumulative close contacts, and the length of the community lockdown trended flatly upward as the frequency of community screening decreased (Figure 3). This upward trend is more evident in scenario II, where the accumulative infections increased from 18.32 to 97.20, accumulative close contacts increased from 378.79 to 1558.75, the duration of the outbreak increased from 156.36 to 336.54 h, and the length of community lockdown increased from 3.37 to 121.38 h. Due to the low infection fatality rate and the small population size simulated, there were no deaths under all screening strategies (Table 3).
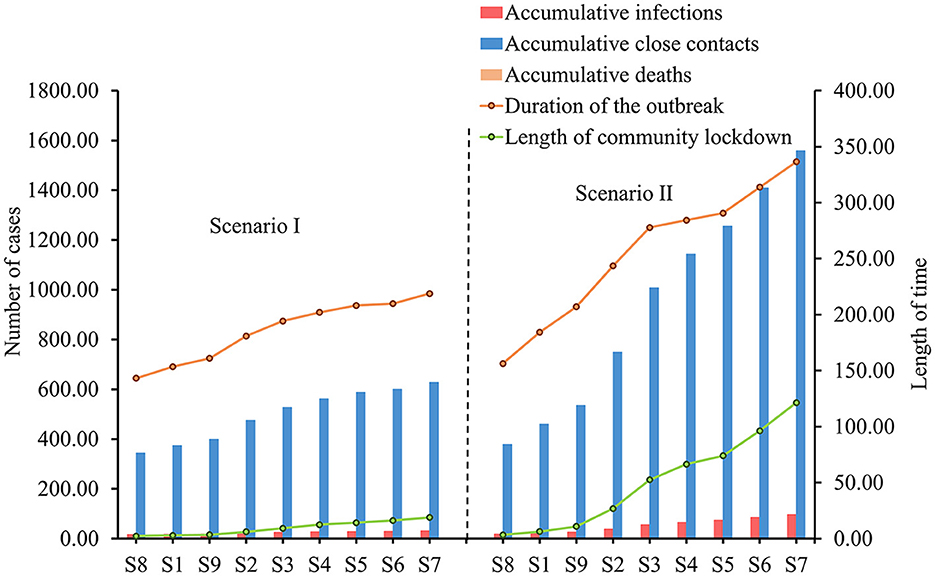
Figure 3. Simulation results of COVID-19 transmission under different strategies in two scenarios.
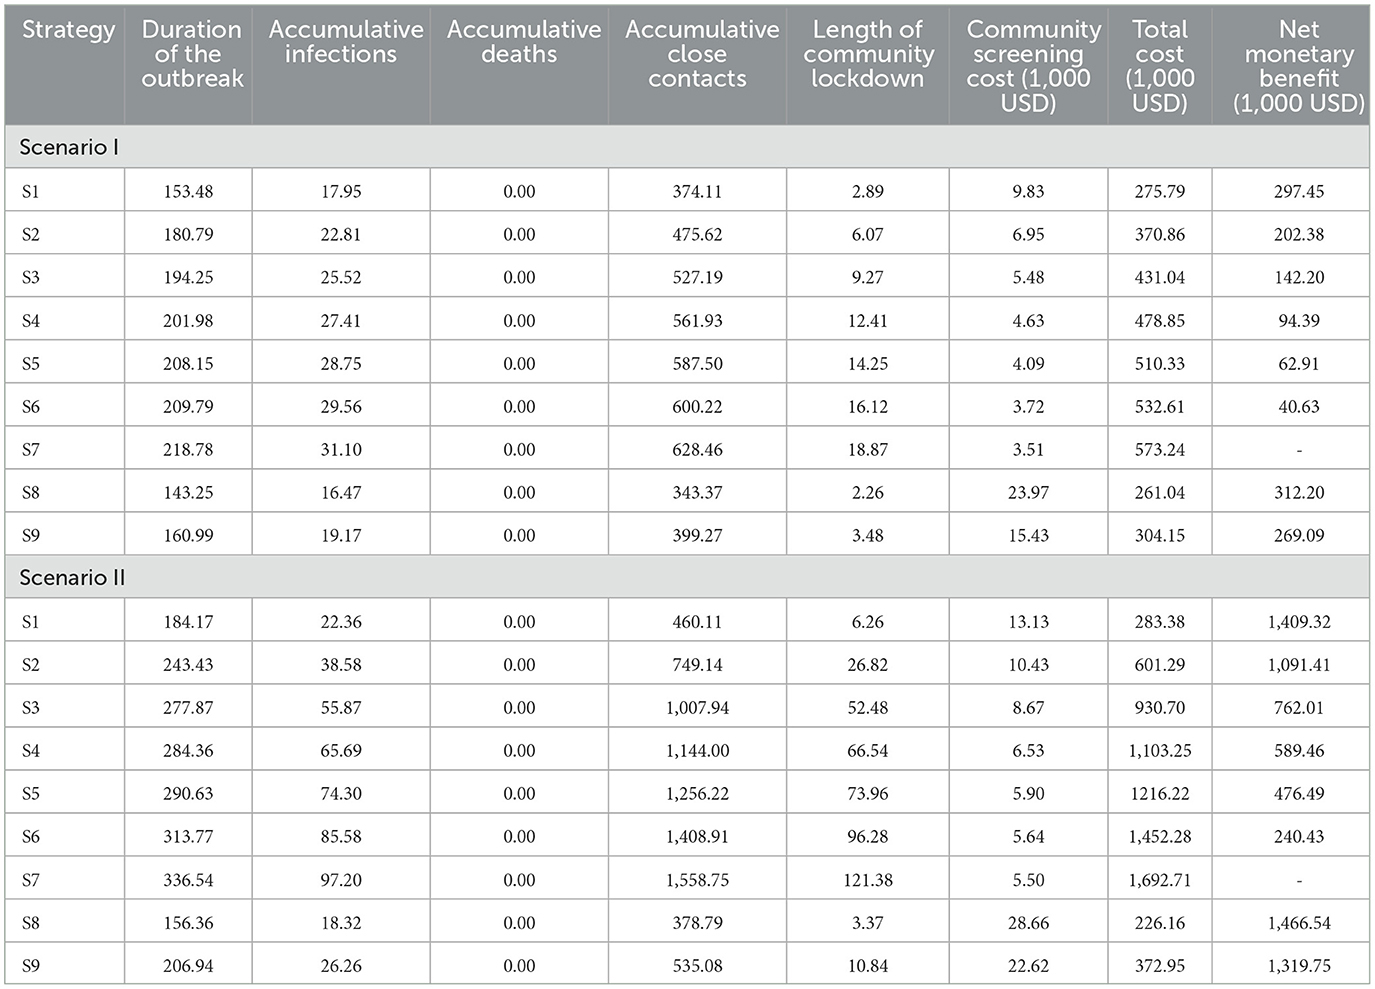
Table 3. COVID-19 transmission and cost effectiveness of different strategies.
3.2. Cost-effectiveness results
In both scenarios, as the frequency of community screening increased, the cost of screening increased, but the total cost decreased, and this downward trend was more evident in scenario II (Figure 4). In both scenarios, S8 had the highest community screening cost but the lowest total cost, and S7 had the lowest community screening cost but the highest total cost. Compared to S7, S8 avoided a total economic loss of $312,204 in Scenario I and $1,466,543 in Scenario II. Although the screening frequency was the same for S1 and S9, S9 had a higher screening cost and a higher total cost in both scenarios. In addition, the total cost of S9 is lower compared to S2, which has a lower frequency of screening (Table 3).
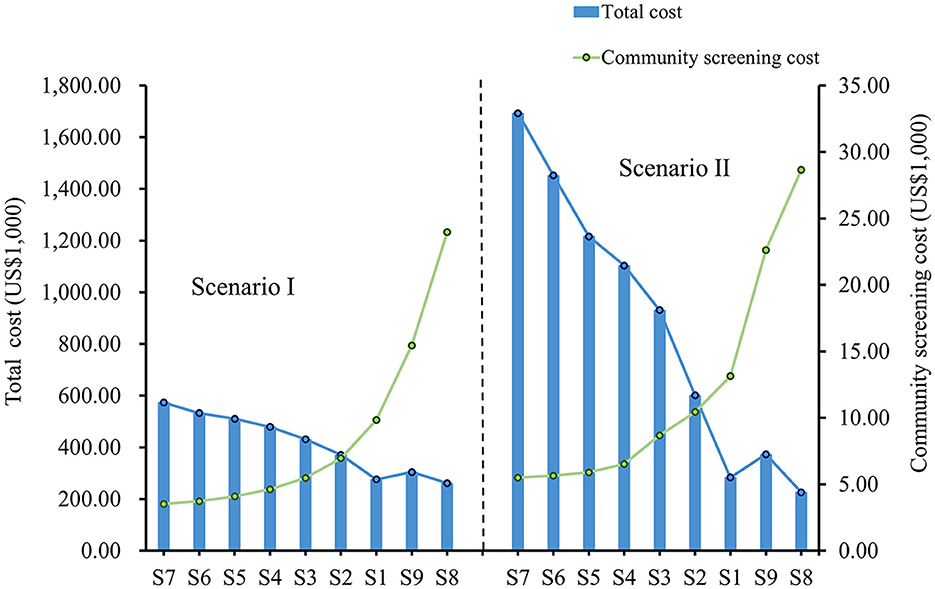
Figure 4. Total cost and community screening cost under different strategies in two scenarios.
3.3. Sensitivity analysis
Detailed results of the sensitivity analyses are provided in Supplementary Tables 4, 5. Sensitivity analysis indicated that the base-case analysis was robust. The dominant strategy remained S8 when parameters were varied within the range. In both scenarios, the top 3 parameters that have the greatest impact on the total cost of S8 were basic reproductive number, national daily average salary and asymptomatic infection rate (Figure 5). Considering that S1 is the commonly used strategy in China during that period, we also provide the results of its one-way sensitivity analysis in Supplementary Tables 6, 7.
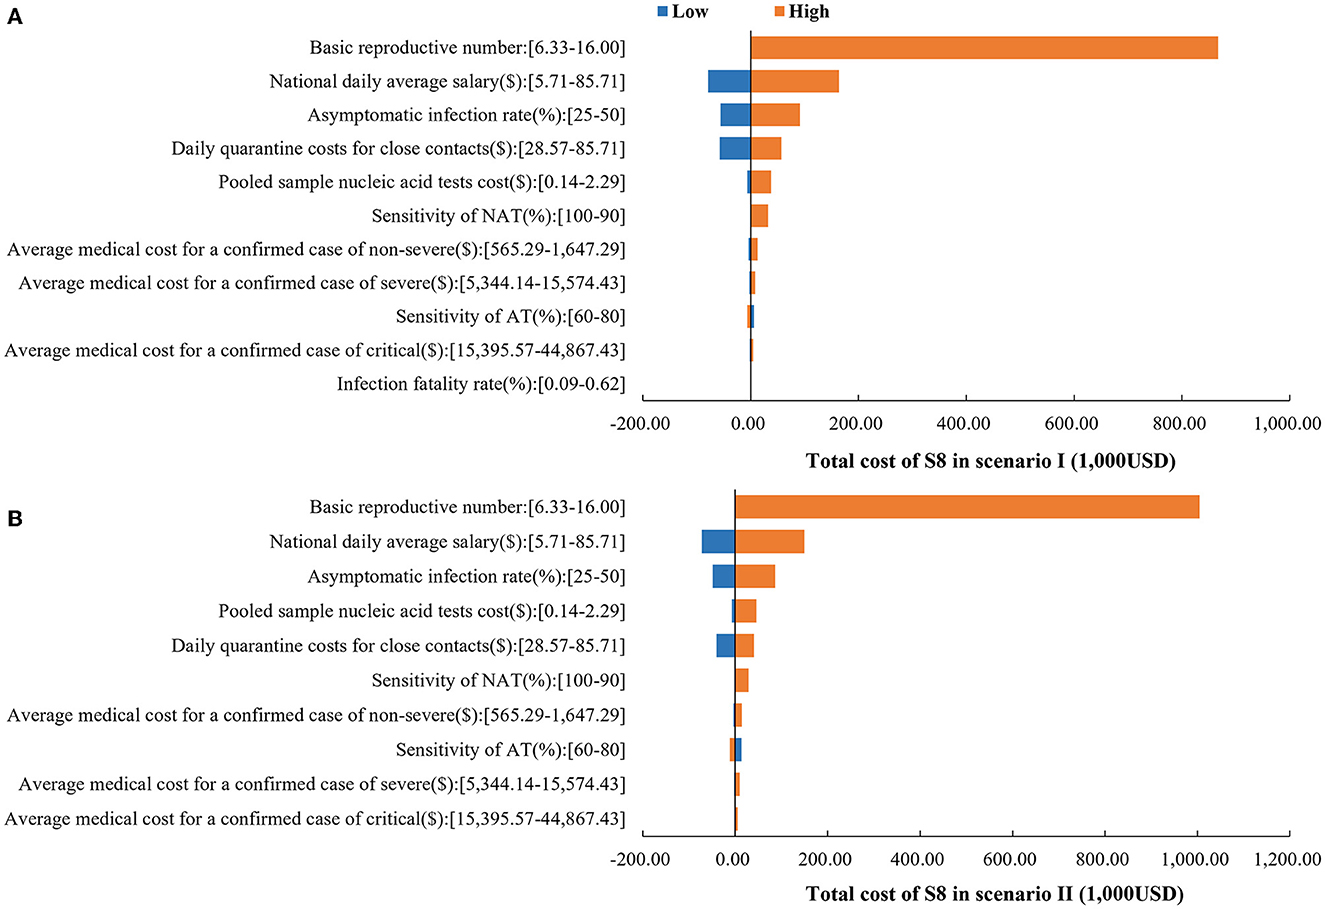
Figure 5. One-way sensitivity analysis results. (A) Impact of parameters on the total cost of S8 in scenario I. (B) Impact of parameters on the total cost of S8 in scenario II.
4. Discussion
This study evaluated different COVID-19 screening strategies under the current “dynamic zero-case policy” in China. The results showed that all indicators of outbreak size tended to decrease as the frequency of screening increased. This indicated that high frequency of screening could help contain the spread of the outbreak and reduce the size and burden of the outbreak, and this effect was more obvious in the case of a rapidly developing outbreak (Scenario II), which is consistent with the findings of previous studies (24–26). The most cost-effective screening strategy was daily NAT and an additional AT (S8). This suggested that such a high-frequency screening strategy is still cost-effective given the high transmissibility of the Omicron variant and the low cost of screening in China.
Meanwhile, the comparison of S1 with S9 revealed that mass AT is not cost-effective compared with mass NAT for the same screening frequency. This is probably because although AT has the advantage of convenience and speed, its sensitivity is lower compared to NAT, which may lead to missed and false detections, resulting in sequential transmission of outbreaks and increasing the total cost. Therefore, with the current low sensitivity of AT, it cannot completely replace NAT in community screening. However, additional AT in S9 would result in lower total costs compared to S2, which has a lower frequency of screening. The above suggested that using AT as a complementary screening tool would be more cost-effective in situations where NAT capacity is insufficient or the outbreak is spreading very rapidly.
It is worth noting that when an outbreak occurs, screening alone cannot block the spread of the outbreak. In this study, it was found during model simulation that if preventive and control measures such as close contact tracing and quarantine and restriction of population movement were removed, it would lead to all individual infections. Thus, the significance of mass screening is the timely detection of cases, and its cost-effectiveness is predicated on the combination of other prevention and control measures. This is also in line with previous studies (27–29).
Sensitivity analysis showed that among the cost parameters, the results were more sensitive to the national daily average salary. With the current low rate of severe illness and mortality, the economic burden of COVID-19 is mainly attributed to the loss of productivity. As found in other studies, productivity loss accounted for 99.8% of the total cost in the first wave of COVID-19 outbreak in China. Therefore, further research is needed on how to continuously optimize prevention and control measures, reduce the impact of the epidemic on productivity, and integrate epidemic prevention and control with economic development.
There are several limitations of this study. First, due to the short time horizon of this study, the health and cost impacts of long-COVID were not taken into account. Second, the simulated population size is relatively small, so the extrapolation of the model may be affected. Third, due to the lack of data, age, gender, and behavioral differences may lead to bias between the model and the real world. Fourth, a human capital approach was adopted in the measurement of indirect costs. And since some workers can choose to work from home, the indirect costs may be overestimated. Finally, the transmission capacity of infected individuals may vary with viral load, which was not taken into consideration in this study due to model streamlining.
Since the outbreak of COVID-19, China has been adjusting and optimizing its prevention and control strategy accordingly to the evolving situation. In January 2023, China's management of COVID was downgraded to the less strict class B from the current top-level class A, as the disease has become less virulent. From then on, China has entered a new phase in coordinating economic and social development and epidemic prevention and control.
Through a brief review we found that during the period when China adopted a “dynamic zero-case” strategy, although some cities strictly implemented the “dynamic zero-case” policy, there were cases where the size of the outbreak was larger than the simulated results of this study. The reasons for this phenomenon may be as follows: First, considering that epidemic control in China is community-based and the fact that too many samples may lead to excessively long model runs, this study is based on a simulation of 6,000 individuals in a single community in China, not on an entire city or an entire province. In the real world, provinces consist of many cities, and cities consist of many communities and individuals, and the increased sample size may result in a larger real-world epidemic size than in this study. The population density and geographic characteristics of different cities in the real world may also affect the spread of the epidemic. Second, in reality, although there have been large epidemics, there have also been many successful cases of “dynamic zero”. For example, the city of Shenzhen, with a population of 17.6 million and a highly mobile population, has implemented the “dynamic zero” policy well on more than one occasion, controlling the epidemic in a short period and keeping the prevalence rate at a low level. Third, some of the interventions in this model, such as close contact tracing and isolation, mass screening, and movement restrictions, are implemented according to set model parameter values. In contrast, in the real world, the effectiveness of interventions may be influenced by more factors such as affordability, civil compliance, country conditions, and government capacity, which may lead to higher data on the size of outbreaks in the real world than in this study. In light of the above, further research can be done in future studies to address the effects of affordability, civil compliance, national conditions, and government capacity on transmission in order to strengthen China's capacity for the prevention and control of infectious diseases, including COVID-19.
5. Conclusion
Under China's COVID-19 dynamic zero-case policy, high-frequency screening, such as daily NAT and an additional daily AT, can help contain the spread of the epidemic, reduce the size and burden of the epidemic, and is cost-effective. Mass AT is not cost-effective compared with mass NAT in the same screening frequency. It would be more cost-effective to use AT as a supplemental screening tool when NAT capacity is insufficient or when outbreaks are spreading very rapidly.
Data availability statement
The original contributions presented in the study are included in the article/Supplementary material, further inquiries can be directed to the corresponding author.
Author contributions
HL: study design, model design, parameters colleting, and data analyses. HZ: resources, supervision, and funding acquisition. HL and HZ: the original draft preparation and writing—review and editing. Both authors contributed to the article and approved the submitted version.
Funding
This work was supported by Ministry of Education Humanities and Social Sciences Research Planning Fund Project in 2022 (22YJAZH147), Innovation Team Project for General Universities in Guangdong Province (2022WCXTD011), and Guangdong Pharmaceutical University 2022 Higher Education Research Project (GYGJ202204).
Acknowledgments
We would like to acknowledge editors and reviewers for their work and comments.
Conflict of interest
The authors declare that the research was conducted in the absence of any commercial or financial relationships that could be construed as a potential conflict of interest.
Publisher's note
All claims expressed in this article are solely those of the authors and do not necessarily represent those of their affiliated organizations, or those of the publisher, the editors and the reviewers. Any product that may be evaluated in this article, or claim that may be made by its manufacturer, is not guaranteed or endorsed by the publisher.
Supplementary material
The Supplementary Material for this article can be found online at: https://www.frontiersin.org/articles/10.3389/fpubh.2023.1099116/full#supplementary-material
References
1. Jin H, Wang H, Li X, Zheng W, Ye S, Zhang S, et al. Economic burden of COVID-19, China, January–March, 2020: a cost-of-illness study. Bull World Health Organ. (2021) 99:112–24. doi: 10.2471/BLT.20.267112
2. Joint Prevention Control Mechanism of the State Council. COVID-19 Disease Prevention and Control Guideline. (2022). Available online at: http://www.gov.cn/xinwen/2022-06/28/content_5698168.htm (accessed September 18, 2022).
3. Mina MJ, Andersen KG. COVID-19 testing: one size does not fit all. Science. (2021) 371:126–7. doi: 10.1126/science.abe9187
4. Wei Y, Ye Z, Cui M, Wei X. COVID-19 prevention and control in China: grid governance. J Public Health. (2021) 43:76–81. doi: 10.1093/pubmed/fdaa175
5. Carcione JM, Santos JE, Bagaini C, Ba J, A. Simulation of a COVID-19 epidemic based on a deterministic SEIR model. Front Public Health. (2020) 8:230. doi: 10.3389/fpubh.2020.00230
6. Lai S, Ruktanonchai NW, Zhou L, Prosper O, Luo W, Floyd JR, et al. Effect of non-pharmaceutical interventions to contain COVID-19 in China. Nature. (2020) 585:410–3. doi: 10.1038/s41586-020-2293-x
7. Zhao J, Jin H, Li X, Jia J, Zhang C, Zhao H, et al. Disease burden attributable to the first wave of COVID-19 in China and the effect of timing on the cost-effectiveness of movement restriction policies. Value in Health. (2021) 24:615–24. doi: 10.1016/j.jval.2020.12.009
8. Li KKF, Jarvis SA, Minhas F. Elementary effects analysis of factors controlling COVID-19 infections in computational simulation reveals the importance of social distancing and mask usage. Comput Biol Med. (2021) 134:104369. doi: 10.1016/j.compbiomed.2021.104369
9. Jiang P. How Long Does it Really Take to Get the Results of a Nucleic Acid Test?. Available online at: http://www.sxgov.cn/content/2020-06/30/content_10045181.htm (accessed October 9, 2022).
10. Brümmer LE, Katzenschlager S, Gaeddert M, Erdmann C, Schmitz S, Bota M, et al. Accuracy of novel antigen rapid diagnostics for SARS-CoV-2: a living systematic review and meta-analysis. PLoS Med. (2021) 18:e1003735. doi: 10.1371/journal.pmed.1003735
11. Khalid MF, Selvam K, Jeffry AJN, Salmi MF, Najib MA, Norhayati MN, et al. Performance of rapid antigen tests for COVID-19 diagnosis: a systematic review and meta-analysis. Diagnostics. (2022) 12:110. doi: 10.3390/diagnostics12010110
12. Smith RL, Gibson LL, Martinez PP, Ke R, Mirza A, Conte M, et al. Longitudinal assessment of diagnostic test performance over the course of acute SARS-CoV-2 infection. J Infect Dis. (2021) 224:976–82. doi: 10.1093/infdis/jiab337
13. Shang W, Kang L, Cao G, Wang Y, Gao P, Liu J, et al. Percentage of asymptomatic infections among SARS-CoV-2 omicron variant-positive individuals: a systematic review and meta-analysis. Vaccines. (2022) 10:1049. doi: 10.3390/vaccines10071049
14. Tanaka H, Ogata T, Shibata T, Nagai H, Takahashi Y, Kinoshita M, et al. Shorter incubation period among COVID-19 cases with the BA. 1 Omicron Variant IJERPH. (2022) 19:6330. doi: 10.3390/ijerph19106330
15. Quilty BJ, Clifford S, Hellewell J, Russell TW, Kucharski AJ, Flasche S, et al. Quarantine and testing strategies in contact tracing for SARS-CoV-2: a modelling study. Lancet Public Health. (2021) 6:e175–83. doi: 10.1101/2020.08.21.20177808
16. Liu Y, Rocklöv J. The effective reproductive number of the Omicron variant of SARS-CoV-2 is several times relative to Delta. J Travel Med. (2022) 29:taac037. doi: 10.1093/jtm/taac037
17. Chen X. Estimation of disease burden and clinical severity of COVID-19 caused by Omicron BA.2 in Shanghai. Emerging Microbes Infect. (2022) 11:2800–7. doi: 10.1080/22221751.2022.2128435
18. Fan X, Lu S, Bai L, Liu H, Fu J, Jin X., et al. Preliminary study of the protectiveness of vaccination against the COVID-19 in the outbreak of VOC omicron BA2—Jilin City, Jilin Province, China, March 3–April 12. China CDC weekly. (2022) 4:4.
19. Xin H. China Further Lowers Cost of COVID-19 Nucleic Acid Tests. (2022). Available online at: https://english.news.cn/20220525/e91b6329ac8c46e99a136b2d28422346/c.html (accessed November 15, 2022).
20. The Joint Prevention Control Mechanism of the State Council. Notice of Further Price Reduction for Nucleic Acid Test and Antigen Test of COVID-19. (2022). Available online at: http://www.nhsa.gov.cn/art/2022/5/25/art_37_8228.html (accessed November 15, 2022).
21. National Bureau of Statistics of China. China Statistical Yearbook 2021. (2022). Available online at: http://www.stats.gov.cn/sj/ndsj/2022/indexch.htm (accessed November 15, 2022).
22. Chen Y, Wang AH Yi B, Ding KQ, Wang HB, Wang JM, et al. Epidemiological characteristics of infection in COVID-19 close contacts in Ningbo city. Zhonghua Liu Xing Bing Xue Za Zhi. (2020) 41:667–71. doi: 10.3760/cma.j.cn112338-20200304-00251
23. Liljas B. How to calculate indirect costs in economic evaluations. Pharmacoeconomics. (1998) 13:1–7. doi: 10.2165/00019053-199813010-00001
24. Du Z, Pandey A, Bai Y, Fitzpatrick MC, Chinazzi M., Pastore y, Piontti A, et al. Comparative cost-effectiveness of SARS-CoV-2 testing strategies in the USA: a modelling study. Lancet Public Health. (2021) 6:e184–91. doi: 10.1016/S2468-2667(21)00002-5
25. Paltiel AD, Zheng A, Sax PE. Clinical and economic effects of widespread rapid testing to decrease SARS-CoV-2 transmission. Ann Intern Med. (2021) 174:803–10. doi: 10.7326/M21-0510
26. Vandepitte S, Alleman T, Nopens I, Baetens J, Coenen S, De Smedt D. Cost-effectiveness of COVID-19 policy measures: a systematic review. Value in Health. (2021) 24:1551–69. doi: 10.1016/j.jval.2021.05.013
27. Reddy KP, Shebl FM, Foote JHA, Harling G, Scott JA, Panella C, et al. Cost-effectiveness of public health strategies for COVID-19 epidemic control in South Africa: a microsimulation modelling study. Lancet Global Health. (2021) 9:e120–9. doi: 10.1016/S2214-109X(20)30452-6
28. Losina E, Leifer V, Millham L, Panella C, Hyle EP, Mohareb AM, et al. College campuses and COVID-19 mitigation: clinical and economic value. Ann Intern Med. (2021) 174:472–83. doi: 10.7326/M20-6558
Keywords: COVID-19, cost-effectiveness, screening strategy, agent-based model, dynamic zero-case policy, China
Citation: Li H and Zhang H (2023) Cost-effectiveness analysis of COVID-19 screening strategy under China's dynamic zero-case policy. Front. Public Health 11:1099116. doi: 10.3389/fpubh.2023.1099116
Received: 15 November 2022; Accepted: 17 April 2023;
Published: 09 May 2023.
Edited by:
Sheikh Taslim Ali, The University of Hong Kong, Hong Kong SAR, ChinaReviewed by:
Po Ying Chia, Tan Tock Seng Hospital, SingaporeXinmiao Fu, Fujian Normal University, China
Md Pear Hossain, The University of Hong Kong, Hong Kong SAR, China
Copyright © 2023 Li and Zhang. This is an open-access article distributed under the terms of the Creative Commons Attribution License (CC BY). The use, distribution or reproduction in other forums is permitted, provided the original author(s) and the copyright owner(s) are credited and that the original publication in this journal is cited, in accordance with accepted academic practice. No use, distribution or reproduction is permitted which does not comply with these terms.
*Correspondence: Hui Zhang, huizi_zhang@126.com