
Relationship among Perceived Stress, Life Satisfaction and Academic Performance of Education Sciences Students of the University of Jaén after the COVID-19 Pandemic

 ,
,  ,
,  and
and 
Abstract
:1. Introduction
- The objective is the prediction of a target construct, or it is intended to identify relevant constructs.
- The research model is complex depending on the type of relationships that are hypothesized (direct and mediated).
- The constructs that are part of the structural model have been designed following a formative measurement model.
- The structural model is complex.
- The sample size is small.
- The data do not have a normality distribution.
- (a)
- Study the existence of statistically significant correlations among the dimensions of the assessment for perceived stress (PSS-14), life satisfaction (SWLS) and academic performance;
- (b)
- Establish the existence of significant differences between the dimensions of the instruments considered and the sociodemographic variables (gender and educational level);
- (c)
- Analyse the causal relationship of perceived stress and life satisfaction on academic performance.
2. Materials and Methods
2.1. Procedure
2.2. Sample
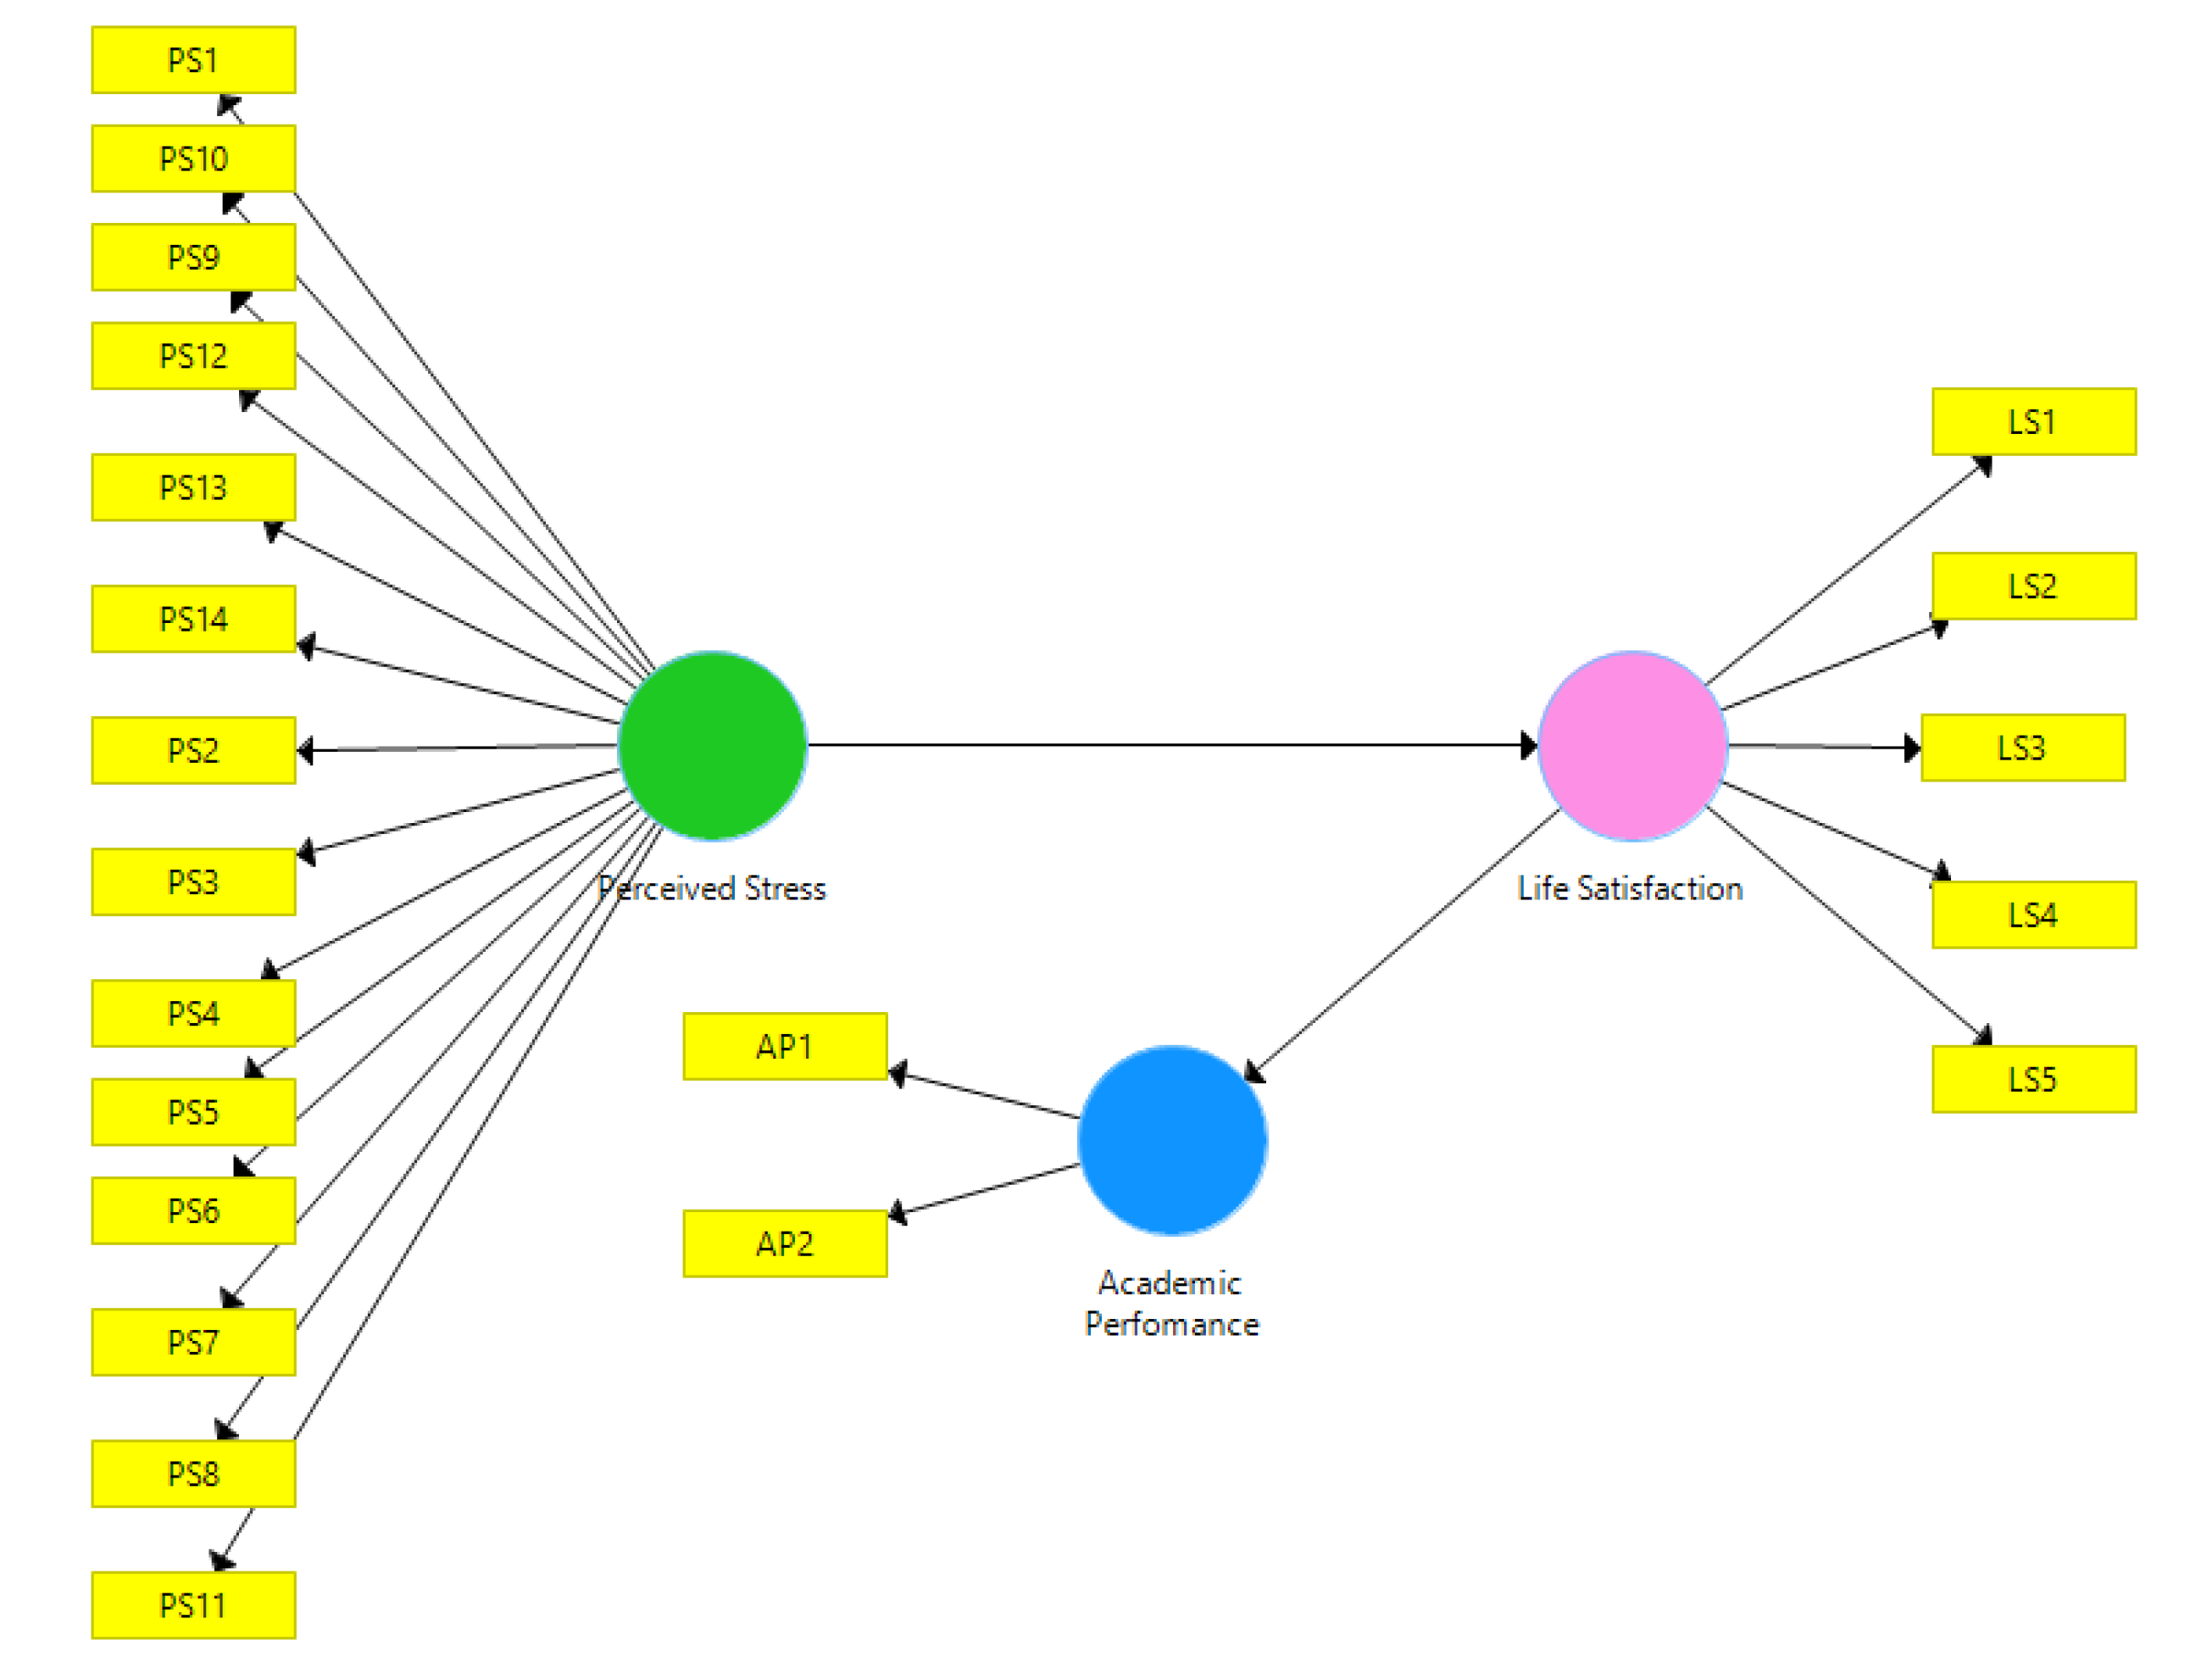
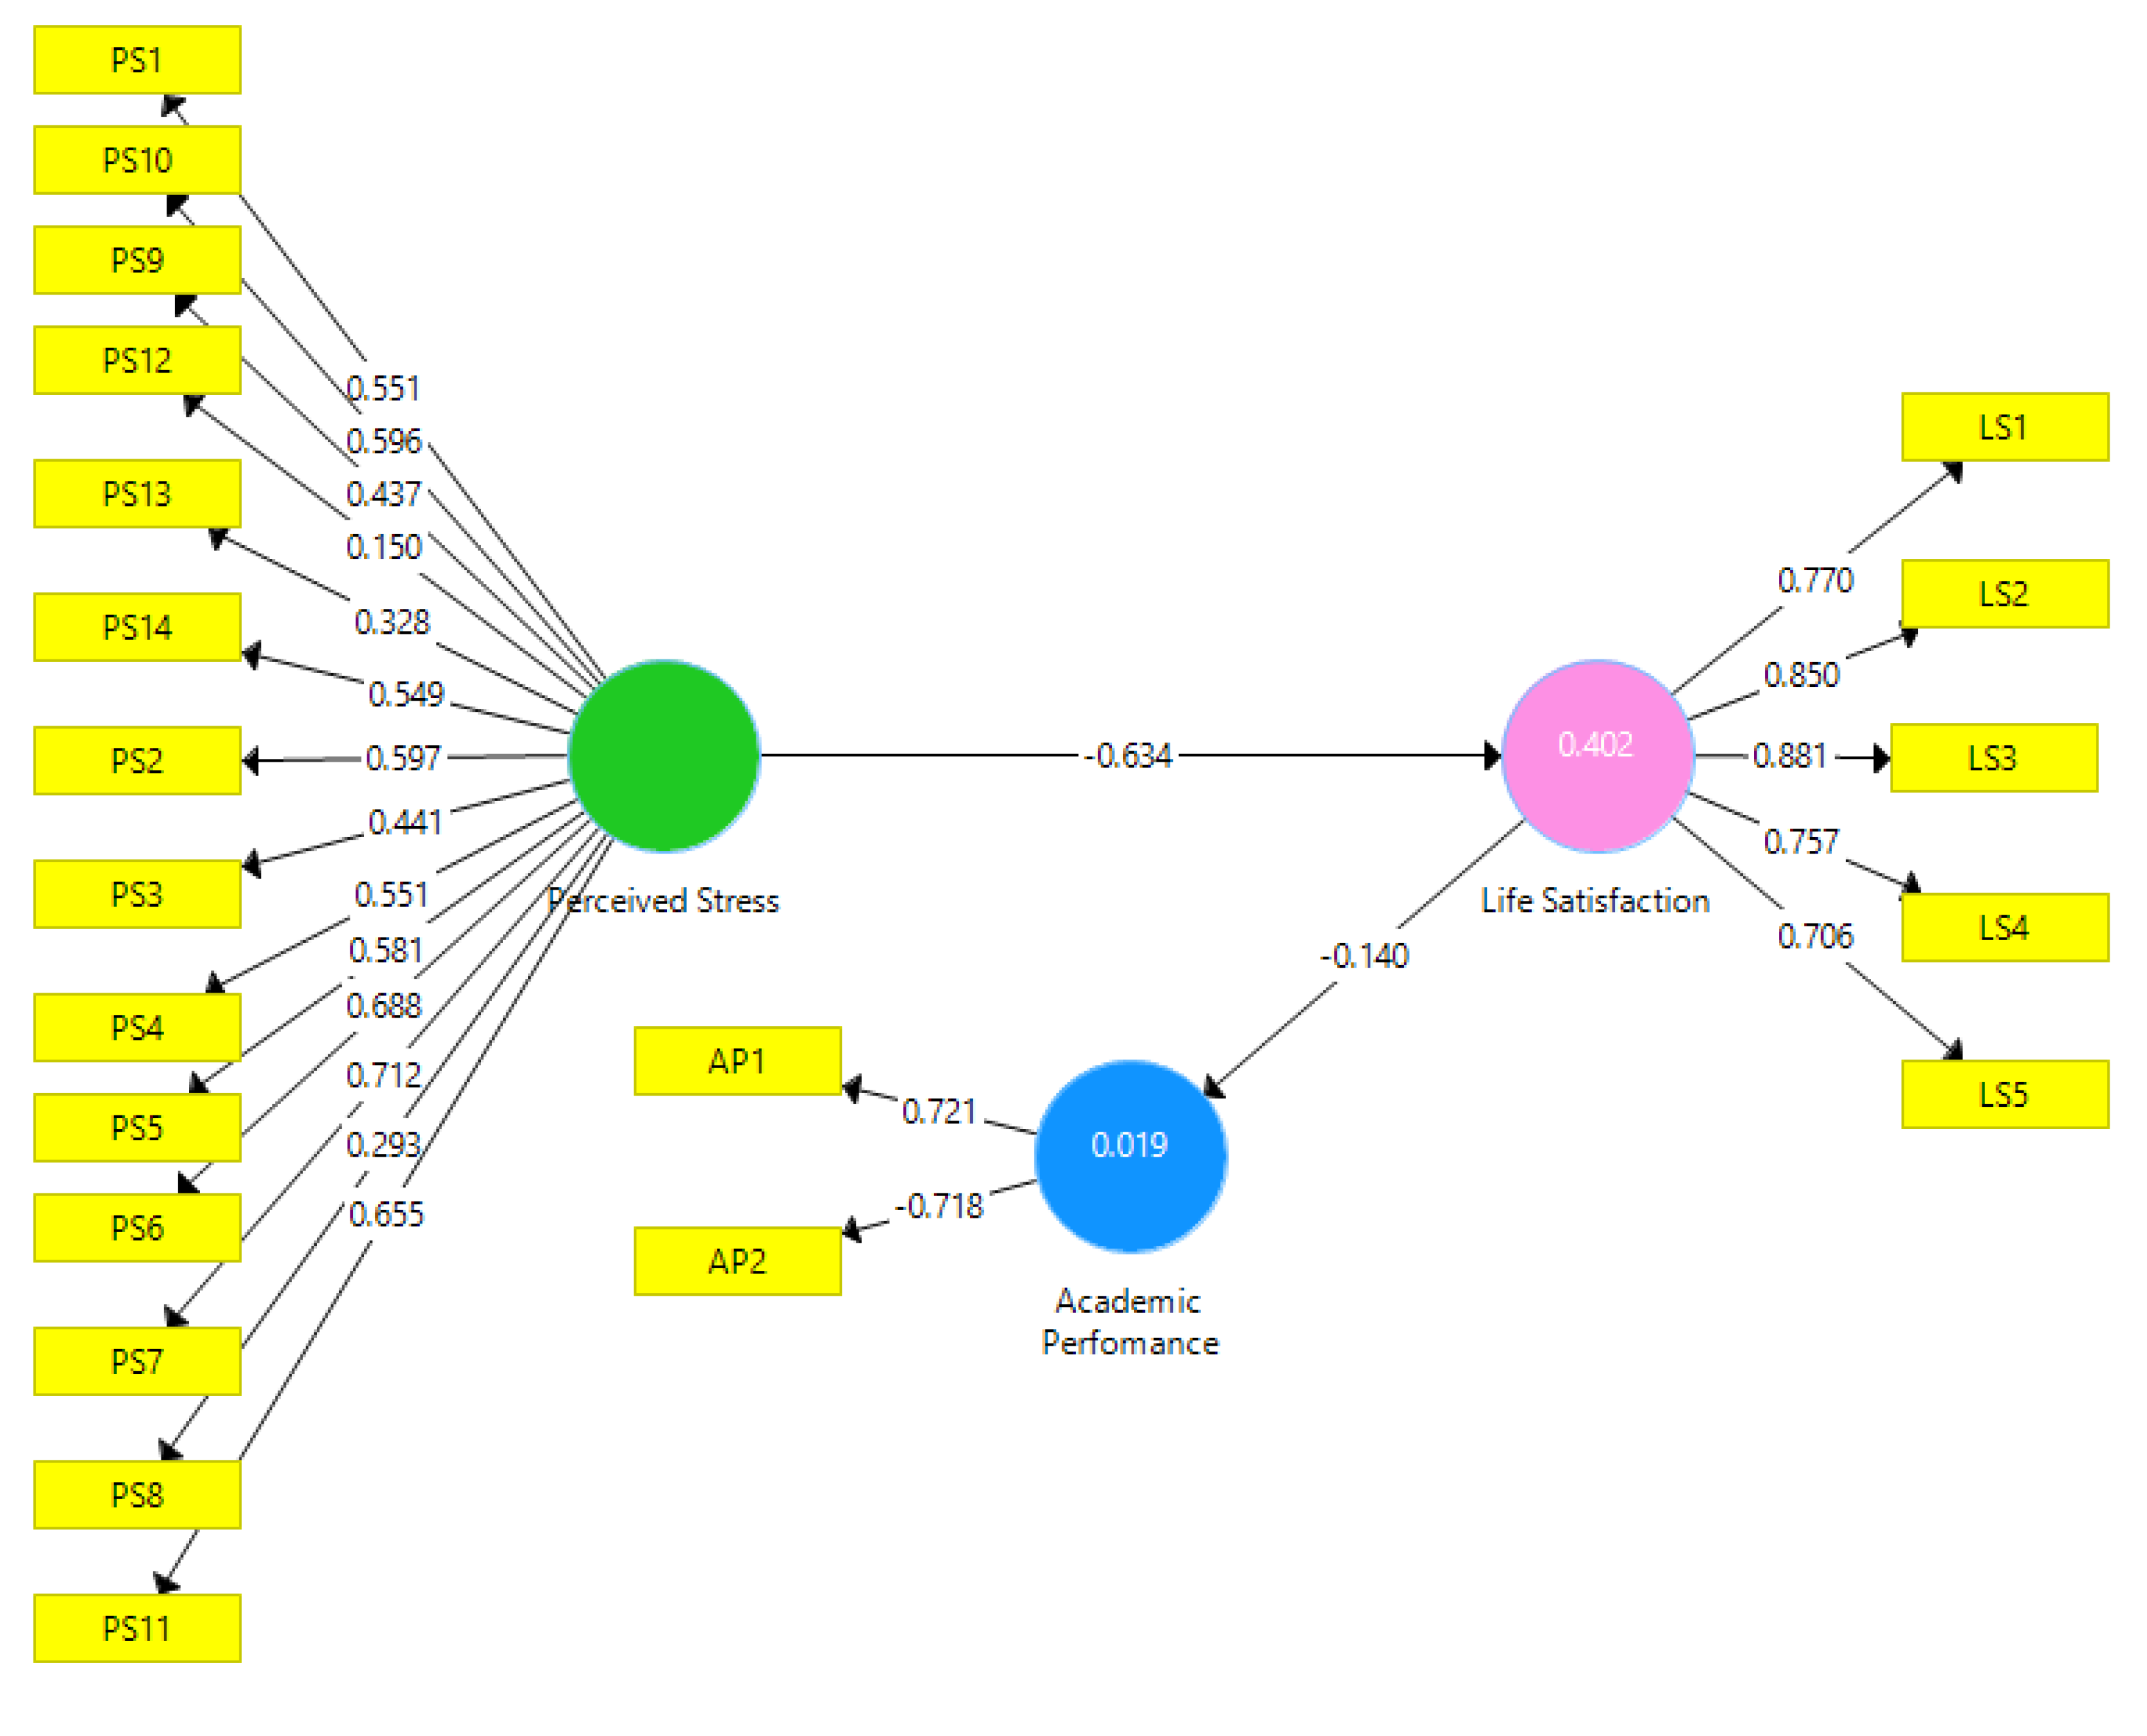
2.3. Research Model
2.3.1. Reliability and Validity of the Model
2.3.2. Cross Factorial Loads
2.3.3. Hypothesis Contrast
2.4. Instrument
2.5. Data Analysis
3. Results
3.1. Relationship among Perceived Stress, Life Satisfaction and Academic Performance
3.2. Differences Based on Sociodemographic Variables
3.2.1. Sociodemographic Variable “Gender”
3.2.2. Sociodemographic Variable “Taken Degree”
4. Discussion
5. Conclusions
Author Contributions
Funding
Institutional Review Board Statement
Informed Consent Statement
Data Availability Statement
Acknowledgments
Conflicts of Interest
References
- Sharp, J.; Theiler, S. A review of psychological distress among university students: Pervasiveness, implications and potential points of intervention. Int. J. Adv. Couns. 2018, 40, 193–212. [Google Scholar] [CrossRef]
- Leka, S.; Griffiths, A.; Cox, T. La Organización del Trabajo y el estrés: Estrategias Sistemáticas de la Solución de probLemas para Empleados, Personal Directivo y Representantes Sindicales; Organización Mundial de la Salud: Geneva, Switzerland, 2004. Available online: http://www.who.int/occupational_health/publications/en/pwh3sp.pdf (accessed on 20 October 2021).
- Misrachi-Launert, C.; Ríos-Erazo, M.; Manríquez-Urbina, J.M.; Burgos-Ibarra, C.; Ponce-Espinoza, D. Fuentes de estrés percibidas y rendimiento académico de estudiantes de odontología chilenos. FEM Rev. De La Fund. Educ. Médica 2015, 18, 109–116. [Google Scholar] [CrossRef]
- Suárez-Monte, N.; Díaz-Subieta, L.B. Estrés académico, deserción y estrategias de retención de estudiantes en la educación superior. Rev. De Salud Pública 2015, 17, 300–313. [Google Scholar] [CrossRef] [PubMed] [Green Version]
- García-Rojas, K.; Salazar-Salvatierra, E.; Barja-Ore, J. Resiliencia y estrés percibido en estudiantes de Obstetricia de una universidad pública de Lima, Perú. FEM Rev. De La Fund. Educ. Médica 2021, 24, 95–99. [Google Scholar] [CrossRef]
- Álvarez-Arregui, E.; Pérez-Navío, E.; González-Fernández, R.; Rodríguez-Martín, A. Pedagogical Leaders and the Teaching—Learning Processes in COVID-19 Times. Int. J. Environ. Res. Public Health 2021, 18, 7731. [Google Scholar] [CrossRef]
- Elsalem, L.; Al-Azzam, N.; Jum’ah, A.A.; Obeidat, N.; Sindiani, A.M.; Kheirallah, K.A. Stress and behavioral changes with remote E-exams during the Covid-19 pandemic: A cross-sectional study among undergraduates of medical sciences. Ann. Med. Surg. 2020, 60, 271–279. [Google Scholar] [CrossRef]
- Gamonal Limcaoco, R.S.; Montero Mateos, E.; Fernandez, J.M.; Roncero, C. Anxiety, worry and perceived stress in the world due to the COVID-19 pandemic. Preliminary results. medRxiv 2020. [Google Scholar] [CrossRef] [Green Version]
- Rossi, R.; Socci, V.; Talevi, D.; Mensi, S.; Niolu, C.; Pacitti, F.; Di Marco, A.; Rossi, A.; Siracusano, A.; Di Lorenzo, G. COVID-19 pandemic and lockdown measures impact on mental health among the general population in Italy. An N=18147 web-based survey. Front. Psychiatry Adv. Online Publ. 2020, 11, 790. [Google Scholar] [CrossRef] [PubMed]
- Correa, P.S.; Mola, D.J.; Ortiz, M.V.; Godoy, J.A. Variables relacionadas al estrés percibido durante el aislamiento por COVID-19 en Argentina. Salud Soc. 2021, 11, e4558. [Google Scholar] [CrossRef]
- Ozamiz-Etxebarria, N.; Dosil-Santamaria, M.; Picaza-Gorrochategui, M.; Idoiagamondragon, N. Stress, anxiety, and depression levels in the initial stage of the COVID-19 outbreak in a population sample in the northern Spain. Niveles de estrés, ansiedad y depresión en la primera fase del brote del COVID-19 en una muestra recogida en el norte de España. Cad. De Saúde Pública 2020, 36, e00054020. [Google Scholar] [CrossRef]
- León-Montoya, G.B.; Tejada-Muñoz, S.; Chotón-Calvo, M.d.R.; Saavedra-Chinchayán, M.E. Expectativas y actitudes frente al COVID-19 de estudiantes de enfermería de una universidad pública peruana. Rev. De La Univ. Del Zulia 2021, 12, 183–195. [Google Scholar] [CrossRef]
- Wang, C.; Pan, R.; Wan, X.; Tan, Y.; Xu, L.; Ho, C.S.; Ho, R.C. Immediate psychological responses and associated factors during the initial stage of the 2019 coronavirus disease (COVID-19) epidemic among the general population in China. Int. J. Environ. Res. Public Health 2020, 17, 1729. [Google Scholar] [CrossRef] [Green Version]
- Huang, Y.; Zhao, N. Generalized anxiety disorder, depressive symptoms and sleep quality during COVID-19 outbreak in China: A web-based cross-sectional survey. Psychiatry Res. 2020, 288, 112954. [Google Scholar] [CrossRef]
- Khan, S.; Siddique, R.; Li, H.; Ali, A.; Shereen, M.A.; Bashir, N.; Xue, M. Impact of coronavirus outbreak on psychological health. J. Glob. Health 2020, 10, 010331. [Google Scholar] [CrossRef]
- Zhang, J.; Wu, W.; Zhao, X.; Zhang, W. Recommended psychological crisis intervention response to the 2019 novel coronavirus pneumonia outbreak in China: A model of West China Hospital. Precis. Clin. Med. 2020, 3, 3–8. [Google Scholar] [CrossRef] [Green Version]
- Mc Gee, S.L.; Höltge, J.; Maercker, A.; Thoma, M.V. Sense of coherence and stress-related resil-ience: Investigating the mediating and moderat-ing mechanisms in the development of resilience following stress or adversity. Front. Psychiatry 2018, 9, 378. [Google Scholar] [CrossRef] [PubMed] [Green Version]
- Rectorado de la Universidad de Jaén. Comunicado Rectoral de 16 de Septiembre de 2021 Relativo al Establecimiento de la Modalidad Presencial en el Sistema de Docencia. 2021. Available online: https://www.ujaen.es/gobierno/viccom/sites/gobierno_viccom/files/uploads/node_book/2021-09/Comunicado%20rectoral%20de%2016-09-2021%20relativo%20al%20establecimiento%20de%20la%20modalidad%20presencial%20en%20el%20sistema%20de%20docencia.pdf (accessed on 18 November 2021).
- McDonald, R.P. Test Theory: A Unified Treatment; Lawrence Erlbaum Associates: Mahwah, NJ, USA, 1999. [Google Scholar]
- Hair, J.; Hult, G.; Ringle, C.; Sarstedt, M. A Primer on Partial Least Square Structural Equation Modeling (PLS-SEM); Sage: Riverside County, CA, USA, 2017. [Google Scholar]
- Stone, L.L.; Janssens, J.M.; Vermulst, A.A.; Van Der Maten, M.; Engels, R.C.; Otten, R. The Strengths and Difficulties Questionnaire: Psychometric properties of the parent and teacher version in children aged 4-7. BMC Psychol. 2015, 3, 4. [Google Scholar] [CrossRef] [Green Version]
- Ruiz, M.A.; Pardo, A.; San Martin, R. Modelos de ecuaciones estructurales. Pap. Del Psicólogo 2010, 31, 34–45. [Google Scholar]
- Henseler, J.; Ringle, C.M.; Sarstedt, M. A New Criterion for Assessing Discriminant Validity in Variance-based Structural Equation Modeling. J. Acad. Mark. Sci. 2015, 43, 115–135. [Google Scholar] [CrossRef] [Green Version]
- Becker, J.-M.; Ringle, M.; Sarstedt, M. Estimating Moderating Effects in PLS-SEM and PLSc-SEM: Interaction Term Generation. J. Appl. Struct. Equ. Modeling 2018, 2, 1–21. [Google Scholar] [CrossRef]
- Martínez-Ávila, M.; Fierro-Moreno, E. Aplicación de la técnica PLS_SEM en la gestión del conocimiento: Un enfoque técnico práctico. RIDE Rev. Iberoam. Para La Investig. Y Desarro. Educ. 2018, 8, 130–164. [Google Scholar] [CrossRef] [Green Version]
- Norabuena-Mendoza, C.H.; Huamán-Osorio, A.P.; Ramírez-Asís, E.H. Modelo de Ecuaciones Estructurales (Con estimación PLS) basado en calidad de servicio y lealtad del Cliente de las Cajas Rurales Peruanas. Cienc. Adm. 2020, 81, 3–14. [Google Scholar] [CrossRef]
- Chin, W.W. The partial least squares approach for structural equation modeling. In Modern Methods for Business Research; Marcoulides, G.A., Ed.; Lawrence Erlbaum Associates: Mahwah, NJ, USA, 1998; pp. 295–336. [Google Scholar]
- Diener, E.; Emmons, R.A.; Larsen, R.J.; Griffin, S. The Satisfaction with Life Scale. J. Pers. Assess. 1985, 49, 71–75. [Google Scholar] [CrossRef] [PubMed]
- Vázquez, C.; Duque, A.; Hervás, G. Satisfaction with Life Scale in a Representative Sample of Spanish Adults: Validation and Normative Data. Span. J. Psychol. 2013, 16, 1–15. [Google Scholar] [CrossRef]
- Cohen, S.; Kamarck, T.; Mermelstein, R. A global measure of perceived stress. J. Health Soc. Behav. 1983, 24, 385–396. [Google Scholar] [CrossRef]
- Remor, E. Psychometric Properties of a European Spanish Version of the Perceived Stress Scale (PSS). Span. J. Psychol. 2006, 9, 86–93. [Google Scholar] [CrossRef] [Green Version]
- Guzmán-Yacaman, J.E.; Reyes-Bossio, M. Adaptación de la Escala de Percepción Global de Estrés en estudiantes universitarios peruanos [Adaptation of the Global Perceived Stress Scale in college peruvian students]. Rev. De Psicol. 2018, 36, 719–750. [Google Scholar] [CrossRef] [Green Version]
- Domínguez-Lara, S.A.; Merino-Soto, C. ¿Por qué es importante reportar los intervalos de confianza del coeficiente alfa de Cronbach? Rev. Latinoam. De Cienc. Soc. Niñez Y Juv. 2015, 13, 1326–1328. [Google Scholar]
- Matalinares, C.M.L.; Díaz, A.G.; Arenas, I.C.; Raymundo, V.O.; Baca, R.D.; Uceda, E.J.; Yaringaño, L.J. Afrontamiento al estrés y bienestar psicológico en estudiantes universitarios de Lima y Huancayo. Rev. De Investig. Psicol. 2017, 19, 123–143. [Google Scholar] [CrossRef] [Green Version]
- Ginevra, M.C.; Magnano, P.; Lodi, E.; Annovazzi, C.; Camussi, E.; Patrizi, P.; Nota, L. The role of career adaptability and courage on life satisfaction in adolescence. J. Adolesc. 2018, 62, 1–8. [Google Scholar] [CrossRef]
- Zuffianò, A.; Martí-Vilar, M.; López-Pérez, B. Prosociality and life satisfaction: A daily-diary investigation among Spanish university students. Pers. Individ. Differ. 2018, 123, 17–20. [Google Scholar] [CrossRef]
- González-Olaya, H.L.; Delgado-Rico, H.D.; Escobar-Sánchez, M.; Cárdenas-Angelone, M.E. Asociación entre el estrés, el riesgo de depresión y el rendimiento académico en estudiantes de los primeros semestres de un programa colombiano de medicina. FEM Rev. De La Fund. Educ. Médica 2014, 17, 47–54. [Google Scholar]
- Pérez-Navío, E.; Medina-Domínguez, M.C.; Cachón-Zagalaz, J. Perception of the professional competences of last year’s students of Pre-Primary Education and Primary Education degrees and students of training Teachers Master. NAER. J. New Approaches Educ. Res. 2019, 8, 58–65. [Google Scholar] [CrossRef]
- Fornés-Vives, J.; Garcia-Banda, G.; Frías-Navarro, D.; Rosales-Viladrich, G. Coping, stress, and personality in Spanish nursing students: A longitudinal study. Nurse Educ. Today 2016, 36, 318–323. [Google Scholar] [CrossRef]
- Kline, R.B. Principles and Practice of Structural Equation Modeling; Guilford Press: New York, NY, USA, 2015. [Google Scholar]
- Vargas-Halabí, T.; Mora-Esquivel, R. Adaptación y dimensionalidad de la escala DOCS en el contexto organizacional costarricense: Aplicación de la entrevista cognitiva y el análisis factorial confirmatorio/ Adaptation and Dimensionality of the DOCS Scale in the Costa Rican Organizational Context: An Application of the Cognitive Interview and of Confirmatory Factor Analysis. Rev. Costarric. De Psicol. 2017, 36, 199–226. [Google Scholar] [CrossRef] [Green Version]
- Iacobucci, D. Structural equations modeling: Fit indices, sample size, and advanced topics. J. Consum. Psychol. 2010, 20, 90–98. [Google Scholar] [CrossRef]
- Medrano, L.A.; Muñoz-Navarro, R. Aproximación Conceptual y Práctica a los Modelos de Ecuaciones Estructurales. Rev. Digit. De Investig. En Docencia Univ. 2017, 11, 219–239. [Google Scholar] [CrossRef]
- Ramery-Gelpi, E.; Pérez Navío, E. Comparación de la satisfacción laboral del director escolar y los docentes. Rev. Electrón. De Investig. Y Docencia (REID) 2016, 15, 85–100. [Google Scholar] [CrossRef]
- Medina Rivilla, A.; Pérez Navío, E. Evaluación de la Práctica Docente: Modelos, Criterios y Pruebas. Estudio de casos de la evaluación de la enseñanza de la medicina. En A. Medina y M. Secchi. In Didáctica Aplicada a la Medicina y Ciencias de la Salud; Amalevi: Rosario, Argentina, 2010; pp. 353–387. ISBN 9-789872-444112. Available online: https://www.iunir.edu.ar/publicaciones/libros/didactica%20aplicada.pdf (accessed on 5 October 2021).
- Dymecka, J.; Gerymski, R.; Machnik-Czerwik, A. How does stress affect our life satisfaction during COVID-19 pandemic? Moderating mediation analysis of sense of coherence and fear of coronavirus. Psychol. Health Med. 2021. [Google Scholar] [CrossRef] [PubMed]
- Yang, C.; Chen, A.; Chen, Y. College students’ stress and health in the COVID-19 pandemic: The role of academic workload, separation from school, and fears of contagion. PLoS ONE 2021, 16, e0246676. [Google Scholar] [CrossRef]
- Antelm-Lanzat, A.M.; Gil, A.J.; Cacheiro-González, M.L.; Pérez-Navío, E.; Fonseca-Pedrero, E. Learning styles and vocational guidance in secondary education. Educ. Sci. Theory Pract. 2020, 20, 1–15. [Google Scholar] [CrossRef]


| Degree | |
|---|---|
| Childhood Education | Primary Education |
| 82.08% | 17.12% |
| Gender | |
| Female | Male |
| 77.03% | 22.97% |
| Variable | α | ɷ | Composite Reliability Index (CRI) | Rho_A | Mean Extracted Variance (MEV) |
|---|---|---|---|---|---|
| PS LS AP | 0.79 0.84 - | 0.80 0.86 - | 0.83 0.89 - | 0.84 0.87 - | 0.283 0.633 0.517 |
| Variable | Academic Performance (AP) | Life Satisfaction (LS) | Perceived Stress (PS) |
|---|---|---|---|
| AP1 AP2 LS1 LS2 LS3 LS4 LS5 PS1 PS2 PS3 PS4 PS5 PS6 PS7 PS8 PS9 PS10 PS11 PS12 PS13 PS14 | 0.721 −0.718 −0.078 −0.158 −0.160 −0.114 −0.020 0.005 0.055 −0.034 −0.016 0.032 0.047 0.099 0.042 −00.80 −0.020 0.117 −0.084 −0.120 0.131 | −0.101 0.100 0.770 0.850 0.881 0.757 0.706 −0.270 −0.359 −0.231 −0.303 −0.400 −0.358 −0.628 −0.076 −0.188 −0.351 −0.444 −0.087 −0.170 −0.310 | 0.062 −0.025 −0.496 −0.523 −0.599 −0.453 −0.432 0.551 0.597 0.441 0.551 0.581 0.688 0.712 0.293 0.437 0.596 0.655 0.150 0.328 0.549 |
| Relationship between Variables | Path Coefficient (β) | Standard Deviation (σ) | t Statistic | p | ||
|---|---|---|---|---|---|---|
| AP1 | ↔ | Academic Performance | 0.721 | 0.657 | 1.097 | 0.273 |
| AP2 | ↔ | Academic Performance | −0.718 | 0.683 | 1.051 | 0.294 |
| LS1 | ↔ | Life Satisfaction | 0.770 | 0.042 | 18.188 | *** |
| LS2 | ↔ | Life Satisfaction | 0.850 | 0.022 | 39.497 | *** |
| LS3 | ↔ | Life Satisfaction | 0.881 | 0.017 | 52.616 | *** |
| LS4 | ↔ | Life Satisfaction | 0.757 | 0.036 | 20.769 | *** |
| LS5 | ↔ | Life Satisfaction | 0.706 | 0.042 | 16.791 | *** |
| PS1 | ↔ | Perceived Stress | 0.551 | 0.062 | 8.865 | *** |
| PS2 | ↔ | Perceived Stress | 0.597 | 0.062 | 9.598 | *** |
| PS3 | ↔ | Perceived Stress | 0.441 | 0.075 | 5.840 | *** |
| PS4 | ↔ | Perceived Stress | 0.551 | 0.062 | 8.922 | *** |
| PS5 | ↔ | Perceived Stress | 0.581 | 0.059 | 9.894 | *** |
| PS6 | ↔ | Perceived Stress | 0.688 | 0.048 | 14.207 | *** |
| PS7 | ↔ | Perceived Stress | 0.712 | 0.033 | 21.473 | *** |
| PS8 | ↔ | Perceived Stress | 0.293 | 0.088 | 3.336 | *** |
| PS9 | ↔ | Perceived Stress | 0.437 | 0.077 | 5.708 | *** |
| PS10 | ↔ | Perceived Stress | 0.596 | 0.067 | 8.950 | *** |
| PS11 | ↔ | Perceived Stress | 0.655 | 0.044 | 15.023 | *** |
| PS12 | ↔ | Perceived Stress | 0.150 | 0.086 | 1.735 | 0.083 |
| PS13 | ↔ | Perceived Stress | 0.328 | 0.086 | 3.803 | *** |
| PS14 | ↔ | Perceived Stress | 0.549 | 0.062 | 8.880 | *** |
| SWLS |
|---|
| 1. My life is how I want it to be in most aspects. 2. My life circumstances are very good. 3. I am satisfied with my life. 4. So far, I have achieved the things that I consider important from life. 5. If I could live my life again, I would not change almost anything. |
| PSS |
|---|
| 1. How often have I been affected by something that happened unexpectedly? 2. How often have I felt unable to control the important things in my life? 3. How often have I felt nervous or stressed? 4. How often have I successfully dealt with life’s irritating little problems? 5. How often have I felt that I have effectively coped with the major changes that have been taking place in my life? 6. How often have I been confident about my ability to handle my personal problems? 7. How often have I felt that things are going well for me? 8. How often have I felt like I could not face all the things I had to do? 9. How often have I been able to control the difficulties in my life? 10. How often have I felt like I had everything under control? 11. How often have I been angry because things that happened to me were out of my control? 12. How often have I thought about the things that I still have to do? 13. How often have I been able to control the way I spend time? 14. How often have I felt difficulties accumulate so much that I cannot overcome them? |
| Variable | α | M (SD) | Perceived Stress | Life Satisfaction | Academic Performance | |
|---|---|---|---|---|---|---|
| Perceived Stress Life Satisfaction Academic Performance | 0.79 0.84 - | 0.80 0.86 - | 5.054 (±0.962) 2.962 (±0.414) 8.597 (±8.881) | - | −0.543 ** - | −0.034 −0.191 - |
| Variables | Women (n = 171) M (SD) | Men (n = 51) M (SD) | Z | p | Size Effect (r) |
|---|---|---|---|---|---|
| Perceived Stress Life satisfaction Academic Performance | 2.982 (±0.417) 5.037 (±0.994) 8.962 (±10.088) | 2.894 (±0.400) 5.109 (±0.854) 7.373 (±0.768) | −1.433 −0.203 −2.472 | 0.152 0.839 0.013 * | 0.132 0.018 0.222 |
| Variables | Childhood Education M (SD) | Primary Education M (SD) | Z | p | Size Effect (r) |
|---|---|---|---|---|---|
| Perceived Stress Life satisfaction Academic Performance | 2.958 (±0.415) 5.038 (±0.969) 7.925 (±0.787) | 2.981 (±0.416) 5.131 (±9.38) 8.564 (±5.468) | −0.101 −0.651 −2.017 | 0.919 0.515 0.044 * | 0.010 0.066 0.206 |
Publisher’s Note: MDPI stays neutral with regard to jurisdictional claims in published maps and institutional affiliations. |
© 2021 by the authors. Licensee MDPI, Basel, Switzerland. This article is an open access article distributed under the terms and conditions of the Creative Commons Attribution (CC BY) license (https://creativecommons.org/licenses/by/4.0/).
Share and Cite
Ocaña-Moral, M.T.; Gavín-Chocano, Ó.; Pérez-Navío, E.; Martínez-Serrano, M.d.C. Relationship among Perceived Stress, Life Satisfaction and Academic Performance of Education Sciences Students of the University of Jaén after the COVID-19 Pandemic. Educ. Sci. 2021, 11, 802. https://doi.org/10.3390/educsci11120802
Ocaña-Moral MT, Gavín-Chocano Ó, Pérez-Navío E, Martínez-Serrano MdC. Relationship among Perceived Stress, Life Satisfaction and Academic Performance of Education Sciences Students of the University of Jaén after the COVID-19 Pandemic. Education Sciences. 2021; 11(12):802. https://doi.org/10.3390/educsci11120802
Chicago/Turabian StyleOcaña-Moral, María Teresa, Óscar Gavín-Chocano, Eufrasio Pérez-Navío, and María del Carmen Martínez-Serrano. 2021. "Relationship among Perceived Stress, Life Satisfaction and Academic Performance of Education Sciences Students of the University of Jaén after the COVID-19 Pandemic" Education Sciences 11, no. 12: 802. https://doi.org/10.3390/educsci11120802