Article

The Effects of Barriers and Freight Vehicle Restrictions on Logistics Costs: A Comparison before and during the COVID-19 Pandemic in Brazil

by
Marcelo Werneck Barbosa
1,*,
Paulo Renato de Sousa
2 and
Leise Kelli de Oliveira
3
1
Facultad de Administración y Negocios, Universidad Autónoma de Chile, Av Pedro de Valdivia 425, Providencia, Santiago 7500912, Chile
2
Fundação Dom Cabral, Avenida Princesa Diana, 760 Alphaville Lagoa dos Ingleses, Nova Lima 30140-083, MG, Brazil
3
Department of Transportation and Geotechnical Engineering, Universidade Federal de Minas Gerais, Av. Antônio Carlos, 6627, Pampulha, Belo Horizonte 31270-901, MG, Brazil
*
Author to whom correspondence should be addressed.
Sustainability 2022, 14(14), 8650; https://doi.org/10.3390/su14148650
Submission received: 10 June 2022 / Revised: 7 July 2022 / Accepted: 12 July 2022 / Published: 14 July 2022
(This article belongs to the Special Issue Advances in Green City Logistics)

Abstract

:
The COVID-19 pandemic exposed the fragility of the supply chains, in which the production, distribution, and transportation systems were disrupted, permanently or temporarily. Despite the enormous influences the pandemic had on transportation systems, no study has yet assessed the extent to which the freight restrictions and barriers influenced logistics costs after the start of the COVID-19 outbreak. However, understanding them is necessary to guide and stimulate public policies that intend to optimize the effects of freight restrictions on logistics costs. Thus, this paper assesses and compares the effects that such barriers in urban freight transport, and the restrictions imposed on freight vehicles, had on logistics costs before and during the pandemic. We surveyed more than 120 logistics professionals in Brazil in both 2018 and 2020/2021, making comparisons using models that were assessed using partial least squares structural equation modelling. The findings suggest that barriers and freight restrictions influenced the logistics costs positively, but such influences reduced during the pandemic. Being aware of the barriers and restrictions that influence logistics costs and of how the pandemic increased the effects of some restrictions is essential for managers to be able make timely and appropriate decisions and to plan and implement initiatives to prevent or reduce costs.

1. Introduction

The COVID-19 pandemic seriously restricted mobility, commercial trade, and transportation [1], influencing the global supply chains negatively [2]. International logistics experienced delays, cancellations, and obstructions due to travel restrictions and the closing of international borders [3]. In freight transportation, several influences of the pandemic are evident, including delays in transportation and distribution, lack of international transportation/trade, and loss of physical distribution channels [4]. During pandemics, logistics increasingly focus on local orders and orders over the internet [5]. Some technological advances have been observed worldwide [6], such as the use of drones to deliver products to customers in highly restricted zones [7] and technology that reduces human-to-human contact during goods transport [8]. Technological solutions have reduced the effects of disruptions, allowing freight transportation to continue [9].
One immediate effect of the pandemic was an increase in active travel modes such as cycling, both for human transportation and product delivery. A large share of modal shifts from public transport to other modes was observed, with transportation mostly being made by cars, bicycles, and motorcycles [10], especially during the initial phases of the pandemic. Several cities reallocated streets to cyclists, and such restrictive measures created a new scenario for urban transportation [5]. Among the possible consequences of these effects, shifts in customers’ transportation choices and reductions in the number of trips are evident [11]. Problems with finding parking and traffic congestion disappeared during lockdowns, and delivery times consequently reduced. A significant increase in e-commerce operations was observed, a scenario that supported transitions to new, sustainable delivery systems, such as cargo bikes [12]. In the United Kingdom during 2020, online sales increased nearly 20% in comparison to the pre-COVID-19 time. Nonetheless, physical distributions and shipping remain essential, and transportation and logistics are still experiencing challenges that require improvements. Thus, logistics systems should be properly established [13].
The financial performance of logistics firms was significantly greater during the first year of the outbreak in most countries, in comparison to the previous ten years. For them, the pandemic has represented an opportunity and a unique challenge [14]. Logistics companies, like other firms, treat logistics costs as a critical performance measure [15] that should be minimized [16,17]; competitive advantages are achieved by reducing logistics costs [18]. As the decisions regarding the sourcing and distribution of products always influence costs, cost minimization is vital to efficient transportation during pandemics [19].
In Colombia, the pandemic had a negative effect on the growth of the freight industry, with a recent study suggesting that restrictions halted freight transportation growth [20]. The pandemic also had other effects on transportation and mobility, which were discussed and assessed frequently during the COVID-19 outbreak [21]. Researchers have thus called for studies that assess the influence of mobility restrictions during pandemics [22] and that examine the nexus between mobility, transportation, and the pandemic [21].
A recent review suggests that few studies use an integrated approach to assess pre- and post-pandemic contexts [19], noting that most studies use simulation and optimization techniques to develop prescriptive or descriptive models using a deterministic approach [19]. To fill this gap, the current paper assesses and compares the effects that barriers to urban freight transport and the restrictions on freight vehicles had on logistics costs before and during the COVID-19 pandemic. The analysis is based on the data obtained from more than 120 logistics professionals in Brazil in 2018 and 2020/2021, using models estimated using partial least squares structural equation modelling (PLS-SEM) to compare pre- and post-COVID-19 pandemic contexts.
The contribution of this paper is twofold. First, we demonstrate a negative influence of the barriers and freight restrictions on logistics costs that the COVID-19 pandemic aggravated. Second, the findings support urban freight transport policies that reduce the externalities caused by this activity, thus increasing the social, environmental, and economic influences [23]. Brazil was one of the countries that the pandemic affected most, with cases and deaths that surpassed those in the United States and India [24]. Developing countries were affected by the pandemic more than developed countries because they are more vulnerable to economic restrictions and have lower resilience capacities to deal with disruptions [25]. In developing countries, economic growth depends on road freight transportation [20], highlighting the importance of studying such countries.
Section 2 of this paper discusses the theoretical background that supports this study’s hypotheses. Section 3 describes the research methods used and how the theoretical models were evaluated. Section 4 reports the findings, and Section 5 discusses the findings and contributions. Section 6 discusses the conclusions, limitations, and suggestions for future research.

2. Theoretical Background and Research Hypotheses

May et al. [26] define a barrier to transport policy as “an obstacle which prevents a given policy instrument being implemented, or limits how it can be implemented.” Such barriers fall into several categories—legal and institutional, financial, political and cultural, and practical and technological [26]. Banister [27] defines the barriers as “forces that prevent a measure from being implemented in its ideal form,” classifying them into resource, institutional and policy, social and cultural, legal, and unintended outcomes. An inadequate transportation infrastructure thus represents a challenge that prevents companies participating in global supply chains, especially those in emerging countries. If freight flows are fluid, without barriers, companies can deliver products efficiently and reduce inventory. A second positive side effect is that fluid freight flows also reduce the need for more vehicles to transport goods [28].
Urban freight transport (UFT) experiences critical barriers related to urban contexts [29], financial concerns [30], and stakeholder acceptability [31], with researchers examining the barriers to implementing an Urban Consolidation Center [31,32]. Oliveira et al. [33] assess several UFT barriers, such as congestion, unavailability of unloading areas, identification of unloading areas, merchandise thefts, delivery times, and home delivery failures. The barriers are often mistaken for activity-related problems, and at other times, they are treated as obstacles to operations. The extant research suggests that logistics costs are unproductive and should be reduced [18], and thus, the logistic service providers’ (LSPs) economic competitiveness and performance are affected by the distinct factors and barriers common to urban environments [34]. The barriers influence logistics costs and thus, in this context:
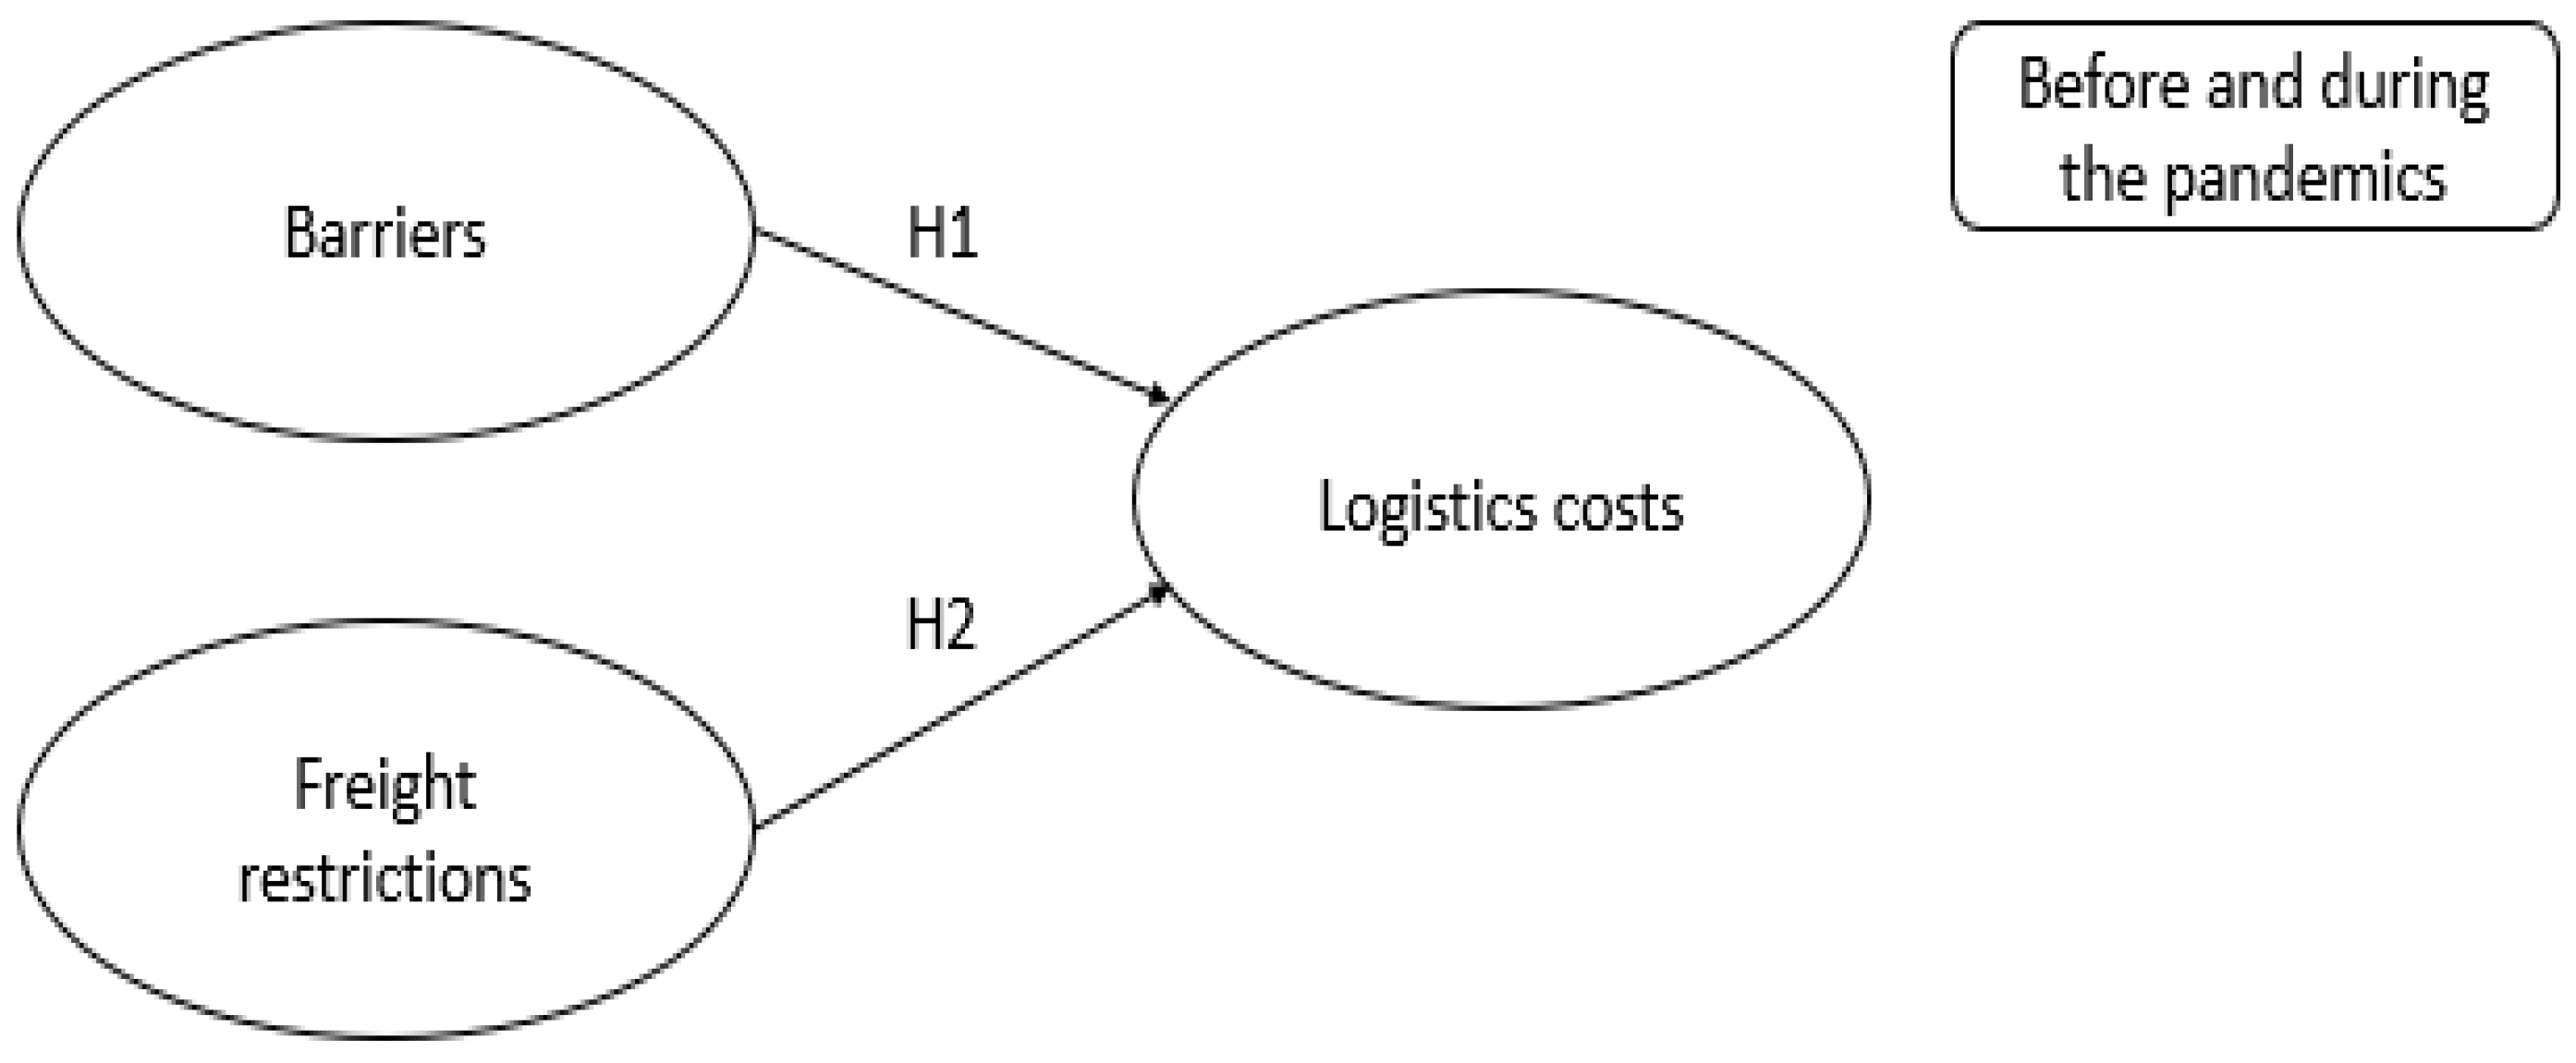
Hypothesis 1 (H1).
Barriers influence logistics costs positively.
Freight policies influence delivery performance and transportation costs directly. In Brazil, such policies have increased congestion due to insufficient loading and unloading spaces for deliveries [33]. However, freight restrictions represent typical Brazilian urban freight policies, affecting supply chains [35]. Freight restrictions can influence transportation capacities negatively, which in turn increase logistics costs [36]. Products must comply with existing regulations, such as those related to the use of refrigerated trucks or to specific industry activities, when loaded by freight vehicles [37]. Freight restrictions should represent a measure of the improvement of the activity’s performance, and yet, Bontempo et al. [35] report that the National Transportation Confederation argues that this measure increases delivery costs. Therefore, freight restrictions represent barriers in some situations. However, we treat it as a consequence of freight policy and thus:
Hypothesis 2 (H2).
Freight restrictions influence logistics costs positively.
Few studies empirically investigated transport flow characteristics during a pandemic before the COVID-19 outbreak because of the very low probability of such an event [38]. However, the influences of the coronavirus on the transport industry and its policy measures have been investigated since [10]. The pandemic has represented an opportunity for logistics service providers (LSPs) to guarantee sufficient resiliency to mitigate the risks caused by negative events [39]. The recovery capacity of the freight transportation was already more robust than that in passenger transportation, but the industry has improved its resilience capacity with the pandemics [37]. The COVID-19 pandemic, however, has had several different influences on the transport industry. Mogaji et al. [40] identify significant effects such as increased costs of transportation, financial sustainability, changes to travel needs, and loss of revenue. Other influences include job losses, reductions to noise pollution [41], reductions to traffic congestion [38], increased non-motorized travel modes [42], a global decline in international commodity trading, and intensified e-commerce deliveries [43]. Hensher et al. [44] suggest that some of these are associated with logistics costs. Considering changes observed during the past few years, the transportation industry’s future has been investigated to discover, for example, how such changes influence companies’ sustainable environmental, social, and financial performance [41]. The profitability of LSPs is usually affected by external factors, such as pandemics and government policies [20]. The pandemic demonstrated that freight transportation must be fast and flexible and able to recover from the negative consequences of events [20] that affect the transportation companies’ financial performance. In this context, we investigate the effect of the COVID-19 pandemic using H1 and H2. Figure 1 shows the current study’s research model, examined before (2018) and during (2020/2021) the COVID-19 pandemic.

3. Research Methods

This section discusses the study’s methodology, comprising the participants, instruments, data collection, and analysis. A survey was administered to 126 Brazilian transportation service provider companies in 2018 and to 120 in 2020. Company owners, CEOs, directors, managers, coordinators, and supervisors completed the survey. The contacts of the professionals working in the participating companies were obtained from a database owned by a research institution that conducts studies on the retail sector.
Measurement items were obtained from the extant studies, especially the research that assesses barriers and freight restrictions [23,31,33,45]. Table 1 reports the constructs of the research model and their descriptions. All the constructs are reflective, and their measurement items, measured using a Likert-type scale that ranged from strongly disagree (1) to strongly agree (5).
The survey was administered over the internet. An invitation was sent to professionals to participate in the study, including an informed consent statement that communicated that the participants authorized the researchers to use their responses anonymously. The questionnaire was sent to respondents in 2018, before the pandemic, and it was sent again to the same respondents during 2020/2021.
Averages and standard deviations were calculated for each measurement item, and a one-way ANOVA was calculated to evaluate whether the professionals’ perceptions differed between 2018 and 2020/2021. Two models were estimated using PLS-SEM, which is appropriate for the current study [47] because it assesses cause-and-effect relationships among constructs, which are usually defined using a set of measurement items [48]. The method was used to assess the effects that barriers and freight restrictions have on logistics costs. The model was estimated using a module for R called PLSPM [49]. Evaluation of the measurement model included the procedures defined by Hair et al. [47], including examining unidimensionality and convergent and discriminant validity.
The traditional criterion for measuring unidimensionality (i.e., internal consistency) is Cronbach’s alpha coefficient, which estimates reliability based on intercorrelations of measurement items and the extent to which a group of indicators estimates a corresponding construct [47]. However, Cronbach’s alpha is conservative, resulting in low reliability values [49]. Another metric that assesses unidimensionality is Dillon–Goldstein’s rho, which assesses the variance of a sum of variables in a block of indicators. The index is a better indicator than Cronbach’s alpha because it considers the extent to which a latent variable explains its indicators [50], prioritizing items by their reliability when estimating a measurement model [47]. Dillon–Goldstein’s rho should be larger than 0.70.
Convergent validity measures how an item correlates with alternative items of the same construct, and therefore, a construct’s items converge or share a high proportion of variance [47]. The outer loadings of measurement items and average variance extracted (AVE) were used to evaluate the convergent validity of the model’s constructs. The outer loadings should be statistically significant and over 0.7, meaning that a latent construct captures more than 50% of the variability of an indicator [49]. Hair et al. [49] recommend that measurement items with very low outer loadings (below 0.40) should be removed from a research model and that indicators with outer loadings between 0.40 and 0.70 should not be removed whenever they contribute to a construct’s content validity. Another method to measure convergent validity is AVE, defined as the sum of the squared loadings divided by the number of items. An AVE of 0.50 or greater indicates that, on average, the construct explains more than half of the variance of its items [51].
Discriminant validity is the extent to which a construct is distinct from other constructs, and thus, the construct captures phenomena not represented by other constructs in the research model [47]. Cross-loadings are used to assess the discriminant validity of the measurement items. When using this method, an item’s outer loading on a construct should be greater than its cross-loadings on other constructs, indicating that the items relate more strongly to their construct than they do to other constructs [52,53].
Structural model analysis involves testing a structural model and verifying the structural relationships represented by a model’s hypotheses. After running the PLS-SEM algorithm, estimates were obtained for the structural model relationships (i.e., the path coefficients), representing the constructs’ hypothesized relationships. Path coefficients can be interpreted as the standardized beta coefficients in a regression equation [47]. The most common measure when evaluating a structural model is the coefficient of determination (R2), which measures a model’s predictive power, calculated as the squared correlation between an endogenous construct and the predicted exogenous variables. A coefficient greater than 0.75 is substantial [47]. A final measure of quality examined in this study was the goodness-of-fit (GoF) index, which accounts for the overall quality of both the measurement and structural models, measuring the overall predictive performance of the research model. GoF was calculated as the geometric mean of the average communality and the average R2 value.

4. Results

Table 2 reports the descriptive characteristics of the companies. We used the same sample of large companies (i.e., more than USD 40 million in annual revenue) during both periods. A difference was observed in the number of respondents between 2018 and 2020/2021; some small companies that participated in the survey in 2018 did not complete the questionnaire in 2020/2021. Some smaller companies also increased their annual revenues between the periods. With this varied sample of companies, the assessments provided similar results regarding UFT planning.
Table 3 reports the descriptive results obtained in 2018 and 2020/2021. The averages and standard deviations are reported for each measurement item. A one-way ANOVA was calculated to evaluate whether the professionals’ perceptions differed between 2018 and 2020/2021. The last column of Table 3 reports the p-values, which show that for several items, the professionals’ perceptions of the assessed constructs differed between 2018 and 2020/2021, suggesting that the pandemic changed the perceptions these professionals have on such items. A significant difference was observed for items with p-values of less than 0.05. Four of the six items for the barriers construct, 8 of the 9 items for the freight restrictions construct, and 4 of the 7 items for the logistics costs construct had significant differences before and during the pandemic, according to the results of the one-way ANOVAs, as reported in Table 3.

4.1. Evaluation of the Measurement Model

Harman’s single-factor test was calculated to assess the common method variance (CMV), a procedure to assess whether a single factor accounted for variance in the data. The indicators for each construct are loaded onto a factor to assess whether a single factor is evident, resulting in the majority of the covariance among the measures [54]. The first unrotated factor accounted for 19% of variance, lower than the threshold of 50% [54], and thus, no single factor was evident, suggesting that CMV was not an issue.
Table 4 reports the results of the unidimensionality tests. Nearly all of the DG Rho values were greater than 0.70, with one item just over 0.60, but still acceptable [47]. During the convergent validity tests, the indicator BAR6 was removed as its outer loading did not achieve the minimum threshold of 0.4. The AVE values reported in Table 4 are greater than, or very close to, the acceptable cutoff value.
Regarding discriminant validity, the results suggest that each item’s outer loading was greater than any of its cross-loadings on other constructs. The results of the Fornell–Larcker criterion also suggest that each construct associates most strongly with its indicators, rather than the other constructs. The square root of the AVE was greater than the inter-construct correlations (Table 5), suggesting that the model demonstrated sufficient discriminant validity.
The GoF index measures the quality of the measurement and structural models, using the values of communality and R2 to predict a model’s performance. The GoF indices of 0.684 (68.4%) for 2018 and 0.669 (66.9%) for 2020/2021 were calculated, exceeding the lower threshold of 0.36 [53].

4.2. Evaluation of the Structural Model

Figure 2 shows the path coefficients and R2 calculated for the structural model for 2018 and 2020/2021.
Non-parametric bootstrapping was used to assess the precision of the PLS parameter estimates. The results reported in Table 6 suggest that all the path coefficients were significant during the bootstrapping test (p-values < 0.0001). The hypotheses were supported by the results for both before and during the COVID-19 pandemic.
As reported in Table 6, the strength of the relationship between the barriers and the logistics costs reduced slightly between 2018 and 2020/2021. However, the strength of the relationship between the freight restrictions and the logistics costs increased substantially during the pandemic. Urban traffic and congestion patterns were significantly different before the pandemic [38]; with less traffic due to lockdown measures, congestion reduced, thus reducing the logistics costs. The effects caused by the freight restrictions on the logistics costs during the pandemic were greater. Some restrictions, such as a lack of information and the fees associated with freight vehicle circulation, increased the logistics costs.

5. Discussion

This study suggests that barriers and freight restrictions influence logistics costs positively, extending the extant research [23,33]. It identifies the effects of the freight restrictions on the logistics costs, which increase during pandemics, and it addresses the calls for research that investigates the influence of mobility restrictions during pandemics and their relationships with mobility and transportation [21].
It is evident that barriers influence operations and consequently increase the logistics costs. The literature suggests negative influences of congestion on UFT operations, reducing deliveries and increasing emissions [55,56]. Lack of unloading areas increases both the distances travelled for parking [57,58] and illegal parking [59]. In Brazil, we add theft of goods as a UFT barrier. Flora et al. [60] report theft of goods as a social influence on UFT, and Guerin et al. [61] argue that such thefts influence the UFT’s reliability, increasing logistics costs. Addressing these barriers contributes to creating an urban environment that is conducive to UFT, but the question of who should deal with such barriers remains unanswered, which future research should examine.
The findings also suggest that freight policies influence logistics costs, especially those that restrict freight vehicle movement. Governments should thus analyze the pros and cons of a freight policy before implementation in order to contribute to economic and sustainable development. However, such analysis is atypical in Brazil. For example, circulation restriction measures are beneficial to the environment if associated with low-emission zones as they force fleet renewal. What occurs in Brazil is the inverse; restrictions on freight vehicles are a means of favoring the displacement of private cars, contributing to a cycle in which those who have the right to vote are privileged, as Dablanc [62] argues, and Woudsma [63] corroborates.
The current study contributes to both the theory and the practice. For researchers, this study compares the effects that barriers and freight restrictions have on logistics costs before and during a pandemic. Similar relationships have not been studied. This study also proposes measurement items that should be used to assess barriers, freight restrictions, and logistics costs in future studies. It adds to the extant literature that investigates the effects of the COVID-19 pandemic on transportation. This study also contributes to managers and policymakers, especially those who work in emerging economies such as Brazil. During the outbreak, several countries were offered monetary incentives to deal with the social and economic disruptions [43]. Lack of data in developing countries makes urban freight transport planning challenging [33]. Brazil has an inadequate basic infrastructure that increases companies’ logistics costs. Reducing or eliminating some of the barriers assessed in this study would decrease logistics costs and support the increasing demand for freight transportation. The regulations are essential for ensuring logistics providers’ profitability and reducing logistic costs [20].
This study also contributes to managers, with findings suggesting that barriers and freight restrictions influence logistics costs, regardless of context. Agents involved with urban freight transportation should thus discuss alternatives to the current planning. Kijewska and Jedlinski [64] suggest freight quality partnerships as measures that involve stakeholders when searching for sustainable solutions that are attractive to all. Being aware of the barriers and restrictions that influence logistics costs and of how the pandemic increased the effects of some of these restrictions is essential to managers who are seeking to make timely and appropriate decisions and who both plan and implement initiatives to prevent or reduce costs. For example, some initiatives might involve collaborations with supply chain partners through shared transportation and processing facilities to reduce logistics costs [65] and allow appropriate vehicle selection for transportation efficiency [66].

6. Conclusions

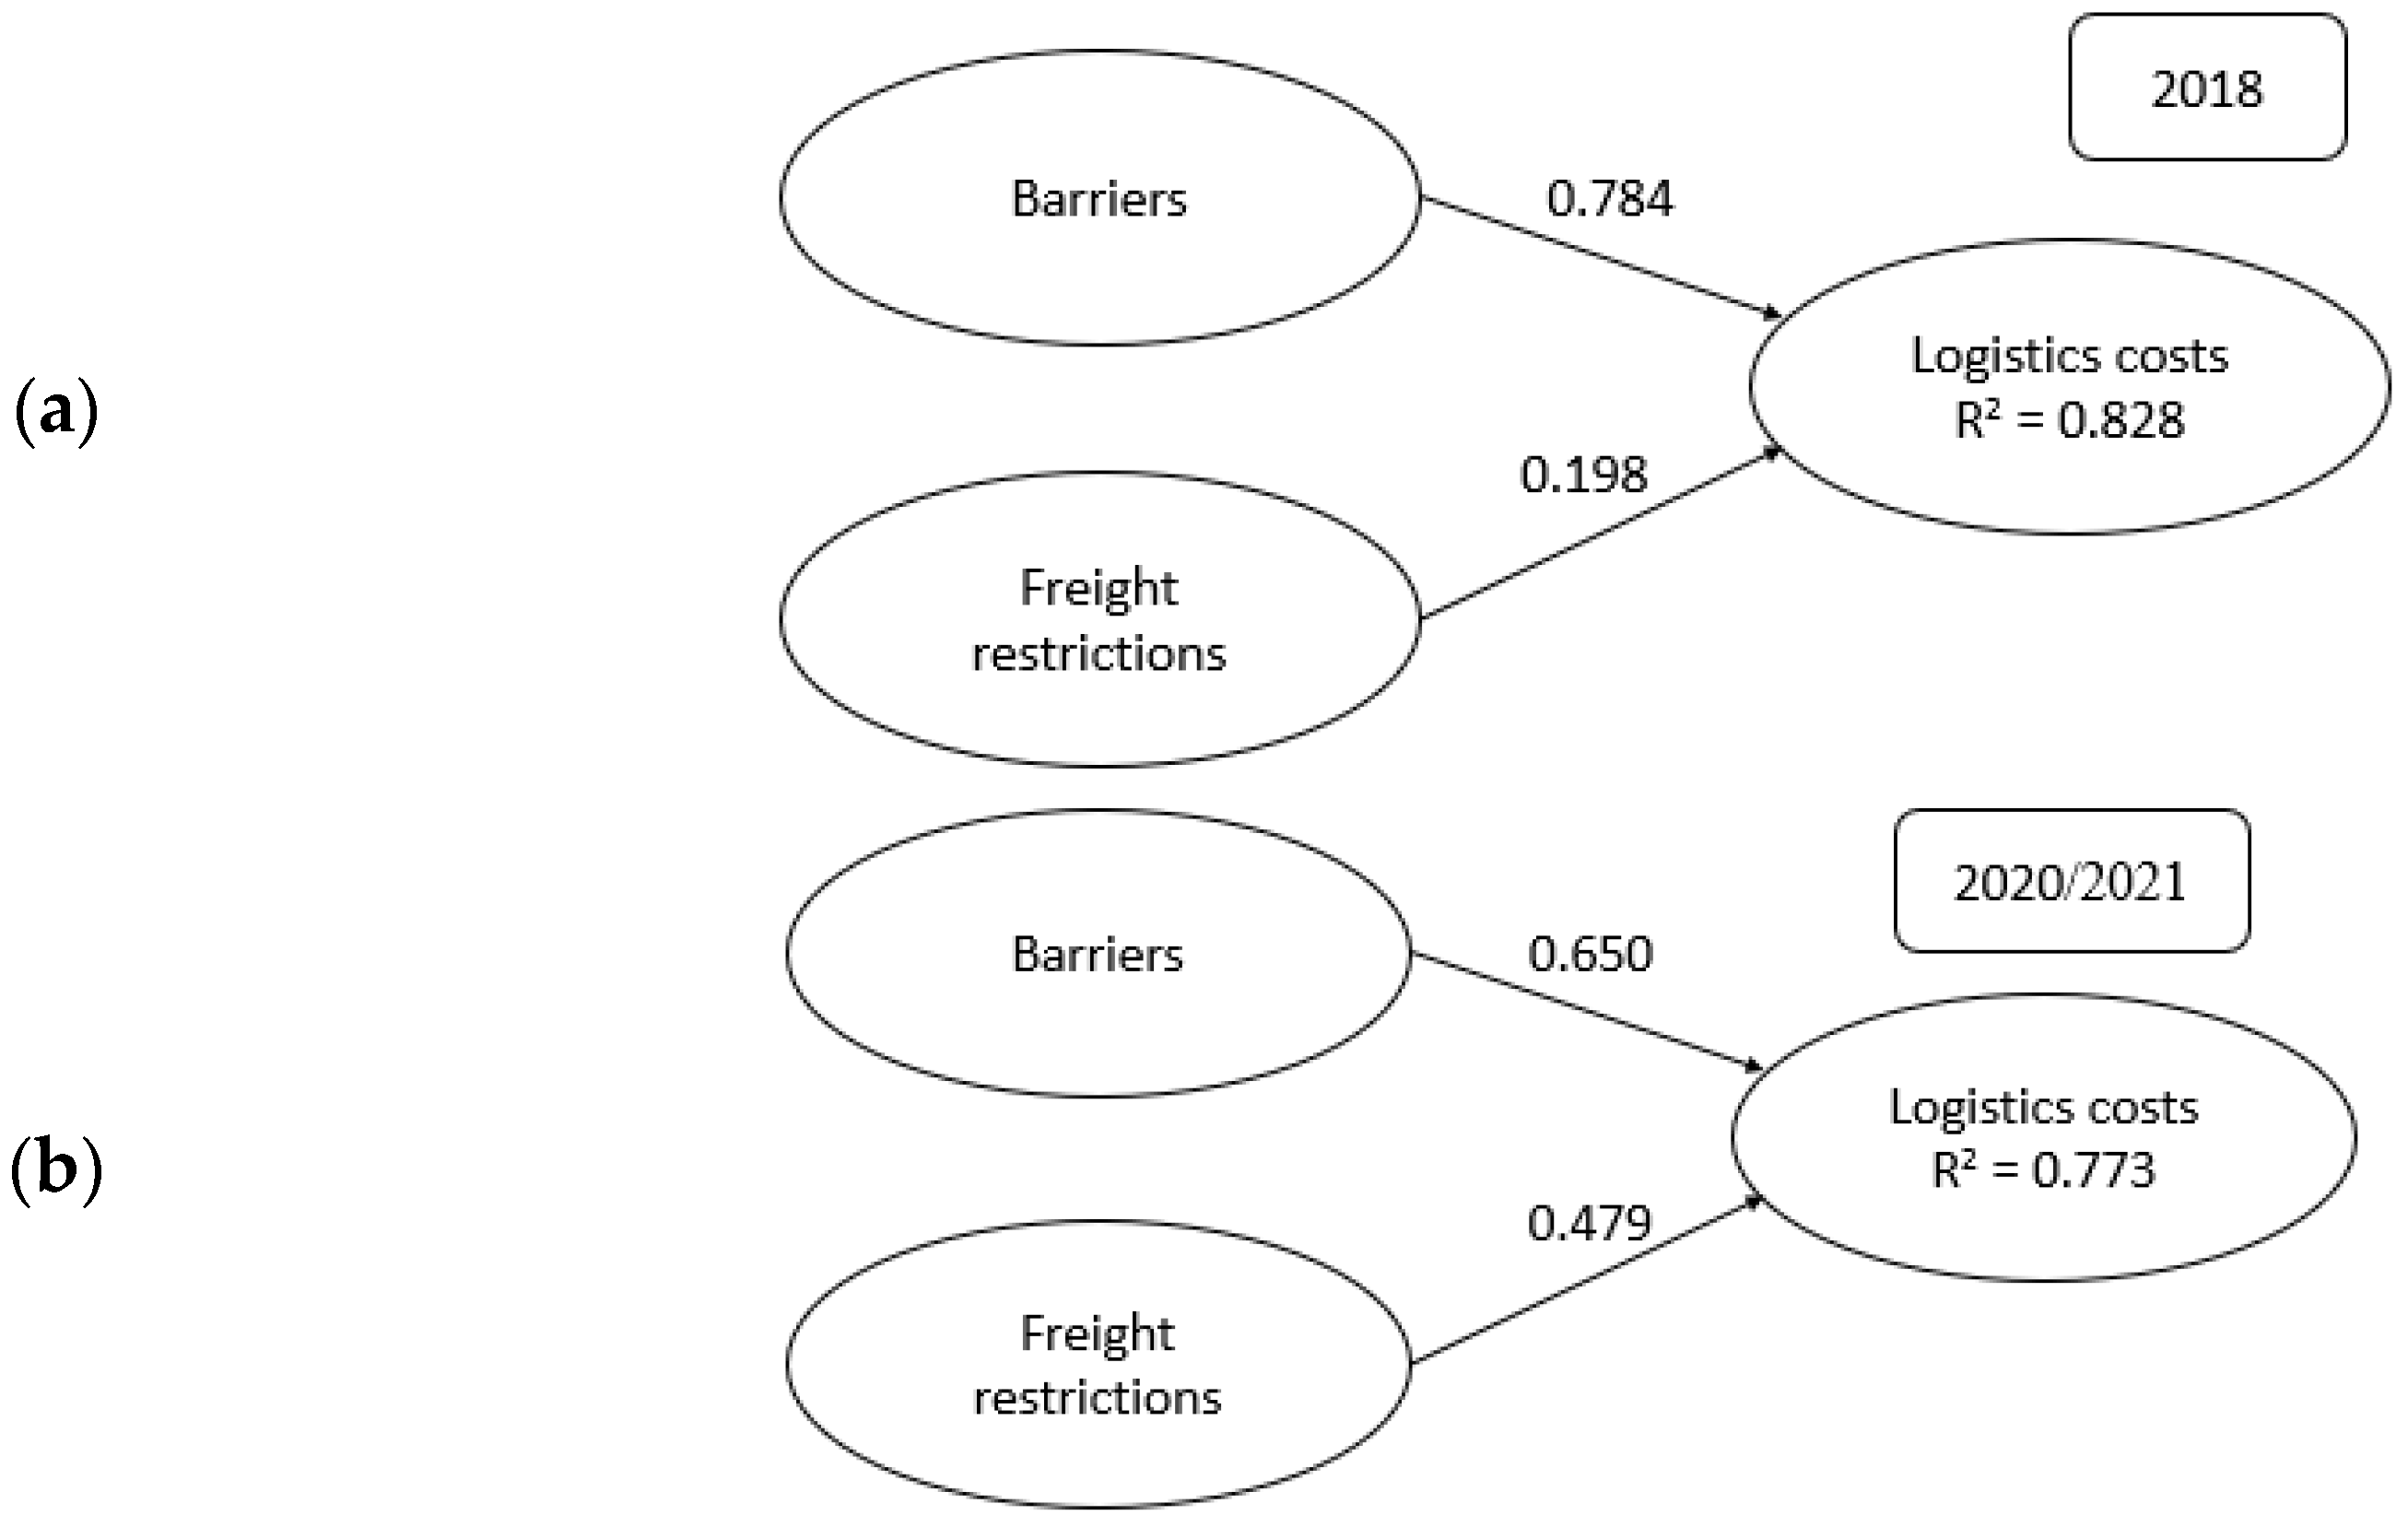
We investigated the effects that the barriers and the freight restrictions had on logistics costs both before and during the COVID-19 pandemic. Survey items were identified based on a literature review, and they were evaluated by more than 120 transportation provider companies in Brazil in 2018 and 2020/2021. This study suggests that barriers and freight restrictions influence logistics costs positively, and it found that the effects of the freight restrictions on the logistics costs increased dramatically during the pandemic. In contrast, the barrier effects reduced slightly during the outbreak.

Limitations and Future Work

This study used only a quantitative method; using qualitative methods, such as interviews or focus groups, would help with understanding the effects of pandemics on the relationship between the barriers and both the freight restrictions and the logistics costs. Future research should use analyses other than PLS-SEM to investigate such effects. This study was conducted in Brazil, and although its findings extend to other countries, especially those with emerging economies, differences might be observed across countries due to the particularities of their transportations systems. This study assesses specific types of barriers and freight restrictions. A thorough literature review was conducted as part of this study, but assessing more types might produce alternative findings. This study’s sample size was sufficient to draw conclusions, but using a larger sample would allow more specific analyses concerning, for example, company size or the transportation of specific products.
This study suggests opportunities for future research. The extant studies found relationships between transportation costs and their environmental and social influences [67]. Future studies should expand such research by assessing the effects that barriers and freight restrictions have on sustainability. Some freight restrictions, such as mitigating contamination, incentives for cleaner vehicles, route optimizations, and sharing freight, might have positive effects on sustainable outcomes, but other restrictions might influence the environment negatively. Initiatives that improve freight fluidity might, thus, reduce the environmental influences on the logistics and transportation industry [28].
As freight restrictions vary across countries, future research should explore the research model assessed in this study in other regions and countries to evaluate whether the same magnitude of effects is observed. The research suggests that COVID-19 produced disparate effects in transportation systems worldwide. For example, in Europe a greater shift from public to active transportation was evident due to lifestyles, governmental policies, and campaigns that favored bicycle lanes and citizens’ health. In other countries, such as South Korea and the United States, greater car use was evident, reflecting car-dependent lifestyles and a lower popularity of active transport [10]. Thus, these cultural and political factors might influence the relationships investigated in this study.
COVID-19 changed companies’ businesses on various levels. Regarding cargo transportation, lockdowns contributed to the growth of electronic commerce, which consequently changed the consumption patterns. However, research is still lacking on the trends in post-pandemic freight transportation. The pandemic revealed the fragility of some supply chains, including the need to investigate sustainable and contactless delivery modes. We therefore recommend investigating post-pandemic consumer behaviors.
The pandemic will not vanish abruptly, and protective measures will likely be necessary during longer intermediate phases. The changes that occurred during the pandemic appear to be permanent, such as increases to e-commerce, teleworking, and online classes. The effects on the transportation systems will similarly endure, and thus, future research should include longitudinal studies that assess the relationships investigated in this study over longer periods.

Author Contributions

Conceptualization, P.R.d.S. and L.K.d.O.; methodology, P.R.d.S., M.W.B. and L.K.d.O.; software, M.W.B.; validation, P.R.d.S., M.W.B. and L.K.d.O.; formal analysis, P.R.d.S., M.W.B. and L.K.d.O.; investigation, P.R.d.S., M.W.B. and L.K.d.O.; data curation, P.R.d.S., M.W.B. and L.K.d.O.; writing—original draft preparation, P.R.d.S., M.W.B. and L.K.d.O.; writing—review and editing, P.R.d.S., M.W.B. and L.K.d.O.; funding acquisition, P.R.d.S., M.W.B. and L.K.d.O. All authors have read and agreed to the published version of the manuscript.

Funding

This study was funded by the National Council for Scientific and Technological Development (CNPq), grant number 303171/2020-0. The APC was funded by Fundação Dom Cabral.

Institutional Review Board Statement

Not applicable.

Informed Consent Statement

Not applicable.

Data Availability Statement

The data presented in this study are available on request from the corresponding author.

Conflicts of Interest

The authors declare no conflict of interest.

References

  1. Tittonell, P.; Fernandez, M.; El Mujtar, V.E.; Preiss, P.V.; Sarapura, S.; Laborda, L.; Mendonça, M.A.; Alvarez, V.E.; Fernandes, G.B.; Petersen, P.; et al. Emerging responses to the COVID-19 crisis from family farming and the agroecology movement in Latin America—A rediscovery of food, farmers and collective action. Agric. Syst. 2021, 190, 103098. [Google Scholar] [CrossRef]
  2. Ladeira, M.B.; de Oliveira, M.P.V.; de Sousa, P.R.; Barbosa, M.W. Firm’s supply chain agility enabling resilience and performance in turmoil times. Int. J. Agil. Syst. Manag. 2021, 14, 224. [Google Scholar] [CrossRef]
  3. Xu, Z.; Elomri, A.; Kerbache, L.; El Omri, A. Impacts of COVID-19 on Global Supply Chains: Facts and Perspectives. IEEE Eng. Manag. Rev. 2020, 48, 153–166. [Google Scholar] [CrossRef]
  4. Chowdhury, P.; Paul, S.K.; Kaisar, S.; Moktadir, M.A. COVID-19 pandemic related supply chain studies: A systematic review. Transp. Res. Part E Logist. Transp. Rev. 2021, 148, 102271. [Google Scholar] [CrossRef] [PubMed]
  5. Nikitas, A.; Tsigdinos, S.; Karolemeas, C.; Kourmpa, E.; Bakogiannis, E. Cycling in the era of COVID-19: Lessons learnt and best practice policy recommendations for a more bike-centric future. Sustainability 2021, 13, 4620. [Google Scholar] [CrossRef]
  6. Gurbuz, I.B.; Ozkan, G. Transform or Perish: Preparing the Business for a Postpandemic Future. IEEE Eng. Manag. Rev. 2020, 48, 139–145. [Google Scholar] [CrossRef]
  7. Singh, S.; Kumar, R.; Panchal, R.; Tiwari, M.K. Impact of COVID-19 on logistics systems and disruptions in food supply chain. Int. J. Prod. Res. 2021, 59, 1993–2008. [Google Scholar] [CrossRef]
  8. Gray, R.S. Agriculture, transportation, and the COVID-19 crisis. Can. J. Agric. Econ. 2020, 68, 239–243. [Google Scholar] [CrossRef] [Green Version]
  9. Sharma, H.B.; Vanapalli, K.R.; Cheela, V.S.; Ranjan, V.P.; Jaglan, A.K.; Dubey, B.; Goel, S.; Bhattacharya, J. Challenges, opportunities, and innovations for effective solid waste management during and post COVID-19 pandemic. Resour. Conserv. Recycl. 2020, 162, 105052. [Google Scholar] [CrossRef]
  10. Zhang, J.; Hayashi, Y.; Frank, L.D. COVID-19 and transport: Findings from a world-wide expert survey. Transp. Policy 2021, 103, 68–85. [Google Scholar] [CrossRef]
  11. Chiaramonti, D.; Maniatis, K. Security of supply, strategic storage and Covid19: Which lessons learnt for renewable and recycled carbon fuels, and their future role in decarbonizing transport? Appl. Energy 2020, 271, 115216. [Google Scholar] [CrossRef] [PubMed]
  12. Castillo, C.; Viu-Roig, M.; Alvarez-Palau, E.J. COVID-19 lockdown as an opportunity to rethink urban freight distribution: Lessons from the Barcelona metropolitan area. Transp. Res. Interdiscip. Perspect. 2022, 14, 100605. [Google Scholar] [CrossRef] [PubMed]
  13. Choi, T.M. Risk analysis in logistics systems: A research agenda during and after the COVID-19 pandemic. Transp. Res. Part E Logist. Transp. Rev. 2021, 145, 102190. [Google Scholar] [CrossRef]
  14. Atayah, O.F.; Dhiaf, M.M.; Najaf, K.; Frederico, G.F. Impact of COVID-19 on financial performance of logistics firms: Evidence from G-20 countries. J. Glob. Oper. Strateg. Sourc. 2021, 15, 172–196. [Google Scholar] [CrossRef]
  15. Juliet Orji, I.; Ojadi, F.; Kalu Okwara, U. The nexus between e-commerce adoption in a health pandemic and firm performance: The role of pandemic response strategies. J. Bus. Res. 2022, 145, 616–635. [Google Scholar] [CrossRef]
  16. Kučera, T. Logistics cost calculation of implementation warehouse management system: A case study. MATEC Web Conf. 2017, 134, 28. [Google Scholar] [CrossRef] [Green Version]
  17. Kučera, T.; Chocholáč, J. Outsourcing as an Innovative Approach to Logistics Services of Warehousing: A Case Study. In Proceedings of the 10th International Days of Statistics and Economics: Conference Proceedings, Melandrium, Prague, Czech Republic, 8–10 September 2016; pp. 996–1005. [Google Scholar]
  18. Kucera, T. Application of the activity-based costing to the logistics cost calculation for warehousing in the automotive industry. Commun. Sci. Lett. Univ. Žilina 2019, 21, 35–42. [Google Scholar] [CrossRef]
  19. Illahi, U.; Mir, M.S. Maintaining efficient logistics and supply chain management operations during and after coronavirus (COVID-19) pandemic: Learning from the past experiences. Environ. Dev. Sustain. 2021, 23, 11157–11178. [Google Scholar] [CrossRef]
  20. Gonzalez, J.N.; Camarero-Orive, A.; González-Cancelas, N.; Guzman, A.F. Impact of the COVID-19 pandemic on road freight transportation—A Colombian case study. Res. Transp. Bus. Manag. 2022, 43, 100802. [Google Scholar] [CrossRef]
  21. Kartal, M.T.; Depren, Ö.; Kiliç Depren, S. The relationship between mobility and COVID-19 pandemic: Daily evidence from an emerging country by causality analysis. Transp. Res. Interdiscip. Perspect. 2021, 10, 100366. [Google Scholar] [CrossRef]
  22. Vannoni, M.; McKee, M.; Semenza, J.C.; Bonell, C.; Stuckler, D. Using volunteered geographic information to assess mobility in the early phases of the COVID-19 pandemic: A cross-city time series analysis of 41 cities in 22 countries from March 2nd to 26th 2020. Global. Health 2020, 16, 1–9. [Google Scholar] [CrossRef] [PubMed]
  23. Oliveira, L.K.; Barraza, B.; Bertocini, B.V.; Isler, C.A.; Pires, D.R.; Madalon, E.C.N.; Lima, J.; Vieira, J.G.V.; Meira, L.H.; Bracarense, L.S.F.P.; et al. An overview of problems and solutions for urban freight transport in Brazilian cities. Sustainability 2018, 10, 1233. [Google Scholar] [CrossRef] [Green Version]
  24. Marinho, P.R.D.; Cordeiro, G.M.; Coelho, H.F.C.; Brandão, S.C.S. COVID-19 in Brazil: A sad scenario. Cytokine Growth Factor Rev. 2020, 58, 51–54. [Google Scholar] [CrossRef] [PubMed]
  25. Joshi, T.; Mainali, R.P.; Marasini, S.; Acharya, K.P.; Adhikari, S. Nepal at the edge of sword with two edges: The COVID-19 pandemics and sustainable development goals. J. Agric. Food Res. 2021, 4, 100138. [Google Scholar] [CrossRef]
  26. May, A.D.; Kelly, C.; Shepherd, S. The principles of integration in urban transport strategies. Transp. Policy 2006, 13, 319–327. [Google Scholar] [CrossRef] [Green Version]
  27. Banister, D. Overcoming barriers to the implementation of sustainable transport. In Barriers to Sustainable Transport; Rietveld, P., Stough, R.T., Eds.; Spon Press: London, UK, 2005. [Google Scholar]
  28. Cedillo-Campos, M.G.; Piña-Barcenas, J.; Pérez-González, C.M.; Mora-Vargas, J. How to measure and monitor the transportation infrastructure contribution to logistics value of supply chains? Transp. Policy 2022, 120, 120–129. [Google Scholar] [CrossRef]
  29. Lindholm, M.; Behrends, S. Challenges in urban freight transport planning—A review in the Baltic Sea Region. J. Transp. Geogr. 2012, 22, 129–136. [Google Scholar] [CrossRef]
  30. Lindholm, M. A sustainable perspective on urban freight transport: Factors affecting local authorities in the planning procedures. Procedia Soc. Behav. Sci. 2010, 2, 6205–6216. [Google Scholar] [CrossRef] [Green Version]
  31. Nordtømme, M.E.; Bjerkan, K.Y.; Sund, A.B. Barriers to urban freight policy implementation: The case of urban consolidation center in Oslo. Transp. Policy 2015, 44, 179–186. [Google Scholar] [CrossRef]
  32. Leonardi, J.; Browne, M.; Allen, J.; Bohne, S.; Ruesch, M. Best Practice Factory for Freight Transport in Europe: Demonstrating how ‘Good’ Urban Freight Cases are Improving Business Profit and Public Sectors Benefits. Procedia Soc. Behav. Sci. 2014, 125, 84–98. [Google Scholar] [CrossRef] [Green Version]
  33. de Oliveira, L.; Nascimento, C.O.; de Sousa, P.R.; de Resende, P.T.V.; da Silva, F.G.F. Transport service provider perception of barriers and urban freight policies in Brazil. Sustainability 2019, 11, 6890. [Google Scholar] [CrossRef] [Green Version]
  34. Bachofner, M.; Lemardelé, C.; Estrada, M.; Pagès, L. City logistics: Challenges and opportunities for technology providers. J. Urban Mobil. 2022, 2, 100020. [Google Scholar] [CrossRef]
  35. Bontempo, A.P.; Cunha, C.B.; Botter, D.A.; Yoshizaki, H.T.Y. Evaluating Restrictions on the Circulation of Freight Vehicles in Brazilian Cities. Procedia Soc. Behav. Sci. 2014, 125, 275–283. [Google Scholar] [CrossRef] [Green Version]
  36. Shirazi, H.; Kia, R.; Ghasemi, P. A stochastic bi-objective simulation–optimization model for plasma supply chain in case of COVID-19 outbreak. Appl. Soft Comput. 2021, 112, 107725. [Google Scholar] [CrossRef] [PubMed]
  37. Fu, X.; Qiang, Y.; Liu, X.; Jiang, Y.; Cui, Z.; Zhang, D.; Wang, J. Will multi-industry supply chains’ resilience under the impact of COVID-19 pandemic be different? A perspective from China’s highway freight transport. Transp. Policy 2022, 118, 165–178. [Google Scholar] [CrossRef]
  38. Li, J.; Xu, P.; Li, W. Urban road congestion patterns under the COVID-19 pandemic: A case study in Shanghai. Int. J. Transp. Sci. Technol. 2021, 10, 212–222. [Google Scholar] [CrossRef]
  39. Gultekin, B.; Demir, S.; Gunduz, M.A.; Cura, F.; Ozer, L. The logistics service providers during the COVID-19 pandemic: The prominence and the cause-effect structure of uncertainties and risks. Comput. Ind. Eng. 2022, 165, 107950. [Google Scholar] [CrossRef]
  40. Mogaji, E.; Adekunle, I.; Aririguzoh, S.; Oginni, A. Dealing with impact of COVID-19 on transportation in a developing country: Insights and policy recommendations. Transp. Policy 2022, 116, 304–314. [Google Scholar] [CrossRef] [PubMed]
  41. Nundy, S.; Ghosh, A.; Mesloub, A.; Albaqawy, G.A.; Alnaim, M.M. Impact of COVID-19 pandemic on socio-economic, energy-environment and transport sector globally and sustainable development goal (SDG). J. Clean. Prod. 2021, 312, 127705. [Google Scholar] [CrossRef]
  42. Simić, V.; Ivanović, I.; Đorić, V.; Torkayesh, A.E. Adapting Urban Transport Planning to the COVID-19 Pandemic: An Integrated Fermatean Fuzzy Model. Sustain. Cities Soc. 2022, 79, 103669. [Google Scholar] [CrossRef]
  43. Rothengatter, W.; Zhang, J.; Hayashi, Y.; Nosach, A.; Wang, K.; Oum, T.H. Pandemic waves and the time after COVID-19—Consequences for the transport sector. Transp. Policy 2021, 110, 225–237. [Google Scholar] [CrossRef] [PubMed]
  44. Hensher, D.A.; Wei, E.; Beck, M.J.; Balbontin, C. The impact of COVID-19 on cost outlays for car and public transport commuting—The case of the Greater Sydney Metropolitan Area after three months of restrictions. Transp. Policy 2021, 101, 71–80. [Google Scholar] [CrossRef]
  45. Oliveira, L.K.; Sousa, L.T.M.; Nascimento, C.O.L.; Silva, T.G.C.; Pinto, P.H.G.; Garcia, M.N.; Farias, L.P.; Ferreira, S.; Oliveira, R.L.M.; Jesus, M.C.R. Sustainable City Logistics Planning: Methods and Applications; Awasthi, A., Ed.; Nova Science Publishers: New York, NY, USA, 2020; Volume 2. [Google Scholar]
  46. Muha, R. An overview of the problematic issues in logistics cost management. Pomorstvo 2019, 33, 102–109. [Google Scholar] [CrossRef]
  47. Hair, J.F.; Hult, G.T.M.; Ringle, C.M.; Sarstedt, M. A Primer on Partial Least Squares Structural Equation Modeling (PLS-SEM), 2nd ed.; Sage Publications: Los Angeles, CA, USA, 2017. [Google Scholar]
  48. Barbosa, M.W.; Cansino, J.M. A Water Footprint Management Construct in Agri-Food Supply Chains: A Content Validity Analysis. Sustainability 2022, 14, 4928. [Google Scholar] [CrossRef]
  49. Sanchez, G. PLS Path Modeling with R; Elsevier: Berkeley, CA, USA, 2013. [Google Scholar]
  50. Tenenhaus, M.; Vinzi, V.E.; Chatelin, Y.M.; Lauro, C. PLS path modeling. Comput. Stat. Data Anal. 2005, 48, 159–205. [Google Scholar] [CrossRef]
  51. Fornell, C.; Larcker, D.F. Evaluating structural equation models with unobservable variables and measurement error. J. Mark. Res. 1981, 18, 39–50. [Google Scholar] [CrossRef]
  52. Wamba, S.F.; Gunasekaran, A.; Akter, S.; Ren, S.J.; Dubey, R.; Childe, S.J. Big data analytics and firm performance: Effects of dynamic capabilities. J. Bus. Res. 2016, 70, 356–365. [Google Scholar] [CrossRef] [Green Version]
  53. Barbosa, M.W.; Ladeira, M.B.; de Sousa, P.R.; de Oliveira, M.P.V. Supply chain collaboration and organizational performance: The effects of big data analytics capabilities, technological dynamism and competitive intensity. Int. J. Bus. Environ. 2022, 13. [Google Scholar] [CrossRef]
  54. Tehseen, S.; Ramayah, T.; Sajilan, S. Testing and Controlling for Common Method Variance: A Review of Available Methods. J. Manag. Sci. 2017, 4, 142–168. [Google Scholar] [CrossRef]
  55. Figliozzi, M.A. The impacts of congestion on commercial vehicle tour characteristics and costs. Transp. Res. Part E Logist. Transp. Rev. 2010, 46, 496–506. [Google Scholar] [CrossRef]
  56. Figliozzi, M.A. The impacts of congestion on time-definitive urban freight distribution networks CO2 emission levels: Results from a case study in Portland, Oregon. Transp. Res. Part C Emerg. Technol. 2011, 19, 766–778. [Google Scholar] [CrossRef]
  57. Dalla Chiara, G.; Goodchild, A. Do commercial vehicles cruise for parking? Empirical evidence from Seattle. Transp. Policy 2020, 97, 26–36. [Google Scholar] [CrossRef]
  58. Lizbetin, J.; Bartuska, L. The issue of addressing the lack of parking spaces for road freight transport in cities—A case study. Open Eng. 2020, 10, 209–215. [Google Scholar] [CrossRef]
  59. dos Santos Junior, J.L.; de Oliveira, L.K. Analysis of the level of service of unloading zones using diversity measures in a multiplex network. Sustainability 2020, 12, 4330. [Google Scholar] [CrossRef]
  60. Flora, M.; Ewbank, H.; Vidal Vieira, J.G. Framework for urban freight transport analysis in medium-sized cities. Urbe—Rev. Bras. Gestão Urbana 2019, 11, 1–12. [Google Scholar] [CrossRef]
  61. Guerin, L.; Vieira, J.G.V.; de Oliveira, R.L.M.; de Oliveira, L.K.; de Miranda Vieira, H.E.; Dablanc, L. The geography of warehouses in the São Paulo Metropolitan Region and contributing factors to this spatial distribution. J. Transp. Geogr. 2021, 91, 102976. [Google Scholar] [CrossRef]
  62. Dablanc, L. Goods transport in large European cities: Difficult to organize, difficult to modernize. Transp. Res. Part A Policy Pract. 2007, 41, 280–285. [Google Scholar] [CrossRef]
  63. Woudsma, C. Freight transportation: The evolving landscape of matters and models. Pract. Spat. Anal. Essays Mem. Profr. Pavlos Kanaroglou 2018, 187–201. [Google Scholar] [CrossRef]
  64. Kijewska, K.; Jedliński, M. The concept of Urban Freight Transport Projects durability and its assessment within the framework of a Freight Quality Partnership. Sustainability 2018, 10, 2226. [Google Scholar] [CrossRef] [Green Version]
  65. Pomponi, F.; Fratocchi, L.; Tafuri, S.R. Trust development and horizontal collaboration in logistics: A theory based evolutionary framework. Supply Chain Manag. An Int. J. 2015, 20, 83–97. [Google Scholar] [CrossRef]
  66. Marusak, A.; Sadeghiamirshahidi, N.; Krejci, C.C.; Mittal, A.; Beckwith, S.; Cantu, J.; Morris, M.; Grimm, J. Resilient Regional Food Supply Chains and Rethinking the Way Forward: Key Takeaways from the COVID-19 Pandemic. Agric. Syst. 2021, 190, 103101. [Google Scholar] [CrossRef]
  67. Goodarzian, F.; Ghasemi, P.; Gunasekaren, A.; Taleizadeh, A.A.; Abraham, A. A sustainable-resilience healthcare network for handling COVID-19 pandemic. Ann. Oper. Res. 2021, 312, 761–825. [Google Scholar] [CrossRef] [PubMed]
Figure 1. Research model.
Sustainability 14 08650 g001
Figure 2. (a) Before COVID-19 pandemic (2018); (b) during COVID-19 pandemic (2020).
Sustainability 14 08650 g002
Table 1. Construct operationalization.
ConstructDescriptionReferences
BarriersBarriers related to urban freight transport reduce its efficiency.Nordtømme, Bjerkan, and Sund [31]; Oliveira et al. [33]; Oliveira et al. [23]; Oliveira et al. [45]
Freight restrictionsFreight restriction is a freight policy to reduce the freight vehicles in the urban context.Bontempo et al. [35]
Logistics costsIt is defined as all expenses for moving goods in the urban context.Muha [46]
Table 2. Descriptive sample based on annual revenues—in number of companies.
Annual Revenues (in USD Millions)20182020/2021
Number of RespondentsPercentageNumber of RespondentsPercentage
<105241.3%3831.7%
10.01–201814.3%1714.2%
20.01–4086.3%1714.2%
40.01–100129.5%1210.0%
100.01–10001814.3%1815.0%
>10001814.3%1815.0%
Table 3. Descriptive results.
ConstructsItem IDItem Description20182020/2021p-Value (ANOVA)
AvgStDev.AvgStDev.
BarriersBAR1Public policies that restrict the freight vehicles’ movements are a problem with impacts on UFT.4.900.374.580.641.30 × 10−6
BAR2Congestion is a problem with impacts on UFT.4.880.374.550.679.8 × 10−10
BAR3The unavailability of loading and unloading places is a problem with impacts on UFT.4.910.314.940.270.436
BAR4Poor signage of loading and unloading places is a problem with impacts on UFT.4.020.374.230.530.0003
BAR5Goods theft is a problem with impacts on UFT.4.930.264.960.200.447
BAR6The need for more vehicles and teams to meet the daily demand for urban delivery is a problem impacting on UFT.4.030.254.500.521.56 × 10−17
Freight restrictionsFRE1The lack of information is recurrent concerning the restriction of the circulation of cargo vehicles in urban areas.4.020.244.660.482.65 × 10−30
FRE2There is no planning for the implementation of restrictions on freight vehicle movements in urban areas.4.900.334.930.250.332
FRE3I perceive a lack of data to support the implementation of the restriction of freight vehicle movements in urban areas.4.020.324.190.440.00051
FRE4There are many types of restrictions on freight vehicle movements in urban areas.4.010.324.620.493.47 × 10−25
FRE5The restriction has a significant impact on the cost of urban distribution.4.060.324.350.534.31 × 10−7
FRE6The company implemented an additional delivery fee to address the difficulty of performing delivery in some areas to balance the operational costs of last-mile deliveries.3.940.494.190.660.000937
FRE7My company implemented the traffic restriction fee to address the operational costs of urban freight transport.3.960.414.220.610.000108
FRE8Traffic restriction has a direct impact on the emission of pollutants and noise.3.980.424.430.506.22 × 10−13
FRE9There are no channels that allow the participation of logistics operators in the formulation and evaluation of freight restriction policies in urban areas.4.020.453.680.651.37 × 10−6
Logistics costsLCO1Purchasing vehicles to meet restrictions in urban centers has a high cost for urban goods distribution.4.890.404.930.360.365
LCO2The rent (or purchase) of the specific warehouse for UFT is a high cost for the company.4.060.304.340.491.32 × 10−7
LCO3The labor cost of the employees involved in UFT is high for the company.4.870.514.940.240.136
LCO4The overtime of employees involved in UFT is a high cost for the company.4.020.434.770.423.59 × 10−32
LCO5The expense of fines arising from circulation in places prohibited by restriction is significant for the company.4.630.644.780.420.057
LCO6Fuel expenditure is a high cost for the company.4.900.334.950.250.160
LCO7The need for more vehicles and teams to meet the demand during the pandemic represents a high cost for the company.4.070.294.830.385.79 × 10−46
Table 4. Unidimensionality test results and average variance extracted.
ConstructsDG RhoAVE
20182020/202120182020/2021
BAR0.84191830.74005190.62778750.6538816
FRE0.89348240.74844520.58769420.5988152
LCO0.76286260.66195550.49280790.4913520
Note: BAR (Barriers); FRE (Freight restrictions); LCO (Logistics costs).
Table 5. Loadings.
Table 5. Loadings.
Constructs20182020
BARFRELCOBARFRELCO
BAR0.791 0.809
FRE0.5560.767 0.1960.774
LCO0.6950.6350.7020.6430.6060.701
Note: BAR (Barriers); FRE (Freight restrictions); LCO (Logistics costs).
Table 6. Path coefficients and p-values for the structural model.
RelationshipHypothesis No.20182020/2021
Path CoefficientsBootstrapping Results (p-Values)Path CoefficientsBootstrapping Results (p-Values)Hypothesis Supported?
BAR LCOH1—Direct effect0.784p < 0.00010.650p < 0.0001Yes
FRE LCOH2—Direct effect0.198p < 0.00010.479p < 0.0001Yes
Note: BAR (Barriers); FRE (Freight restrictions); LCO (Logistics costs).
Publisher’s Note: MDPI stays neutral with regard to jurisdictional claims in published maps and institutional affiliations.

