
Lung Spatial Profiling Reveals a T Cell Signature in COPD Patients with Fatal SARS-CoV-2 Infection

 , , , , , , and
Abstract
:1. Introduction
2. Materials and Methods
2.1. Study Population
2.2. Spatial Gene and Protein Profiling
2.3. Immunofluorescence Staining
2.4. Statistics
3. Results
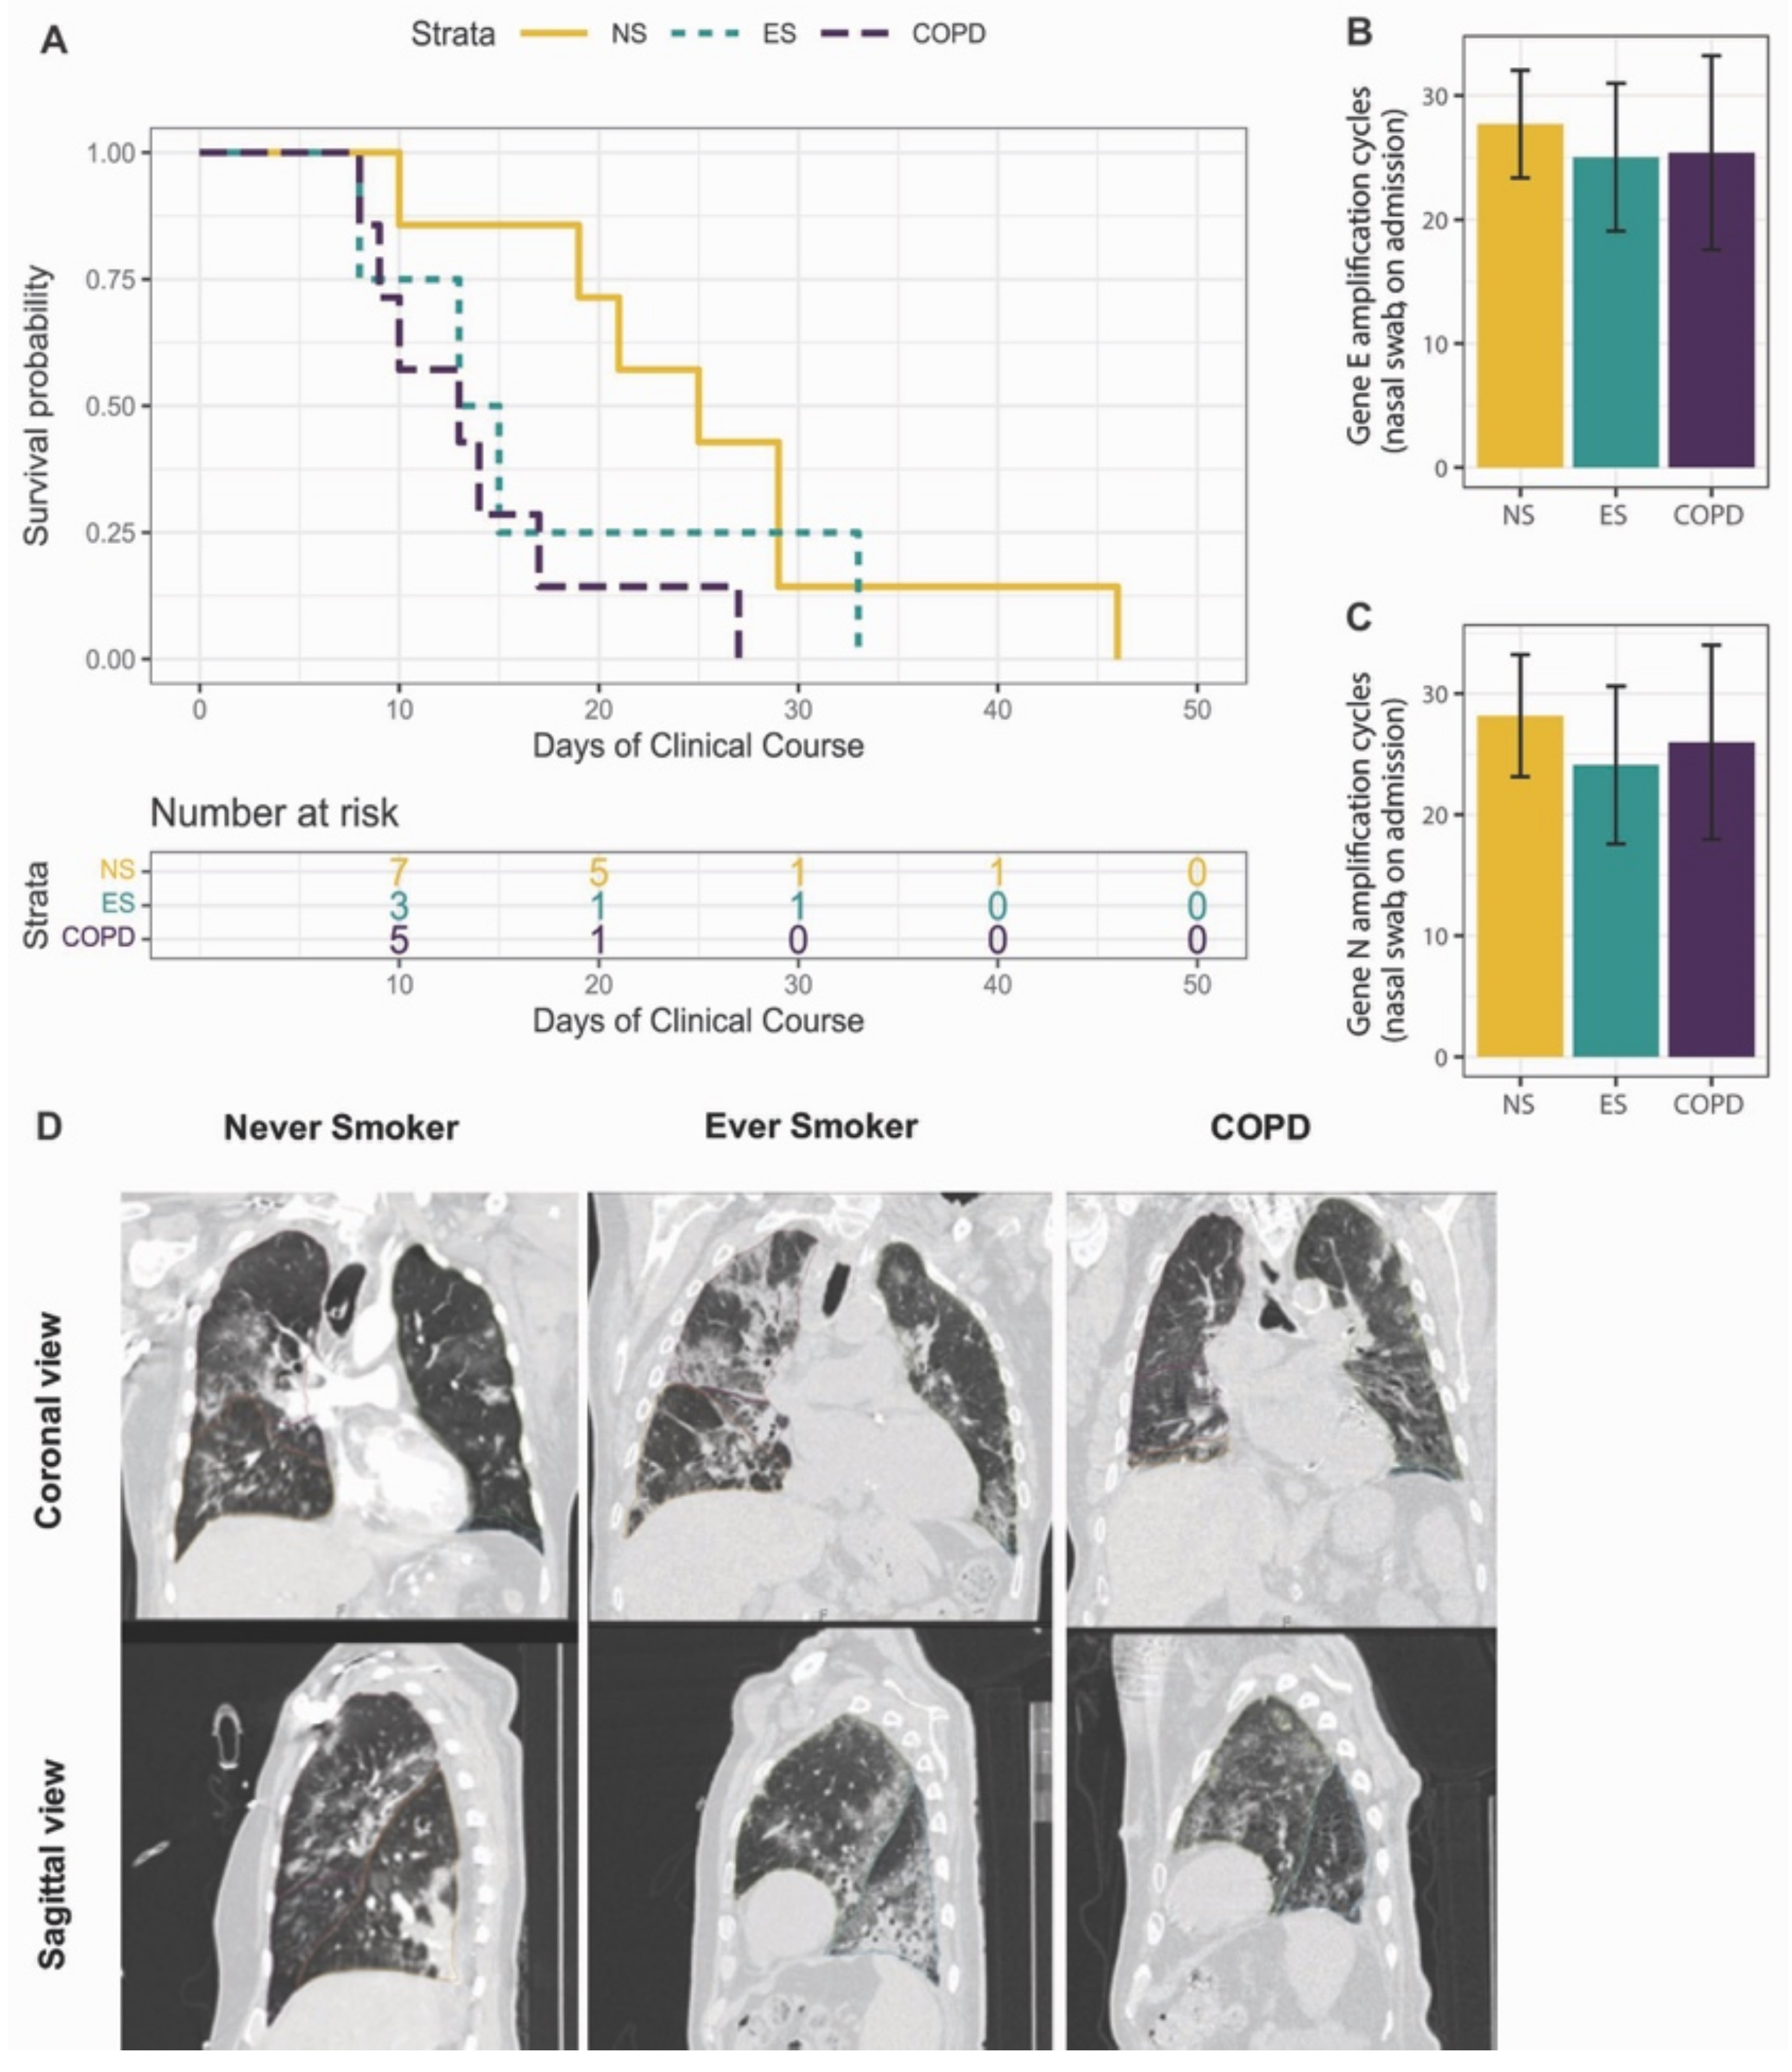
3.1. Study Cohort
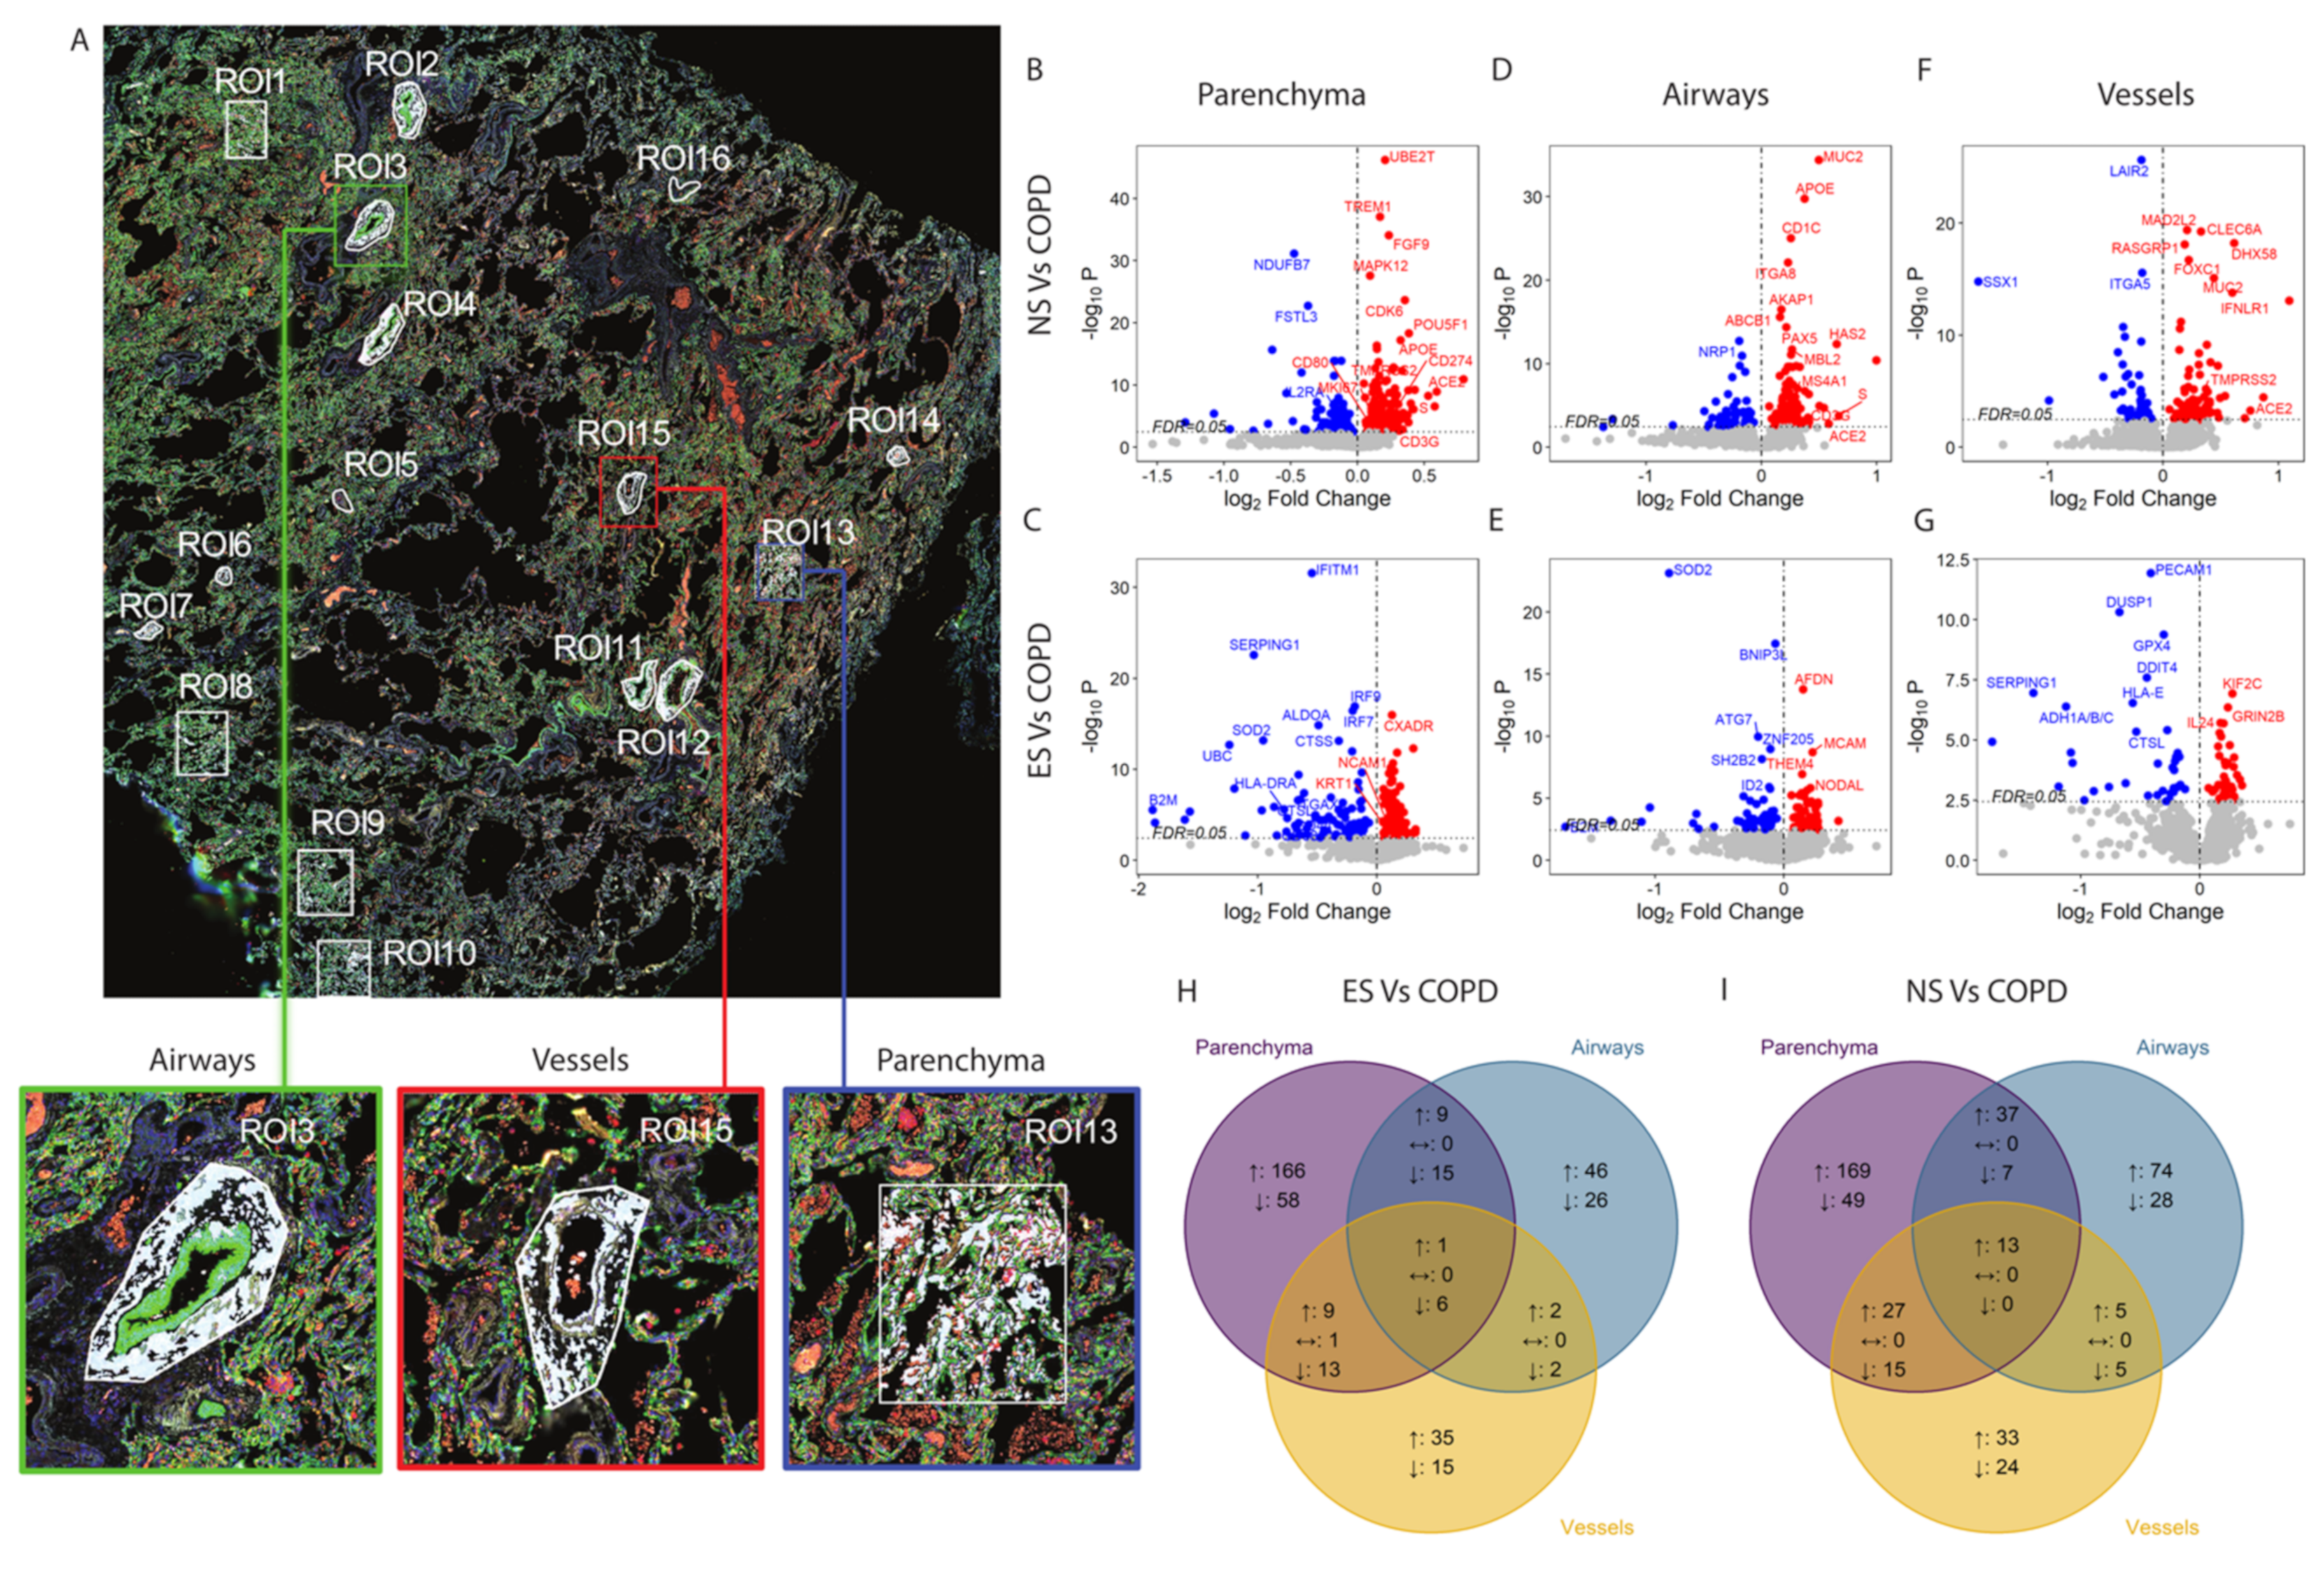
3.2. Spatial Transcriptomic Profiling of Immune Response Genes in COVID-19
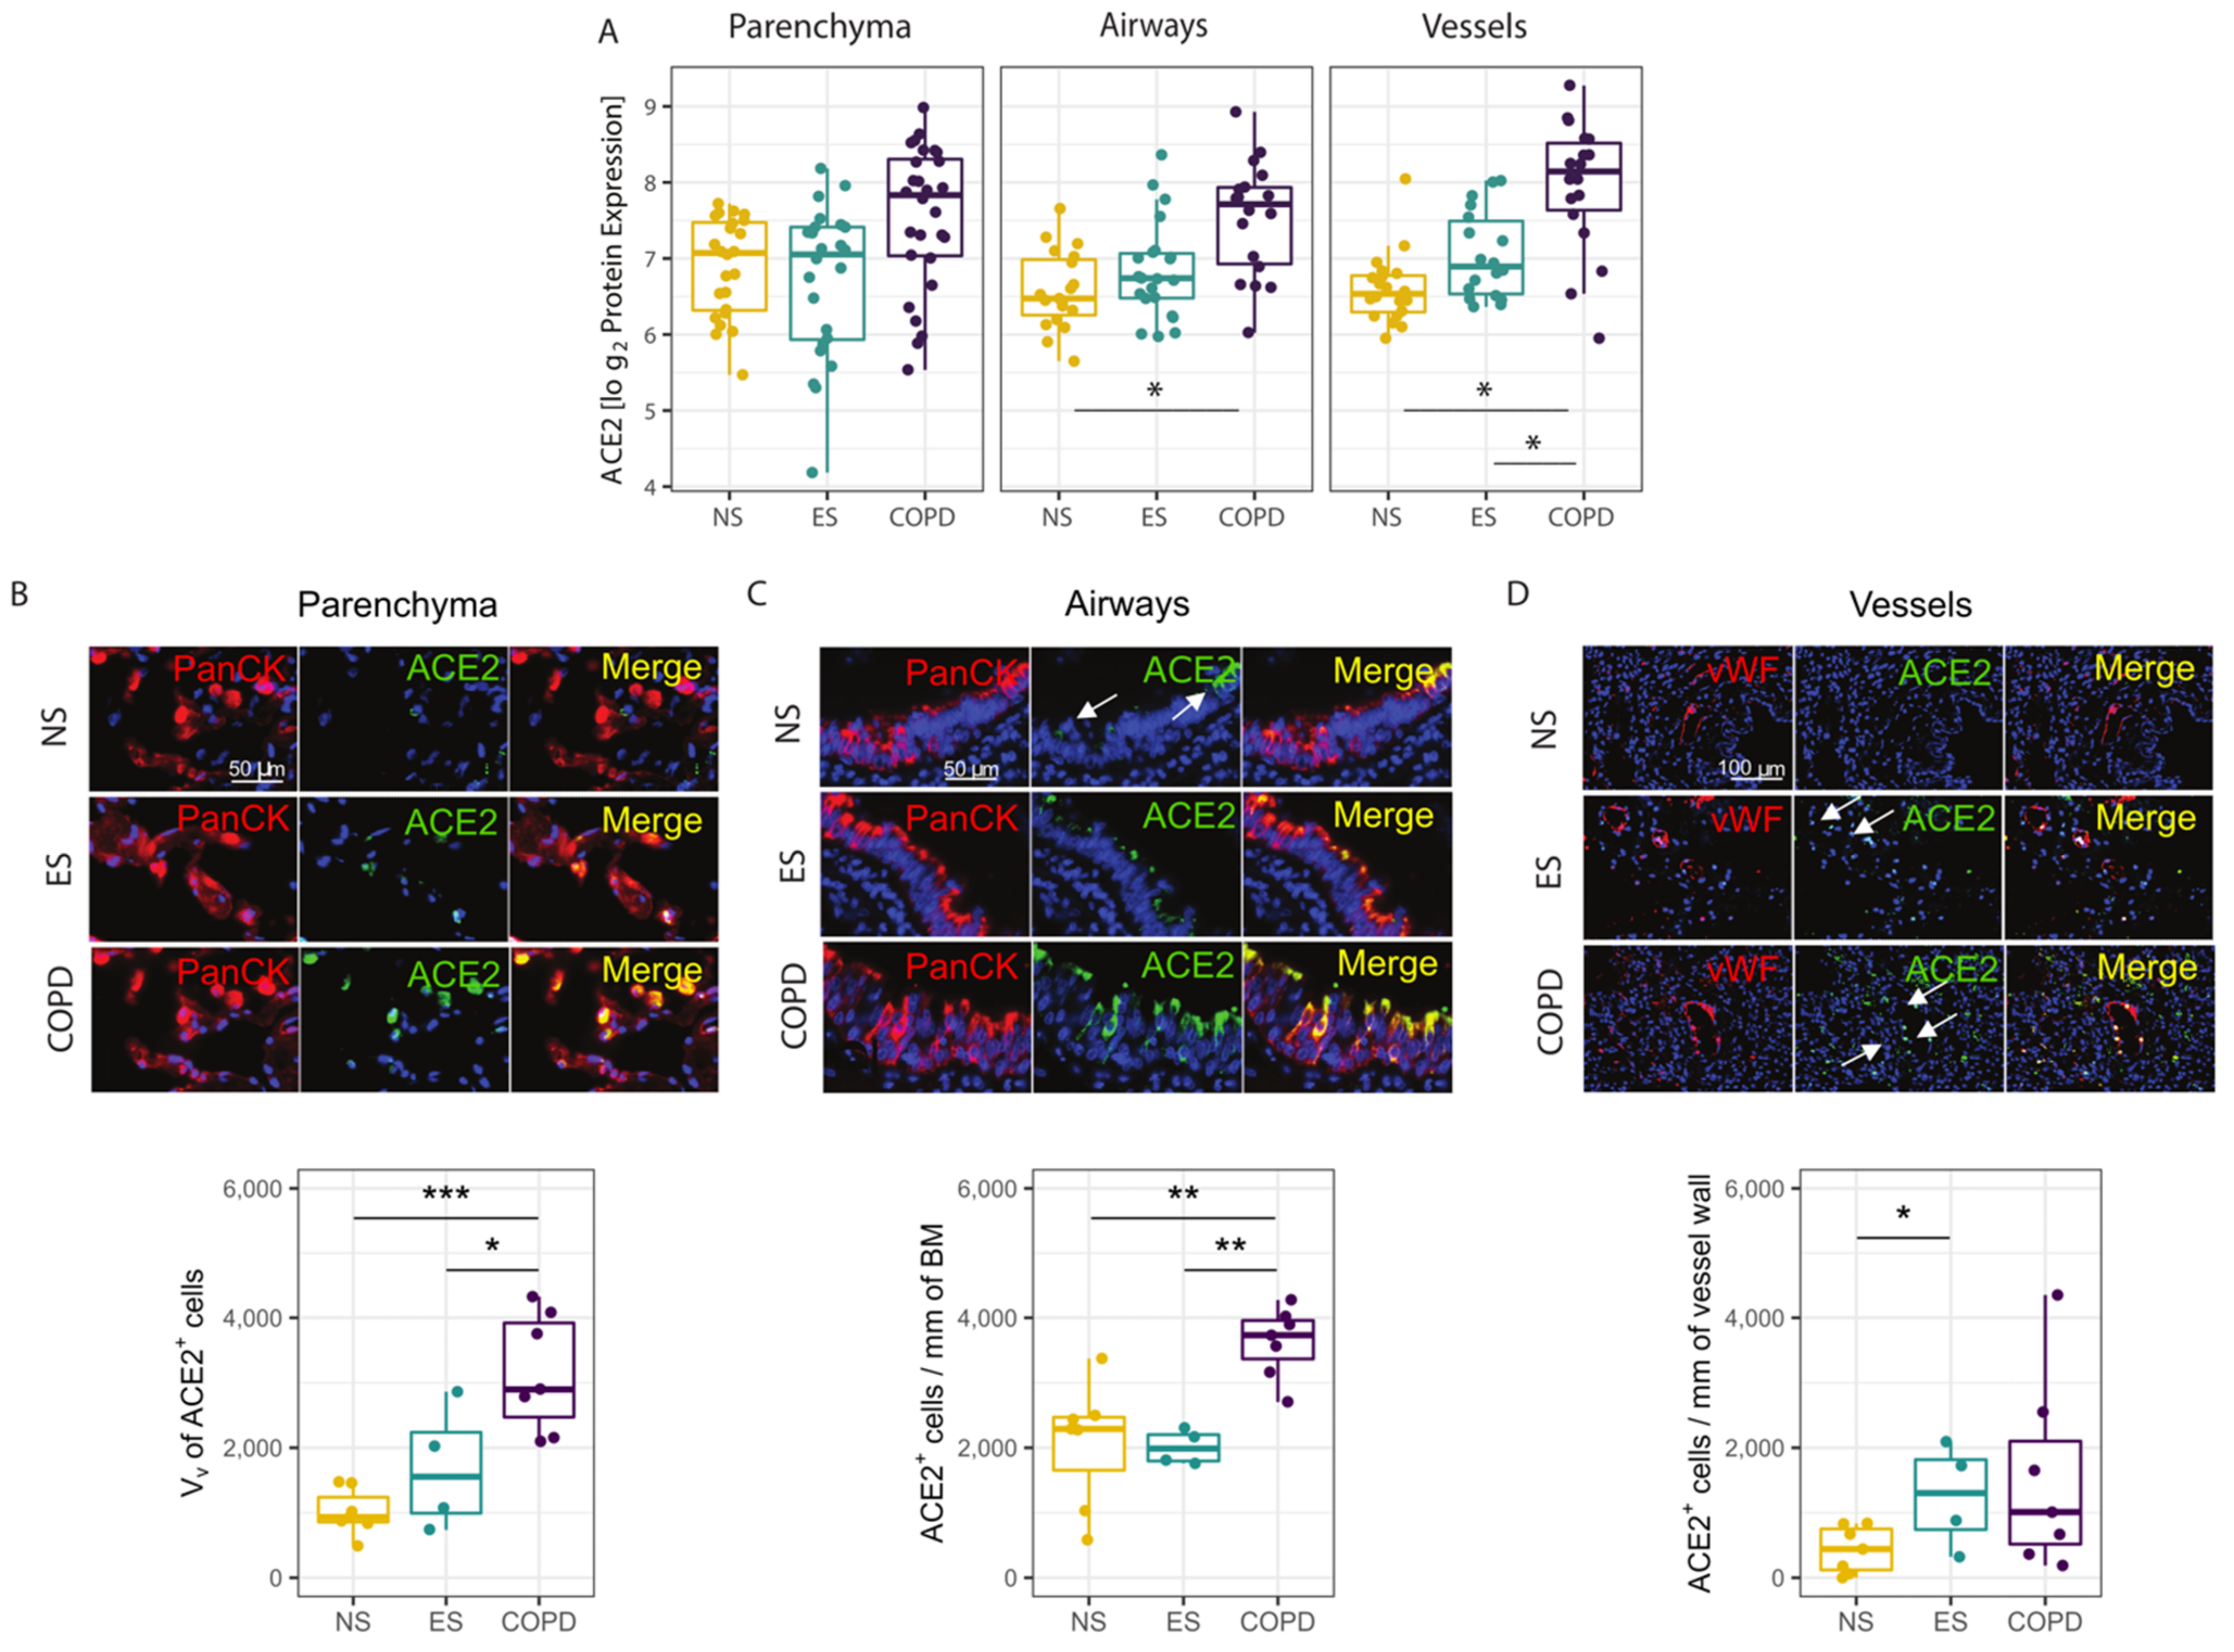
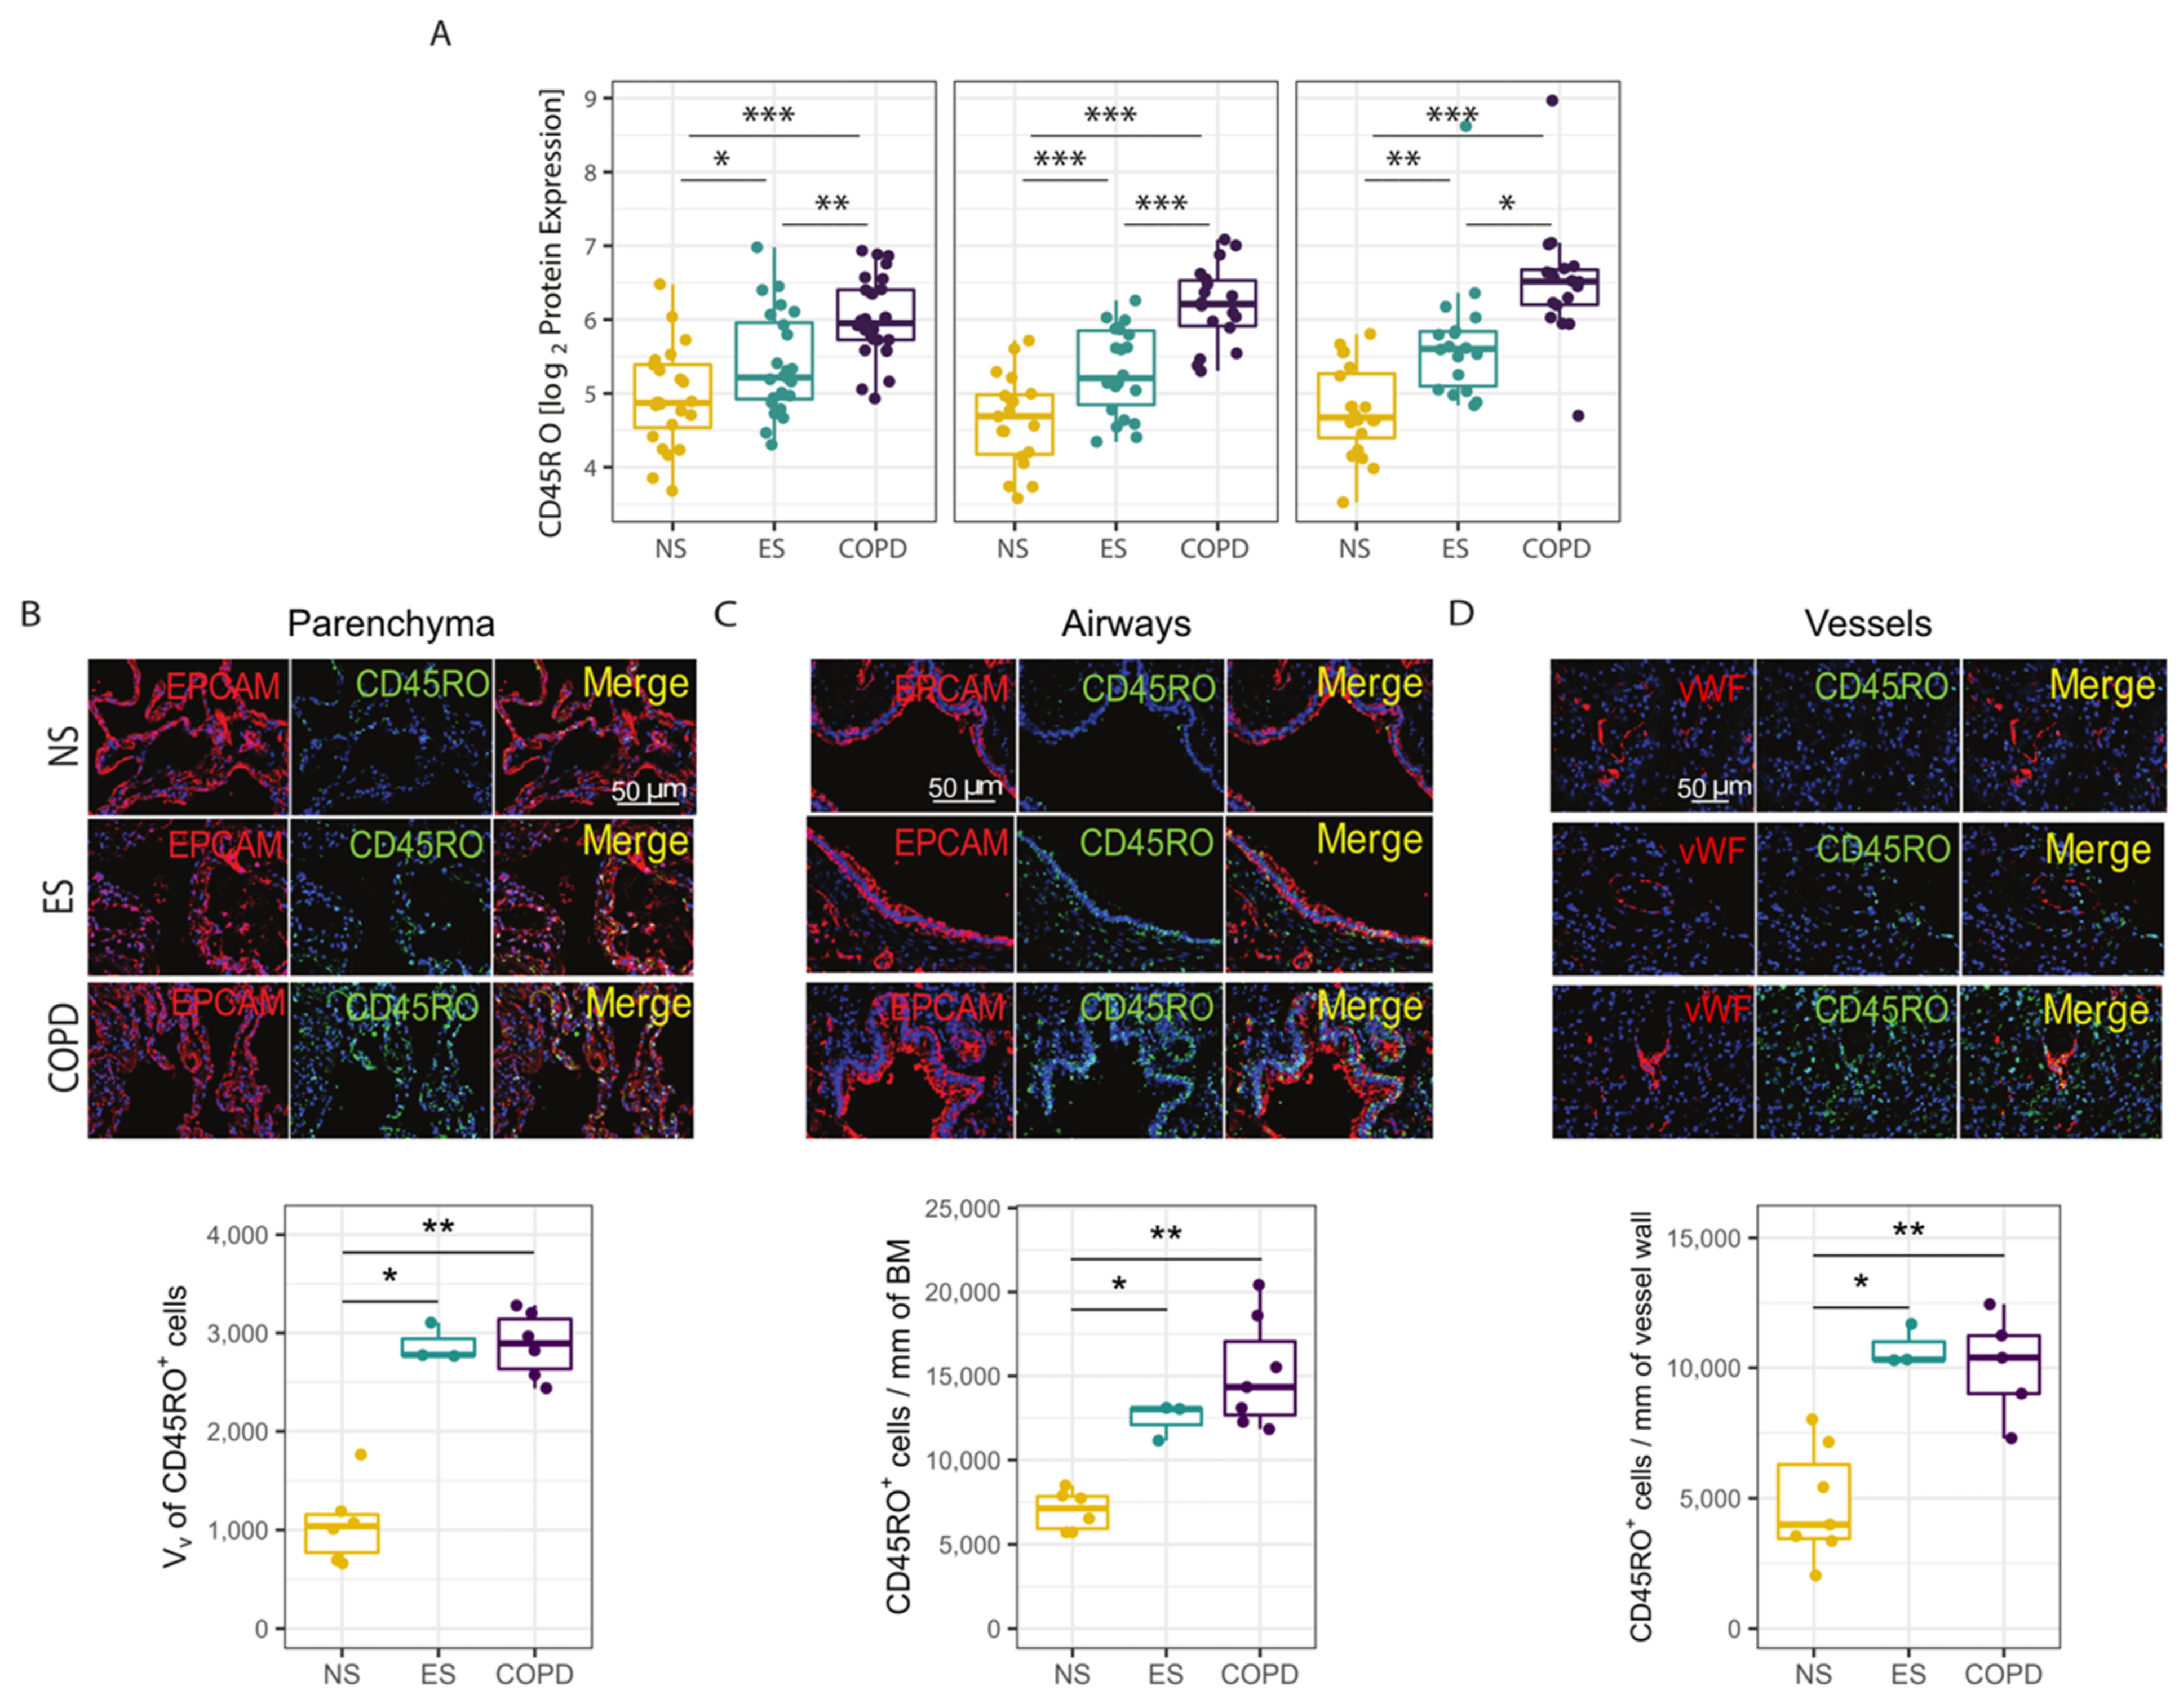
3.3. Protein Validation of Transcriptomic Profile in Parenchyma, Airways and Vessels
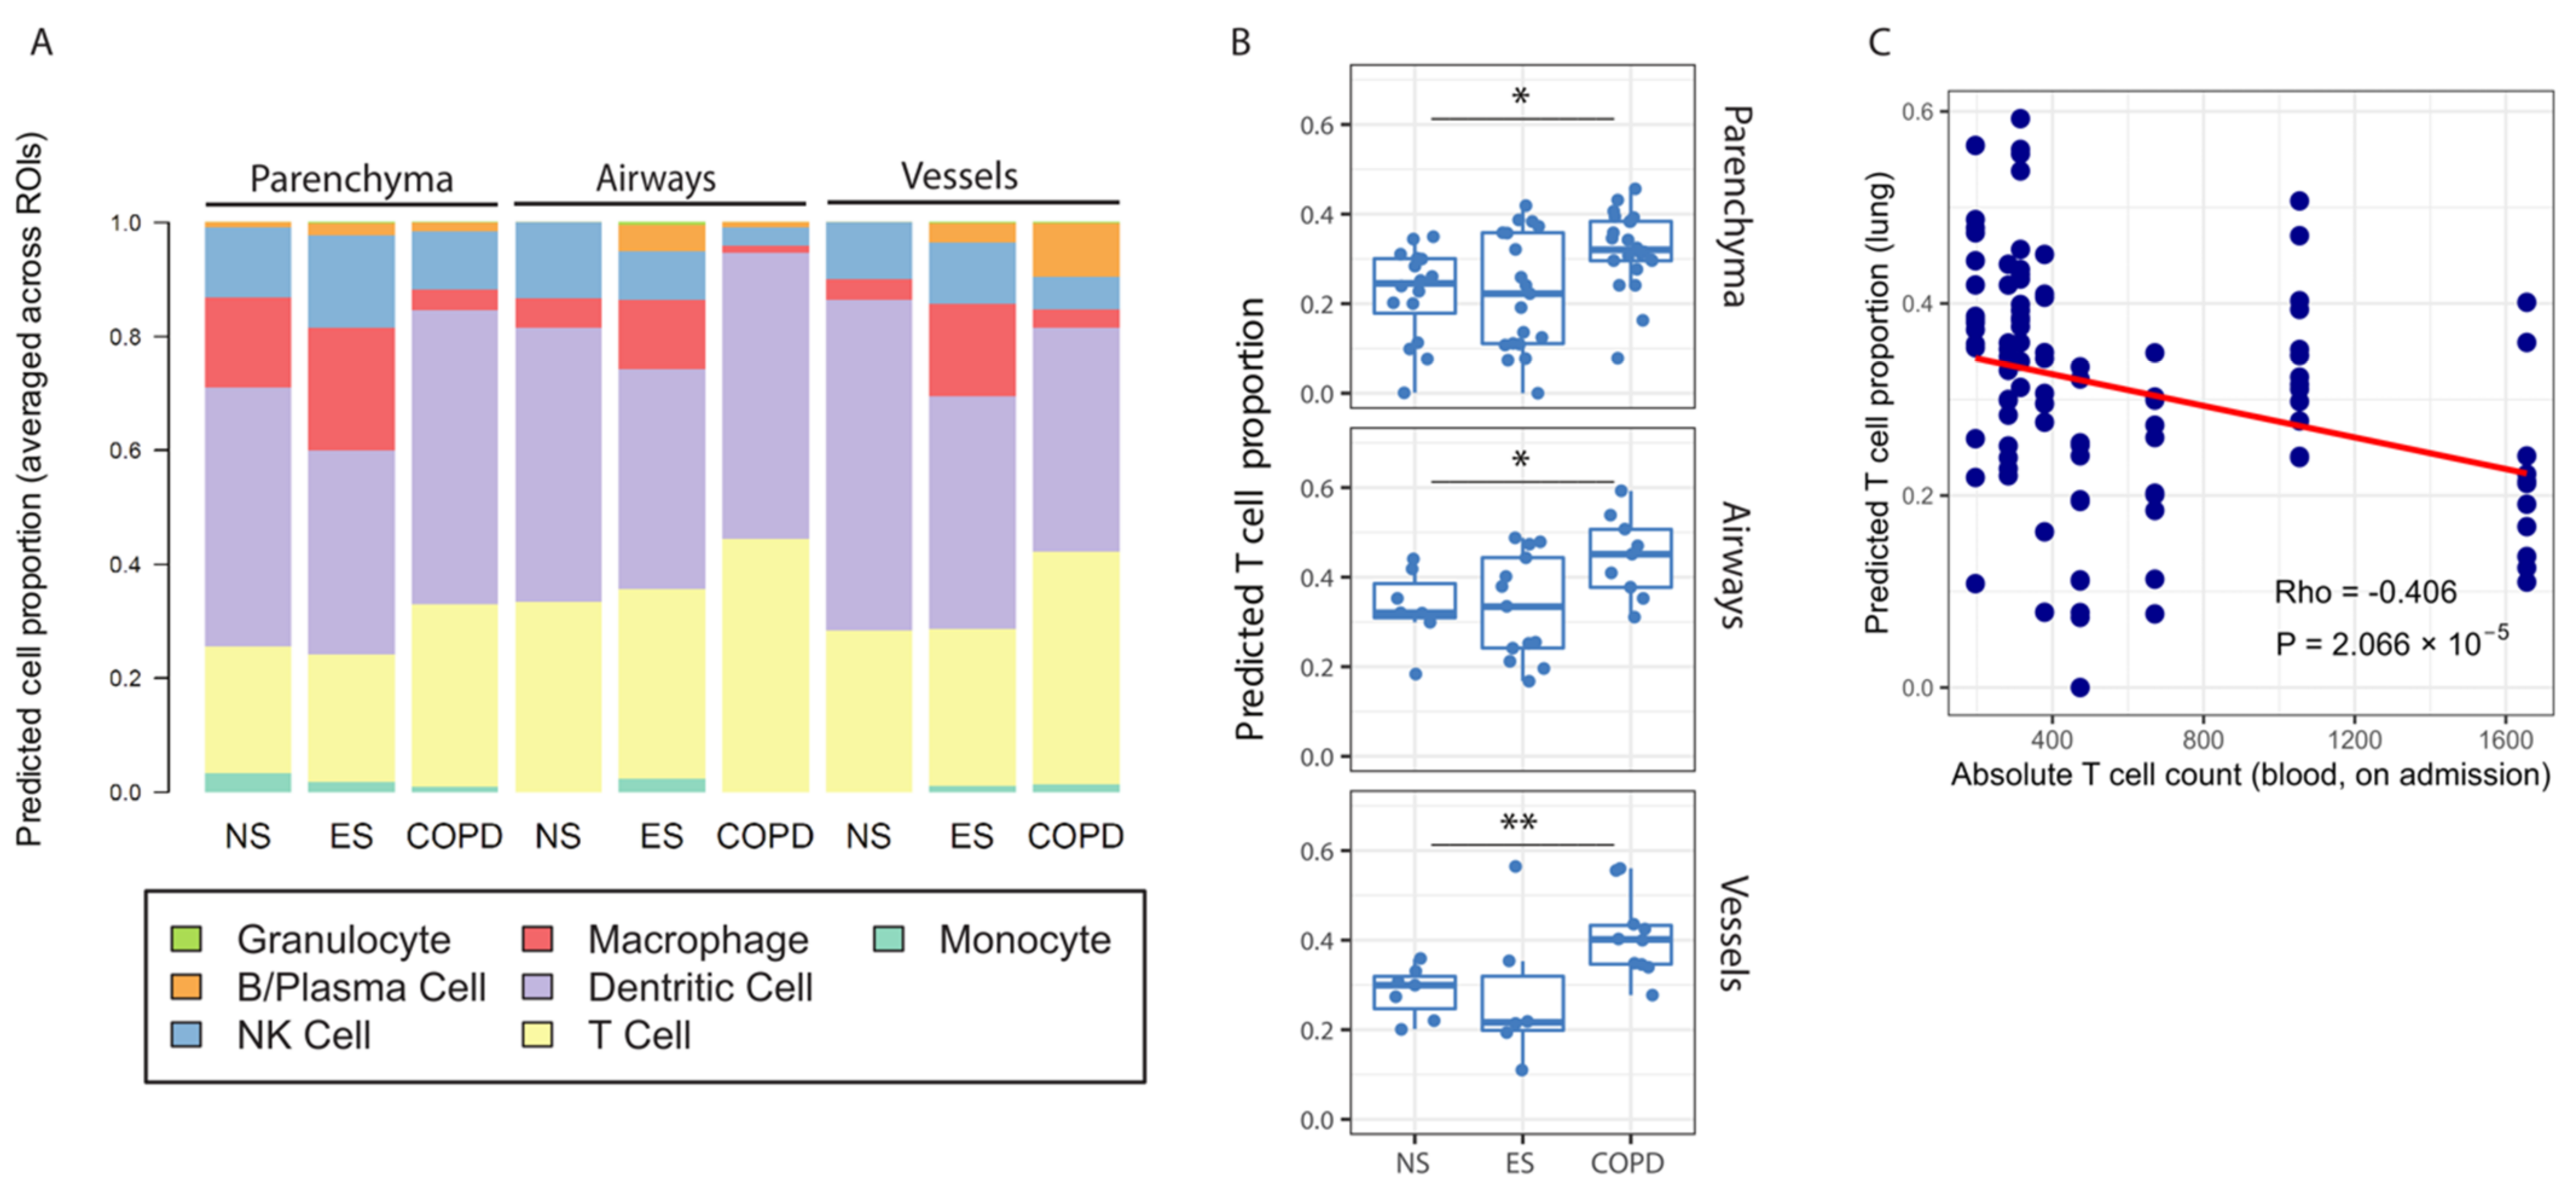
3.4. Identification of Memory T Lymphocytes in Response to COVID-19 in COPD Patients
4. Discussion
5. Conclusions
Supplementary Materials
Author Contributions
Funding
Institutional Review Board Statement
Informed Consent Statement
Data Availability Statement
Conflicts of Interest
References
- COVID-19. Corona Virus Pandemic. Available online: https://www.worldometers.info/coronavirus/ (accessed on 1 January 2022).
- Ackermann, M.; Verleden, S.E.; Kuehnel, M.; Haverich, A.; Welte, T.; Laenger, F.; Vanstapel, A.; Werlein, C.; Stark, H.; Tzankov, A.; et al. Pulmonary vascular endothelialitis, thrombosis, and angiogenesis in COVID-19. N. Engl. J. Med. 2020, 383, 120–128. [Google Scholar] [CrossRef] [PubMed]
- Zhou, F.; Yu, T.; Du, R.; Fan, G.; Liu, Y.; Liu, Z.; Xiang, J.; Wang, Y.; Song, B.; Gu, X.; et al. Clinical course and risk factors for mortality of adult inpatients with COVID-19 in Wuhan, China: A retrospective cohort study. Lancet 2020, 395, 1054–1062. [Google Scholar] [CrossRef]
- Attaway, A.A.; Zein, J.; Hatipoglu, U.S. SARS-CoV-2 infection in the COPD population is associated with increased healthcare utilization: An analysis of Cleveland clinic’s COVID-19 registry. E Clin. Med. 2020, 26, 100515. [Google Scholar] [CrossRef]
- Polverino, F.; Celli, B. The challenge of controlling the COPD epidemic: Unmet needs. Am. J. Med. 2018, 131, 1–6. [Google Scholar] [CrossRef]
- Sullivan, J.L.; Bagevalu, B.; Glass, C.; Sholl, L.; Kraft, M.; Martinez, F.D.; Bastarrika, G.; de Torres, J.P.; Estepar, R.S.J.; Guerra, S.; et al. B cell adaptive immune profile in emphysema-predominant COPD. Am. J. Respir. Crit. Care Med. 2019, 200, 1434–1439. [Google Scholar] [CrossRef] [PubMed]
- Barcelo, B.; Pons, J.; Ferrer, J.M.; Sauleda, J.; Fuster, A.; Agusti, A.G. Phenotypic characterisation of T-lymphocytes in COPD: Abnormal CD4+ CD25+ regulatory T-lymphocyte response to tobacco smoking. Eur. Respir. J. 2008, 31, 555–562. [Google Scholar] [CrossRef] [PubMed] [Green Version]
- Pons, J.; Sauleda, J.; Ferrer, J.M.; Barcelo, B.; Fuster, A.; Regueiro, V.; Julia, M.R.; Agusti, A.G.N. Blunted gamma delta T-lymphocyte response in chronic obstructive pulmonary disease. Eur. Respir. J. 2005, 25, 441–446. [Google Scholar] [CrossRef] [PubMed] [Green Version]
- Bacher, P.; Rosati, E.; Esser, D.; Martini, G.R.; Saggau, C.; Schiminsky, E.; Dargvainiene, J.; Schroder, I.; Wieters, I.; Khodamoradi, Y.; et al. Low-avidity CD4(+) T cell responses to SARS-CoV-2 in unexposed individuals and humans with severe COVID-19. Immunity 2020, 53, 1258–1271. [Google Scholar] [CrossRef] [PubMed]
- Grifoni, A.; Weiskopf, D.; Ramirez, S.I.; Mateus, J.; Dan, J.M.; Moderbacher, C.R.; Rawlings, S.A.; Sutherland, A.; Premkumar, L.; Jadi, R.S.; et al. Targets of T cell responses to SARS-CoV-2 coronavirus in humans with COVID-19 disease and unexposed individuals. Cell 2020, 181, 1489–1501. [Google Scholar] [CrossRef] [PubMed]
- Blanco-Melo, D.; Nilsson-Payant, B.E.; Liu, W.C.; Uhl, S.; Hoagland, D.; Moller, R.; Jordan, T.X.; Oishi, K.; Panis, M.; Sachs, D.; et al. Imbalanced host response to SARS-CoV-2 drives development of COVID-19. Cell 2020, 181, 1036–1045. [Google Scholar] [CrossRef]
- Mirza, S.; Clay, R.D.; Koslow, M.; Scanlon, P.D. COPD Guidelines: A Review of the 2018 GOLD Report. Mayo Clin. Proc. 2018, 93, 1488–1502. [Google Scholar] [CrossRef] [Green Version]
- Rendeiro, A.F.; Ravichandran, H.; Bram, Y.; Chandar, V.; Kim, J.; Meydan, C.; Park, J.; Foox, J.; Hether, T.; Warren, S.; et al. The spatial landscape of lung pathology during COVID-19 progression. Nature 2021, 593, 564–569. [Google Scholar] [CrossRef]
- Polverino, F.; Wu, T.D.; Rojas-Quintero, J.; Wang, X.; Mayo, J.; Tomchaney, M.; Tram, J.; Packard, S.; Zhang, D.; Cleveland, K.H.; et al. Metformin: Experimental and Clinical Evidence for a Potential Role in Emphysema Treatment. Am. J. Respir. Crit. Care Med. 2021, 204, 651–666. [Google Scholar] [CrossRef]
- Polverino, F.; Cosio, B.G.; Pons, J.; Laucho-Contreras, M.; Tejera, P.; Iglesias, A.; Rios, A.; Jahn, A.; Sauleda, J.; Divo, M.; et al. B Cell–Activating Factor. An Orchestrator of Lymphoid Follicles in Severe Chronic Obstructive Pulmonary Disease. Am. J. Respir. Crit. Care Med. 2015, 192, 695–705. [Google Scholar] [CrossRef] [Green Version]
- Ufuk, F.; Savas, R. Chest CT features of the novel coronavirus disease (COVID-19). Turk. J. Med. Sci. 2020, 50, 664–678. [Google Scholar] [CrossRef]
- Glowacka, I.; Bertram, S.; Muller, M.A.; Allen, P.; Soilleux, E.; Pfefferle, S.; Steffen, I.; Tsegaye, T.S.; He, Y.; Gnirss, K.; et al. Evidence that TMPRSS2 activates the severe acute respiratory syndrome coronavirus spike protein for membrane fusion and reduces viral control by the humoral immune response. J. Virol. 2011, 85, 4122–4134. [Google Scholar] [CrossRef] [Green Version]
- Velazquez-Salinas, L.; Zarate, S.; Eberl, S.; Gladue, D.P.; Novella, I.; Borca, M.V. Positive selection of ORF1ab, ORF3a, and ORF8 genes drives the early evolutionary trends of SARS-CoV-2 during the 2020 COVID-19 pandemic. Front. Microbiol. 2020, 11, 550674. [Google Scholar] [CrossRef]
- Chinen, T.; Kannan, A.K.; Levine, A.G.; Fan, X.; Klein, U.; Zheng, Y.; Gasteiger, G.; Feng, Y.; Fontenot, J.D.; Rudensky, A.Y. An essential role for the IL-2 receptor in Treg cell function. Nat. Immunol. 2016, 17, 1322–1333. [Google Scholar] [CrossRef]
- Tippalagama, R.; Singhania, A.; Dubelko, P.; Lindestam, C.S.; Crinklaw, A.; Pomaznoy, M.; Seumois, G.; de Silva, A.D.; Premawansa, S.; Vidanagama, D.; et al. HLA-DR marks recently divided antigen-specific effector CD4 T cells in active tuberculosis patients. J. Immunol. 2021, 207, 523–533. [Google Scholar] [CrossRef]
- Honda, K.; Yanai, H.; Negishi, H.; Asagiri, M.; Sato, M.; Mizutani, T.; Shimada, N.; Ohba, Y.; Takaoka, A.; Yoshida, N.; et al. IRF-7 is the master regulator of type-I interferon-dependent immune responses. Nature 2005, 434, 772–777. [Google Scholar] [CrossRef]
- Honda, K.; Taniguchi, T. IRFs: Master regulators of signalling by Toll-like receptors and cytosolic pattern-recognition receptors. Nat. Rev. Immunol. 2006, 6, 644–658. [Google Scholar] [CrossRef]
- Omilusik, K.D.; Nadjsombati, M.S.; Shaw, L.A.; Yu, B.; Milner, J.J.; Goldrath, A.W. Sustained Id2 regulation of E proteins is required for terminal differentiation of effector CD8(+) T cells. J. Exp. Med. 2018, 215, 773–783. [Google Scholar] [CrossRef]
- Saheb Sharif-Askari, N.; Saheb Sharif-Askari, F.; Mdkhana, B.; Alsayed, H.A.H.; Alsafar, H.; Faoor Alrais, Z.; Hamid, Q.; Halwani, R. Upregulation of oxidative stress gene markers during SARS-COV-2 viral infection. Free Radic Biol. Med. 2021, 172, 688–698. [Google Scholar] [CrossRef]
- Saheb Sharif-Askari, F.; Saheb Sharif-Askari, N.; Goel, S.; Hafezi, S.; Assiri, R.; Al-Muhsen, S.; Hamid, Q.; Halwani, R. SARS-CoV-2 attenuates corticosteroid sensitivity by suppressing DUSP1 expression and activating p38 MAPK pathway. Eur. J. Pharmacol. 2021, 908, 174374. [Google Scholar] [CrossRef] [PubMed]
- Lebbink, R.J.; van den Berg, M.C.; de Ruiter, T.; Raynal, N.; van Roon, J.A.G.; Lenting, P.J.; Jin, B.; Meyaard, L. The soluble leukocyte-associated Ig-like receptor (LAIR)-2 antagonizes the collagen/LAIR-1 inhibitory immune interaction. J. Immunol. 2008, 180, 1662–1669. [Google Scholar] [CrossRef] [PubMed] [Green Version]
- Saetta, M.; Di, S.A.; Turato, G.; Facchini, F.M.; Corbino, L.; Mapp, C.E.; Maestrelli, P.; Ciaccia, A.; Fabbri, L.M. CD8+ T-lymphocytes in peripheral airways of smokers with chronic obstructive pulmonary disease. Am. J. Respir. Crit. Care Med. 1998, 157 Pt 1, 822–826. [Google Scholar] [CrossRef] [PubMed]
- Koo, H.K.; Vasilescu, D.M.; Booth, S.; Hsieh, A.; Katsamenis, O.; Fishbane, N.; Elliott, W.M.; Kirby, M.; Lackie, P.; Sinclair, I.; et al. Small airways disease in mild and moderate chronic obstructive pulmonary disease: A cross-sectional study. Lancet Respir. Med. 2018, 6, 591–602. [Google Scholar] [CrossRef] [Green Version]
- Saris, A.; Reijnders, T.D.Y.; Nossent, E.J.; Schuurman, A.R.; Verjoeff, J.; van Asten, S.; Bontkes, H.; Blok, S.; Duitman, J.; Bogaard, H.-J.; et al. Distinct cellular immune profiles in the airways and blood of critically ill patients with COVID-19. Thorax 2021, 76, 1010–1019. [Google Scholar] [CrossRef] [PubMed]
- Grau-Exposito, J.; Sanchez-Gaona, N.; Massana, N.; Suppi, M.; Astorga-Gamaza, A.; Perea, D.; Rosado, J.; Falco, A.; Kirkegaard, C.; Torrella, A.; et al. Peripheral and lung resident memory T cell responses against SARS-CoV-2. Nat. Commun. 2021, 12, 3010. [Google Scholar] [CrossRef]
- Le Bert, N.; Tan, A.T.; Kunasegaran, K.; Tham, C.Y.L.; Hafezi, M.; Chia, A.; Cheng, M.; Lin, M.; Tan, N.; Linster, M.; et al. SARS-CoV-2-specific T cell immunity in cases of COVID-19 and SARS, and uninfected controls. Nature 2020, 584, 457–462. [Google Scholar] [CrossRef]
- Tan, D.B.; Fernandez, S.; Price, P.; French, M.A.; Thompson, P.J.; Moodley, Y.P. Impaired CTLA-4 responses in COPD are associated with systemic inflammation. Cell. Mol. Immunol. 2014, 11, 606–608. [Google Scholar] [CrossRef] [PubMed] [Green Version]
- Tan, D.B.; Fernandez, S.; Price, P.; French, M.A.; Thompson, P.J.; Moodley, Y.P. Impaired function of regulatory T-cells in patients with chronic obstructive pulmonary disease (COPD). Immunobiology 2014, 219, 975–979. [Google Scholar] [CrossRef] [PubMed]
- Moss, P. The T cell immune response against SARS-CoV-2. Nat. Immunol. 2022, 23, 186–193. [Google Scholar] [CrossRef]
- Hou, Y.J.; Okuda, K.; Edwards, C.E.; Martinez, D.R.; Asakura, T.; Dinnon, K.H.; Kato, T.; Lee, R.E.; Yount, B.L.; Mascenik, T.M.; et al. SARS-CoV-2 Reverse genetics reveals a variable infection gradient in the respiratory tract. Cell 2020, 182, 429–446. [Google Scholar] [CrossRef] [PubMed]
- Bosse, Y.; Postma, D.S.; Sin, D.D.; Lamontagne, M.; Couture, C.; Gaudreault, N.; Joubert, P.; Wong, V.; Elliott, M.; van den Berge, M.; et al. Molecular signature of smoking in human lung tissues. Cancer Res. 2012, 72, 3753–3763. [Google Scholar] [CrossRef] [Green Version]


| S | ES | COPD | p | |
|---|---|---|---|---|
| Total Participants (n) | 7 | 4 | 7 | |
| Age | 76.00 [62,83] | 73.00 [69,76] | 80.00 [77,88] | 0.222 |
| Gender (female) | 5 (71.4) | 3 (75.0) | 1 (14.3) | 0.085 |
| Smoking history (former) | 0 (0) | 4 (100.0) | 7 (100.0) | 0.001 |
| Comorbidities | ||||
| Hypertension | 5 (71.4) | 3 (75.0) | 7 (100.0) | 0.4 |
| Other cardiovascular diseases | 3 (42.9) | 3 (75.0) | 4 (57.1) | 0.832 |
| Diabetes mellitus | 1 (14.3) | 1 (25.0) | 4 (57.1) | 0.316 |
| Chronic kidney disease | 1 (14.3) | 2 (50.0) | 2 (28.6) | 0.565 |
| Medications | ||||
| ICS | 0 (0.0) | 0 (0.0) | 2 (28.6) | 0.314 |
| LABA/SABA/LAMA | 0 | 0 | 7 (100%) | <0.001 |
| Oral corticosteroids | 0 (0.0) | 0 (0.0) | 1 (14.3) | 1 |
| ACEi/ARB | 3 (43%) | 0 | 3 (43%) | 0.123 |
| COVID-19 Treatments | ||||
| Hydroxyloroquine | 7 (100.0) | 4 (100.0) | 7 (100.0) | NA |
| Tocilizumab | 4 (57.1) | 0 (0.0) | 1 (14.3) | 0.188 |
| Betaferon | 0 (0.0) | 0 (0.0) | 1 (14.3) | 1 |
| Corticosteroids | 6 (85.7) | 3 (75.0) | 6 (85.7) | 1 |
| Heparin | 7 (100.0) | 4 (100.0) | 7 (100.0) | NA |
| Statins | 6 (85.7) | 2 (50.0) | 6 (85.7) | 0.472 |
| d-OTI | 0.00 [0.00, 0.00] | 0.00 [0.00, 1.50] | 8.00 [4.50, 12.50] | 0.031 |
| Blood Gas Data | ||||
| SpO2 | 88.00 [87.00, 90.50] | 89.50 [87.75, 91.75] | 93.00 [88.50, 95.00] | 0.539 |
| paO2 | 56.30 [53.90, 67.50] | 60.25 [56.57, 63.92] | 66.60 [64.10, 67.50] | 0.820 |
| paCO2 | 38.30 [34.25, 39.45] | 31.10 [29.20, 33.00] | 37.10 [32.20, 38.60] | 0.406 |
Publisher’s Note: MDPI stays neutral with regard to jurisdictional claims in published maps and institutional affiliations. |
© 2022 by the authors. Licensee MDPI, Basel, Switzerland. This article is an open access article distributed under the terms and conditions of the Creative Commons Attribution (CC BY) license (https://creativecommons.org/licenses/by/4.0/).
Share and Cite
Yang, C.X.; Tomchaney, M.; Landecho, M.F.; Zamacona, B.R.; Marin Oto, M.; Zulueta, J.; Malo, J.; Knoper, S.; Contoli, M.; Papi, A.; et al. Lung Spatial Profiling Reveals a T Cell Signature in COPD Patients with Fatal SARS-CoV-2 Infection. Cells 2022, 11, 1864. https://doi.org/10.3390/cells11121864
Yang CX, Tomchaney M, Landecho MF, Zamacona BR, Marin Oto M, Zulueta J, Malo J, Knoper S, Contoli M, Papi A, et al. Lung Spatial Profiling Reveals a T Cell Signature in COPD Patients with Fatal SARS-CoV-2 Infection. Cells. 2022; 11(12):1864. https://doi.org/10.3390/cells11121864
Chicago/Turabian StyleYang, Chen Xi, Michael Tomchaney, Manuel F. Landecho, Borja R. Zamacona, Marta Marin Oto, Javier Zulueta, Joshua Malo, Steve Knoper, Marco Contoli, Alberto Papi, and et al. 2022. "Lung Spatial Profiling Reveals a T Cell Signature in COPD Patients with Fatal SARS-CoV-2 Infection" Cells 11, no. 12: 1864. https://doi.org/10.3390/cells11121864